ministry of education state department of basic … · will require approval from dpcad; (v) seek...
TRANSCRIPT

1
MINISTRY OF EDUCATION
STATE DEPARTMENT OF BASIC EDUCATION
KENYA SECONDARY EDUCATION QUALITY IMPROVEMENT PROJECT (SEQIP)
TITLE: CONSULTANCY FOR INDEPENDENT VERIFICATION OF
RESULTS IN SAMPLED TARGET SCHOOLS-ALLOCATED
TEACHERS, SCHOOL BASED TEACHER SUPPORT
SERVICES, PROVISION OF TEXTBOOKS, AND
BENEFICIARIES OF THE SCHOLARSHIP AND MENTORSHIP
PROGRAM.
CONTRACT NO: MOE/SEQIP/NCB/01/2017-18
PROCUREMENT
METHOD:
QUALITY AND COST BASED SELECTION (QCBS)
TERMS OF REFERENCE
1. BACKGROUND.
1.1 The Government of Kenya (GoK) has partnered with the World Bank to improve student
learning in secondary education and enhance transition from primary to secondary education,
in targeted areas. This is in line with the aspirations of Kenya’s Vision 2030. The Vision’s
Social Pillar singles out the education and training system as a vehicle to drive Kenya's
efforts towards becoming an upper-middle income economy.
1.2 Kenya has made good progress in primary education completion and transition to secondary
education compared to many other Sub-Saharan African countries. Participation in Early
Childhood Education (ECD) increased from a Net Enrollment Rate (NER) of 62.2 percent in
2012 to 74.9 percent in 2016, the primary school NER was 89 percent in 2016, and the
transition rate from primary to secondary was 81 percent-a remarkable improvement from 55
percent in 2009. These achievements, among others, have been facilitated by the introduction
of relevant policy frameworks such the Universal Free Primary Education (FPE) and Free
Day Secondary Education (FDSE).

2
1.3 In spite of these achievements, there is significant variation in school participation across
counties, especially at the secondary level. Secondary school NER in 2014 was below 15
percent for the bottom 5 counties, while it was above 80 percent for the top 5 counties, out of
47 counties. Importantly, gender disparity in school participation is concentrated in the most
educationally disadvantaged counties.
1.4 Kenya has made investments in improving quality and learning outcomes at the primary
level; nevertheless, achievement on basic skills appears low in relation to countries in other
regions. For example, 66 percent of Kenyan urban adults performed at level 1 or below out
of a scale of 5 levels on the Skills Toward Employability and Productivity (STEP) reading
proficiency test in 2015, indicating very rudimentary skills which were lower than their
peers’ in 6 of the other 7 low- and middle-income countries surveyed in South East Asia,
Eastern Europe and Latin America.
1.5 At the secondary level, national assessment data indicate deficiencies and inequities in
learning outcomes. For example, the 2014 national Monitoring Learner Achievement (MLA)
assessment at Form 2 found that, in mathematics, almost 90 percent of students did not have
minimum competency in algebra and geometry, and about 30 percent did not have minimum
competency in measurement, numbers and statistics. The Form 2 MLA also revealed
remarkable variation in student achievement between genders, between urban and rural areas,
and across counties. For example, in algebra, geometry and trigonometry, the share of
students with minimum competency in urban areas was twice that in rural areas. Both supply
and demand-side factors contribute to inequalities in completion of primary education, and
transition to and completion of secondary education, as well as in student learning outcomes.
1.6 The Kenya Secondary Education Quality Improvement Project (SEQIP) seeks to address the
supply and demand-side factors particularly in the most educationally and economically
disadvantaged areas, as well as the poorest and most vulnerable children. The SEQIP,
described in detail in the World Bank's Project Appraisal Document (PAD), will employ a
hybrid structure as an initial step towards more Results Based Financing (RBF) of the
education portfolio in Kenya. This RBF provides an opportunity for a strengthened dialogue
through closer monitoring of Government performance against selected Disbursement
Linked Indicators (DLIs). Under SEQIP, the RBF with selected DLIs has been designed for
the following four sub-components:
a) Component 1: Improving quality of teaching in targeted areas:
Sub-component 1.1: Reducing teacher shortage
Sub-component 1.2: Enhancing teacher professional development
Sub-component1.3: Provision of textbooks

3
b) Component 2: Improving retention in upper primary school and transition
to secondary school in targeted areas:
Sub-component2.2: Improving retention in upper primary school
and transition to secondary school of poor and vulnerable learners
1.7 Specific DLIs have been developed to monitor results for each of the four subcomponents
above (see annex 1). Disbursements will follow verified achievement of annual targets
based on the verification protocols (annex 2). Verification of data submitted by the
respective project implementation agencies is therefore an essential undertaking in this
project as disbursements linked to results necessitates quality data. In addition to
facilitating payments, verification improves transparency, credibility and good
governance for RBF approaches.
2. OBJECTIVE OF THE ASSIGNMENT
i) The primary task of this exercise will be to carry out transparent and impartial
verification of the DLIs as per annexes 1 and 2 that are sourced from the PAD. It will be
executed free from the influence of the implementers. This is a requirement for reliable
establishment of progress made on disbursement linked indicators (as per annexes 1 and
2). Some of the key activities in the process will include: (i) designing a sample based
assessment methodology for verification of the progress made on Disbursement Linked
Indicators (DLIs) by the implementers; and (ii) applying the methodology to verify the
results reported by the implementers for each of the DLIs. The verification will be carried
out in a transparent and independent manner to provide robust evidence for decision-
makers to authorize the disbursements that are linked to the realization of indicators and
achievement of results.
3. DURATION OF THE ASSIGNMENT AND WORK PLAN
The assignment will be undertaken at least once a year or as will be needed over a six-
year period from 2018 to 2023. The Independent Third Party Verification Agency1
(ITPVA) will propose a realistic time-bound work plan with a clear flow of activities and
time from commencement to completion of the assignment.
4. SELECTION OF CONSULTING FIRM
One consulting firm will be contracted to undertake an independent verification of
achievement of each of the DLIs in a representative sample drawn from targeted areas. The
selection will be done through competitive evaluation of Expressions of Interest (EoI)
submitted by interested firms and proposals submitted by shortlisted firms. The winning firm
1 Agency refers to the body contracted to undertake the verification of achievement of the DLIs.

4
will be engaged as the ITPVA through a signed contract with the MoE. The first phase of
verification activity is likely to commence in June 2018 or shortly thereafter.
5. SCOPE OF WORK AND DELIVERABLES
The ITPVA is required to independently analyse and verify on a sample basis, the SEQIP DLIs,
each of which has a specific achievement level and timeline (see annexes 1 and 2). A list of the
project target sub-counties is included in Annex 3.
4.1 Task 1: Independent verification of results (DLIs).
The ITPVA will collate relevant data and reports of results related to DLIs from relevant
implementers, as per the indicator definition and data sources detailed in annexes 1and 22of this
Terms of Reference (ToRs). The PAD, together with these ToRs will be the primary point of
reference for the tasks of the ITPVA. The ITPVA is expected to:
a) Propose a verification methodology:
Detail sampling procedures and generate a representative sample in
relation to the DLIs and verification protocols outlined in annexes
1 and 2. The sampling procedure should highlight the minimum
sample or actual percentage that is expected to be verified for each
DLR. In addition, the procedure should include spot check
verification and adequate representation of the targeted sub-
counties (Annex3).
Develop relevant data verification and assessment tools
Develop the independent verifiers’ verification protocols3 at the
implementers and target sub-county levels
b) Prepare a detailed time-bound costed work plan.
The work plan shall provide details of how all the various tasks, sub-tasks, and
activities will be undertaken including specific timelines for each task; logistics
and manpower resources for the entire period of the assignment.
The work plan should include a chart of progress against each DLR that is
expected to be achieved in any particular year.
The ITPVA is expected to operate within the approved plan and budget and will
not deviate without prior written approval from the MoE, Directorate of Project
Coordination and Delivery (DPCAD).
2The independent verifier will have to adhere to the content of Annexes 1 and 2 which are sourced from the approved Project Appraisal Document (PAD). 3 A protocol refers to a written set of procedures on how verification would be conducted at the sub-county level.

5
The proposed work plan should be consistent with the proposed methodology, and
should reflect an understanding of the scope of work.
c) Implement the verification using the agreed upon methodology and work plan. The
methodology and work plan will be the basis for execution, supervision and progress
monitoring. They will therefore not be modified or revised by the ITPVA without prior
approval by the MoE.
Follow the verification protocol provided in the PAD.
For each of the DLRs, the ITPVA will be required to independently verify the
results reported by the implementer. This will among others involve checking
correctness, completeness and consistency of data reported by implementers
through actual site visits to sample target schools or institutions.
d) In case of non-achievement of targets, the agency will be required to analyze the
functioning of the implementers, and identify the major barriers and challenges which
impede progress towards the desired DLRs. The implementer4 is expected to follow up
on the findings and institute corrective actions and or measures to enhance the
achievement of the DLIs and DLRs.
4.2 Task II: Reporting
The Independent verifier is expected to:
i. To produce an inception report detailing the understanding of the ToRs; approach to desk
and field/site verification, sampling procedures and proposed sample.
ii. To produce a report outlining key findings from the independent verification exercise and
recommendations. The report should present findings by Disbursement Linked
Indicator and the respective Disbursement linked Results (DLRs) described in
Annexes 1 and 2. It should describe any discrepancies between reported and verified
data for each DLI and related DLRs, and confirm to whether agreed targets for DLRs
have been met or not.
iii. Present the report to the sub-component implementers including Ministry of Education
(MoE) and the Teachers Service Commission (TSC)5. The TSC will disseminate the
results to the Centre for Mathematics, Science and Technology Education in Africa
(CEMASTEA) and the School Based Teacher Support System (SBTSS)
Implementing Institution.
4 The implementer could be MoE, TSC and CEMASTEA who are all involved in implementation of the DLIs. 5 The presentation should be as guided by the timelines agreed in the contract. The report that is presented will not be subject to inputs or changes by the implementers.

6
4.3 General responsibilities of the ITPVA
(i) Maintain regular communication with the DPCAD through the project Coordinator
regarding all aspects of the verification procedure, including data collection, reporting
framework etc.;
(ii) Respond in a timely manner to any queries from the DPCAD on the ITPVA’s
activities/behavior of its personnel during implementation of the agreed verification work
plan;
(iii) Provide DPCAD and TSC with copies of the ITPVA’s verification procedure, work flow
and data collection methodology for review;
(iv) Any changes in the lead/key personnel for this assignment along with clear justification,
will require approval from DPCAD;
(v) Seek guidance and or concurrence from DPCAD before troubleshooting any
sensitive/complex problems that may arise during the verification process;
(vi) Permit the DPCAD or its designated entities or individuals to monitor the verification
processes. Monitoring may take the form of unannounced visits to firm offices and field
area.
4.4 Key Deliverables
a) Inception report to be submitted for review by the Ministry of Education. The inception
report should include as a minimum: sampling procedures; relevant data; verification and
assessment tools; proposed ITPVA’s verification protocols; and the proposed detailed
costed time bound implementation schedule for verification of the DLRs in the life of the
project.
b) Periodic independent verification reports with clear outline of:
Methodology and instruments used for verification exercise, findings per DLI and
relevant DLRs, and recommendations.
Data entry template and coding scheme
An annexe of the detailed activity plan for conducting the verification exercise
(based on the agreed upon overall work plan)
An annexe of the scanned copies of all completed questionnaires (in a separate
file)
c) Presentation of the verification report with a summary in the form of key findings during
the National Project’s Steering Committee (PSC) meeting.
d) Present the independent verification report to the MoE.

7
6. KEY TECHNICAL REQUIREMENTS
5.1 The Consulting Agency or firm must have the experience of conducting similar assignments
or experience in conducting national level educational surveys. A consortium of firms may
partner and bid for the task. This may for example entail an international/regional firm
partnering with an organization that has grassroots level network in the country. The ITPVA
will be expected to put together a team with the necessary skills to undertake the assignment.
Experience in implementing Results Based Financing and World Bank Projects will be an
added advantage.
5.2 The minimum mandatory criteria for short listing of the agencies(verifier) is:
a) Be a Tax Compliant registered agency/firm or partner with a local firm operating
under Government of Kenya regulations.
b) Have a minimum of five years of experience in conducting similar assignments or
experience in conducting national level educational surveys at sub-counties or school
levels.
c) Have minimum of five years’ professional experience in analyzing data, documenting
findings, and creating and presenting reports.
d) Provide evidence of a sound track record of successful implementation of similar
assignments either alone or partnering with relevant national or international
organisations.
e) Evidence of availability of appropriate skills to carry out the verification exercise.
The required skills may include the following:
Team Leader who must be a holder of PhD in Education, Economics or Social
Sciences with at least 7 years’ experience in educational surveys at the school
level.
Education specialists a holder of Masters in Education with 5years
Experience.
Social development specialists with a Masters in Social Sciences with 5years
experience in scholarship administration/advocacy /mentorship programs.
A Statistician/Economist with a minimum of a bachelor’s degree in the
relevant field with 3years experience.
Monitoring and Evaluation expert with 5years experience.
A logistics coordinator to train and deploy enumerators to the field.
5.3 Once agreed, the ITPVA may make changes to the team if clearly such change is geared to
enhancing effective and efficient execution of the task. However, replacement of lead
team/key staff member(s) will only be done with approval of the MoE, Directorate of Project

8
Coordination and Delivery (DPCAD). The replacement of a Key Expert shall have equal or
better qualifications and experience than those of the originally proposed Key Expert.
5.4 The attention of interested firms is drawn to paragraph 1.9 of the World Bank’s Guidelines:
Selection and Employment of Consultants under the International Bank for Reconstruction
and Development (IBRD) Loans and the International Development Association (IDA)
Credits & Grants by World Bank Borrowers dated January 2011 and revised July 2014
(“Consultant Guidelines”), setting forth the World Bank’s Policy on conflict of interest. A
Consulting firm will be selected based on merit of the proposal submitted in accordance with
the Quality and Cost Based Selection (QCBS) method set out in the Consultant Guidelines.
5.5 Children's Rights, Safety and Privacy
This assignment may in some circumstances and contexts involve interaction of the ITPVA’s
staff with learners in schools. In every respect, the ITPVA’s staff will be expected to observe
high standards of integrity in moral conduct, etiquette, and upholding of the expectations of
the socio-cultural values of the community where the school exists. Particular attention
should be paid to avoid actions or presentations that compromise children’s rights and
safety/security as provided in policy and legal instruments.
5.6 Rejection of Methodology and data collection instruments
The MoE and World Bank reserves the right to reject the proposed methodology and tools or re-
negotiate with the ITPVA about modifications to the proposed methodology or set of
instruments.
5.7 Contract termination
A performance review of the ITPVA will be conducted after each year and as a result of this
review, agreed upon remedial actions will have to be executed within specific timelines. If this is
not complied with, contract termination will be considered.
5.8 Copyright and confidentiality
All verification material and data from the assignment will be sole property of the Ministry of
Education. No information on the assignment and information collected for the verification will
be shared with anyone without the written permission of MoE. The ITPVA shall carry out the
above assignment in accordance with the highest standard of ethical competence, integrity and
professionalism and having due regard to the nature and purpose of the assignment. The ITPVA
will at all-time and for all purposes, regard as strictly confidential all knowledge and information
not within public domain which may be acquired in the course of carrying out this assignment
and shall not be directly or indirectly disclosed to any person whatsoever, except with the written
permission of MoE.

9
5.9 Other terms on replacement of Experts or Sub-Consultants
a) If the Client finds that any of the Experts or Sub-consultant has committed serious
misconduct or has been charged with having committed a criminal action, or shall the
Client determine that Consultant’s Expert or Sub-consultant have engaged in corrupt,
fraudulent, collusive, coercive or obstructive practice while performing the Services, the
ITPVA shall, at the Client’s written request, provide a replacement.
b) In the event that any of the Key Experts, Non-Key Experts or Sub-consultants is found by
the Client to be incompetent or incapable in discharging assigned duties, the Client,
specifying the grounds there of, may request the ITPVA to provide a replacement.
c) Any replacement of the removed Experts or Sub-consultants shall possess equal or better
qualifications and experience and shall be acceptable to the Client.
d) Except as the Client may otherwise agree, (i) the ITPVA shall bear all additional travel
and other costs arising out of or incidental to any removal and/or replacement, and (ii) the
remuneration to be paid for any of the Experts provided as a replacement shall not exceed
the remuneration which would have been payable to the Experts replaced or removed.
7. PROPOSED PERSONNEL COST TABLE
In addition to technical expertise, the ITPVA shall be responsible for arranging and providing
any additional resources required to carry out the work, including but not limited to the
following:
a) Ground transportation
b) Communication
c) Reports preparation
d) Office Space and Equipment
e) Translations/Interpretation in local language (if needed).

10
Table 1: Proposed Cost table
Descriptions Quantity Person
days
Rate
(USD)
Total
(USD)
Personnel
XXXXXXXXXXX Fees
Local travel
XXXXXXXXXXX Fees
Local travel
XXXXXXXXXXX Fees
Local travel
XXXXXXXXXXX Fees
Local travel
XXXXXXXXXXX Fees
Local travel
XXXXXXXXXXX Fees (pilot)
Local travel (pilot)
Fees (main study)
Local travel (main
study)
Other Expenses e.g
Training of Data Collectors
Communication
Other Transportation
Printing of Instruments and reports
Miscellaneous
Total
8. MANAGEMENT AND REPORTING ARRANGEMENTS
7.1 The assignment will be managed by the MoE. At the MoE, this responsibility will fall under
the Directorate of Project Coordination and Delivery (DPCAD) which will include focal points
from the TSC. The specific roles and responsibility for the DPCAD for this assignment, at no
costs, includes:
a. Coordination of implementation activities without interfering with the
independence of the ITPVA. The Director, DPCAD, will be the key focal person
for management and coordination.
b. Access to data. The DPCAD will provide the independent verifier with access to
all relevant information and data to assess progress against the DLIs and

11
respective DLRs. The independent verifier will have access to raw data for DLIs
and DLRs indicated in Annexes 1 and 2.
c. Project documents
The DPCAD will provide the independent verifier with the following documents:
Project Appraisal Document.
Financial Management Manual.
Disbursement letter.
Project Implementation Manual.
d. Detailed sub-components work plans
Avail to the ITPVA detailed sub-components work plans.
Facilitate the verification exercise by issuing
letters/communications to schools and necessary key informants.
Convene in a timely manner, the PSC for discussions of the
verification report.
e. Introductory Letter: The DPCAD will issue to the ITPVA a letter of introduction
to facilitate collection of data from the Field Education Offices.
7.2 In undertaking the verification role, the ITPVA will work independently without undue
interference or influence from any parties whatsoever. The findings and recommendations will
be shared with the implementers in the first instance through the PSC where the implementers
will work together to resolve any issues arising from the report and make final recommendations
for endorsement by the PSC. The responsibility for final clearance of the independent
verification report lies with the PSC.
9. TIMEFRAME
The ITPVA will prepare a detailed time-bound work plan specifying the timelines. Independent
verification of the DLIs and DLRs will be in accordance with the approved schedules which
must be harmonized with the PAD, Annual Work Plans and the Project Implementation Manual.
However, the ITPVA may also be requested to do an interim verification of carryover DLIs as an
exception. Such interim evaluations will be negotiated within the contract terms and conditions.
10. BUDGET.
The budget for the ITPVA is included under project management costs.

12
11. PAYMENT SCHEDULE
The approved costed detailed time-bound annual work schedule of the ITPVA will give the
overall cost of verification each year. A payment schedule, against major milestones, will be
agreed upon in advance of contract commencement.
12. ANNEXES
1. DLI and DLRs table
2. DLRs and DLRs Verification protocols
3. Target Sub-counties
Application
Interested firms should submit their expressions of interest to:
The Principal Secretary (Att: Head of Supply Chain Management [HSCM]),
Ministry of Education,
State Department of Basic Education,
P.O Box 30040-00100
Nairobi, Kenya.
Jogoo House B, Harambee Avenue
Tel: +254-020-3318581
Email: [email protected]

13
Annex 1: Disbursement Linked Indicators

14
DLI Indicative Time Line for DLI Achievement
2018 (Year 1) 2019 (Year 2) 2020 (Year 3) 2021 (Year 4) 2022 (Year 5) 2023 (Year 6)
DLI 1: Reduced
science,
mathematics,
and English
teacher
shortages in
targeted sub-
counties
DLI TARGET
1.1: Detailed and
costed strategic
plan developed
for addressing
teacher shortages
and baseline
established
DLI TARGET
Target
Achievement
Date (DTAD):
FY18
DLI TARGET
1.3: 10% of new
teacher posts, in
addition to
annual pro rata
of teacher posts,
recruited for
schools with high
shortages per the
established
baseline and on
duty
DTAD: FY19
DLI TARGET
1.4: 10% of new
teacher posts, in
addition to
annual pro rata
of teacher posts,
recruited for
schools with
high shortages
per the
established
baseline and on
duty
DTAD: FY20
DLI TARGET
1.5: 10% of
new teacher
posts, in
addition to
annual pro rata
of teacher
posts, recruited
for schools
with high
shortages per
the established
baseline and on
duty
DTAD: FY21
DLI TARGET
1.6: 10% of new
teacher posts, in
addition to
annual pro rata
of teacher posts,
recruited for
schools with
high shortages
per the
established
baseline and on
duty
DTAD: FY22
DLI TARGET 1.7:
80% of the teachers
recruited over the last
five years continue to
be on duty
DTAD: FY23
DLI TARGET
1.2: 10% of new
teacher posts, in
addition to annual
pro rata of
teacher posts,
recruited for
schools with high
shortages per the
established
baseline and on
duty

15
DLI Indicative Time Line for DLI Achievement
2018 (Year 1) 2019 (Year 2) 2020 (Year 3) 2021 (Year 4) 2022 (Year 5) 2023 (Year 6)
DTAD: FY18
DLI TARGET
1.1 Value:
€450,000
DLI TARGET
1.3 Value:
€875,000
DLI TARGET
1.4 Value:
€875,000
DLI TARGET
1.5
Value:€875,000
DLI TARGET
1.6 Value:
€875,000
DLI TARGET 1.7
Value: €2,190,000
DLI 1.2 Value:
€875,000
DLI 2: Share of
science,
mathematics,
and English
teachers in
grades 7 and 8
and Forms 1–4
in targeted sub-
counties that
are certified
based on
Teacher
Professional
Development
(TPD) modules
DLI TARGET
2.1: Baseline on
teachers’
performance gaps
in science,
mathematics, and
English
DTAD: FY18
DLI 2.3: TPD
training modules
developed
DTAD: FY19
DLI 2.5: 10% of
teachers are
certified
DTAD: FY20
DLIR 2.8: 20%
of teachers are
certified
DTAD: FY21
DLI TARGET
2.10: 30% of
teachers are
certified
DTAD: FY22
DLI TARGET 2.12:
Reduction in
teachers’
performance gaps in
science, mathematics,
and English over
baseline
DTAD: FY23 DLI TARGET
2.6: 3 additional
TPD training
modules
developed
DTAD: FY20

16
DLI Indicative Time Line for DLI Achievement
2018 (Year 1) 2019 (Year 2) 2020 (Year 3) 2021 (Year 4) 2022 (Year 5) 2023 (Year 6)
or receive
school-based
support (SBTS)
DLI TARGET
2.2: Design of
SBTSS and
implementation
plan finalized
DTAD: FY18
DLI TARGET
2.4: Phase 1 of
the SBTSS
operational in
2,000 primary
schools and 500
secondary
schools
DTAD: FY19
DLI TARGET
2.7: Scaling up
of the SBTSS
based on Phase 1
evaluation to at
least 5,000
primary schools
and 1,500
secondary
schools
DTAD: FY20
DLI TARGET
2.9: 30% of
teachers
engaged in
virtual peer-to-
peer learning
DTAD: FY21
DLI TARGET
2.11: 50% of
teachers
engaged in
virtual peer-to-
peer learning
DTAD: FY22
DLI TARGET
2.1 Value:
$2.0M
€1,755,000
DLI TARGET
2.3 Value:
$1.1M €965,000
DLI TARGET
2.5 Value:
$1.0M €875,000
DLI TARGET
2.8 Value:
$0.5M
€450,000
DLI TARGET
2.10 Value:
$0.5M €450,000
DLI TARGET 2.12
Value: $2.0M
€1,755,000
DLI TARGET
2.2 Value:
$3.0M
€2,630,000
DLI TARGET
2.4 Value:
$2.0M
€1,755,000
DLI TARGET
2.6 Value:
$0.9M €790,000
DLI TARGET
2.9 Value:
$0.5M
€450,000
DLI TARGET
2.11 Value:
$0.5M €450,000
DLI TARGET
2.7 Value:
$1.0M €875,000
DLI 3:[1] Share
of schools
reporting
student-
DLI TARGET
3.1 Selection of
core textbooks
through
DLI TARGET
3.2: 50% of
schools with 1:1
student-textbook
DLI TARGET
3.3: 60% of
schools with 1:1
student-textbook
DLI TARGET
3.4: 70% of
schools with
1:1 student-
DLI TARGET
3.5: 80% of
schools with 1:1
student-textbook

17
DLI Indicative Time Line for DLI Achievement
2018 (Year 1) 2019 (Year 2) 2020 (Year 3) 2021 (Year 4) 2022 (Year 5) 2023 (Year 6)
textbook ratio
of 1:1 in
science,
mathematics,
and English at
grades 7 and 8
and Form 1 in
targeted sub-
counties
transparent and
competitive
process
DTAD: FY18
ratio
DTAD: FY19
ratio
DTAD: FY20
textbook ratio
DTAD: FY21
ratio
DTAD: FY22
DLI TARGET
3.1 Value:
€3,070,000
DLI TARGET
3.2 Value:
€3,070,000
DLI TARGET
3.3 Value:
€1,755,000
DLI TARGET
3.4 Value:
€1,755,000
DLI TARGET
3.5 Value:
€1,755,000
DLI 4:
Increased
secondary
school
enrollment of
poor and
vulnerable
students in
targeted sub-
counties
DLI
TARGET4.1:
Selection and
contracting of
partner
agency(ies) to
design and
administer
scholarships
completed
DTAD: FY18
DLI
TARGET4.2: At
least 9,000 Form
1 students
receiving
scholarship[2]
DTAD: FY19
DLI
TARGET4.3: At
least 17,750
Form 1 and 2
students
receiving
scholarship
DTAD: FY20
DLI
TARGET4.4:
At least 17,500
Form 2 and 3
students
receiving
scholarship
DTAD: FY21
DLI
TARGET4.5: At
least 17,250
Form 3 and 4
students
receiving
scholarship
DTAD: FY22
DLI TARGET 4.6:
At least 8,000 Form 4
students receiving
scholarship
DTAD: FY23
DLI TARGET 4.7:
At least 17,000
students from cohorts
1 and 2 complete
Form 4
DTAD: FY23
DLI TARGET 4.8:
Program evaluated to
inform options for
scaling up

18
DLI Indicative Time Line for DLI Achievement
2018 (Year 1) 2019 (Year 2) 2020 (Year 3) 2021 (Year 4) 2022 (Year 5) 2023 (Year 6)
DTAD: FY23
DLI TARGET
4.1 Value:
$1.0M €875,000
DLI TARGET
4.2 Value:
€3,000,000
DLI TARGET
4.3 Value:
€5,800,000
DLI TARGET
4.4 Value:
€5,800,000
DLI TARGET
4.5 Value:
€5,800,000
DLI TARGET 4.6
Value: €2,600,000
DTAD: FY23
DLI TARGET 4.7
Value: €1,755,000
DTAD: FY23
DLI TARGET 4.8
Value: €700,000
DTAD: FY23
DLI 5:
Increased
retention of
poor and
vulnerable
students in
grades 7 and 8
in targeted sub-
counties
DLI TARGET
5.1: Advocacy
strategies
developed and
implementation
launched in at
least 50% of
targeted sub-
counties
DTAD: FY18
DLI TARGET
5.2: At least
7,500 primary
students (grades
7 and 8)
receiving school
kits
DTAD: FY19
DLI TARGET
5.3: At least
7,500 primary
students (grades
7 and 8)
receiving school
kits
DTAD: FY20
DLI TARGET
5.4: At least
7,500 primary
students
(grades 7 and
8) receiving
school kits
DTAD: FY21
DLI TARGET
5.5: At least
7,500 primary
students (grades
7 and 8)
receiving school
kits
DTAD: FY22
DLI TARGET 5.6:
At least 7,500
primary students
(grades 7 and 8)
receiving school kits
DTAD: FY23
DLI TARGET 5.7:
80% of program
beneficiaries sitting
for KCPE exam at
the end of grade 8

19
DLI Indicative Time Line for DLI Achievement
2018 (Year 1) 2019 (Year 2) 2020 (Year 3) 2021 (Year 4) 2022 (Year 5) 2023 (Year 6)
DTAD: FY23
DLI TARGET 5.8:
Program is evaluated
to inform options for
scaling up
DTAD: FY23
DLI TARGET
5.1 Value:
€2,190,000
DLI TARGET
5.2 Value:
€2,630,000
DLI TARGET
5.3 Value:
€2,370,000
DLI TARGET
5.4 Value:
€2,370,000
DLI TARGET
5.5 Value:
€2,280,000
DLI TARGET 5.6
Value: €2,630,000
DLI TARGET 5.7
Value: €2,630,000
DLI TARGET 5.8
Value: €450,000
Note: DTAD* = DLI Achievement Date
ANNEX 2: DLIs/DLRs Verification Protocol Table
DLI Scalability of
Disbursements (Yes/No)
Protocol to Evaluate achievement of the DLI and data/result verification
Data source/Agency Verification Entity Definition and Procedure
DLI 1: ReducedScience, Mathematics, and English teacher shortages in targeted sub-counties

20
DLI Scalability of
Disbursements (Yes/No)
Protocol to Evaluate achievement of the DLI and data/result verification
Data source/Agency Verification Entity Definition and Procedure
2018 (Year 1)
DLR 1.1: Detailed and
costed strategic plan
developed for addressing
teacher shortages and
baseline established
No TSC report endorsed by
CEO
Principal Secretary
(PS), MoE
Detailed and costed plan by
TSC to PS, as acceptable to
IDA
DLR 1.2: 10% of new
teacher posts6, in addition to
annual pro-rata of teacher
posts, recruited for schools
with inadequate teachers7
per the established baseline,
and on duty
Yes.€0.18 million for
every 100 new teachers
recruited8 and on duty
up to maximum of 500
teachers. Minimum
achievement to trigger
disbursement is 100
teachers.
TSC TSC report verified
by independent firm
Independent firm confirms
TSC-reported figures
through teacher survey and
key informant interviews
Report by independent firm
to DPCAD, as acceptable to
IDA
2019 (Year 2)
DLR 1.3: 10% of new
teacher posts, in addition to
annual pro-rata of teacher
posts, recruited for schools
with inadequate teachers per
the established baseline, and
Yes.€0.18 million for
every 100 new teachers
recruited and on duty up
to maximum of 500
teachers. Minimum
achievement to trigger
disbursement is 100
TSC TSC report verified
by independent firm
Independent firm confirms
TSC-reported figures
through teacher survey and
key informant interviews
Report by independent firm
to DPCAD, as acceptable to
6 As defined per GoK regulations 7 As per TSC norms 8 As defined per GoK regulations

21
DLI Scalability of
Disbursements (Yes/No)
Protocol to Evaluate achievement of the DLI and data/result verification
Data source/Agency Verification Entity Definition and Procedure
on duty teachers. IDA
2020 (Year 3)
DLR 1.4: 10% of new
teacher posts, in addition to
annual pro-rata of teacher
posts, recruited for schools
with inadequate teachers per
the established baseline, and
on duty
Yes. €0.18 million for
every 100 new teachers
recruited and on duty up
to maximum of 500
teachers. Minimum
achievement to trigger
disbursement is 100
teachers.
TSC TSC report verified
by independent firm
Independent firm confirms
TSC-reported figures
through teacher survey and
key informant interviews
Report by independent firm
to DPCAD, as acceptable to
IDA
2021 (Year 4)
DLR 1.5: 10% of new
teacher posts, in addition to
annual pro-rata of teacher
posts, recruited for schools
with inadequate teachers per
the established baseline, and
on duty
Yes. €0.18 million for
every 100 new teachers
recruited and on duty up
to maximum of 500
teachers. Minimum
achievement to trigger
disbursement is 100
teachers.
TSC TSC report verified
by independent firm
Independent firm confirms
TSC-reported figures
through teacher survey and
key informant interviews
Report by independent firm
to DPCAD, as acceptable to
IDA
2022 (Year 5)
DLR 1.6: 10% of new
teacher posts, in addition to
annual pro-rata of teacher
posts, recruited for schools
with inadequate teachers per
Yes. €0.18 million for
every 100 new teachers
recruited and on duty up
to maximum of 500
teachers. Minimum
achievement to trigger
TSC TSC report verified
by independent firm
Independent firm confirms
TSC-reported figures
through teacher survey and
key informant interviews
Report by independent firm

22
DLI Scalability of
Disbursements (Yes/No)
Protocol to Evaluate achievement of the DLI and data/result verification
Data source/Agency Verification Entity Definition and Procedure
the established baseline, and
on duty
disbursement is 100
teachers.
to DPCAD, as acceptable to
IDA
2023 (Year 6)
DLR 1.7: 80% of the
teachers recruited
cumulatively in previous 5
years are on duty
Yes. €0.44 million for
every 20% of teacher
posts filled in previous
five years are still filled.
Minimum achievement
to trigger disbursement
is 20% of recruited
teachers on duty.
TSC TSC report verified
by independent firm
Independent firm confirms
TSC-reported figures
through teacher survey and
key informant interviews
Report by independent firm
to DPCAD, as acceptable to
IDA
DLI 2: Share of science, mathematics, and English teachers in Grades 7 and 8 and Forms 1-4 in targeted sub-counties that are
certified based on TPD modules or receive school-based support
2018 (Year 1)
DLR 2.1: Baseline on
teachers’ performance gaps
in science, mathematics and
English
No Directorate of Teacher
Management (DoTM),
TSC
Baseline report
endorsed by the TSC
CEO
Report by DoTM and
endorsed by the TSC CEO,
as acceptable to IDA
DLR 2.2: Design of SBTSS
and implementation plan
finalized
No DoTM, TSC Design and
implementation plan
prepared by DoTM
endorsed by the TSC,
Detailed and costed
implementation plan by
TSC, as acceptable to IDA

23
DLI Scalability of
Disbursements (Yes/No)
Protocol to Evaluate achievement of the DLI and data/result verification
Data source/Agency Verification Entity Definition and Procedure
CEO
2019 (Year 2)
DLR 2.3: TPD training
modules developed
Yes. €0.26 million for
each module developed
up to 5 modules9, and
€0.44 million for 6th
module developed.
DoTM, TSC DoTM report
endorsed by the TSC
Training modules submitted
by to TSC, as acceptable to
IDA
DLR 2.4: Phase 1 of SBTSS
implemented in 2,000
primary schools and 500
secondary schools
No DoTM, TSC TSC report verified
by independent firm
Report by TSC verified by
independent firm, as
acceptable to IDA
2020 (Year 3)
DLI 2.5: 10% of teachers
completing six modules
Yes. €0.44 million for
each additional 10% of
teachers that are
certified after
completing a training
module, up to a
maximum of 30%.
DoTM, TSC TSC report verified
by independent firm
Report by TSC verified by
independent firm, as
acceptable to IDA
DLR 2.6: TPD training
modules developed
Yes. €0.26 million for
each module developed
up to 5 modules10 and
€0.44 million for 6th
DoTM, TSC DoTM report
endorsed by the TSC
CEO
Training modules submitted
by TSC, as acceptable to
IDA
9 A module consists of 10 course units. 10 A module consists of 10 course units.

24
DLI Scalability of
Disbursements (Yes/No)
Protocol to Evaluate achievement of the DLI and data/result verification
Data source/Agency Verification Entity Definition and Procedure
module developed
DLR 2.7: Scaling up of
SBTSS based on Phase-1
evaluation to at least 5,000
primary schools and 1,500
secondary schools
No DoTM, TSC TSC report verified
by independent firm
Report by TSC verified by
independent firm, as
acceptable to IDA
2021 (Year 4)
DLR 2.8: 20% of teachers
completing eight modules
Yes. €0.44 million for
each additional 10% of
teachers that are
certified after
completing a training
module, up to a
maximum of 30%
DoTM, TSC TSC report verified
by independent firm
Report by TSC verified by
independent firm, as
acceptable to IDA
2021 (Year 4)
DLI 2.9: 30% of teachers
engaged in virtual peer-to-
peer learning
Yes. €0.22 million for
each additional 10% of
teachers engaged in
virtual peer-to-peer
learning, up to a
maximum of 50%.
DoTM, TSC TSC report verified
by independent firm
Report by TSC verified by
independent firm, as
acceptable to IDA
2022 (Year 5)
DLR 2.10: 30% of teachers
are certified
Yes. €0.44 million for
each additional 10% of
teachers that are
certified after
DoTM, TSC TSC report verified
by independent firm
Report by TSC verified by
independent firm, as
acceptable to IDA

25
DLI Scalability of
Disbursements (Yes/No)
Protocol to Evaluate achievement of the DLI and data/result verification
Data source/Agency Verification Entity Definition and Procedure
completing a training
module, up to a
maximum of 30%
DLR 2.11: 50% of teachers
engaged in virtual peer-to-
peer learning
Yes. €0.22 million for
each additional 10%
engaged in virtual peer-
to-peer learning, up to a
maximum of 50%
DoTM, TSC TSC report verified
by independent firm
Report by TSC verified by
independent firm, as
acceptable to IDA
2023 (Year 6)
DLR 2.12: Reduction in
teachers’ performance gaps
in Science, Mathematics,
and English over baseline
No DoTM, TSC TSC report verified
by independent firm
Report by TSC verified by
independent firm, as
acceptable to IDA
DLI 3: Share of schools reporting student-textbook ratio of 1:1 in science, mathematics and English at Grades 7 and 8 and
Form 1 in targeted sub-counties
2018 (Year 1)
DLI 3.1:Selection of core
textbooks through
transparent and competitive
process
No DPCAD, MoE PS, MoE Report by MoE endorsed by
PS, as acceptable to IDA
2019 (Year 2)
DLI 3.2:50% of schools
with 1:1 student-textbook
Yes. €0.18 million for
each additional 10% of
schools with 1:1
DPCAD, MoE Report by MoE
verified by
independent firm
Report by independent firm
to DPCAD, as acceptable to
IDA.

26
DLI Scalability of
Disbursements (Yes/No)
Protocol to Evaluate achievement of the DLI and data/result verification
Data source/Agency Verification Entity Definition and Procedure
ratio11 student-textbook ratio,
up to a maximum of
80%.
For the purpose of
calculation and
disbursement, at the primary
level if each student has any
two out of three textbooks
and at secondary level each
student has any three out of
the five text books will be
considered as having
student-textbook ratio of
1:1.
2020 (Year 3)
DLR 3.3: 60% of schools
with 1:1 student-textbook
ratio12
Yes. €0.18 million for
each additional 10% of
schools with 1:1
student-textbook ratio,
up to a maximum of
80%
DPCAD, MoE Report by the MoE
verified by
independent firm
Report by the independent
firm, as acceptable to IDA
2021 (Year 4)
DLR 3.4: 70% of schools
Yes. €0.18 million for
each additional 10% of
DPCAD, MoE Report by the MoE
verified by
Report by the independent
firm, as acceptable to IDA
11 In grades 7 and 8, each student will have one core textbook in science, mathematics, and English. In Forms 1 to 4, each student will have one core textbook in
the mathematics, English, and relevant science subjects. 12In grades 7 and 8, each student will have one core textbook in science, mathematics, and English. In Forms 1 to 4, each student will have one core textbook in
the mathematics, English, and relevant science subjects.

27
DLI Scalability of
Disbursements (Yes/No)
Protocol to Evaluate achievement of the DLI and data/result verification
Data source/Agency Verification Entity Definition and Procedure
with 1:1 student-textbook
ratio13
schools with 1:1 student
textbook ratio, up to a
maximum of 80%
independent firm
2022 (Year 5)
DLR 3.5: 80% of schools
with 1:1 student-textbook
ratio14
Yes. €0.18 million for
each additional 10% of
schools with 1:1 student
textbook ratio, up to a
maximum of 80%
DPCAD, MoE Report by the MoE
verified by
independent firm
Report by the independent
firm, as acceptable to IDA
DLI 4: Increased secondary school enrolment of poor and vulnerable students in targeted sub-counties
2018 (Year 1)
DLR 4.1:Selection and
contracting of implementing
agencies to design and
administer scholarships
completed
No DPCAD, MoE DPCAD Contract issued by DPCAD,
shared with IDA
2019 (Year 2)
DLR 4.2: At least 9,000
Form 1 students receiving
scholarships
Yes. €0.31 million for
each additional 1,000 of
student beneficiaries, up
to a maximum of 9,000
DPCAD, MoE Report by the MoE
verified by
independent firm
Report by the independent
firm, as acceptable to IDA
13In grades 7 and 8, each student will have one core textbook in science, mathematics, and English. In Forms 1 to 4, each student will have one core textbook in
the mathematics, English, and relevant science subjects. 14In grades 7 and 8, each student will have one core textbook in science, mathematics, and English. In Forms 1 to 4, each student will have one core textbook in
the mathematics, English, and relevant science subjects.

28
DLI Scalability of
Disbursements (Yes/No)
Protocol to Evaluate achievement of the DLI and data/result verification
Data source/Agency Verification Entity Definition and Procedure
beneficiaries.
2020 (Year 3)
DLR 4.3: At least 17,750
Form 1 and 2 students
receiving scholarships
No DPCAD, MoE Report by the MoE
verified by
independent firm
Report by the independent
firm, as acceptable to IDA
2021 (Year 4)
DLR 4.4: At least 17,500
Form 2 and 3 students
receiving scholarships
No DPCAD, MoE Report by the MoE
verified by
independent firm
Report by the independent
firm, as acceptable to IDA
2022 (Year 5)
DLR 4.5: At least 17,250
Form 3 and 4 students
receiving scholarships
No DPCAD, MoE Report by the MoE
verified by
independent firm
Report by the independent
firm, as acceptable to IDA
2023 (Year 6)
DLR 4.6: At least 8,000
Form 4 students receiving
scholarships
No DPCAD, MoE Report by the MoE
verified by
independent firm
Report by the independent
firm, as acceptable to IDA
DLR 4.7: At least 17,000
students from cohorts 1 and
2 complete Form 4
No DPCAD, MoE Report by the MoE
verified by
independent firm
Report by the independent
firm, as acceptable to IDA
DLR 4.8: Program
evaluated to inform options
No Third party consultant DPCAD, MoE Evaluation by the third
party consultant , as

29
DLI Scalability of
Disbursements (Yes/No)
Protocol to Evaluate achievement of the DLI and data/result verification
Data source/Agency Verification Entity Definition and Procedure
for scaling up acceptable to IDA
DLI 5: Increased retention of poor and vulnerable students in Grades 7 and 8 in targeted sub-counties
2018 (Year 1)
DLR 5.1:Advocacy
strategies developed and
implementation launched in
at least 50% of targeted sub-
counties
No DPCAD, MoE Report by the MoE
verified by
independent firm
Report by the independent
firm, as acceptable to IDA
2019 (Year 2)
DLR 5.2: At least 7,500
primary students ( grades 7
and 8) receiving school kits
No DPCAD, MoE Report by the MoE
verified by
independent firm
Report by the independent
firm, as acceptable to IDA
2020 (Year 3)
DLR 5.3: At least 7,500
primary students
(grades 7 and 8) receiving
school kits
No DPCAD, MoE Report by the MoE
verified by
independent firm
Report by the independent
firm, as acceptable to IDA
2021 (Year 4)
DLR 5.4: At least 7,500
primary students (grades 7
and 8) receiving school kits
No DPCAD, MoE Report by the MoE
verified by
independent firm
Report by the independent
firm, as acceptable to IDA
2022 (Year 5) No DPCAD, MoE Report by the MoE Report by the independent

30
DLI Scalability of
Disbursements (Yes/No)
Protocol to Evaluate achievement of the DLI and data/result verification
Data source/Agency Verification Entity Definition and Procedure
DLR 5.5: At least 7,500
primary students (grades 7
and 8) receiving school kits
verified by
independent firm
firm, as acceptable to IDA
2023 (Year 6)
DLR 5.6: At least 7,500
students (grades 7 and 8)
receiving school kits
No DPCAD, MoE Report by the MoE
verified by
independent firm
Report by the independent
firm, as acceptable to IDA
DLR 5.7: 80% of program
beneficiaries sitting for
KCPE exam at end of grade
8
Yes. €0.66 million for
every 20% of
beneficiaries completing
grade 8, up to a
maximum of 80%
DPCAD, MoE
Report by the MoE
verified by
independent firm
Report by the independent
firm, as acceptable to IDA
DLR 5.8: Program is
evaluated to inform options
for scaling up
No Third party Consultant DPCAD, MoE Evaluation by third party
consultant, as acceptable to
IDA

31
ANNEX 3: Targeted Sub-counties
a) Summary- school totals
Pri
mar
y
Seco
nd
ary
TOTA
L
Co
un
ty
Sub
-C
ou
nty
No
. of
Sc
ho
ols
No
. of
Sch
oo
ls
1
Baringo
Baringo North 150 29 179
2 EAST POKOT 90 6 96
3 MARIGAT 92 22 114
4 Elgeyo Marakwet (2 subcounties not selected) MARAKWET EAST 84 18 102
5 MARAKWET WEST 104 33 137
6 Bomet (2 subcounties not selected) CHEPALUNGU 186 58 244
7 SOTIK 175 68 243
8 Narok (3 subcounties not selected) TRANS MARA EAST 70 23 93
9 Bungoma (6 subcounties not selected)
BUNGOMA WEST 81 29 110
10 CHEPTAIS 98 17 115
11 MT ELGON 65 18 83
12 Busia BUNYALA 40 11 51

32
Pri
mar
y
Seco
nd
ary
TOTA
L
Co
un
ty
Sub
-C
ou
nty
No
. of
Sc
ho
ols
No
. of
Sch
oo
ls
13 BUSIA 48 21 69
14 BUTULA 61 28 89
15 NAMBALE 52 21 73
16 SAMIA 65 19 84
17 TESO NORTH 92 31 123
18 TESO SOUTH 77 24 101
19 Kakamega (6 subcounties not selected) BUTERE 80 31 111
20 KAKAMEGA SOUTH 81 29 110
21 KHWISERO 61 22 83
22 LIKUYANI 68 33 101
23 LUGARI 57 30 87
24 NAVAKHOLO 69 30 99
25 Nandi (4 subcounties not selected) TINDERET 126 31 157
26 Garissa (1 subcounty not selected)
BALAMBALA 30 2 32
27 DADAAB 26 4 30

33
Pri
mar
y
Seco
nd
ary
TOTA
L
Co
un
ty
Sub
-C
ou
nty
No
. of
Sc
ho
ols
No
. of
Sch
oo
ls
28 FAFI 30 5 35
29 HULUGHO 22 2 24
30 IJARA 30 5 35
31 LAGDERA 25 3 28
32 Mandera
BANISA 30 2 32
33 LAFEY 11 2 13
34 MANDERA CENTRAL 41 9 50
35 MANDERA EAST 37 15 52
36 MANDERA NORTH 40 7 47
37 MANDERA WEST 41 6 47
38 Marsabit
CHALBI 17 3 20
39 HORR NORTH 19 4 23
40 LOIYANGALANI 15 -- 15
41 MARSABIT 34 10 44
42 MARSABIT SOUTH 30 5 35

34
Pri
mar
y
Seco
nd
ary
TOTA
L
Co
un
ty
Sub
-C
ou
nty
No
. of
Sc
ho
ols
No
. of
Sch
oo
ls
43 MOYALE 34 7 41
44 SOLOLO 23 4 27
45 Tana River
BURA (TANA NORTH) 47 5 52
46 TANA DELTA 63 10 73
47 TANA RIVER 51 6 57
48 Wajir
BUNA 21 3 24
49 ELDAS 18 3 21
50 HABASWEIN 35 7 42
51 TARBAJ 28 4 32
52 WAJIR EAST 36 12 48
53 WAJIR NORTH 22 3 25
54 WAJIR SOUTH 22 2 24
55 WAJIR WEST 37 6 43
56 Homa Bay (5 subcounties not selected) SUBA 97 34 131
57 Kisii (7 subcounties not selected) MARANI 65 30 95

35
Pri
mar
y
Seco
nd
ary
TOTA
L
Co
un
ty
Sub
-C
ou
nty
No
. of
Sc
ho
ols
No
. of
Sch
oo
ls
58 NYAMACHE 103 48 151
59 Migori (4 subcounties not selected)
KURIA EAST 50 19 69
60 KURIA WEST 91 28 119
61 URIRI 76 33 109
62 Isiolo
GARBATULA 39 4 43
63 ISIOLO 44 15 59
64 MERTI 29 4 33
65 Laikipia (4 subcounties not selected) LAIKIPIA NORTH 27 5 32
66 Samburu
SAMBURU CENTRAL 84 16 100
67 SAMBURU EAST 40 6 46
68 SAMBURU NORTH 34 6 40
69 Kajiado (3 subcounties not selected) KAJIADO CENTRAL 117 17 134
70 LOITOKITOK 83 20 103
71 Machakos (6 subcounties not selected) MASINGA 135 53 188
72 YATTA 134 55 189
36
Pri
mar
y
Seco
nd
ary
TOTA
L
Co
un
ty
Sub
-C
ou
nty
No
. of
Sc
ho
ols
No
. of
Sch
oo
ls
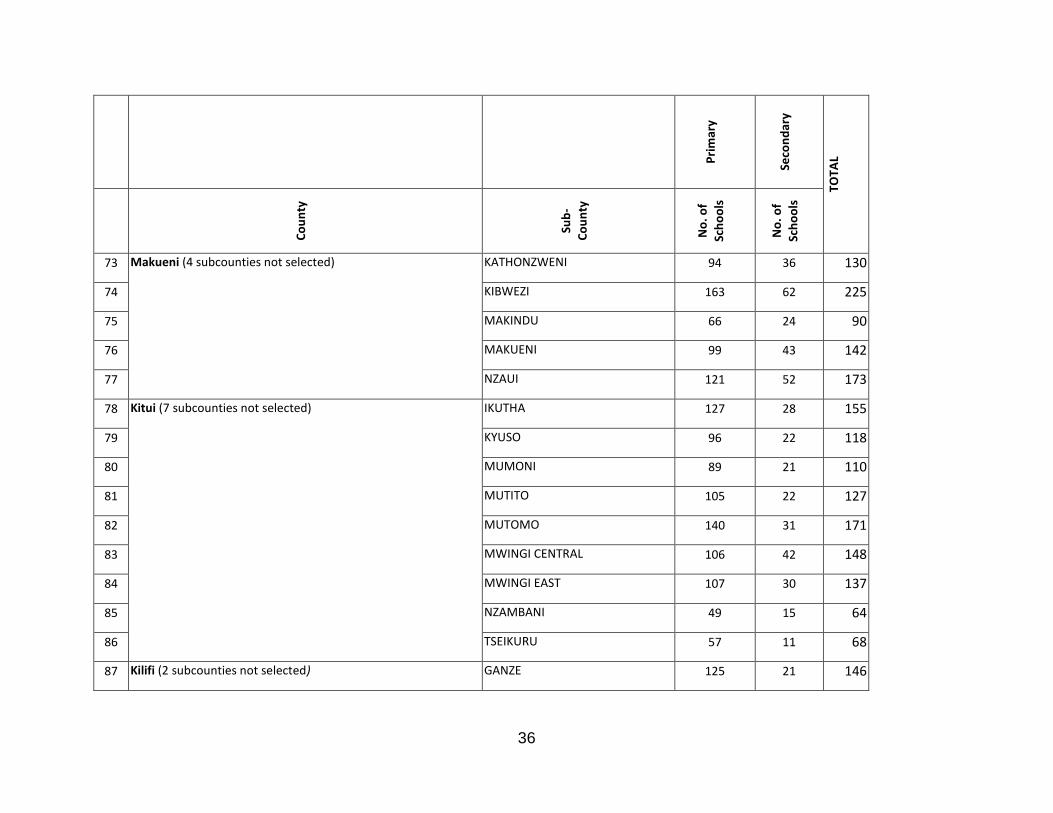
73 Makueni (4 subcounties not selected)
KATHONZWENI 94 36 130
74 KIBWEZI 163 62 225
75 MAKINDU 66 24 90
76 MAKUENI 99 43 142
77 NZAUI 121 52 173
78 Kitui (7 subcounties not selected)
IKUTHA 127 28 155
79 KYUSO 96 22 118
80 MUMONI 89 21 110
81 MUTITO 105 22 127
82 MUTOMO 140 31 171
83 MWINGI CENTRAL 106 42 148
84 MWINGI EAST 107 30 137
85 NZAMBANI 49 15 64
86 TSEIKURU 57 11 68
87 Kilifi (2 subcounties not selected) GANZE 125 21 146

37
Pri
mar
y
Seco
nd
ary
TOTA
L
Co
un
ty
Sub
-C
ou
nty
No
. of
Sc
ho
ols
No
. of
Sch
oo
ls
88 KALOLENI 66 22 88
89 MAGARINI 108 19 127
90 MALINDI 75 19 94
91 Kwale
KINANGO 163 23 186
92 KWALE 97 28 125
93 MSAMBWENI 157 35 192
94 Taita Taveta (3 subcounties not selected) TAVETA 38 10 48
95 Murang'a (5 subcounties not selected) KANDARA 78 55 133
96 KIGUMO 61 37 98
97 MURANG'A EAST 54 30 84
98 Tharaka-Nithi (2 subcounties not selected) THARAKA NORTH 60 9 69
99 THARAKA SOUTH 104 25 129
100 Turkana
KIBISH 11 1 12
101 LOIMA 57 6 63
102 TURKANA CENTRAL 73 9 82

38
Pri
mar
y
Seco
nd
ary
TOTA
L
Co
un
ty
Sub
-C
ou
nty
No
. of
Sc
ho
ols
No
. of
Sch
oo
ls
103 TURKANA EAST 36 6 42
104 TURKANA NORTH 40 4 44
105 TURKANA SOUTH 87 7 94
106 TURKANA WEST 70 9 79
107 West Pokot
POKOT CENTRAL 158 29 187
108 POKOT NORTH 122 11 133
109 POKOT SOUTH 81 21 102
110 WEST POKOT 177 41 218
Grand Total 7,852 2,147 9999

39
b) Detailed
PRIMARY SECONDARY
Public private public private
1 COUNTY
SUB_COUN
TY
CI
ranki
ng
#
sch
ools
enroll
ment
grade
s 7-8
enroll
ment
grade
s 7-8
femal
e
share
of
enrol
ment
#
sch
ools
enroll
ment
#
sch
ools
enroll
ment
femal
e
share
of
enrol
ment
#
sch
ools
enroll
ment
1. Baringo(3 sub-counties
not selected)
BARINGO
NORTH
75 150 28,14
8
7,199 0.49 13 1,646 29 6,819 0.51 3 374
EAST
POKOT
60 90 15,52
3
1,790 0.40 6 1,444 0.31
MARIGAT 91 92 24,86
5
5,427 0.49 17 2,689 22 3,599 0.42
2. Bomet(2 sub-counties not
selected)
CHEPALUN
GU
71 186 54,11
1
11,93
7
0.50 54 7,368 58 13,88
0
0.49 1 236
SOTIK 102 175 53,45
6
13,28
6
0.51 70 9,776 68 16,76
2
0.48
3. Bungoma (6 sub-counties
not selected)
BUNGOMA
WEST
101 81 43,91
5
8,748 0.50 17 2,639 29 9,532 0.50
CHEPTAIS 67 98 49,78
3
8,302 0.49 44 5,307 17 5,220 0.44 1 189

40
PRIMARY SECONDARY
Public private public private
1 COUNTY
SUB_COUN
TY
CI
ranki
ng
#
sch
ools
enroll
ment
grade
s 7-8
enroll
ment
grade
s 7-8
femal
e
share
of
enrol
ment
#
sch
ools
enroll
ment
#
sch
ools
enroll
ment
femal
e
share
of
enrol
ment
#
sch
ools
enroll
ment
MT ELGON 86 65 34,49
8
7,352 0.52 21 2,964 18 5,459 0.48
4. Busia
BUNYALA 54 40 21,98
6
3,779 0.49 8 790 11 3,123 0.40
BUSIA 90 48 33,52
5
7,168 0.52 11 2,295 21 6,427 0.47 2 194
BUTULA 66 61 44,12
2
9,166 0.49 7 1,661 28 8,194 0.41 1 80
NAMBALE 69 52 30,90
3
6,194 0.51 41 3,597 21 5,946 0.45 2 150
SAMIA 77 65 28,73
2
5,639 0.51 16 1,955 19 7,110 0.47
TESO
NORTH
89 92 33,72
4
7,883 0.50 30 3,056 31 8,826 0.52 1 96
TESO
SOUTH
68 77 45,02
6
8,740 0.50 20 2,407 24 7,434 0.49
5. Elgeyo Marakwet (2 sub-
counties not selected)
MARAKWE
T EAST
52 84 25,87
1
5,324 0.49 9 1,256 18 2,968 0.38
MARAKWE 79 104 32,88 7,877 0.53 17 3,006 33 8,910 0.41

41
PRIMARY SECONDARY
Public private public private
1 COUNTY
SUB_COUN
TY
CI
ranki
ng
#
sch
ools
enroll
ment
grade
s 7-8
enroll
ment
grade
s 7-8
femal
e
share
of
enrol
ment
#
sch
ools
enroll
ment
#
sch
ools
enroll
ment
femal
e
share
of
enrol
ment
#
sch
ools
enroll
ment
T WEST 6
6. Garissa (1 sub-county not
selected)
BALAMBAL
A
23 30 7,031 785 0.30 1 142 2 540 0.38
DADAAB 65 26 8,174 965 0.28 25 42,00
8
4 1,291 0.27 6 4,329
FAFI 62 30 5,782 840 0.37 17 22,14
4
5 608 0.34 1 135
HULUGHO 36 22 4,891 410 0.27 2 369 0.47
IJARA 50 30 6,251 1,227 0.42 7 468 5 1,211 0.40
LAGDERA 41 25 6,355 942 0.31 3 604 0.21
7. Homa Bay (5 sub-
counties not selected)
SUBA 94 97 29,05
1
6,291 0.48 22 2,999 34 6,652 0.53 3 296
8. Isiolo
GARBATUL
A
16 39 8,746 1,698 0.47 6 581 4 844 0.34
ISIOLO 58 44 15,29
9
3,216 0.49 26 5,684 15 2,491 0.43 4 504
MERTI 46 29 5,341 1,023 0.52 3 587 4 476 0.44 2 145
9. Kajiado (3 sub-counties KAJIADO 72 117 29,92 5,437 0.44 35 5,860 17 4,208 0.33 8 827

42
PRIMARY SECONDARY
Public private public private
1 COUNTY
SUB_COUN
TY
CI
ranki
ng
#
sch
ools
enroll
ment
grade
s 7-8
enroll
ment
grade
s 7-8
femal
e
share
of
enrol
ment
#
sch
ools
enroll
ment
#
sch
ools
enroll
ment
femal
e
share
of
enrol
ment
#
sch
ools
enroll
ment
not selected) CENTRAL 2
LOITOKITO
K
93 83 35,77
8
6,841 0.50 29 5,107 20 5,157 0.41 6 860
10. Kakamega(6 sub-counties
not selected)
BUTERE 99 80 42,81
1
8,866 0.53 11 966 31 9,140 0.52 1 137
KAKAMEG
A SOUTH
104 81 39,37
5
6,387 0.55 10 997 29 9,909 0.52
KHWISERO 84 61 31,13
8
6,082 0.53 7 1,246 22 6,241 0.51 1 113
LIKUYANI 97 68 39,36
4
8,287 0.51 62 7,932 33 9,998 0.54 2 273
LUGARI 106 57 34,06
7
7,556 0.51 28 3,157 30 10,85
4
0.54 1 38
NAVAKHOL
O
107 69 51,48
0
10,02
3
0.51 35 3,412 30 9,527 0.41
11. Kilifi(2 sub-counties not
selected)
GANZE 26 125 44,54
5
9,407 0.51 8 541 21 5,537 0.43 1 25
KALOLENI 81 66 38,64
3
8,869 0.49 33 5,026 22 8,212 0.49 6 645

43
PRIMARY SECONDARY
Public private public private
1 COUNTY
SUB_COUN
TY
CI
ranki
ng
#
sch
ools
enroll
ment
grade
s 7-8
enroll
ment
grade
s 7-8
femal
e
share
of
enrol
ment
#
sch
ools
enroll
ment
#
sch
ools
enroll
ment
femal
e
share
of
enrol
ment
#
sch
ools
enroll
ment
MAGARINI 21 108 45,76
6
9,363 0.47 35 3,285 19 4,268 0.39 7 1,293
MALINDI 87 75 48,97
8
12,37
8
0.49 64 11,35
8
19 8,245 0.34 16 2,476
12. Kisii (7 sub-counties not
selected)
MARANI 78 65 26,16
9
5,663 0.50 33 3,717 30 8,010 0.46 2 121
NYAMACH
E
105 103 35,77
0
7,799 0.50 26 3,113 48 11,91
3
0.49 2 279
13. Kitui (7 sub-counties not
selected)
IKUTHA 40 127 27,79
5
5,530 0.52 6 347 28 4,345 0.51 1 9
KYUSO 27 96 20,10
8
3,951 0.53 17 1,256 22 3,626 0.44
MUMONI 28 89 16,31
5
3,086 0.52 17 1,106 21 2,756 0.50
MUTITO 42 105 26,73
0
5,225 0.52 11 1,011 22 4,595 0.47
MUTOMO 44 140 35,36
6
7,755 0.51 5 549 31 5,972 0.53
MWINGI 82 106 28,54 6,786 0.48 28 3,384 42 6,199 0.46 3 222

44
PRIMARY SECONDARY
Public private public private
1 COUNTY
SUB_COUN
TY
CI
ranki
ng
#
sch
ools
enroll
ment
grade
s 7-8
enroll
ment
grade
s 7-8
femal
e
share
of
enrol
ment
#
sch
ools
enroll
ment
#
sch
ools
enroll
ment
femal
e
share
of
enrol
ment
#
sch
ools
enroll
ment
CENTRAL 0
MWINGI
EAST
37 107 28,94
4
6,157 0.51 12 1,089 30 4,210 0.52
NZAMBANI 55 49 13,21
5
3,270 0.50 6 347 15 3,954 0.51
TSEIKURU 39 57 13,04
6
2,562 0.51 3 278 11 1,820 0.52 1 34
14. Kwale
KINANGO 11 163 66,33
7
13,15
5
0.48 18 2,781 23 6,476 0.40
KWALE 92 97 39,15
4
8,420 0.49 24 3,492 28 11,20
0
0.51 2 238
MSAMBWE
NI
49 157 61,68
5
11,99
2
0.48 72 10,14
2
35 8,901 0.54 6 732
15. Laikipia (4 sub-counties
not selected)
LAIKIPIA
NORTH
63 27 6,950 1,467 0.47 2 201 5 1,109 0.42
16. Machakos (6 sub-counties
not selected)
MASINGA 88 135 39,32
8
9,134 0.51 34 4,832 53 11,50
3
0.48 2 271
YATTA 103 134 41,51
9
9,984 0.51 37 4,222 55 13,19
1
0.50 8 1,412

45
PRIMARY SECONDARY
Public private public private
1 COUNTY
SUB_COUN
TY
CI
ranki
ng
#
sch
ools
enroll
ment
grade
s 7-8
enroll
ment
grade
s 7-8
femal
e
share
of
enrol
ment
#
sch
ools
enroll
ment
#
sch
ools
enroll
ment
femal
e
share
of
enrol
ment
#
sch
ools
enroll
ment
17. Makueni (4 sub-counties
not selected)
KATHONZ
WENI
80 94 24,60
5
6,319 0.51 4 544 36 8,762 0.48 1 119
KIBWEZI 61 163 54,72
3
12,87
0
0.51 30 3,541 62 15,26
5
0.48 2 157
MAKINDU 59 66 22,55
8
5,386 0.52 20 2,015 24 5,237 0.53 5 325
MAKUENI 100 99 29,41
8
7,408 0.51 13 2,039 43 12,63
5
0.44 3 542
NZAUI 83 121 34,10
5
8,197 0.50 7 848 52 13,06
6
0.53 1 49
18. Mandera
BANISA 25 30 10,04
7
878 0.27 1 292 2 664 0.21
LAFEY 3 11 5,241 832 0.29 2 388 0.00
MANDERA
CENTRAL
22 41 16,99
4
2,050 0.37 4 483 9 2,264 0.30
MANDERA
EAST
56 37 26,53
7
4,720 0.36 24 6,142 15 5,297 0.34 4 1,481
MANDERA
NORTH
45 40 14,98
6
1,520 0.38 3 268 7 2,169 0.32 1 183

46
PRIMARY SECONDARY
Public private public private
1 COUNTY
SUB_COUN
TY
CI
ranki
ng
#
sch
ools
enroll
ment
grade
s 7-8
enroll
ment
grade
s 7-8
femal
e
share
of
enrol
ment
#
sch
ools
enroll
ment
#
sch
ools
enroll
ment
femal
e
share
of
enrol
ment
#
sch
ools
enroll
ment
MANDERA
WEST
31 41 17,52
7
1,539 0.28 3 545 6 1,477 0.26
19. Marsabit
CHALBI 24 17 4,142 775 0.54 3 626 0.30
HORR
NORTH
7 19 3,659 586 0.35 1 86 4 474 0.45
LOIYANGA
LANI
1 15 3,054 348 0.47 #DIV
/0!
MARSABIT 74 34 11,75
6
2,296 0.50 9 1,757 10 2,374 0.34 4 430
MARSABIT
SOUTH
10 30 6,990 1,207 0.41 3 625 5 444 0.43 1 47
MOYALE 17 34 13,98
5
2,518 0.49 23 5,738 7 1,469 0.37 1 140
SOLOLO 5 23 4,747 903 0.46 10 1,400 4 434 0.51
20. Migori (4 sub-counties
not selected)
KURIA
EAST
73 50 27,19
1
4,725 0.48 13 1,882 19 4,621 0.44
KURIA
WEST
95 91 40,55
4
7,785 0.50 39 7,039 28 8,315 0.43 5 659
URIRI 98 76 32,72 7,458 0.48 33 4,478 33 7,824 0.34 2 130

47
PRIMARY SECONDARY
Public private public private
1 COUNTY
SUB_COUN
TY
CI
ranki
ng
#
sch
ools
enroll
ment
grade
s 7-8
enroll
ment
grade
s 7-8
femal
e
share
of
enrol
ment
#
sch
ools
enroll
ment
#
sch
ools
enroll
ment
femal
e
share
of
enrol
ment
#
sch
ools
enroll
ment
3
21. Murang'a (5 sub-counties
not selected)
KANDARA 78 30,68
7
7,852 0.51 26 3,848 55 18,90
7
0.50 3 310
KIGUMO 61 26,41
5
6,286 0.50 30 3,613 37 10,77
1
0.44 2 276
MURANG'A
EAST
54 18,16
9
4,696 0.50 20 2,189 30 7,705 0.49
22. Nandi (4 sub-counties not
selected)
TINDERET 85 126 30,84
1
6,471 0.49 22 2,069 31 6,102 0.46
23. Narok(3 sub-counties not
selected)
TRANS
MARA
EAST
96 70 33,64
7
6,368 0.48 23 4,152 23 4,102 0.40
24. Samburu
SAMBURU
CENTRAL
38 84 28,70
0
5,185 0.41 12 2,013 16 3,677 0.38 2 235
SAMBURU
EAST
34 40 10,07
0
1,797 0.42 8 573 6 1,448 0.26 1 170
SAMBURU
NORTH
35 34 8,954 1,404 0.42 2 113 6 1,285 0.39
25. TaitaTaveta(3 sub- TAVETA 64 38 17,51 4,363 0.51 16 2,312 10 2,820 0.53

48
PRIMARY SECONDARY
Public private public private
1 COUNTY
SUB_COUN
TY
CI
ranki
ng
#
sch
ools
enroll
ment
grade
s 7-8
enroll
ment
grade
s 7-8
femal
e
share
of
enrol
ment
#
sch
ools
enroll
ment
#
sch
ools
enroll
ment
femal
e
share
of
enrol
ment
#
sch
ools
enroll
ment
counties not selected) 1
26. Tana River
BURA
(TANA
NORTH)
29 47 13,02
3
2,452 0.44 16 1,994 5 1,866 0.34 2 156
TANA
DELTA
32 63 20,15
0
3,784 0.47 4 335 10 2,623 0.39
TANA
RIVER
33 51 15,16
4
2,875 0.47 4 785 6 1,524 0.45 1 298
27. Tharaka-Nithi(2 sub-
counties not selected)
THARAKA
NORTH
51 60 15,56
2
2,639 0.52 13 1,390 9 1,471 0.46 1 111
THARAKA
SOUTH
70 104 23,87
0
4,830 0.51 11 1,034 25 4,025 0.43 3 954
28. Turkana
KIBISH 2 11 3,437 229 0.32 1 82 0.00
LOIMA 8 57 16,50
9
1,911 0.44 6 1,330 0.56 1 71
TURKANA
CENTRAL
30 73 34,80
6
5,228 0.40 16 3,989 9 4,330 0.27 1 38
TURKANA
EAST
19 36 16,29
7
1,673 0.45 1 42 6 1,505 0.43

49
PRIMARY SECONDARY
Public private public private
1 COUNTY
SUB_COUN
TY
CI
ranki
ng
#
sch
ools
enroll
ment
grade
s 7-8
enroll
ment
grade
s 7-8
femal
e
share
of
enrol
ment
#
sch
ools
enroll
ment
#
sch
ools
enroll
ment
femal
e
share
of
enrol
ment
#
sch
ools
enroll
ment
TURKANA
NORTH
15 40 12,01
6
1,064 0.39 4 1,048 0.44
TURKANA
SOUTH
6 87 38,87
4
5,055 0.47 2 208 7 2,489 0.40
TURKANA
WEST
43 70 63,77
3
8,420 0.26 26 31,21
7
9 3,928 0.34 6 5,959
29. Wajir
BUNA 13 21 4,214 397 0.33 3 513 0.20
ELDAS 9 18 5,520 508 0.24 1 209 3 360 0.17
HABASWEI
N
47 35 8,029 1,148 0.37 4 911 7 1,624 0.43 1 68
TARBAJ 14 28 7,936 1,023 0.28 4 659 0.28
WAJIR
EAST
53 36 20,25
7
3,439 0.44 19 4,070 12 5,419 0.32 4 830
WAJIR
NORTH
4 22 4,053 582 0.34 3 613 0.34
WAJIR
SOUTH
12 22 4,678 500 0.33 1 97 2 341 0.22
WAJIR
WEST
20 37 11,52
8
1,622 0.32 1 204 6 1,359 0.25

50
PRIMARY SECONDARY
Public private public private
1 COUNTY
SUB_COUN
TY
CI
ranki
ng
#
sch
ools
enroll
ment
grade
s 7-8
enroll
ment
grade
s 7-8
femal
e
share
of
enrol
ment
#
sch
ools
enroll
ment
#
sch
ools
enroll
ment
femal
e
share
of
enrol
ment
#
sch
ools
enroll
ment
30. West Pokot
POKOT
CENTRAL
48 158 53,68
2
8,263 0.49 9 758 29 6,165 0.41 1 38
POKOT
NORTH
18 122 33,67
4
3,605 0.43 5 865 11 1,850 0.34
POKOT
SOUTH
57 81 28,16
1
5,146 0.50 10 1,121 21 3,138 0.47
WEST
POKOT
76 177 67,06
6
11,67
9
0.49 17 4,541 41 11,54
1
0.42 2 263
Grand Total 7,8
52
2,839,
648
557,4
54
0.49 1,7
69
332,1
53
2,1
47
548,2
40
0.46 164 30,77
2