ministry for food, agriculture, forestry and fisheries fisheries of korea kwang –soo, lim deputy...
Post on 19-Dec-2015
220 views
TRANSCRIPT

Ministry for Food, Agriculture, Forestry and Fisheries
Fisheries of Ko-rea
Kwang –Soo, LimDeputy Minister for Fisheries Policy

1. Marine Environment
2. Fisheries in Korea
3. Fisheries Policy
4. Growth momentum for fisheries
[ Contents ]

1. Marine Environment

Seas surrounding Korea

5
CHINA
JAPAN
KOREA
• Coastline : 14,533km (South Korea 11,542km)• Islands : 4,198 (South Korea 3,153)
Cold
Warm
6
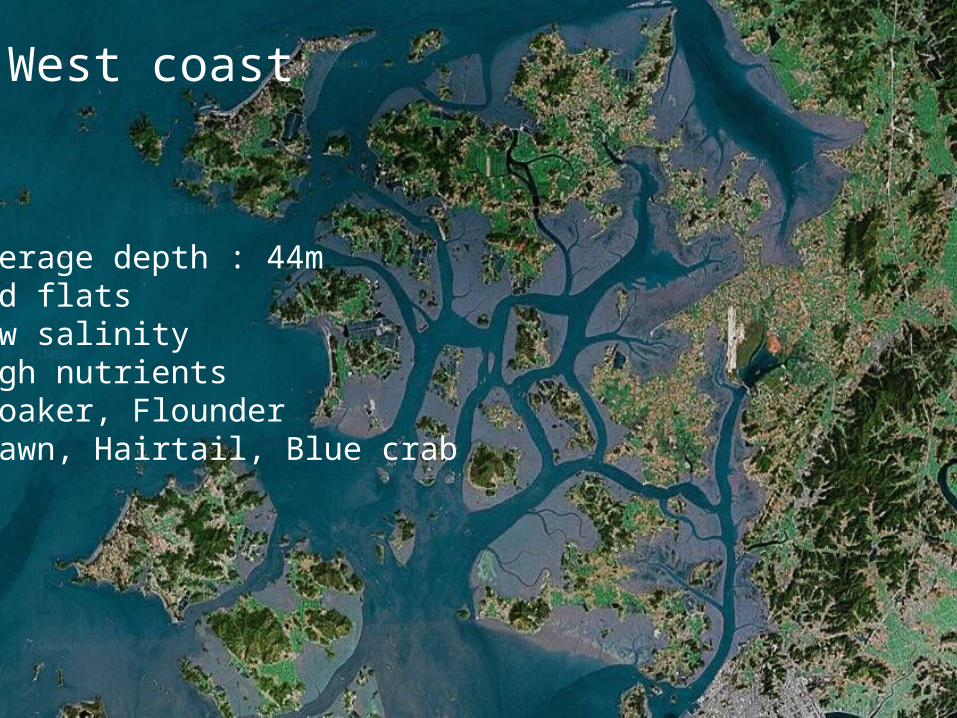
West coast
• Average depth : 44m• Mud flats• Low salinity• High nutrients • Croaker, Flounder• Prawn, Hairtail, Blue crab

7
East coast
• Average depth : 1,700m
• Cold water at the bottom
• Warm water at the top
• Squid, Saury, Alaska Pollack,
• Yellowtail, Red crab

8
South coast
• Anchovy, Mackerel• Eel, Sea bream, Filefish, Tuna• Center of Korean Aquaculture

Geomorphology
East Sea Yellow SeaEast
China Sea
Area (㎢ ) 1,013,000 417,000 752,000
Average Depth (m) 1,667 44 272
Volume (㎢ ) 1,690,000 18,000 209,000
Continental Shelf(0-200m)
23.5% 100% 81.3%
Continental Slope(200-1,000m)
15.2% 0 11.4%
% of Deep Basin 61.3% 0 7.3%

2. Fisheries in Korea

Production (2010)
3.1 million tonnes (2.1% of world production)
Types Production Major species
Coastal & Offshore 1,227Mackerel, Hairtail, Anchovy, Squid,
Croaker, Blue crab, Clam
Aquaculture 1,313Flounder, Rockfish, Oyster, Laver,
Kelp, Avalone
Distant-water 612Tuna, Saury, Alaska Pollack, Squid,
Krill
Inlands 30 Eel, Trout, Catfish
(Unit: 1,000 tonnes)

World's Fisheries Production (2008, including aquatic plants unit = 1,000 tons)
Country Capture Aquaculture Total Ratio
1 China 14,791 43,036 57,827 36%
2 Indonesia 4,957 3,838 8,795 5.5%
3 India 4,104 3,478 7,583 4.7%
4 Peru 7,362 57 7,419 4.6%
5 Japan 4,248 1,292 5,540 3.5%
6 Philippines 2,561 2,408 5,059 3.2%
7 USA 4,349 5,06 4,855 3.0%
8 Chile 3,554 1,255 4,809 3.0%
9 Viet Nam 2,087 2,496 4,583 2.9%
10 Thailand 2,457 1,374 3,831 2.4%
11 Russia 3,383 125 3,508 2.2%
12 Korea 1,943 1,408 3,351 2.1%

Changes in Contribution
1980 1990 2000 2010

Fishing Vessels
2000 2010 Goal
68,629
39,903
47,521
Sustainable level : 39,903 vessels Current : 47,751 (16% over)
Scraped 16,642 during ’94~’10 (1,546 billion won)
Sustainable level : 39,903 vessels Current : 47,751 (16% over)
Scraped 16,642 during ’94~’10 (1,546 billion won)

Global top in aquaculture production per nation’s territory
14.2 ton / km2
* China: 42 million ton (world top), but production / territory = 4.4 ton ㎢
Korea China Japan India Vietnam Norway Philippines
14.2
4.43.1
1.0
7.6
2.6
8.0
Aquaculture Production
World aquaculture production (million ton) : China (42.6), Indonesia (3.8),
India (3.5), Vietnam (2.5), Philippines (2.4), Korea (1.4)

Fishing Households
1981
1983
1985
1987
1989
1991
1993
1995
1997
1999
2001
2003
2005
2007
2009
60000
80000
100000
120000
140000
69,379
129,734

Trade
1981
1983
1985
1987
1989
1991
1993
1995
1997
1999
2001
2003
2005
2007
2009
50000
550000
1050000
1550000
2050000
2550000
3050000
(unit: 1,000 US$)
Import
Export
liberalization of imports

Fish consumption per-capita increased by 57% during last 10 years
Supply 40% of animal protein China market demand is growing rapidly → export market
rice
1998 2008
35
103
86
55
41
fish
meat
2000 2006 2009
11
22
30
Korean Food consumption (kg/yr) Chinese fish consumption (kg/yr)
Growing demand for fish

3. Fisheries Policy

1948Fisheries Bureau in the Ministry of Commerce and Industry
1966~
1996Fisheries Administration
1996~
2007
Ministry of Maritime Affairs and Fisheries
Since 2008
Ministry for the Food, Agriculture, Forestry and Fisheries
History of fisheries governance
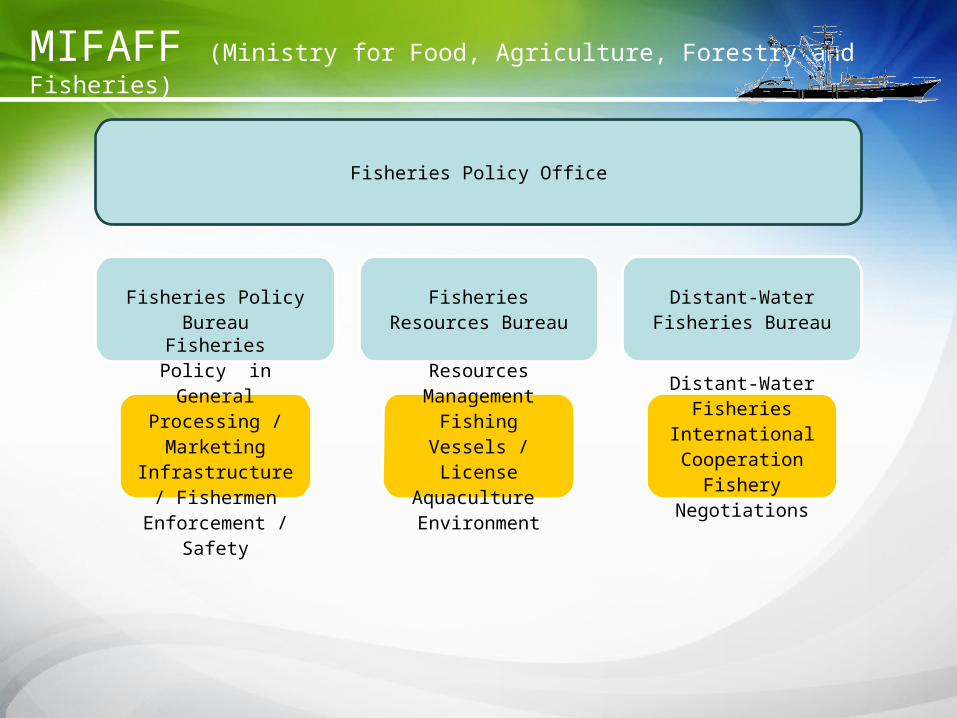
Fisheries Policy Office
Fisheries Policy Bu-reau
Fisheries Policy in General
Processing / Marketing
Infrastructure / Fishermen
Enforcement / Safety
Fisheries Resources Bureau
Resources Man-agement
Fishing Vessels / License
Aquaculture Environment
Distant-Water Fish-eries Bureau
Distant-Water Fisheries
International Cooperation
Fishery Negotia-tions
MIFAFF (Ministry for Food, Agriculture, Forestry and Fisheries)

Major management tools
Input/Output control
fishing license 3,957 / TAC for 12 species
Buy-Back program (since 1994)
scrapped 16,642 vessels
Technical measures
Closed areas and seasons, Landing, etc.
Community based management (since 2001)
managed by people who use them
increasing both participants 10 times and income 8~9% / yr.

Comparison of fishery policies
Classification Korea Japan China
Input control
• License system• Fishing gear size & type
• License system• Restriction of fishing method and vessel size
• License system• Controlling total number of vessels and their power
Output control • TAC • TAC -
Technical mea-sures
• Closed seasons and areas• Mesh size
• Closed seasons & areas• Mesh size
• Closed seasons & areas• Mesh size
Resource en-hancement
• Artificial reefs• Release of fry• Sea farming• Release of salmon & cod
• Artificial reefs• Release of fry• Release of salmon & trout
• Artificial reefs• Release of fry
Others
• Restrictions of catches landing, transshipments, & place of sale• Co-management• Water quality conservation• Prohibition of sales of illegal catches
• Fishing right manage-ment• Coastal fishing ground maintenance• Prohibition of sales of illegal catches
• Resource fee• Regulating proportion of fry catch

Aquaculture management
Input controls
licenses: 13,409 (266,717 ha)
limit on aquaculture access => small-scale business
- prohibition of license lease
- restriction on farm size (less than 60 ha) & large company’s entry
Technical measure
restrictions on antibiotics usage
drain water quality conservation

Processing / Marketing
Processing market size: $62 billion
Certification schemes & Place-of-origin labeling system
Electronic wholesale market & internet fisheries market
HACCP on Aquaculture & processing factories, etc.
Federation of Fisheries Cooperatives
Markets around producing & consumption areas
- Consignment sale spots:160 places (landing ports : 202)
- Wholesale markets (downtown)

Fishing village & port
Fishing village renovation
Comprehensive fishing village development project (’94 ~ )
Sister City and Village Program (city vs. fishing village)
Fishing village camp
Fishing Port
National fishing port management (110 sites)
Marine debris collecting vessel in fishing port
Overseas fishing port building (with relation to ODA)
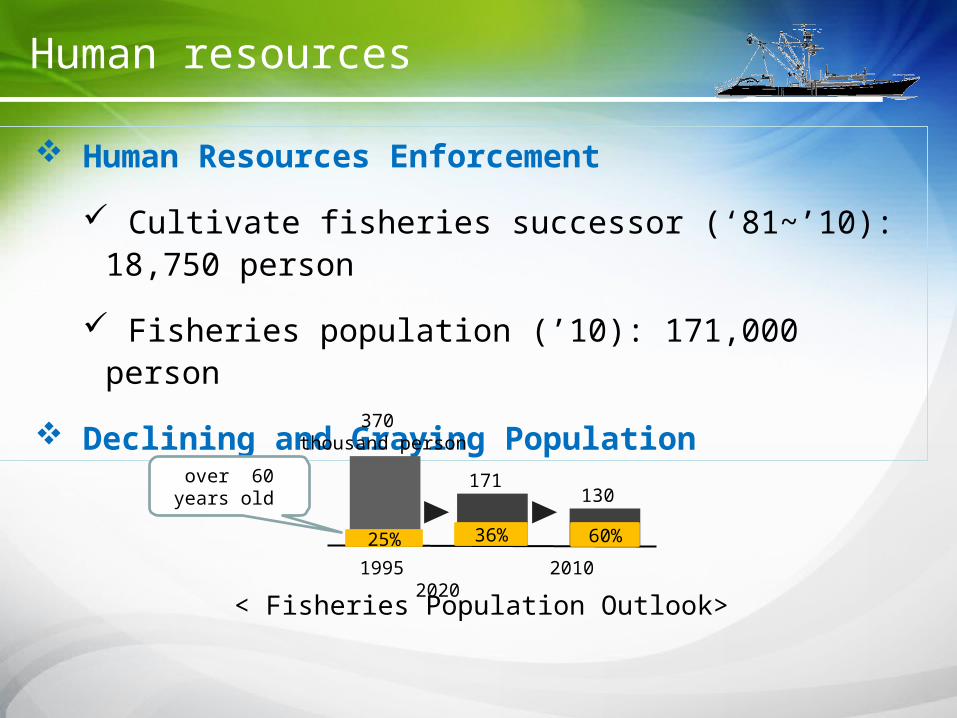
Human resources
Human Resources Enforcement
Cultivate fisheries successor (‘81~’10): 18,750 person
Fisheries population (’10): 171,000 person
Declining and Graying Population
1995 2010 2020
370 thousand person
171130
25%
over 60 years old
36% 60%
< Fisheries Population Outlook>

4. Growth momentum for fisheries

Fishing (cap-ture, aquacul-
ture)Food industry
Life indus-try
Paradigm shift

Sustainable Fisheries
Commencement of New Decommission Scheme
Application-base ⇒ government’s official authority
- target: over-fishing gear (e. g. trawl)
Stock Recovery of about 30 Species by 2020
Port (landing) Control to Prevent IUU Fishing Activities
Modernization of Fishing Vessels Crews’ welfare & low-carbon emission

Aquaculture
Abolition of access limit (step by step) => scale-up
permit farm size more than 60 ha & license lease
allow company’s entry
Expansion of aquaculture farm
coastal to off-sea, mud flat & city (fish factory)

Marine biomass
Develop mass production tech. of seaweeds & micro-algae
Extract bio-fuel, pulp, and plastic from marine biomass
* 1 million ha. of seaweeds farm: 4,500 million liters of motor fuel (50% of domestic consump-
tion)
Bio-fuel Pulp Plastic Medicine

Bio-medicine
Challenge: Difficulty in collecting marine life from nature
Solution: Aquaculture-mass production of useful marine life
Cone shell in nature mass production by aquaculture extraction

Genetic breeding
Flounder, abalone, and other major species
• 3rd generation flounder : 40%
- Faster growth rate
- Stronger for disease.
- Expected to lower production
cost by 40%
* Norway salmon: 10th generation. 300% faster growth rate. Occupies 70% of world market

Aqua-pet
World market size : 23 billion US$
Marine ornamental fish : decreased by resource deple-
tion, reef destruction
Development of new species for aquaculture

Food industry
Expanding HACCP: fishing farm to markets
Adopting Eco-labeling system (proposed by FAO)
Building Fisheries Base Processing Center
- Simple Collection -> Packing, clean & processing
Creating local food industry complex
Promoting local Food brands
SAFETY
HY-
GIENE
QUAL-
ITY

CEO
ENGINEER
Incentives for nation certification holders
Silver tech. to cope with aging society
GOLBALInternational Fisheries Education Institution
International Observer Center
Spread of success story
Reinforcement of consulting & info. sharing
Human resources

THANK YOU