minimum cost transmission tower spotting using shortest...
TRANSCRIPT

Minimum Cost Transmission Tower Spotting using Shortest-Path Algorithms with Preference...
Vol. 4, No. 1, January-June 2012 11
* Faculty of Department of Management, Haub School of Business, Saint Joseph’s University, 5600 City Avenue, Philadelphia, PA19131, E-mail: [email protected]
** Faculty of Department of Mathematics, Federal University of Santa Catarina, Campus Universitario Trindade, Florianopolis,Santa Catarina, 88040, E-mail: [email protected]
MINIMUM COST TRANSMISSION TOWER SPOTTING USINGSHORTEST-PATH ALGORITHMS WITH PREFERENCE
RELATIONSHIPS BETWEEN NODES
João Neiva de Figueiredo* & Clovis Gonzaga**
Abstract: Efficient tower spotting is the highest impact way to reduce total power transmission line costs once tower structuretypes have been selected and the transmission line route (the terrain profile) has been determined. To date there has been noprocedure that guarantees transmission tower spotting optimality since all prior attempts to solve this combinatorial problemhave been based on sliding window approaches. This paper describes a conceptual formulation, analytical model, and algorithmicsolution that guarantee spotting transmission line towers at minimum cost. Electromechanical and topographical constraints toobtaining the minimum cost are described, a state-space model using graph theory is introduced, the nodes, arcs, costs, andpaths are defined, and the optimization algorithm is presented. This methodology uses time-tested shortest-path search methodstogether with the novel concept of preference relationships between nodes, which is developed and demonstrated.Keywords: Graph theory; Expert Systems; Knowledge Engineering; Power transmission; Transmission lines; Transmissiontower spotting
INTRODUCTION
Tower spotting is the process of positioningoverhead power transmission tower structuresalong a predetermined route when a high voltagetransmission line is designed to be built. Theimportance of efficient spotting cannot beoverstressed because once the supporting structuretypes (i.e., the towers) have been designed andselected, and once the route for the transmissionline has been determined, efficient tower spottingis the single most important factor for reducing totaltransmission line construction costs.
The sequential optimization problem ofdetermining the location of transmission towersthat minimizes total transmission line costs iscombinatorial in nature, with generation of a largenumber of tower positioning options at each stage.All approaches to automate tower spotting to datehave been based on sliding window–type algorithms,where alternative tower positioning options areanalyzed and compared ahead of each tower
already selected and located on the transmissionline route. These procedures cannot guaranteeminimum cost because the search horizon (i.e.,depth of search) in each cycle is limited to a certainnumber of towers ahead of the last one that has beenpositioned, therefore not covering the full distanceup to the final point in the transmission line.
This paper introduces a formulation totransmission tower spotting that is superior tosliding-window approaches in that it considers thewhole transmission line route as the search horizon.This formulation is based on three aspects thattogether guarantee optimality and that differentiateit from prior proposed solutions. First, a state-spaceapproach is used in which the sequential decisionprocess is modeled as a graph constructed throughthe recursive application of a successor nodegenerator G as defined below. Second, the definitionof a feasibility region for the positioning of towerssubsequent to every located structure permits theconsideration of any type of mechanical and

João Neiva de Figueiredo & Clovis Gonzaga
12 I J D A I S © Serials Publications
topographical constraint in the model. Third, thenovel use of preference relationships among nodespermits the elimination of less favorable paths inthe graph and therefore permits the analysis of thewhole transmission line route despite thecombinatorial nature of the problem. The objectiveof this article is to describe this formulation and topresent its algorithm.
This section introduces the paper. The nextsection describes the problem and offers abibliographical review of other proposed solutions.The following section provides the conceptualformulation of the problem with a description ofthe graph and the successor operator G. This isfollowed by a section providing a summary ofsearch methods in graphs and describes theprocedure for analyzing node preferencerelationships. The subsequent section formalizes themodel and presents the optimization algorithm. Thesecond-to-last section offers an illustrativeapplication of the methodology and algorithmdescribed herein. The last section concludes.
THE PROBLEM
The design of a high-voltage overhead transmissionline follows several sequential steps. First theelectrical attributes of the transmission line arespecified given the characteristics of the powersystem of which it will be a component. Then thetransmission line route is specified and rigorouslysurveyed, and the mechanical characteristics of thesupporting structures (towers) of the transmissionline are defined, resulting in the selection ofstructure types to be used. It is only after these stepsare concluded that line route profile definition aswell as selection and precise positioning of each linesupporting structure, i.e., transmission towerspotting, can occur.
Description of the Problem
The process of tower spotting consists in theselection of a set of transmission towers (identifiedby their types and heights) and their respectivepositions on the line route profile such that noelectromechanical or topographical constraints areviolated. The decision variables are therefore towerpositions, types, and heights. The objective is tominimize total transmission line construction costs.
Electromechanical Constraints
Overhead transmission towers are latticed steelstructures that may be guyed or self-supportingdepending on whether pre-tensioned wires connectthe structure to ground foundations or not.Suspension towers have conductor cablessuspended from insulators while tension towershave conductors attached via insulators to the towerstructure with a bypass jumper providing electricalconnection to the next span. When tower spottingbegins, several different tower types and heightsof any or all of the aforementioned categories havealready been selected for use in the transmissionline.
Each of the selected tower types is available ina certain pre-established range of heights, and hasnumerous pre-specified mechanical limits forusage. Examples of these mechanical limits aremaximum wind span, maximum and minimumtotal weight spans, maximum and minimum weightspans to left and to right, maximum route angle,maximum vertical insulator string swing, andminimum weight on V-shaped insulators. Eachtower that is spotted along the route profile issubject to combinations of loads (e.g., wind load,weight load, etc.), which need to be within thestated limit for usage of the respective tower type.The cost of each spotted tower is a function of itstype and height.
Topographical Constraints
The transmission line route profile is responsiblefor the topographical constraints to which eachspotted tower is subject in a transmission line. Themain such topographical constraints are theminimum acceptable conductor ground clearances(i.e., the conductor safety clearances), stretches ofthe profile where spotting is impossible (e.g., roador river crossings – which usually also have largersafety clearance restrictions), and points ofcompulsory spotting on the route profile.
The conductor cable takes the shape ofcatenaries – that can be approximated as parabolas- between transmission towers. The distance fromthese catenaries to the ground must be larger thanthe safety clearance at every point of the routeprofile, which is equivalent to say that virtual safetycatenaries (at all points lower than the conductor
Minimum Cost Transmission Tower Spotting using Shortest-Path Algorithms with Preference...
Vol. 4, No. 1, January-June 2012 13
catenaries by the safety clearance) must be tangentto the topographical profile. In this formulation (andpaper) all figures depict safety catenaries (whichare tangent to the route profile), and all transmissiontowers are depicted with the standard line safetyclearance subtracted from their heights.
Spotting each Tower
The process of spotting any tower on the profilebegins with a tower of known position, from whichthe safety catenary that is tangent to the terrain islaunched. Given this catenary, towers of allavailable heights can be spotted on the profile,generating numerous location options for thesubsequent transmission tower. It should be clearthat the number of possible transmission lineconfigurations grows exponentially given the largenumber of alternative locations for each subsequenttower, resulting in the need for a sequential decisionmechanism for selecting promising towers and theirlocations.
The various mechanical tensions to which anygiven transmission tower is submitted can only bedetermined when the positions and heights of thetwo towers adjacent to it (the precedent andsubsequent towers) are known. In other words, thetype (and consequently the cost) of a spottedtransmission tower of a given height depends onthe positions and heights of both the tower thatprecedes it and the tower that follows it on the routeprofile.
Formal Statement of the Problem
Optimal transmission tower spotting consists indetermining the precise location, type, and heightof all the towers of a transmission line such that itscost is minimized subject to a set of electromechanicaland topographical constraints, given a pre-chosenset of transmission tower types and heights and apre-established line route profile. Theelectromechanical constraints define usage limits fortowers of each type, the most important constraintsof which are maximum wind span, and maximumand minimum weight span. The route profile isrepresented through the coordinates x and y, whichare potential spotting positions for the completetransmission line as well as additional informationfor each such coordinate: (i) the specification ofminimum clearance heights at each point, which is
the minimum clearance from the ground to theclosest of the three phase cables; (ii) the specificationof stretches where spotting is prohibited; and (iii)the specification of compulsory tower locations. Thisis a sequential decision optimization problem withan infinite number of possible combinations.
Literature Review
Operations Research techniques have beenroutinely used to solve cost minimization problemswhich are at the core of applied managementscience. Recent examples in manufacturing andindustrial performance were offered by Wang,Moraga, and Ghrayeb (2011) who solve a flowshopscheduling problem and Berrah et al. (2011) whopresent a methodology for continuous industrialperformance improvement. In the management oftransportation recent examples include a hybridmodel for vehicle routing when demand isstochastic developed by Murakami and Morita(2010) and a novel heuristic approach to autoallocation over a fixed number of routes offered byDas, Hossain, and Gupta (2010). Baykasoglu andKaplanoglu (2011) evaluated two commonly usednon-recurrent load consolidation approaches.Moeeni, Chan, and Repogle (2011) offered a stagedmodel to solve a bi-criteria staff scheduling problemand Dias (2009) solved the airport gate assignmentproblem when side constraints such as adjacent gateneeds and time restrictions. This paper develops amethodology to solve a management scienceproblem which is specific to the power systemindustry, that of minimizing the cost of transmissionlines through the optimal positioning of eachstructure (i.e., tower) supporting the conductor.
The first references mentioning algorithms forautomating tower spotting were Converti et al.(1962) and Popp et al. (1963), which introducedsliding-window–based approaches with anexhaustive search of spotting options in a shortstretch ahead of the most recently spotted tower.For example, the search horizon (or search depth)was three towers ahead of each spotted tower inthe latter application. Variations of the slidingwindow approach using different depths anddistinct optimization methods have since beenreported. The first reference using graph theory andshortest-path search methods was Neiva deFigueiredo et al. (1978), which used a longer horizon

João Neiva de Figueiredo & Clovis Gonzaga
14 I J D A I S © Serials Publications
beyond each spotted tower and allowed fordifferent horizon lengths as a function of theruggedness of the terrain ahead. Other referencesreport the use of different mathematicalprogramming techniques, such as dynamicprogramming by Mitra and Wolfenden (1968), forexample. Because sliding-window approaches do notcover the entire route profile in each cycle, all ofthese applications fall short of guaranteeingminimum cost. Neiva de Figueiredo and Gonzaga(2003) attempt an approach covering the wholelength of the terrain profile but do not specify thesuccessor operator � with complete precision anddo not detail the pruning process based onpreference relationships between nodes. Othersolutions reported in the academic and practitionerliterature use a variation of the sliding windowapproach and therefore do not guarantee optimality.
CONCEPTUAL FORMULATION
The problem is herein modeled as a minimum costpath search problem in an ordered and recursivelyconstructed graph.
Introduction to Graph Theory
A graph is characterized by a set of nodesN = {n1, n2,. . .} and a set of arcs that are orderedpairs (ni, nj) of nodes. A cost c(ni, nj) � 0 is associated
to each arc. A path is a sequence � � � � �1 2 3
( , , ,...)i i i i
of connected nodes. The cost of a path is the sum ofthe costs of the arcs that form that path. Given asource node s � N and one or more target node(s)T � N, the minimum cost path search problem is tofind among all the paths that connect to any nodein T, the one with lowest cost.
In the formulation herein, the sets of nodes andarcs are not known a priori: we define a sucessor nodegenerator �, that determines, for each node n, theset of nodes �(n) (sucessors of n) such that nj � �(n)if and only if (n, nj) is an arc in the graph. The graphis built recursively from its source s through repeatedapplications of the successor node generator �.
Problem Formulation: Nodes, Arcs, Costs, andPaths
We now begin the formulation of the problemthrough the definition of the graph’s nodes, arcs,
costs, and paths. What follows below is thedefinition of the successor node generator �.
Figure 1: Representation of two Adjacent Nodes. Darkertowers are of known type
Nodes
A node ni in the graph is defined by a spotted towerwith known height and type followed by a towerwith known location and height but unknown type.A node ni is completely characterized by the
quintuple: � 1 1 1 2 2( , , , , ),i i i i iin x h T x h where xj is the x
coordinate where tower j, has been spotted, hj isthe height of tower j, Tj is the type of tower j asdepicted in Fig. 1. A node the second tower of whichcoincides with the end of the line route profile is atarget node as defined above. Fig. 1 represents anode.
Arcs
An arc is an ordered pair of nodes with onecoinciding tower. More specifically, an arc connectstwo nodes, the first of which has a tower withknown type, location, and height and a tower withknown location and height but unknown type. Inthe second node of this arc the first tower is thesame as the second tower in its predecessor node,with its type already known. The three towers inthese two nodes are spotted having satisfied alltopographical and electro-mechanical constraintsto which they are subject.

Minimum Cost Transmission Tower Spotting using Shortest-Path Algorithms with Preference...
Vol. 4, No. 1, January-June 2012 15
Costs
The cost associated with arc (ni, nj) is the cost of themiddle tower in this arc, i.e., the one which is thesecond tower in the origin node of the arc andsimultaneously the first tower in the destinationnode of this arc (the second tower in node ni andthe firs tower in node nj). Both the type and theheight of this middle tower in the arc are known,and therefore its cost is also known.
�1 2 .jh h These successor nodes are obtained byadding all the subsequent towers such that anincrease in each tower’s respective x coordinatewould violate at least one of the topographical orelectromechanical restrictions as depicted in Fig. 3.This condition is met in two steps. In the first step,different catenaries are plotted from the towerwhose type has not yet been defined (the secondtower in node ,n with x coordinate 2x and height
2h ) resulting in a specific feasibility region for eachnode – more than one catenary is drawn because todifferent temperature and adjacent weight spanspecifications correspond different catenaries. Theresulting feasibility region determines possibleposition for cable attachments to the next tower,i.e., feasible positions and heights for the next tower.The second step consists in spotting the subsequenttowers in positions such that a change in at leastone of its coordinates would violate a restricion.
Launching Catenaries to Define the FeasibilityRegion
First a catenary with weight per unit of lengthcorresponding to the warmest weather conditionsis launched from the tower whose type has not yetbeen defined (the second tower of node ,n with x
coordinate 2x and height 2h ). This catenary is
tangent to the terrain profile and is a “lower bound”for positioning the height of the next tower. Thiscatenary is obtained by minimizing the distancebetween the tower and the axis of parabolicapproximation of the catenary, given by
� ��� �
�,
2t st
t
y h yx x Ld
W x x
for (x, y) on the terrain profile and x � xt. In thisequation, (xt, yt) and ht are respectively thecoordinates and the height of tower t, hs is the heightof cable on tower t, W is the weight of the cable perunit of length in warmest weather and L is thecable’s longitudinal traction.
The catenary described in the previousparagraph is the catenary that is tangent to theprofile going forward from the last tower that hasbeen spotted. In addition to this catenary, anddepending on the electromechanical constraints
Figure 2: Representation of the arc formed by the nodes ofFig. 1, and of a forward path
Paths
A path is an ordered sequence of nodes connectedby arcs. This path represents a sequence of spottedtowers that satisfy all topographical andelectromechanical constraints to which they aresubject as shown in Fig. 2. The last tower in a path,which is the second tower in the last node of a path,is of unknown type unless it is the last tower in theline route profile the spotting of which is beingoptimized. Of all the paths that cover the whole lineroute profile, the minimum cost path is the optimalsolution for the transmission tower spotting problem.
Problem Formulation: the Successor NodeGenerator
The successors to a node � 1 1 1 2 2( , , , , )n x h T x h are
nodes � 1 1 1 2 2( , , , , )j j j j j jn x h T x h for which �1 2jx x and
João Neiva de Figueiredo & Clovis Gonzaga
16 I J D A I S © Serials Publications
governing the use of the selected towers, othercatenaries must be launched and investigated tocompletely define a region of possible cableattachment positions on the next tower given thepreceding tower’s type. This is the feasibility regionfor the respective tower and should be verified forall relevant electromechanical constraints.
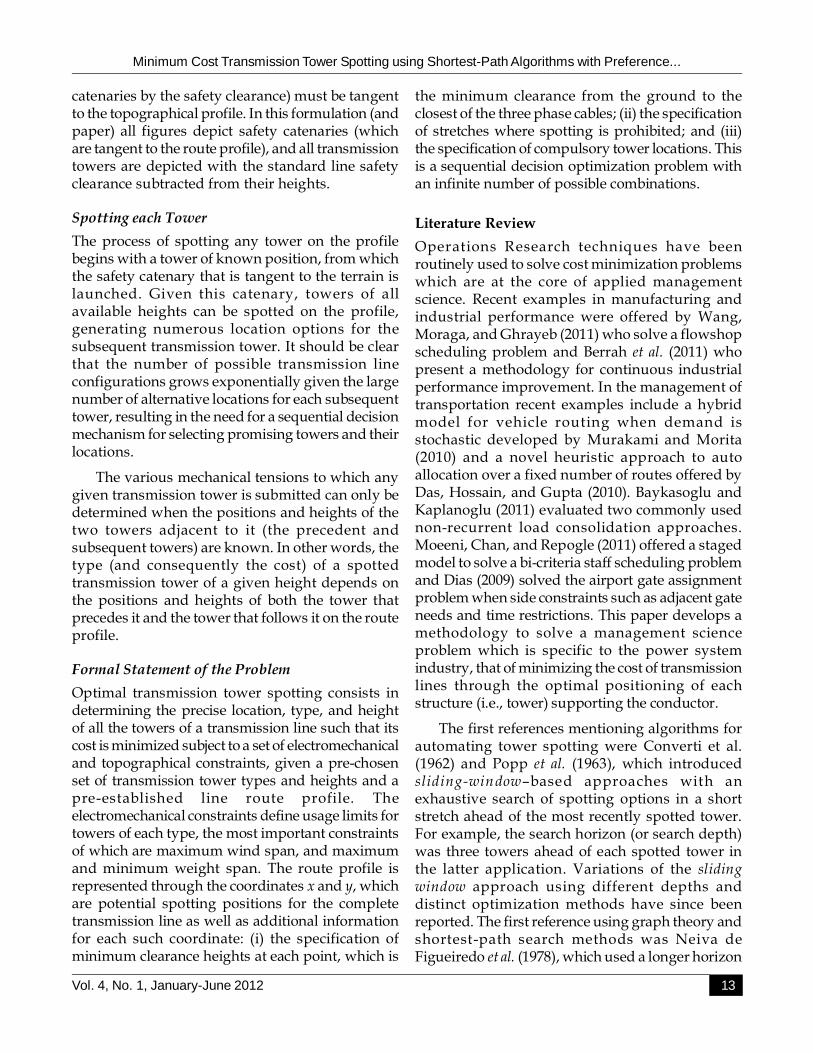
Depending on the position and height of thetower preceding tower t, the catenary tangent tothe terrain may not be the lower bound for thefeasibility region. If the preceding tower issufficiently low (i.e., if tower t is located onsufficiently higher ground than the towers adjacentto it), maximum weight span limits for tower t tobe of a given type must be verified – in warmestconditions. Likewise, if the preceding tower issufficiently high (i.e., if tower t is located onsufficiently lower ground than the two towersadjacent to it) minimum weight span limits fortower t to be of a given type must also be verified –in coolest conditions. The next tower needs to bespotted at the highest of the three catenariesdescribed above – these three catenaries provide alower bound of feasibility for cable height in thespace immediately following tower t for this towerto be of a given type.
There also is an upper bound of feasibility forcable height in the space immediately followingtower t for it to be of a given type - this upper boundacts as a limiting factor in conditions that areopposite to the ones described in the previousparagraph. If the preceding tower is sufficiently low(i.e., if tower t is located on sufficiently higherground than the towers adjacent to it), minimumweight span limits for tower t to be of a given typemust be verified – in coolest conditions. Likewise,if the preceding tower is sufficiently high (i.e., iftower t is located on sufficiently lower ground thanthe two towers adjacent to it) maximum weightspan limits for tower t to be of a given type mustalso be verified – in warmest conditions. The nexttower needs to be spotted at the lowest of the twocatenaries described in this paragraph– these twocatenaries provide an upper bound of feasibility forcable height in the space immediately followingtower t for this tower to be of a given type.
Spotting Towers and Generating the Graph
The upper and lower bounds described in theprevious section determine a well-defined regionof feasibility for the height (and coordinates) of thetower that is subsequent to tower t. Outside of thisregion at least one of the electromechanical ortopographical constraints for tower t to be of a giventype will not be met. For this reason, only towerswhose heights fall into the feasibility region can bespotted.
The second step consists in spotting towers inthe feasibility region in positions such that a changein at least one of its coordinates would violate arestriction. Each tower that is spotted defines thetype (and cost) of the preceding tower – that is thefirst tower of the successor nodes. The successoroperator � spots subsequent towers adjusting towerheights within the feasibility regions of each node.
The application of the successor operator � asdescribed in this section permits the creation ofsuccessors to any node. The number of successorsto each node will depend on the options of towerheights and on the electromechanical constraintsgoverning the use of each structure. The repeatedapplication of the successor operator � allows forthe construction of a graph through an iterativeprocess that eventually will cover all the feasibletower spotting possibilities.
Figure 3: Results of One Application of the SuccessorOperator, with Depiction of the Feasibility Regionfollowing the Second Tower

Minimum Cost Transmission Tower Spotting using Shortest-Path Algorithms with Preference...
Vol. 4, No. 1, January-June 2012 17
SEARCH METHODS IN GRAPHS
Basic results on search algorithms in graphs arepresented in this section. For a more detaileddescription, please see Hart et al. (1968), Nilsson(1971), and Gonzaga (1978).
Search Algorithms in Graphs
A simple search algorithm in graphs consists oflisting all possible paths having the source node andchosing the one(s) that reach(es) the terminal nodeT at minimal cost. Better algorithms construct a listof paths from the source node s, but only store thelowest cost path between s and each node in thegraph. The algorithms store lists of paths and eachiteration constructs new paths through theexpansion of the last node in a given path, i.e.,through the application of the successor operatorto this node.
An inefficient way to store paths with k nodesof k+1 nodes would be to represent them
respectively it as the n-tuples � � � � ��� �1 2
( , , , ),ki i i i
�� � ���1 2 1( , , , , ),
kj j j j jkn n n n with � ��� �1 1
, , .k ki j i jn n n n
However, it is more efficient to characterize the path�j through its terminal node and a pointer to �i.Therefore the listed paths are represented as triplets�i = (ni, ci, pi), where ni is the terminal node of thepath, ci is the cost associated to the path, and pi is apointer to �pi. When necessary, the construction ofthe complete path is achieved through backtrackingon the list.
Each iteration of search algorithms selects alisted path and expands it by applying a successoroperator to the terminal node of the path. Thereare two lists of paths: the list of closed paths,containing paths that have already been expanded,and the list of open paths, containing paths thathave not yet generated successor nodes. At eachiteration an open path is selected and expanded.The different criteria to chose the path to beexpanded characterize the different searchalgorithms: horizontal search (selection of theoldest in the list, i.e., FIFO), vertical search(selection of the youngest in the list, i.e., LIFO),Dijkstra’s algorithm (selection of the lowest costpath), A* algorithm (selection of the mostpromising path), for example. What follows is adescription of a typical such algorithm.
Step 0: initialization. Identify listed elementsas triplets ��= (n, c, p), as described above. Creat alist of open paths and a list of closed paths, initiallyempty. Introduce in open the element �0 = (s, 0, –),where s is the source node, the cost is zero and thepointer is empty.
Step 1: selection. Choose an element
�� ( , , )n c p in open, trasfer � to closed. If ��T
(target), go to End.
Step 2: expansion. Apply the successor operator�� to node ,n obtaining its successors
� � � ��1( ) { , , },qn n n and construct successor paths
� � �( , ( , ), ),j j j jn c c n n p j = 1, . . . , q, where
� �1 ... qp p is a pointer to �.
Step 3: eliminations. Compare each successor�j with all listed elements. If there is any listedelement with the same terminal node � �� � �( , , ),jn c pexecute the following elimination: if �� ,jc c discard� ;j otherwise, if �� is in the list of open paths, discard�� . Closed paths are never eliminated. Add theremaining successors to the list of open paths andreturn to Step 1.
End. An optimal path was found. Reconstructthis path by backtracking on the list of closed pathsusing the pointers retroactively.
Two search algorithms are primarily used in thispaper: Dijkstra’s algorithm and the A* algorithm.
Dijkstra’s algorithm. In step 1, the elementchosen is the one of lowest cost among those in theopen paths list. As a result, it is possible to provethat all paths � in the closed paths list are optimal,i.e., they are the lowest cost paths from the sourcenode s to each node � . When a path for which theterminal node is target node T is closed, the problemhas been solved.
A* algorithm. In certain problems there areprocedures that associate to each node n ��N anunderestimate h(n) for the cost of an optimal pathfrom n to the target T. Tipically these estimates areobtained through the resolution of a relaxedproblem, in which some restrictions of the originalproblem are not present. In step 1, the A* algorithmselects the element � with smallest value for

João Neiva de Figueiredo & Clovis Gonzaga
18 I J D A I S © Serials Publications
cj + h(nj) among all the elements �j in the open pathlist. As a result, the cost comparison for the step 1selection is an underestimate of the total cost path.If it can be proven that h(n) is indeed anunderestimate for every node n, then all paths inthe closed path list are optimal as well. The probelmis also solved when when a path is closed for whichthe terminal node is target node T.
Preference Relationships between Nodes
In certain problems it is possible to compare nodesin terms of proximity to the target even if there areno estimates as described in the previousparagraph. In other words, there may be a partialorder � (a preference relationship) among nodesin a graph. Preference relationships among nodesimprove the efficiency of optimization algorithmsin graphs without compromising optimality, asdemonstrated by Gonzaga (1973). These preferencerelationships are now formalized.
Two nodes n1 and n
2 may or may not be
comparable. If they are comparable, the followingmust hold:
If �1 2 ,n n then a minimum cost path betweenn
1 and T has a lower (or equal) cost than any path
between n2 and T, that is, n
1 is “closer” to T than n
2.
It should be clear that �n n always holds.
The elimination criterion in step 3 becomes:compare �j to each listed element ��� � � �( , , )n c p anddo:
If �� jc c and � � ,jn n discard .jn
Otherwise, if�� is in the open path list, � �,jc c and
�� ,jn n then eliminate �n from this list (elements inthe closed path list are never eliminated).
It is not difficult to show that an optimal path isnever eliminated by a non-optimal path: assumethat a path �eliminates another path �� . For each
n � T, let ˆ( , )c n T be the cost of an optimal path from
n to T. It follows from the elimination rule that
� �,c c and it follows from the preference
relationship ��n n that � �ˆ ˆ( , ) ( , ).c n T c n T The cost of a
path starting with � is lower than or equal to� � �� �ˆ ˆ( , ) ( , ),c c n T c c n T and therefore the path �� can
be ignored.
Rules of preference of this sort are relativelycommon in sequential decision problems, and are
an integral component of the tower spottingproblem as described below.
OPTIMIZATION
The conceptual formulation and the search methodsin graphs described above provide the groundworkfor the optimization model, which is now described.
The Basic Optimization Model
The Dijkstra algorithm can be applied directly tothe problem as formulated above, where the graphrepresents different possible transmission towerspotting configurations. The A* algorithm, thatreduces the number of expansions in the Dijkstraalgorithm, depends on an underestimate of the costof the transmission line between any given nodeand the target node – the last tower in thetransmission line. This underestimate can easily beobtained through the calculation of the cost of afictitious remaining line of the same length on a“perfect topographical profile”, i.e., on a roughlysinusoidal profile in which the towers are spottedon the “peaks” and in which the “valleys”correspond to the catenaries, and have their exactshape.
Furthermore, because the problem is continuousin nature the x coordinates are continuous) only inthe rare cases of compulsory spotting locations willdifferent paths possibly have the same terminalnode. As a consequence, there will be very few patheliminations if the Dijkstra or the A* algorithms areused - the size of the lists could grow exponentially.Even with the use of tolerances for comparisonsamong nodes the number of eliminations could beinsufficient. The best method to reduce the size ofthe lists is to use the preference relationships amongnodes.
Node Preferences in Transmission Tower Spotting
The paper now introduces a preference relationshipbetween nodes that permits the detection of certainsituations in which a node is “closer” to theobjective than another node. This preferencerelationship permits the improvement of Dijkstraand A* algorithms in Step 3, permitting theelimination from the list of open paths all elementswhose terminal nodes are equal or worse than(formally, “less preferable than”, as defined below)

Minimum Cost Transmission Tower Spotting using Shortest-Path Algorithms with Preference...
Vol. 4, No. 1, January-June 2012 19
the node resulting from a given expansion andwhose paths have a higher cost cj (or total estimatedcost cj + hj in the case of the A* algorithm). Asdescribed formally above, �i = (ni, ci, pi) eliminates �j= (nj, cj, pj) if ni is preferable to nj and if cj � ci, that is,if �i has a better terminal node and is of lower orequal cost. This allows for a substantial reductionin the size of the list of open paths and therefore anincrease in the efficiency of the process. Fig. 4 showsan example of two nodes satisfying a preferencerelationship.
Consider 1 1 1 2 2( , , , , )i i i i ix h T x h and 1 1 1 2 2ˆ ˆˆˆ ˆ( , , , , ),x h T x h
that identify respectively nodes ni e n . Let ei and ebe the axes of the catenaries launched from thesecond tower of each of these respective nodes.
�ˆ in n (node n is preferable to node ni) if and onlyif:
�1 1ˆ ix x (1)
�2 2ˆ ix x (2)
�2 2ˆ ih h (3)
�ˆ ie e (4)
Condition (1) means that the x coordinate of thefirst tower of node n (a tower with a known type)is greater than or equal to the x coordinate of thefirst tower of node ni (also a tower of known type),that is, this latter tower is not closer to the end ofthe profile than the former.
Condition (2) means that the x coordinate of thesecond tower of node n (a tower of yet unknowntype) is greater than or equal to the x coordinate ofthe second tower of node ni (also a tower of yetunknown type), that is, this latter tower is not closerto the end of the profile than the former.
Condition (3) means that the second tower ofnode n (a tower of yet unknown type) is smallerthan or equal to the second tower of node ni (also atower of yet unknown type), that is, the height ofthe second tower of node ni is not smaller than theheight of the second tower of node n .
Condition (4) means that the x coordinate of theaxis of the catenary launched from the second towerof node n is greater than or equal to the x coordinateof the axis of the catenary launched from the secondtower of node ni, that is, the axis of the catenary
launched from this latter tower is not closer to theend of the profile than the axis of the catenarylaunched from the former.
Figure 4: Example of Two Nodes Satisfying a PreferenceRelationship
When conditions (1), (2) and (4) are metsimultaneously, it follows that node n is furtherahead on the profile than node ni. Condition (3)guarantees that if the second towers in each nodeare of the same type, node n ’s second tower willnot be more expensive than node ni’s second tower.
Justification of Node Preference Validity
The preference relationship is used to eliminatealready listed paths as well as newly generatedpaths: informally, one path eliminates anotherwhen its cost is inferior and its teminal node is better(preferable). It is necessary, therefore, todemonstrate that given two nodes n and ni if �ˆ ,in nthen the cost of an optimal spotting configurationfrom node n to the end of the profile is less than orequal to the cost of any spotting configuration fromnode ni to the end of the profile.
To verify that this statement holds, consider twonodes � 1 1 1 2 2
ˆ ˆˆˆ ˆ ˆ( , , , , )n x h T x h and � 1 1 1 2 2( , , , , )i i i i i in x h T x hand assume that n is preferable to ni. Consider atower spotting configuration from the second towerof node ni to the end of the profile. It is shown belowthat the same tower spotting configuration can beconstructed from the second tower of node n witha lower (or equal) cost.

João Neiva de Figueiredo & Clovis Gonzaga
20 I J D A I S © Serials Publications
It suffices to examine the first tower following
2ix in the respective tower spotting configuration.
Let 3ix be its x coordinate. Since �ˆ ,ie e the catenary
whose axis is e goes under the catenary whose axis
is ei beyond the latter catenary’s tangency point withthe terrain profile. As a result, the first tower of theremaining stretch of the profile, i.e., ahead of � ,can be spotted at exactly the same coordinate
3 ,ixwith a possible slack in the catenary, so the cost ofthe remaining transmission line is the same in bothcases.
It is now necessary to show that the cost of thesecond tower of node ni is greater than or equal tothe cost of the second tower of node n . Frominequations (1), (2), and (4) it follows immediatelythat the wind span and the weight span of thesecond tower in node n are smaller than or equalto, respectively, the wind span and the weightspan of the second tower of node ni. It follows thatthe same tower type is acceptable in both cases.Since �2 2
ˆ ,ih h the cost of the second tower ofnode n is less than or equal to the cost of thesecond tower of node ni, completing thedemonstration.
This preference relationship can easily beincorporated to the process of elimination ofelements in the open path list and the eliminationof elements just generated in the expansion phaseof each of the optimization algorithms describedabove. In each cost comparison between elementsof nodes comparable to those created through theexpansion process, i.e., through the application ofthe successor operator to an element in theopen path list, it is sufficient to compare the costwith those elements whose terminal nodes areequal to or preferable than the terminal nodesof the list. This procedure improves theperformance of the optimization algorithmsdramatically because it reduces the size of the openpath list without loss of efficiency in finding theminimum cost path, i.e., while still guaranteeingoptimality.
ILLUSTRATION OF THE METHODOLOGY
The methodology is illustrated below with theplotting of a short stretch of a 500 KV transmissionline Southern Brazil.
Table 1500 KV Transmission Line Electro-mechanical
Characteristics
Line Characteristics
Basic Span 500 meters
Ground Clearance 10 meters
Conductor Characteristics
Conductor Type Grosbeak
Overall Diameter 25.15 mm
Wind Pressure 77 kg/m2
Weight of Conductor 1.299 kg/m
Full Wind Tension 4000 kg
High Temperature Tension 1968 kg
Low Temperature Tension 2418 kg
Tower CharacteristicsSuspension TowersAngle Towers
S-5 R-5 P-5 D-5 A-5
Max Wind Span (m) 450 550 700 1194 1500
Max Weight Span (m) 675 825 1050 1500 1500
Min Weight Span (m) 0 0 0 -500 -500
Max Deviation Angle (°) 3 3 10 25 65
The length of this stretch of transmission linewas 22 kilometers, and the terrain was not flat, i.e.,the profile included hills and various stretches ofinclines, although it was not mountainous.Minimum ground clearance was ten meters andboth hot-sag- and cold-sag-curves were calculatedto ensure topographical constraints were met. Themethodology described herein is robust to differentweather, profile, ground-wire, and towerelectromechanical conditions and restrictions, suchas ice loading, lateral terrain inclination, ground-wire catenary sag, and insulator swing limits, andis also robust to the use of topographical constraintssuch as lateral inclines, stretches without towers,and different ground clearance levels, although notall of electromechanical and topographicalrestrictions were present in this illustrativeexample. Please see Table 1 for a summary ofelectro-mechanical characteristics of the high-voltage transmission line, i.e., the conductor cable.
This transmission line was designed with fivetypes of towers, three of which were suspensiontowers and two of which were angle towers. Themechanical characteristics of each type of tower arealso depicted in Table 1. These five tower types, S-5, R-5, P-5, D-5, and A-5, in growing order ofrobustness, had different tower heights available

Minimum Cost Transmission Tower Spotting using Shortest-Path Algorithms with Preference...
Vol. 4, No. 1, January-June 2012 21
included 46 towers for a total cost of US$ 6.1 million,representing meaningful savings when comparedto the traditional method. For this stretch of 22kilometers, over 3.5 million nodes were generatedwith more than 225,000 paths added to the closedpaths list. The list of open paths varied in size from4,000 to 20,000 paths at any point in time, dependingon the specific terrain characteristics at each point.More than 280,000 open paths were eliminated bypreference relationships.
Table 2Transmission Tower Costs by Height and
Type (in thousands of US$)
Heights Suspension towers Angle towers(meters) S-5 R-5 P-5 D-5 A-5
15.0 110.8 169.5
16.5 112.7 173.0
18.0 115.4 175.4 311.6 423.0
19.5 117.7 129.7 179.4 315.2 427.9
21.0 120.6 131.8 184.1 319.4 433.4
22.5 123.2 134.5 188.6 324.8 439.0
24.0 133.3 136.8 199.7 330.0 445.8
25.5 125.6 140.2 202.5 334.2 451.0
27.0 138.5 142.7 206.1 353.7 481.8
28.5 141.1 151.0 210.8 357.9 487.4
30.0 143.4 153.7 215.3 363.3 492.9
31.5 143.4 156.0 226.1 368.5 499.8
33.0 159.3 228.3 372.7 504.9
34.5 161.9 232.5 393.5 512.2
36.0 164.4 237.2 397.8
37.5 241.7 403.2
39.0 255.8 408.3
40.5 258.5 412.6
42.0 262.2 417.6
43.5 266.9
45.0 271.4
46.5 274.6
as shown in Table 2. This table also shows the costsof each tower type and height in thousands of USdollars.
Figures 5 and 6 show the results, with both cold-sag and hot-sag catenaries. The optimal result
Figure 5: Optimal Tower Spotting Illustration
Figure 6: Optimal Tower Spotting Illustration Detail
This is a representative illustration of themethodology because of the line voltage (500 KV),the number of different tower heights and types,and the mechanical characteristics of the line. Figure5 presents the terrain profile with towers spottedand Figure 6 depicts the detail of a particularlychallenging stretch in the terrain profile. Thesefigures show tower heights and catenaries with theground clearances already subtracted so the hot-sag catenary curves are tangent to the terrain.
CONCLUSION
This paper presented an algorithm to spottransmission towers on a pre-selected topographicalprofile at minimum cost. This algorithm representsan improvement over previous approaches, whichwere all based on sliding window mechanismsbecause the optimization horizon is the entiretopographical profile. As a result of the use ofpreference relationships between nodes, the sizes

João Neiva de Figueiredo & Clovis Gonzaga
22 I J D A I S © Serials Publications
of the necessary lists in this combinatorial problemare significantly reduced, enhancing the efficiencyof the process and guaranteeing optimality. Thepaper described the conceptual formulation,provided an overview of the main topics in graphtheory related to search methods, introduced theoptimization model that was developed, andpresented the algorithms used. The maincontribution to the literature is the development ofa model that guarantees optimality of the resultbecause, in the absence of pruning, all possiblealternatives are considered. All previous methodsin the literature were based on sliding windowapproaches, so this is the first time that a methodwith such a guarantee has been developed.
References[1] Baykasoglu, A. and Kaplanoglu, V. (2011), Evaluating the
Basic Load Consolidation Strategies for a TransportationCompany through Logistics Process Modeling andSimulation, International Journal of Data Analysis Techniquesand Strategies, 3(3): 241-260.
[2] Berrah, L., Montmain, J., Mauris, G., and Cliville, V.(2011), Optimizing Industrial Performance Improvementwithin a Quantitative Multi-criteria AggregationFramework, International Journal of Data AnalysisTechniques and Strategies, 3(1): 42-65.
[3] Converti, V., Hyland, E., and Tickle, D. (1962), OptimizedTransmission Tower Spotting on Digital Computer, PowerApparatus and Systems, Part III. Transactions of the AmericanInstitute of Electrical Engineers, 81: 55-61.
[4] Das, P., Hossain, S., and Gupta, A. (2010), A Meta-heuristicApproach to Car Allocation Problem to ReduceTransportation Cost over a Fixed Number of Routes,International Journal of Data Analysis Techniques andStrategies, 2(1): 85-102.
[5] Dias, N. (2009), The Airport Gate Assignment Problemwith Some Practical Constraints, International Journal ofApplied Management Science, 1(3): 315-323.
[6] Gonzaga, C. C. (1973), Estudo de algoritmos de busca emgrafos e sua aplicação a problemas de planejamento),Unpublished doctoral dissertation, Federal University ofRio de Janeiro, Brazil. (In Portuguese).
[7] Hart, P., Nilsson, N., and Raphael, B. (1968). A formalbasis for the heuristic determination of minimum costpaths, IEEE Transactions on Systems, Science and Cybernetics,4, 100-107.
[8] Mitra, G. and Wolfenden, K. (1968), A ComputerTechnique for Optimizing the Sites and Heights ofTransmission Line Towers—a Dynamic ProgrammingApproach, The Computer Journal, 10, 347-351.
[9] Moeeni, F., Chan, Y., and Repogle, S. (2011), Stage-wiseSolution to a Bicriteria Staff-scheduling Model,International Journal of Applied Management Science, 3(1):52-71.
[10] Murakami, K. and Morita, H. (2010), Hybrid Model forthe Vehicle Routing Problem with Stochastic Demand,International Journal of Applied Management Science, 2(3):224-238.
[11] Neiva de Figueiredo, J. and Gonzaga, C. C. (2003),Aplicação de métodos de busca de grafos com nósparcialmente ordenados à locação de torres detransmissão, Pesquisa Operacional, 23 , 209-220. (InPortuguese).
[12] Neiva de Figueiredo, J., Gonzaga C. C., and Maculan, N.(1978), Localização ótima de torres de transmissãoutilizando teoria de grafos, Revista Brasileira de PesquisaOperacional, 2, 12-22. (In Portuguese).
[13] Nilsson, N. (1971), Problem Solving Methods in ArtificialIntelligence, New York: McGraw-Hill Computer ScienceSeries.
[14] Popp, R., Dabekis, C., and Fullerton, F. (1963), ElectronicComputer Permits Optimized Tower Spotting of ElectricTransmission Towers, IEEE Transactions on PowerApparatus and Systems, 82(66): 360-365.
[15] Wang, N., Moraga, R. J., and Ghrayeb, O. (2011), AModified Rapid Access Heuristic for FlowshopScheduling Problem, International Journal of AppliedManagement Science, 3(4): 327-340.