minda industries ltd quarterly results update (q2 fy`20 ... · such forward-looking statements are...
TRANSCRIPT

Minda Industries LtdQuarterly Results Update (Q2 FY`20)November 2019

2/62 / 462/16
This presentation and the accompanying slides (the “Presentation”), has been prepared by Minda Industries Limited (the “Company”), solely forinformation purposes and do not constitute any offer, recommendation or invitation to purchase or subscribe for any securities, and shall not form thebasis or be relied on in connection with any contract or binding commitment whatsoever. No offering of securities of the Company will be made exceptby means of a statutory offering document containing detailed information about the Company.
This Presentation has been prepared by the Company based on information and data which the Company considers reliable, but the Company makes norepresentation or warranty, express or implied, whatsoever, and no reliance shall be placed on, the truth, accuracy, completeness, fairness andreasonableness of the contents of this Presentation. This Presentation may not be all inclusive and may not contain all of the information that you mayconsider material. Any liability in respect of the contents of, or any omission from, this Presentation is expressly excluded.
Certain matters discussed in this Presentation may contain statements regarding the Company’s market opportunity and business prospects that areindividually and collectively forward-looking statements. Such forward-looking statements are not guarantees of future performance and are subject toknown and unknown risks, uncertainties and assumptions that are difficult to predict. These risks and uncertainties include, but are not limited to, theperformance of the Indian economy and of the economies of various international markets, the performance of the auto ancilliary industry in India andworld-wide, competition, the company’s ability to successfully implement its strategy, the Company’s future levels of growth and expansion,technological implementation, changes and advancements, changes in revenue, income or cash flows, the Company’s market preferences and itsexposure to market risks, as well as other risks. The Company’s actual results, levels of activity, performance or achievements could differ materially andadversely from results expressed in or implied by this Presentation. The Company assumes no obligation to update any forward-looking informationcontained in this Presentation. Any forward-looking statements and projections made by third parties included in this Presentation are not adopted bythe Company and the Company is not responsible for such third party statements and projections.
Safe Harbor

3/63 / 463/16
Quarterly UpdatePresentation

4/64 / 464/16Performance Highlights for the Quarter
Favourable Factors Un-Favourable Factors
• Improved profit contribution from Associates and JVCost Management and Austerity measures kept overheads in check.
• New Products have started contributing to the top line
• Benefit from corporate Tax reduction
• Volumes impacted due to depressed demand.
Lower capacity utilization

5/65 / 465/16Business Review
Switches
Lighting
Acoustics
Light Metal Technology
Others
Secured additional Business from MSIL new Model
HBA business is restructured with one 2W OEM01
Got additional business in Renault and MSIL (S-Presso)
Sales in line with OE, Maintained EBIDTA Y-o-Y
02
Domestic business maintained despite volume cuts by OEM
Clarton Horn volume is lower on account of tepid European market
03
Better operational efficiency & New orders from MSIL and M&M
Highest rating ( Purple) accorded to MKA from M&M for QCDD performance 04
RPAS (TTE DAPS) has Turned around
iSYS , Katolec and KPIT have contributed to top line growth.05

6/66 / 466/16Consolidated Financial Highlights
* PAT = PAT ( MIL Share )
12.44% 11.89%
4.78%3.64%
Q2 FY19 Q2 FY20
EBITDA PAT
1,522 1,360
Q2 FY19 Q2 FY20
-11%EBITDA (Rs. Cr)
PAT* (Rs. Cr) Margin (%)
73
49
Q2 FY19 Q2 FY20
-32%
-16%
162
189
118
64
15
24
56
74
Q2 FY19 Q2 FY20
PBT Interest Depreciation
*(27) Cr HBA restructuring
Adjusted growth(9.7)%
Revenue (Rs. Cr)

7/67 / 467/16Revenue Bridge – Q2 FY20
Q2 FY19 Acoustics
(18)
Lighting
48
Others
(21)(53)
Light Metal Technology
(121)
Switches Q2 FY20
1,523
1.360
95
24
SwitchesH1 FY19 Lighting Others
(28)
Acoustics
(86)
(162)
H1 FY20
2,955
2,799
Qu
arte
r 2
H1
Light Metal Technology

8/68 / 468/16Business wise Revenue Mix
Switches36%
Lighting23%
Acoustics12%
LMT15%
Others14%
Revenue – Q2FY20
Switches39%
Lighting22%
Acoustics12%
LMT17%
Others10%
Revenue – Q2FY19
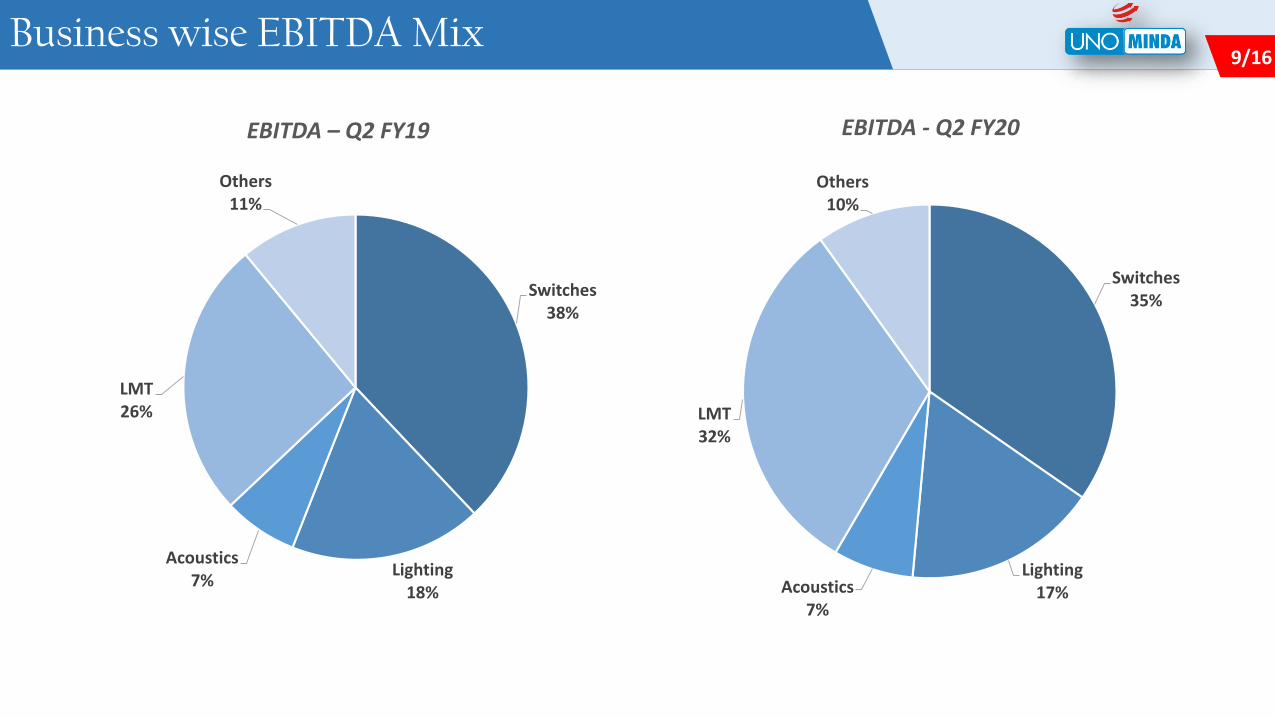
9/69 / 469/16Business wise EBITDA Mix
Switches38%
Lighting18%
Acoustics7%
LMT26%
Others11%
EBITDA – Q2 FY19
Switches35%
Lighting17%Acoustics
7%
LMT32%
Others10%
EBITDA - Q2 FY20

10/610 / 4610/16Revenue Mix – Q2 FY20
Channel-wise BreakupGeography-wise Breakup Segment -wise Breakup
90%
10%
OEM Replacement
46%
54%
2Wheeler 4Wheeler
83%
17%
India International
Diversification across Categories and Geographies

11/611 / 4611/16
Shareholder and creditor meeting is being convened by NCLT Delhi on November 19, 2019Harita Seating Sytems Merger
Shareholder and creditor meeting is being convened by NCLT Delhi in the second week of December 2019 and on 16th December by NCLT Mumbai
Merger of 4 WOS
Expected to be completed by December 2019DELVIS Acquisition
Mergers & Acquisitions: Status Update

12/612 / 4612/16
Promoters70.8%
Institutions15.5%
Retail8.5%
Corp Bodies / Others5.2%
Promoters70.8%
Insitutions16.8%
Retail7.3%
Corp Bodies / Others5.1%
Mar ‘19 Sep ‘19
Shareholding Pattern

13/613 / 4613/16Consolidated Profit & Loss Statement
Particulars (Rs. Cr) Q2 FY20 Q2 FY19 YoY % Q1 FY20 QoQ % FY19
Revenue from Operations (Net of Excise) 1,359.58 1,521.72 -11% 1,439.75 -6% 5,908.09
Raw Material 814.71 937.62 872.16 3,622.48
Employee Cost 208.39 195.28 215.13 791.29
Other Expenses 174.86 199.48 180.26 769.14
EBITDA 161.62 189.34 -15% 172.2 -6% 725.18
EBITDA Margin 11.89% 12.44% (56)bps 11.96% (61)bps 12.27%
Other Income 5.07 4.76 6.92 27.03
Depreciation 73.95 56.09 71.2 234.38
EBIT 92.74 138.01 -33% 107.92 -14% 517.83
EBIT Margin 6.82% 9.07% (225)bps 7.50% (67)bps 8.76%
Finance Cost 23.84 15.05 23.81 63.15
Profit before Share of Profit/Loss of JVs and Tax 68.9 122.96 -44% 84.11 -18% 454.68
PBT Margin 5.07% 8.08% (301)bps 5.84% (77)bps 7.70%
Exceptional Item
Tax 17.16 38.73 27.68 134.07
Profit before Share of Profit/Loss of JVs 51.74 84.23 -39% 56.43 -8% 320.61
Share of Profit/Loss of JVs 6.35 4.55 5.9 18.87
Net profit/(loss) after share of profit/(loss) of associates / joint ventures (A) 58.09 88.78 -35% 62.33 -7% 339.48
PAT Margin % 4.27% 5.83% (156)bps 4.33% (6)bps 5.75%
PAT attributable to:
- Owners of MIL 49.44 72.72 -32% 53.48 -8% 285.62
- Non Controlling Interests 8.65 16.06 8.85 53.86
Other Comprehensive Income -2.66 4.5244 -0.47 -0.68
Total Comprehensive Income for MIL 47.07 77.09 -39% 52.97 -11% 284.91
TCI Margin % 3.46% 5.07% (160)bps 3.68% (22)Bps 4.82%
Total Comprehensive Income for Non Controlling Interests 8.36 16.21 8.89 53.89

14/614 / 4614/16Consolidated Balance Sheet
ASSETS As at 30-Sep-2019 As at 31-Mar-2019
1. Non-current assets
Property, Plant and Equipment 1,583.89 1,629.40
Capital work-in-progress 184.2 131.52
Right-of-use assets 122.54 0.00
Intangible Assets 79.34 66.84
Intangible Assets Under Development 25.32 18.61
Goodwill on Consolidation 164.92 164.92
Financial Assets
(i) Investments 367.5 355.58
(ii) Loans 20.54 21.21
(iii) Others 8.66 9.66
Deferred tax assets (net) 7.42 0.00
Other Tax Assets 22.74 33.05
Other Non-current Assets 120 67.10
Sub-total - Non-Current Assets 2,707.07 2,497.89
2. Current Assets
Inventories 536.63 560.97
Financial Assets
(i) Trade receivables 776.81 899.22
(ii) Cash and cash equivalents 114.97 92.77
(iii) Bank balance other than those included in cash and cash equivalents
35.16 17.29
(iv) Loans 1.82 2.01
(v) Others Current Financial Assets 30.92 22.00
Other current assets 130.92 138.48
Sub-total - Current Assets 1,627.23 1,732.74
TOTAL - ASSETS 4,334.30 4,230.63
LIABILITIES As at 30-Sep-2019 As at 31-Mar-2019
EQUITY AND LIABILITIES
Equity
Equity share capital 52.44 52.44
Other Equity 1727.57 1,651.72
Equity attributable to owners of the Company 1780.01 1704.16
Non-Controlling Interest 268.61 266.71
Total Equity 2048.62 1,970.87
LIABILITIES
1. Non-current liabilities
Financial Liabilities
(i) Borrowings 625.95 606.34
(ii) Lease liabilities 101.21 0.00
(iii) Other financial liabilities 79.98 75.58
Provisions 116.71 99.64
Deferred tax liability net - 0.62
Total- Non current liabilities 923.85 782.18
2. Current Liabilities
Financial Liabilities
(i) Borrowings 275.84 349.15
(ii) Lease liabilities 12.21 0.00
(iii) Trade payables
(a) Total outstanding dues of micro & small enterprises
54.88 64.61
(b) Total outstanding dues of creditors other than micro & small enterprises
680.85 733.21
(iv) Other financial liabilities 226.69 231.15
Other current liabilities 87.53 77.90
Provisions 23.83 21.56
Total- Current liabilities 1361.83 1,477.59
TOTAL Equity and Liabilities 4,334.30 4,230.63

15/615 / 4615/16Consolidated Cash Flow Statement
Particulars (Rs in Cr) 30-Sep-2019 30-Sep-2018
PBT 153.01 237.07
Adjustments
Operating profit before working capital changes 349.28 372.94
Changes in working capital 91.01 -200.56
Cash generated from operations 440.29 172.38
Direct taxes paid (net of refund) -42.64 -61.32
Net Cash from Operating Activities 397.65 111.06
Net Cash from Investing Activities -294.23 -420.63
Net Cash from Financing Activities -81.84 273.81
Net Change in cash and cash equivalents 21.58 -35.76

16/616 / 4616/16
For further information, please contact:
Company : Investor Relations Advisors :
Minda Industries Ltd.CIN : L74899DL1992PLC050333Mr. Tripurari KumarGM Finance [email protected]
www.unominda.com
Strategic Growth Advisors Pvt. Ltd.CIN : U74140MH2010PTC204285Mr. Jigar Kavaiya+91 99206 [email protected]
www.sgapl.net
Contact Us