mills creek report card - ian.umces.eduian.umces.edu/pdfs/ian_report_card_442.pdf · lake erie...
TRANSCRIPT

Mills CreekReport Card
2013

§̈¦80Huron River Watershed
Old Woman Creek Watershed
Chappel Creek Watershed
¬«4
§̈¦80
¬«2
¬«269
¬«113
¬«4
¬«13
¬«601
¬«101
¬«303
¬«60
¬«2
¬«269
¬«113
¬«269
£¤20
£¤6
BERLIN TWP.
MILAN TWP.
HURON TWP.
OXFORD TWP.
GROTON TWP.
MARGARETTA TWP.
PERKINS TWP.
FLORENCE TWP.
VERMILION TWP.
SANDUSKY
VERMILION
NORWALK
HURON
BELLEVUE
MILAN
CASTALIA
MONROEVILLE
BERLIN HEIGHTS
WAKEMAN
BAY VIEW
Lake Erie
Sandusky Bay
Sandusky Bay Drainage
Mills Creek Watershed
Pipe Creek Watershed
Sawmill CreekWatershed
V e r m i l i o n R i v e r V e r m i l i o n R i v e r W a t e r s h e dW a t e r s h e d
Darby and Edson Watersheds
Cranberry and Sugar Creek Watersheds
LegendCounty Boundry
Major Routes
River/Stream/Ditch
Township Boundry
City
μ
0 2 4 6 8 101Miles
Firelands Coastal Tributaries Watersheds
Th e Firelands Coastal Tributaries Watershed Program is a partnership of local, state, and federal agencies, local buisnesses and volunteer groups that work together to improve the small streams within the Firelands area.
Th e partners of this program understand that each small watershed in our area is unique and needs special attention for eff ective management. Because our tributaries do not combine into larger river systems, they must be treated and managed separately, using a “ground
up” approach. We currently have a state endorsed management plan for the Old Woman Creek Watershed and hope to plan for additional streams in the area to reduce non-point source pollution entering Lake Erie.
Th is program engages our local community in watershed stewardship activities such as stream monitoring, rain barrel building, restoration projects and in-fi eld agricultural conservation. Clean water means healthy communities. Together we can improve our streams and Lake Erie.
Erie County is unique because most of its drainage includes small streams that empty directly into the Sandusky Bay and Lake Erie. As you travel across the county, you will cross small drainage areas called “watersheds” that defi ne where rainfall and snow melt will fl ow to a stream or tributary. Many of us don’t think about where our water came from or where it is going as it passes under a road bridge, but
understanding watershed systems helps us make decisions that keep water clean and keep Lake Erie healthy.
Th e Firelands Area coastal tributaries are made up primarily of small creek systems: Cold Creek, Mills Creek, Pipe Creek, Sawmill Creek, Old Woman Creek, and Chappel Creek. Th ese creeks diff er greatly in the geology, soil type, water sources, natural habitats, and land use, which makes our
Firelands watersheds an area of great diversity for our residents, tourists, as well as native and migratory wildlife.
Th e Firelands coastal tributaries are important to the overall health of Lake Erie. Much of the pollutants aff ecting the Lake come from the watersheds that drain to it. Monitoring helps identify which streams need the most attention to improve water quality.
What does a watershed program do?

A system driven by groundwater & stormsWhen it rains, it drains; and these storm events move pollutants through the watershed. Pollutants, like sediment and nutrients, increase in Mills Creek when it rains similar to other local watersheds. Mills Creek diff ers from our other local streams because it is also highly infl uenced by groundwater. Th e groundwater in Mills Creek helps to keep a more stable base fl ow (low water fl ow) in the channel but can potentially show higher concentrations of pollutants in the stream in the absence of rain if the groundwater entering the stream has been contaminated.
What makes up MillsCreek? Mills Creek is a 42.4-square-mile watershed made up of many small tributary and drainage ditches. Mills Creek begins in Sandusky and Huron Counties encompassing the City of Bellevue and empties into Sandusky Bay on the west side of Sandusky. Th e watershed consists of approximately 26% developed land, 67% agricultural land, and 7% natural areas. Th ere is one EPA permitted sewer outfl ow in the City of Bellevue that discharges into the headwaters of Mills Creek. Th is watershed is also home to several industrial areas with permitted discharges to the Creek.
Mills Creek is located on the easternmost portion of the Great Black Swamp, a once large wetland system created after Ancient Lake Erie’s shoreline receded to its present day location. Th e soil consists mainly of lake basin clay with a high seasonal water table. As a result, this area is commonly saturated in the spring months and drains slowly where drainage improvements have not been implemented. Mills Creek is also part of a Karst geological region, which is characterized by a series of sinkholes and underground rivers fl owing through cracks and cavities in the limestone bedrock. Surface water and groundwater are more connected in Karst regions increasing the potential for fl ooding and groundwater pollution. Nearly the entire watershed is highly sensitive to groundwater contamination.
Key driversMills Creek’s water quality is aff ected by many types of land uses, such as urban development, agricultural row-crop and livestock farms, commercial and industrial areas, and limestone quarries. Th e drainage of this watershed has been heavily modifi ed including the use of tile, open ditch and sinkholes to carry excess stormwater from development and farm fi elds. Th is combined with Karst geology increases the transportability of pollutants through the watershed. Only 30% of the stream
Bare ground in winter and little to no natural buff ers between fi eld and stream contributes to the degraded water quality in Mills Creek.
d d l l l
Types of inputs
Bacteria
Nutrients
SedimentsP
N
Pollution Sources
Row-crop agriculture
Broken and/or leakingseptic systems
Animalagriculture
Urban stormwater and combined sewer overflows
Manure/sludge fertilizer application
Key features
Storm-driven system
Urban centers
Flooding
Quarries
Railyard/industry
Golf courses
Possible Karst area
Benthic community
Bacteria
P
N
Indicators of healthSoluble reactive phosphorus
Nitrate
Turbidity
Bedrock
Soil
High ground water pollution potential
Ground water
Sink hole
Municipal wastewater treatment plant
maintains a buff er of natural vegetation; reducing the stream’s ability to eff ectively handle the excessive fl ush of pollutants from rain events. Th is watershed also has the lowest adoption of conservation tillage in the county.
Municipal waste water from the City of Bellevue and several home sewage treatment systems also contribute to sediment, nutrient, and bacterial pollutants in the watershed.

Wet year with several storms2013 was a very wet year. During the sampling period (April to November), records show the number of “wet days” for daily rain events was 10 days or greater for every month except May and November. In addition to the wet days, the total number of storms producing rainfall greater than 3/4 inch from April to November was 17. Th e months for the highest amount of wet days and signifi cant storm events was June and July.
Mills Creek is infl uenced by both groundwater and storm water discharges. As we continue to monitor this creek we hope rainfall data will help us determine the mode of transport of pollutants (surface or groundwater), so we can develop the best strategies to reduce them.
How does this aff ect the water quality of Mills Creek? Overall, Mills Creek scored a 14%, F, which is considered very poor health, and was primarily due to very poor nutrient scores at all sites. Station scores for the Water Quality Index did not show a signifi cant improvement suggesting polluted run-off enters the stream at several locations in the watershed. If pollutants occured mainly in the headwaters, scores would improve closer to the Bay.
Daily rainfall totals from the COCORAHs stations within the Mills Creek watershed.
Bacteria, an indicator of human safetyDetermining if recreational areas are safe for swimming is accomplished by measuring certain bacteria as an indicator.Th ese bacteria serve as a surrogate for the presence of pathogens which may cause illness in humans. Bacteria in the water come from a variety of sources, including untreated municipal waste, failing septic systems, pet waste, and livestock, often after heavy rainfall.
In Mills Creek, indicator bacteria are measured by the Erie County Health Department at Lions Park (see map) three
All stations failed, receiving a 0% score for nitrate. Phosphorus also failed at all stations with the highest 3 stations only receiving a 13%. Th ese nutrients are easily carried through run-off and groundwater discharge and have had high concentrations recorded over previous years. Because of the high exchange of surface and groundwater in this stream, it
is diffi cult to identify the source of these pollutants at this time. More sites will be added in 2014.
Turbidity received 33%, D- overall, and improved signifi cantly from headwater (Strecker Rd, 13%) to Mills Creek Golf Course, 43%. Th is suggests higher sediment loading occurrs in the upper watershed.
to four times weekly. In 2013, Lions Park, received a 51% score meaning the risk of getting sick while swimming occurred half of the recreational season. Although this site is not directly located at the mouth of Mills Creek, this small stream does contribute to the overall condition of the Bay. Th e rate of failure is consistent with an increase in the number of storms during the sampling period. Because our streams are storm driven the increase in rain events increase the potential of pollutants arriving at our beaches.
Monitoring in Mills CreekMonthly water samples are analyzed for these parameters from April through November by the Volunteer Stream Monitoring Program. Future monitoring will include benthic macroinvertebrates (aquatic worms and insect larvae) and an increase in the frequency and number of samples.
Th e aim of this report card is to provide a transparent, timely, and geographically detailed assessment of water quality for Mills Creek in 2013. Scores are determined by comparing three indicators (nitrate, soluble reactive phosphorus, and turbidity) to scientifi cally derived ecological thresholds or goals. Th ese three indicators are combined into one overarching Water Quality Index, which is presented as the site or watershed grade. Vital Signs Indicators (dissolved oxygen, water temperature, pH, and ammonia) are considered basic diagnostic indicators that are not included in the Water Quality Index. If one or more of the vital signs do not score well it is an indication of a serious problem in the creek.
Soluble Reactive Phosphorus
Benthic Community
DONH4
+
Vital Signs Indicators
Bacteria
Nitrate
Turbidity
0
0.5
1
1.5
2
2.5
3
3.5
4
4.5
Prec
ipita
tion,
inch
es
Mills Creek Watershed Daily Precipitation 2013
OH-ER-15 OH-ER-2 OH-ER-10
Apr May Jun Jul Aug Sep Oct Nov
0 0.25 Miles
Percentage of time sample was belowthe swimming risk threshold
(235 MPN 100 ml-¹)
<60%60–<70%
70–<80%80–<90%
90–<100%100%
Lions Park
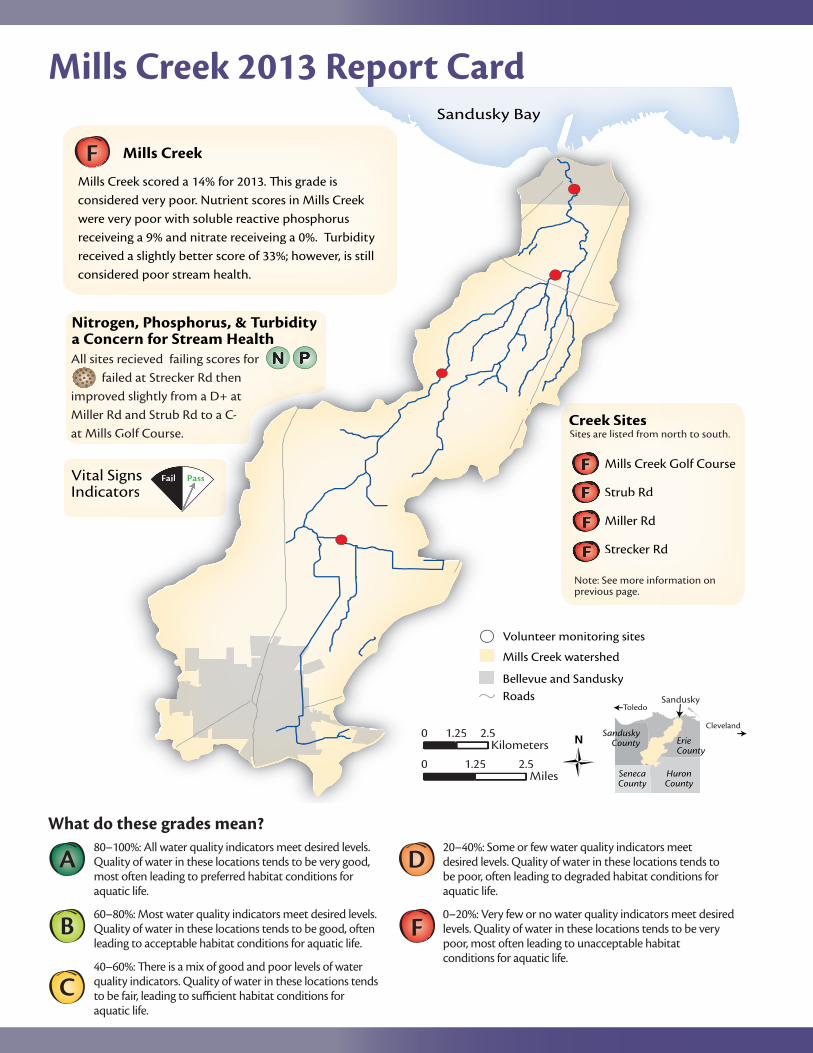
Mills Creek 2013 Report Card
0 2.51.25Miles
0 2.51.25Kilometers
Creek Sites
Vital Signs Indicators
Fail Pass
Mills Creek scored a 14% for 2013. This grade is considered very poor. Nutrient scores in Mills Creek were very poor with soluble reactive phosphorus receiveing a 9% and nitrate receiveing a 0%. Turbidity received a slightly better score of 33%; however, is still considered poor stream health.
Sites are listed from north to south.
Mills Creek Golf Course
Strub Rd
Miller Rd
Strecker Rd
Note: See more information on previous page.
Mills Creek
Nitrogen, Phosphorus, & Turbidity a Concern for Stream HealthAll sites recieved failing scores for failed at Strecker Rd then improved slightly from a D+ at Miller Rd and Strub Rd to a C- at Mills Golf Course.
0 2.51.25Miles
0 2.51.25Kilometers
Creek Sites
gns ors
Fail Pass
reek scored a 14% for 2013. This grade is ered very poor. Nutrient scores in Mills Creek ry poor with soluble reactive phosphorus ng a 9% and nitrate receiveing a 0%. Turbidity d a slightly better score of 33%; however, is still ered poor stream health.
Sites are listed from
Mills Cree
Strub Rd
Miller Rd
Strecker R
Note: See more infprevious page.
Mills Creek
en, Phosphorus, & Turbidity ern for Stream Healthrecieved failing scores for ed at Strecker Rd then d slightly from a D+ at
d and Strub Rd to a C- Golf Course.
Sandusky Bay
RoadsBellevue and Sandusky
Mills Creek watershed
Volunteer monitoring sites
SanduskyToledo
Cleveland
HuronCounty
ErieCounty
SanduskyCounty
Seneca County
What do these grades mean?
60–80%: Most water quality indicators meet desired levels. Quality of water in these locations tends to be good, often leading to acceptable habitat conditions for aquatic life.
80–100%: All water quality indicators meet desired levels. Quality of water in these locations tends to be very good, most often leading to preferred habitat conditions for aquatic life.
40–60%: There is a mix of good and poor levels of water quality indicators. Quality of water in these locations tends to be fair, leading to sufficient habitat conditions for aquatic life.
20–40%: Some or few water quality indicators meet desired levels. Quality of water in these locations tends to be poor, often leading to degraded habitat conditions for aquatic life.
0–20%: Very few or no water quality indicators meet desired levels. Quality of water in these locations tends to be very poor, most often leading to unacceptable habitat conditions for aquatic life.

People working together for clean water
Agricultural producers in the watershed have begun to implement various conservation practices into their farming operation to protect natural resources and Mills Creek. Since the Conservation Reserve Enhancement Program (CREP) was initiated in the summer of 2000, a total of 69.6 acres (approximately 19,000 linear feet) of grass fi lter strips now buff er Mills Creek and portions of its tributaries. Additional practices include riparian buff ers, escarpments, fi eld windbreaks and wetlands. Even though some eff ort has been made to improve and protect Mills Creek, success has been very limited, as is evident from the stream score. Additional conservation measures must be taken for signifi cant improvement.
Landowners and agricultural producers throughout the watershed are becoming more aware of the importance of healthier soils and nutrient management, along with the necessity of adopting the concepts of the 4R’s (right source, rate, time, and placement of fertilizers) and other practices that demonstrate personal stewardship of the land and water. Suburban homeowners and businesses can also play a signifi cant role by applying fertilizers appropriately, reducing storm run-off , and maintaining their septic system. It’s going to require the eff ort from everyone who lives or works in the Mills Creek watershed to improve this valuable resource.
To reduce our greatest creek stressors (nutrient and sediment pollution, and habitat loss), we as a community need to work together. Whether you live in the city or on a farm of tens to thousands of acres, each of us has a role to play in reducing the impacts that come from our respective lifestyles. We thank many of our Firelands Area residents and landowners who are already working to improve our soil and water and encourage others to restore and protect Lake Erie. To fi nd out more about how you can help, see the back page of this report card.
Improving Mills Creek takes the whole watershed community
Grass buff ers along farm fi elds keep sediment and nutrients from entering Mills Creek (right of the photo).
Run-off carrying sediment from a farm fi eld direclty entering a storm drain in Mills Creek.
b ff l f fi ld k di d i f Rain barrels help hold back stormwater and reduce combined sewer discharges in our urban areas.

You can help!
If you would like to learn more about the development of this report card or watersheds in the Firelands Area visit the following websites:eriecleanwater.org oldwomancreek.orgian.umces.edu eriecohealthohio.org
Learn moreWe could use your help to improve our watershed. If you are interested in being a volunteer, contact Breann Hohman, Watershed Coordinator for the Erie Soil and Water Conservation District at 419-626-5211 or [email protected].
Get involved
Available Opportunities:• Stream monitoring• Invasive plant removal• Habitat restoration• Litter clean-ups
Volunteers help collect water samples for Mills Creek.
What you can do Who benefits
Leave a natural area along a stream or ditch
Grass or wooded buff ers help fi lter pollutants and reduce fl ood damage
Remember to inspect and pump out your septic system every 3–5 years
A properly maintained septic system prevents costly repairs and untreated sewage discharge into our streams
Help your community develop a plan that supports low impact development
Smart development fosters growth and protects the local resources and character of a community
Follow the “4Rs” of fertilizer use: Right source, Right amount, Right place, Right time
Th e “4Rs” approach promotes the wise use of fertilizer by farmers, residents, and landscapers to reduce costly nutrient loss that pollutes our streams
Plant cover crops Cover crops build healthy soils that help hold back nutrients and water and increase crop yields
Plant a rain garden or install a rain barrel Rain gardens and rain barrels help reduce stormwater runoff and can cut down on landscaping costs
Install a drainage management system Managing fi eld drainage reduces nutrient loss while saving water for when your crops need it the most
Properly manage livestock & pet waste Storing and disposing of animal waste properly reduces nutrients and prevents harmful bacteria from fouling beaches
WHAT’S REDUCED
= nitrogen
= phosphorus
= sediment
Join our volunteers to get involved in many opportunities in Mills Creek.
Financial support for this publication was provided fully or in part by a grant under the Federal Coastal Zone Management Act, administered by the Offi ce of Ocean and Coastal Resource Management, National Oceanic and Atmospheric Administration, Silver Spring, MD
Report card analysis and design in collaboration with the University of Maryland Center for Environmental Science’s Integration & Application Network
Published:March 2014
Printed on post-consumer recycled paper

Erie Soil and Water Conservation District2900 Columbus Ave, Rm 131Sandusky Ohio 44870
Mills CreekReport Card
2013