migration haitian refugeessalinas, ca. key issues why do people migrate? where are migrants...
TRANSCRIPT
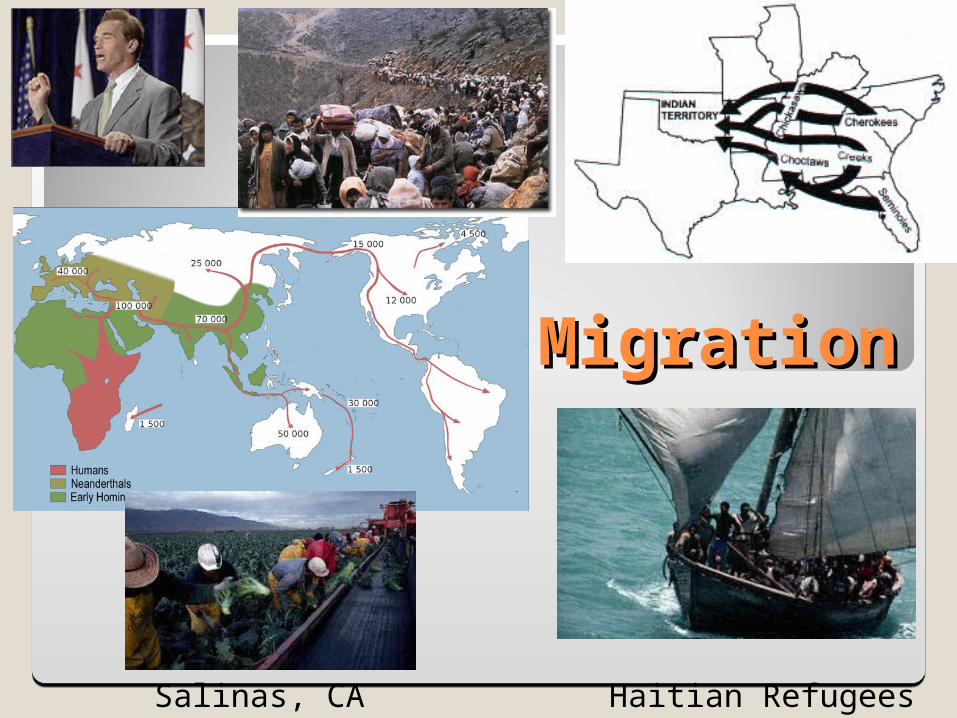
MigrationMigration
Haitian RefugeesSalinas, CA
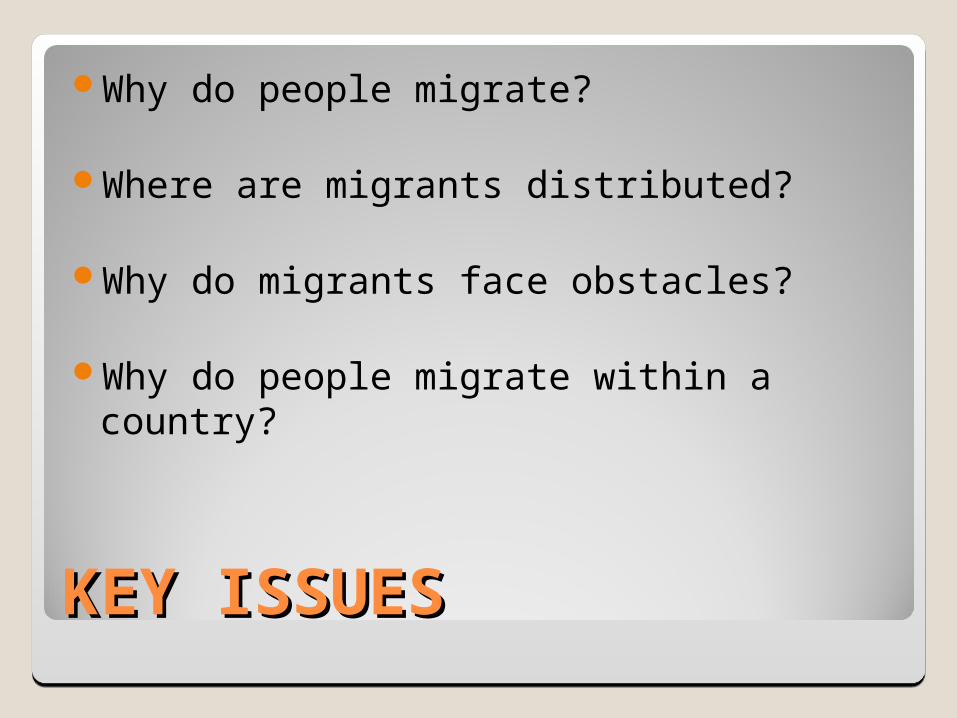
KEY ISSUESKEY ISSUES
Why do people migrate?
Where are migrants distributed?
Why do migrants face obstacles?
Why do people migrate within a country?
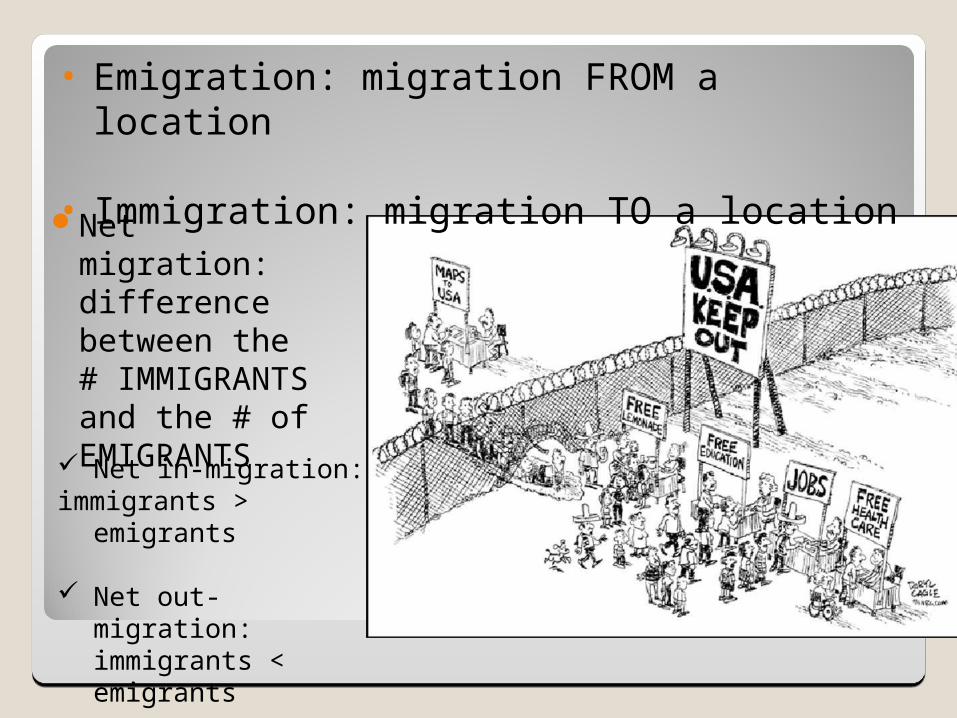
Net migration: difference between the # IMMIGRANTS and the # of EMIGRANTS
• Emigration: migration FROM a location
• Immigration: migration TO a location
Net in-migration: immigrants > emigrants
Net out-migration: immigrants < emigrants
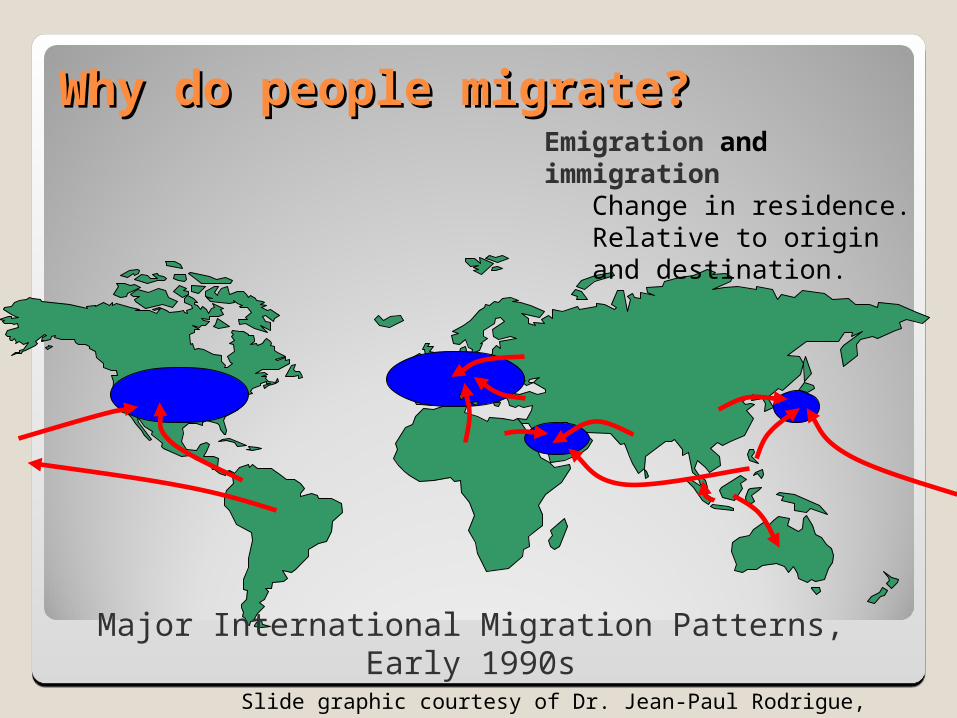
Why do people migrate?Why do people migrate?
Major International Migration Patterns, Early 1990s
Slide graphic courtesy of Dr. Jean-Paul Rodrigue, Hofstra University
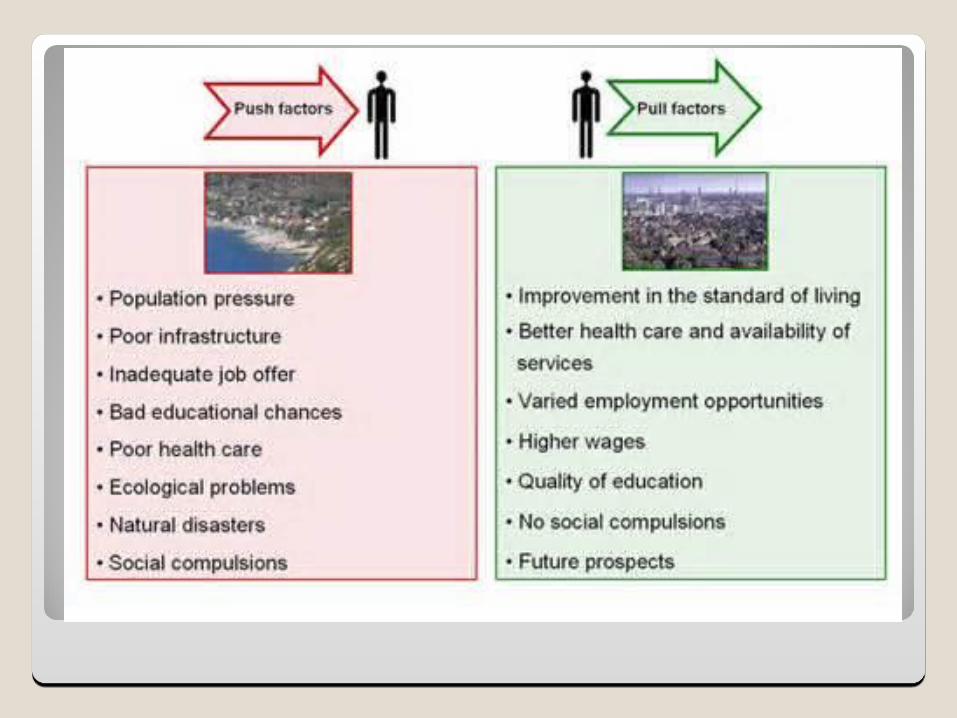
Emigration and immigrationChange in residence.Relative to origin and destination.

PUSH: induces people to leave their present location
PULL: induces people to come to a new location
Can be ENVIRONMENTAL, CULTURAL, ECONOMIC
What are some push/pull factors?◦ Any personal examples in your family?
PUSH/PULL FACTORSPUSH/PULL FACTORS
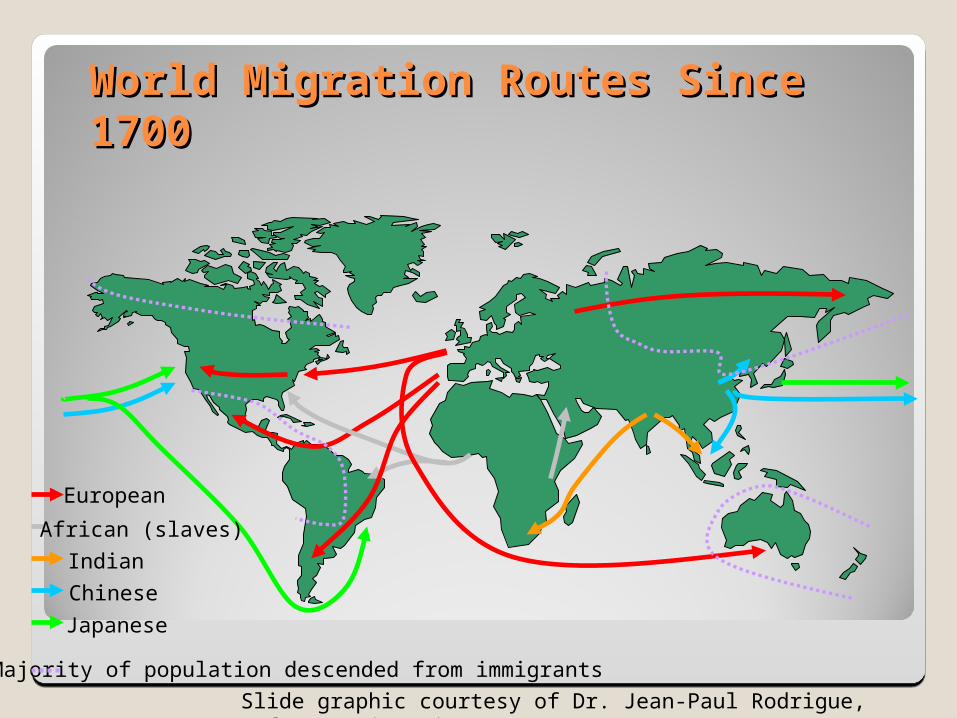
World Migration Routes Since World Migration Routes Since 17001700
European
African (slaves)
Indian
Chinese
Japanese
Majority of population descended from immigrants
Slide graphic courtesy of Dr. Jean-Paul Rodrigue, Hofstra University
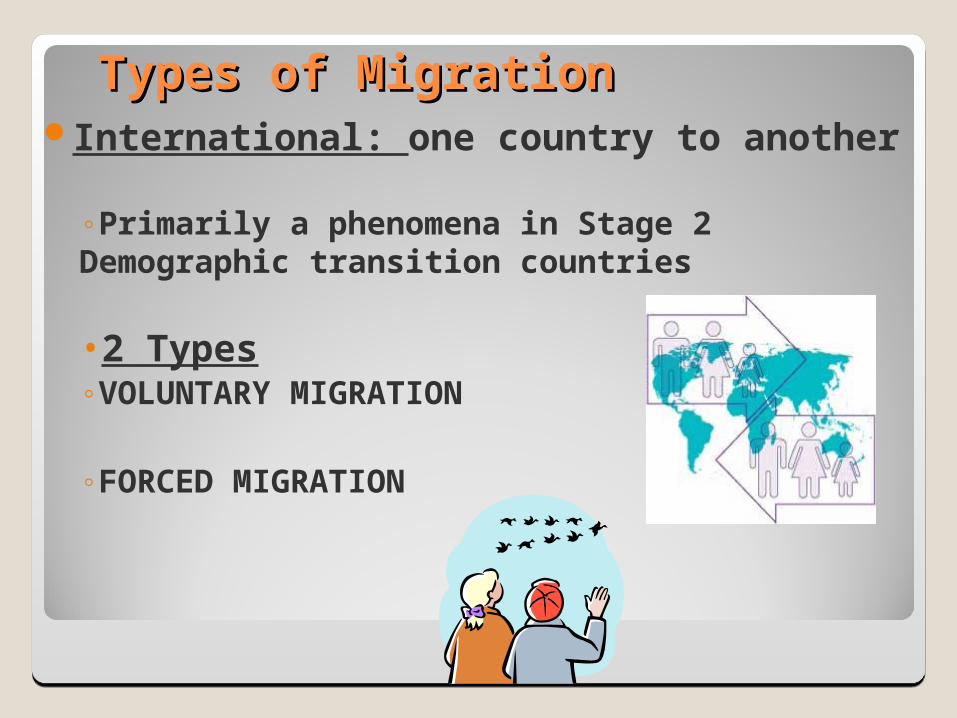
Types of MigrationTypes of MigrationInternational: one country to another
◦Primarily a phenomena in Stage 2 Demographic transition countries
•2 Types◦VOLUNTARY MIGRATION
◦FORCED MIGRATION
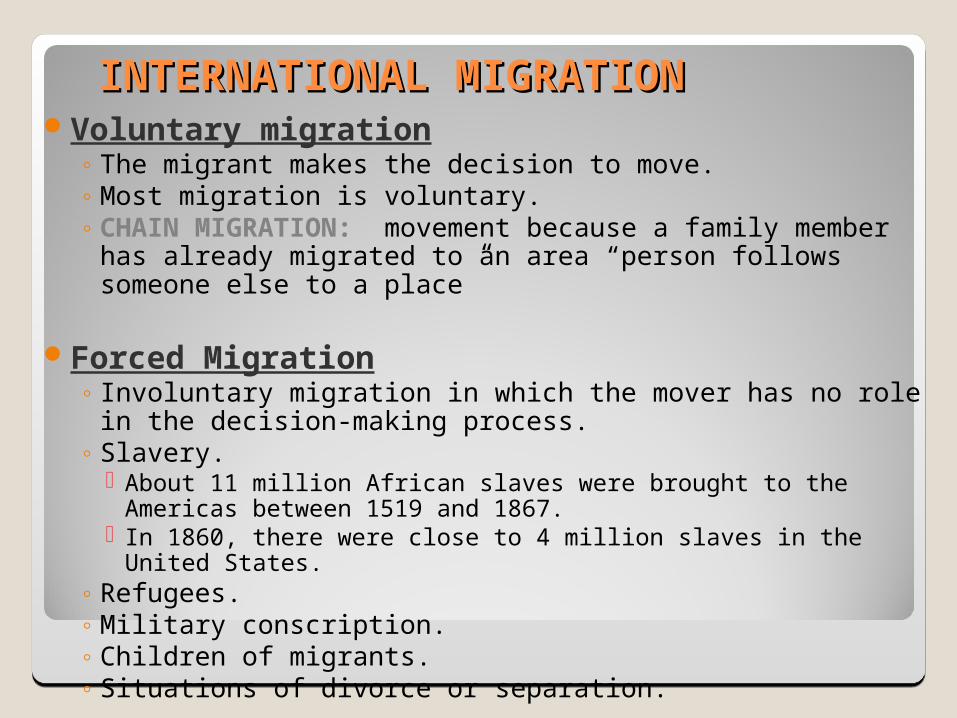
INTERNATIONAL MIGRATIONINTERNATIONAL MIGRATIONVoluntary migration
◦ The migrant makes the decision to move.◦ Most migration is voluntary.◦ CHAIN MIGRATION: movement because a family member
has already migrated to an area “person follows someone else to a place”
Forced Migration◦ Involuntary migration in which the mover has no role in the
decision-making process.◦ Slavery.
About 11 million African slaves were brought to the Americas between 1519 and 1867.
In 1860, there were close to 4 million slaves in the United States.◦ Refugees.◦ Military conscription.◦ Children of migrants.◦ Situations of divorce or separation.
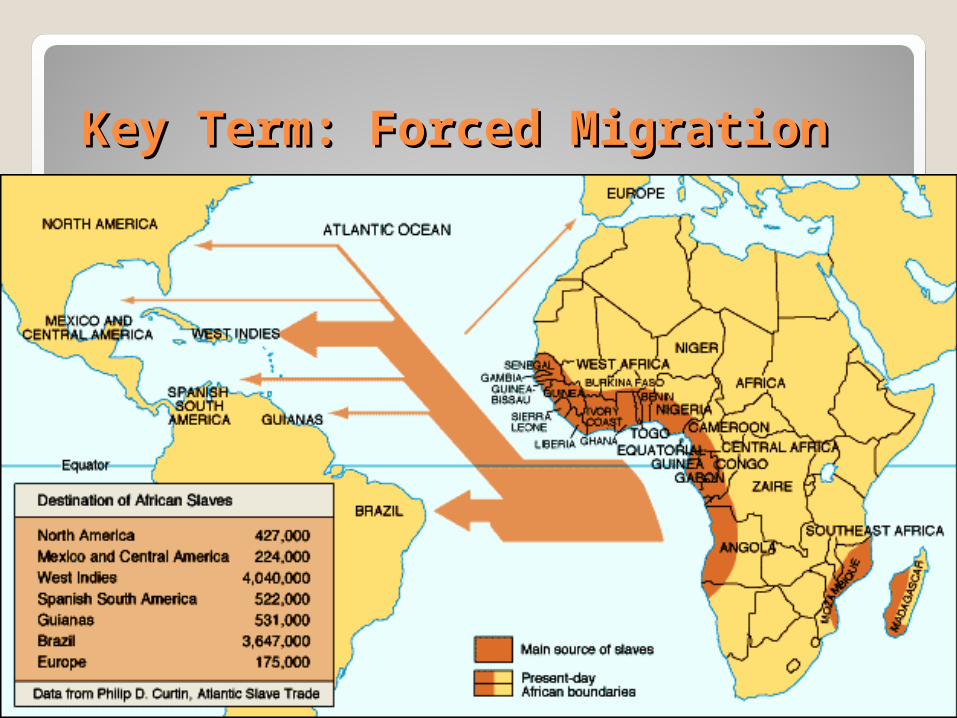
Key Term: Forced MigrationKey Term: Forced Migration
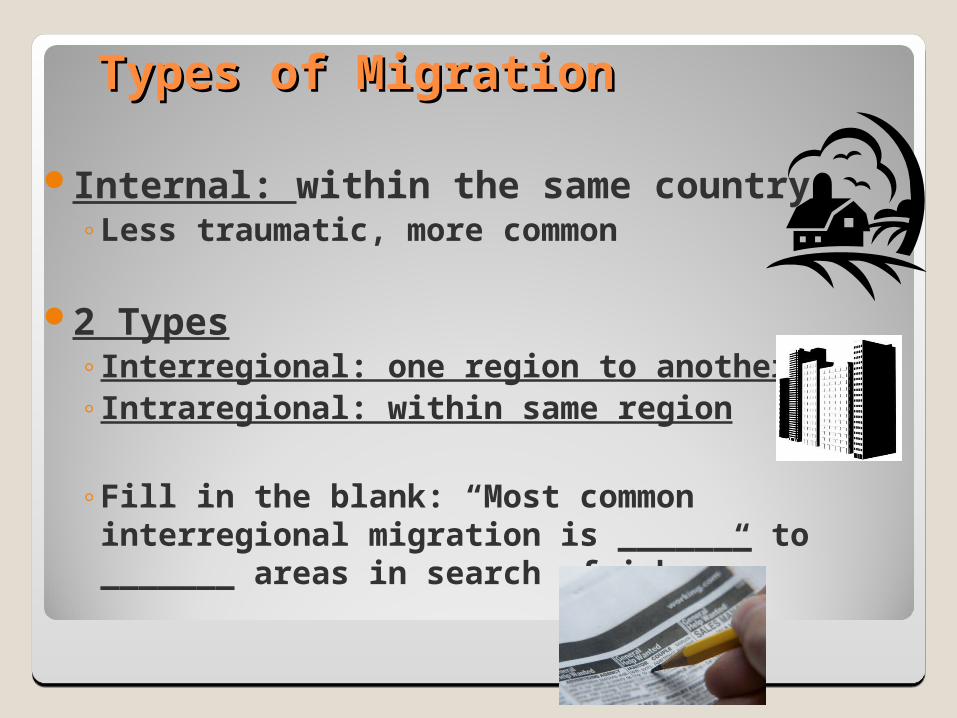
Types of MigrationTypes of Migration
Internal: within the same country◦Less traumatic, more common
2 Types◦Interregional: one region to another◦Intraregional: within same region
◦Fill in the blank: “Most common interregional migration is _______ to _______ areas in search of jobs.”
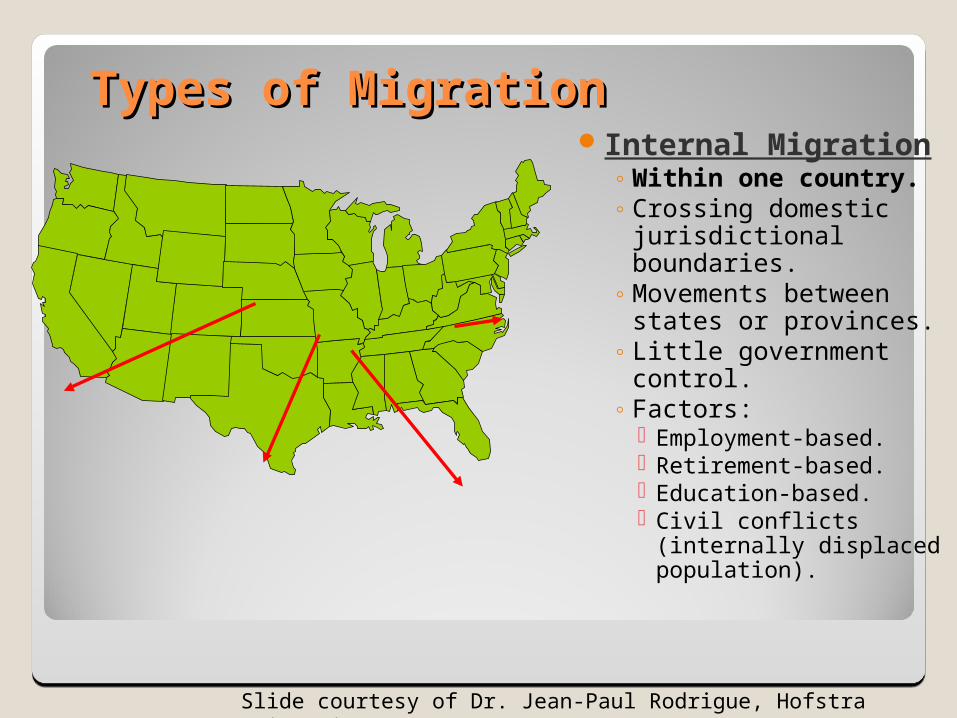
Types of MigrationTypes of MigrationInternal Migration
◦ Within one country.◦ Crossing domestic
jurisdictional boundaries.
◦ Movements between states or provinces.
◦ Little government control.
◦ Factors: Employment-based. Retirement-based. Education-based. Civil conflicts
(internally displaced population).
Slide courtesy of Dr. Jean-Paul Rodrigue, Hofstra University
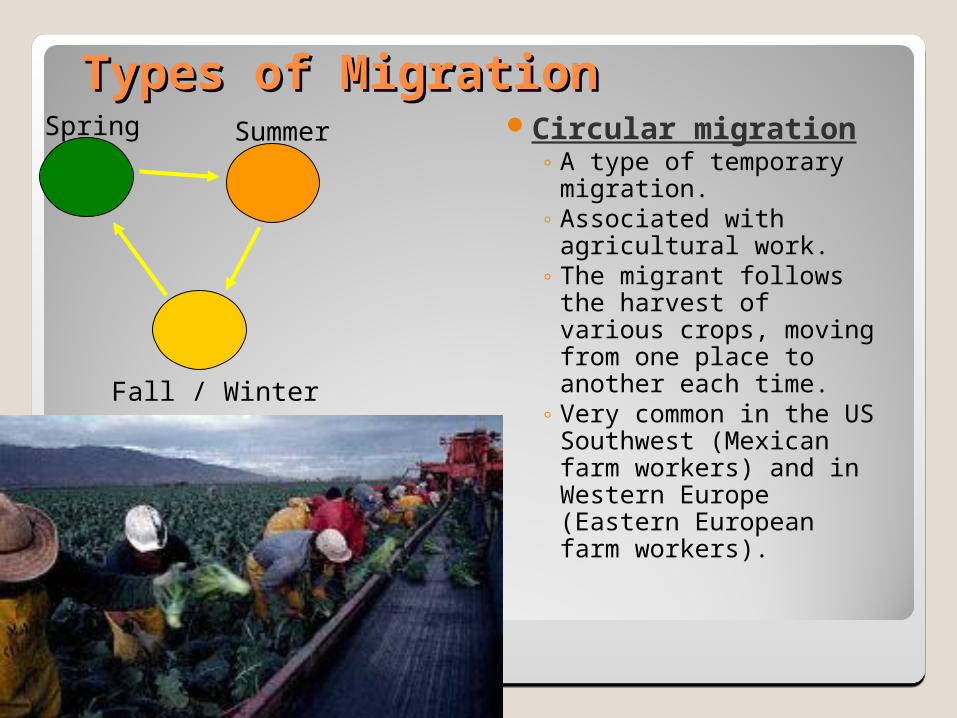
Types of MigrationTypes of MigrationCircular migration
◦ A type of temporary migration.
◦ Associated with agricultural work.
◦ The migrant follows the harvest of various crops, moving from one place to another each time.
◦ Very common in the US Southwest (Mexican farm workers) and in Western Europe (Eastern European farm workers).
Fall / Winter
Spring Summer
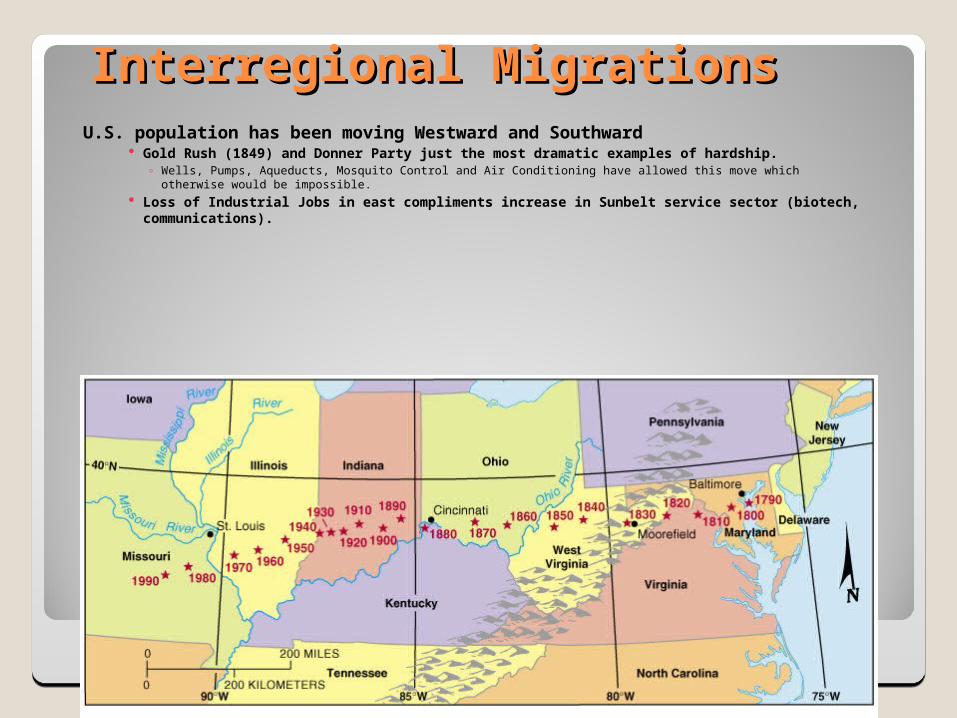
Interregional MigrationsInterregional MigrationsU.S. population has been moving Westward and Southward
Gold Rush (1849) and Donner Party just the most dramatic examples of hardship.◦ Wells, Pumps, Aqueducts, Mosquito Control and Air Conditioning have allowed this move which otherwise would be
impossible. Loss of Industrial Jobs in east compliments increase in Sunbelt service sector (biotech,
communications).
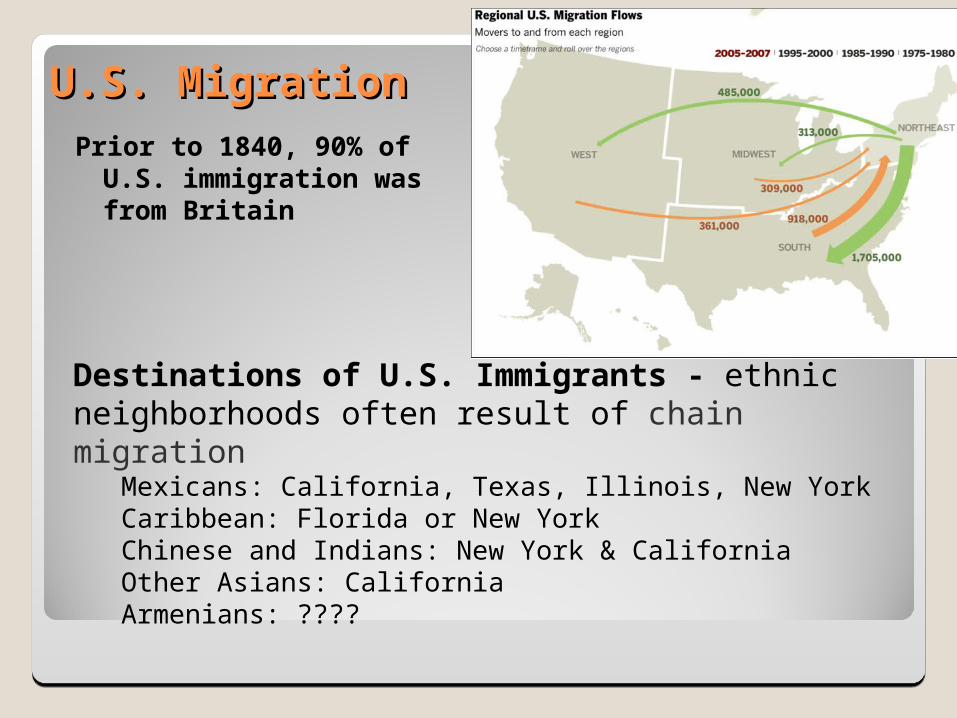
U.S. MigrationU.S. MigrationPrior to 1840, 90% of U.S.
immigration was from Britain
Destinations of U.S. Immigrants - ethnic neighborhoods often result of chain migration
Mexicans: California, Texas, Illinois, New YorkCaribbean: Florida or New YorkChinese and Indians: New York & CaliforniaOther Asians: CaliforniaArmenians: ????
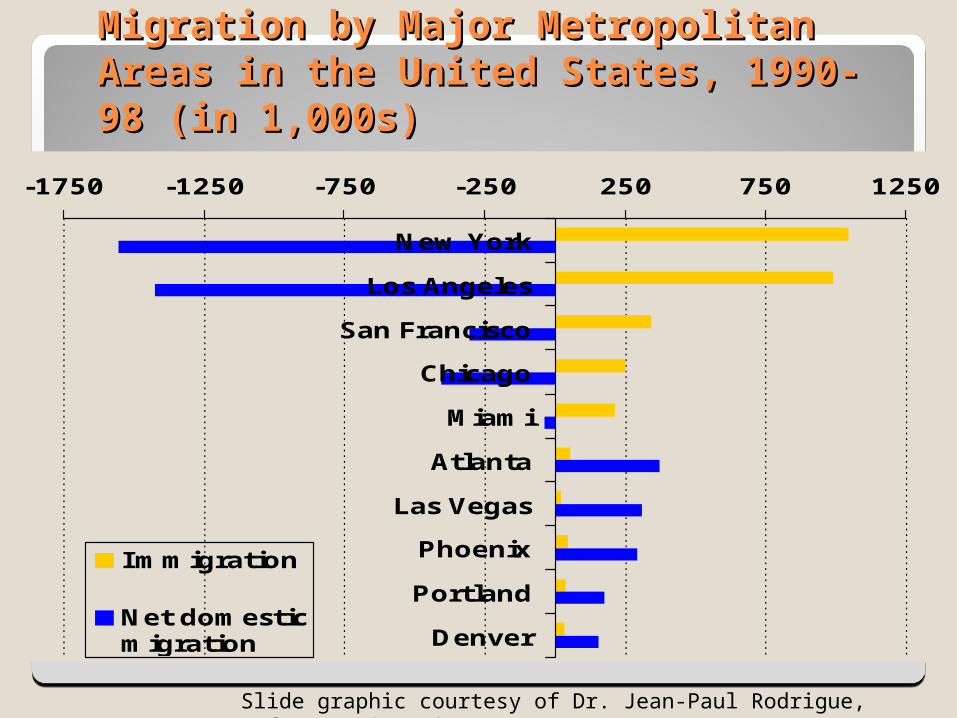
Migration by Major Metropolitan Migration by Major Metropolitan Areas in the United States, 1990-98 Areas in the United States, 1990-98 (in 1,000s)(in 1,000s)
-1750 -1250 -750 -250 250 750 1250
New York
Los Angeles
San Francisco
Chicago
Miami
Atlanta
Las Vegas
Phoenix
Portland
Denver
Immigration
Net domesticmigration
Slide graphic courtesy of Dr. Jean-Paul Rodrigue, Hofstra University
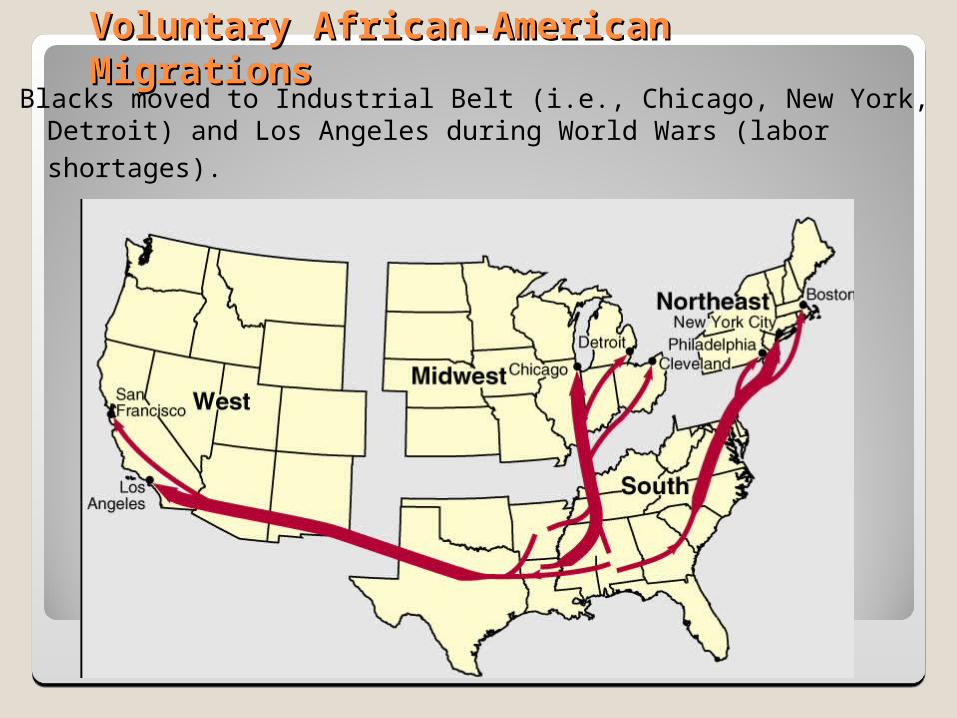
Voluntary African-American Voluntary African-American MigrationsMigrations
Blacks moved to Industrial Belt (i.e., Chicago, New York, Detroit) and Los Angeles during World Wars (labor shortages).
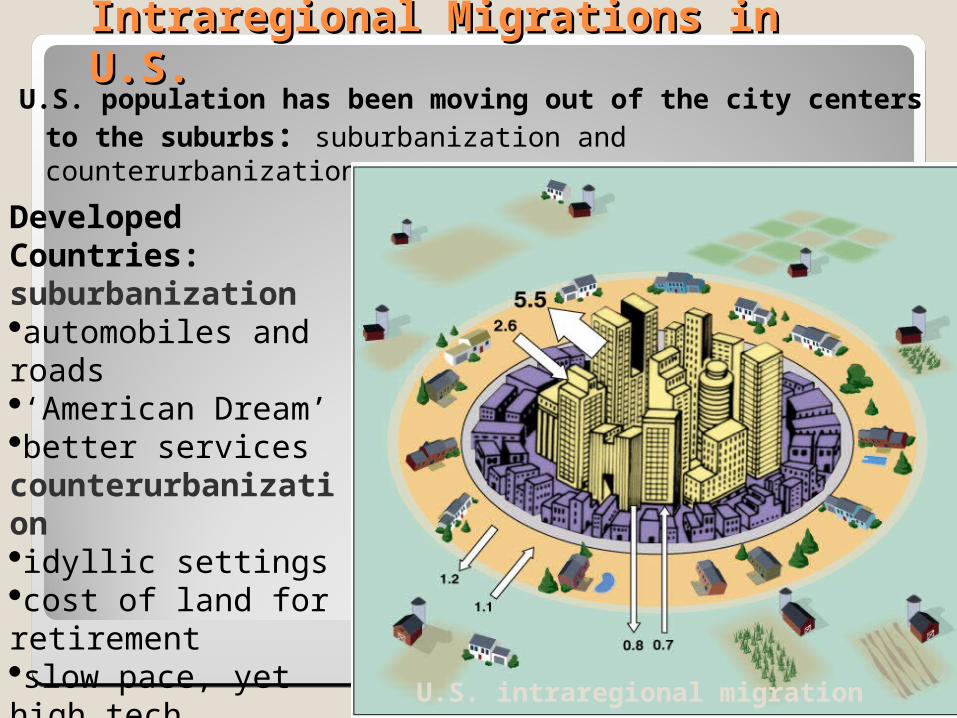
Intraregional Migrations in U.S. Intraregional Migrations in U.S. U.S. population has been moving out of the city centers
to the suburbs: suburbanization and counterurbanization
U.S. intraregional migration during 1990s.
Developed Countries: suburbanizationautomobiles and roads‘American Dream’better servicescounterurbanizationidyllic settingscost of land for retirementslow pace, yet high tech connections to services and markets
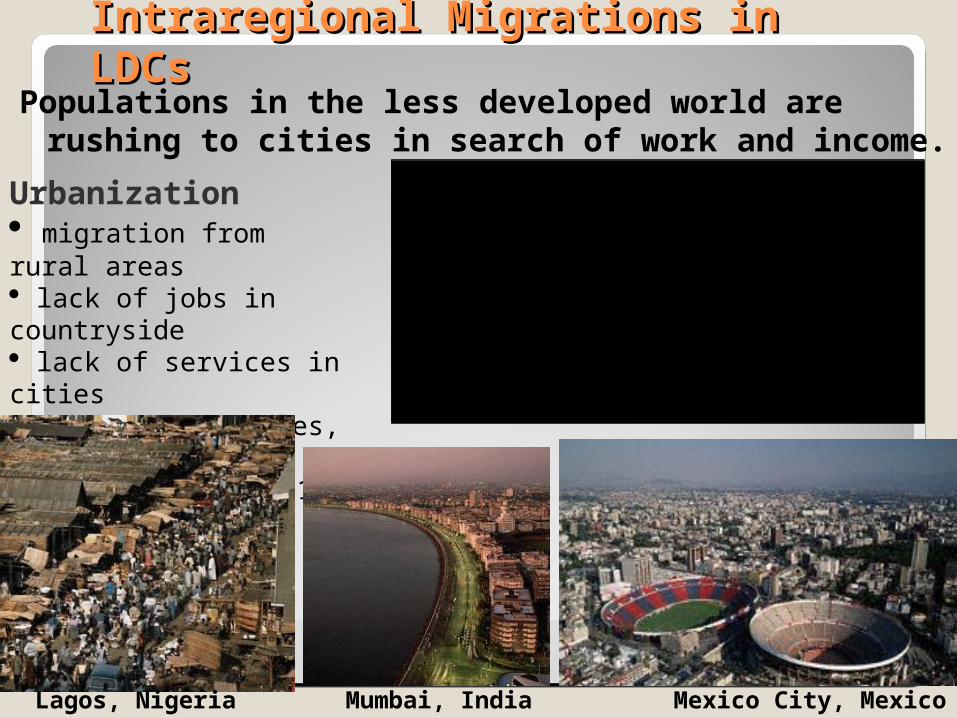
Intraregional Migrations in LDCs Intraregional Migrations in LDCs Populations in the less developed world are
rushing to cities in search of work and income.
Urbanization migration from rural areas lack of jobs in countryside lack of services in cities Tokyo, Los Angeles, and New York only MDC cities on top 10 list
Rank City Population1 Tokyo, Japan 28 million2 New York City, United States 20.1 million3 Mexico City, Mexico 18.1 million4 Mumbai, India (Bombay) 18 million5 Sao Paulo, Brazil 17.7 million6 Los Angeles, United States 15.8 million7 Shanghai, China 14.2 million8 Lagos, Nigeria 13.5 million9 Kolkata, India (Calcutta) 12.9 million
10 Buenos Aires, Argentina 12.5 million
Lagos, Nigeria Mumbai, India Mexico City, Mexico
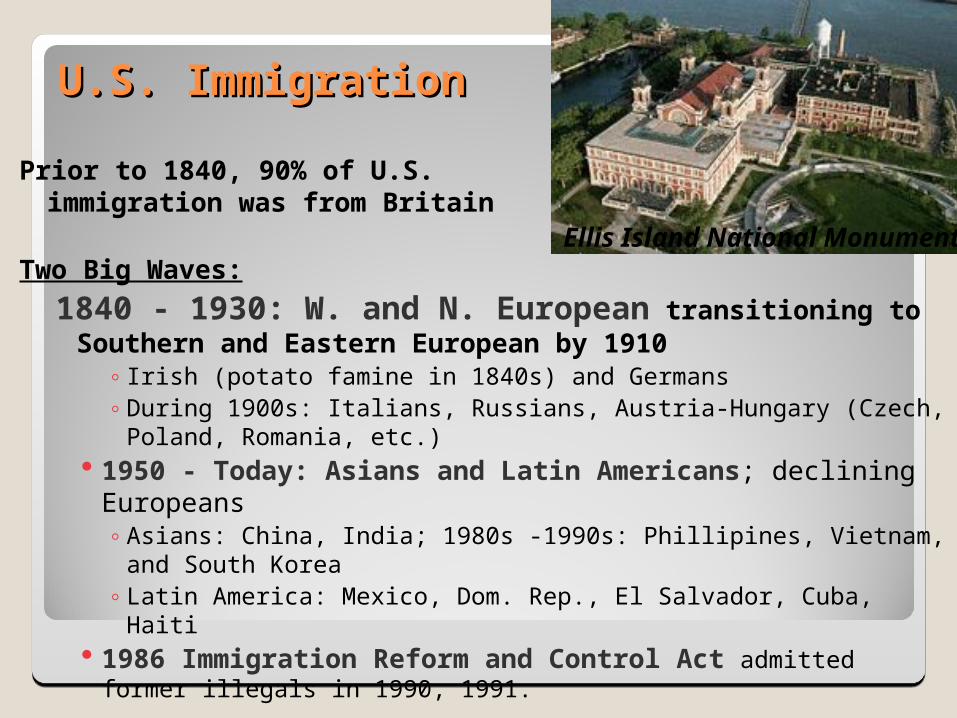
U.S. ImmigrationU.S. Immigration
Prior to 1840, 90% of U.S.immigration was from Britain
Two Big Waves:
1840 - 1930: W. and N. European transitioning to Southern and Eastern European by 1910
◦ Irish (potato famine in 1840s) and Germans◦During 1900s: Italians, Russians, Austria-Hungary (Czech, Poland,
Romania, etc.) 1950 - Today: Asians and Latin Americans; declining
Europeans◦Asians: China, India; 1980s -1990s: Phillipines, Vietnam, and South
Korea◦Latin America: Mexico, Dom. Rep., El Salvador, Cuba, Haiti
1986 Immigration Reform and Control Act admitted former illegals in 1990, 1991.
Ellis Island National Monument
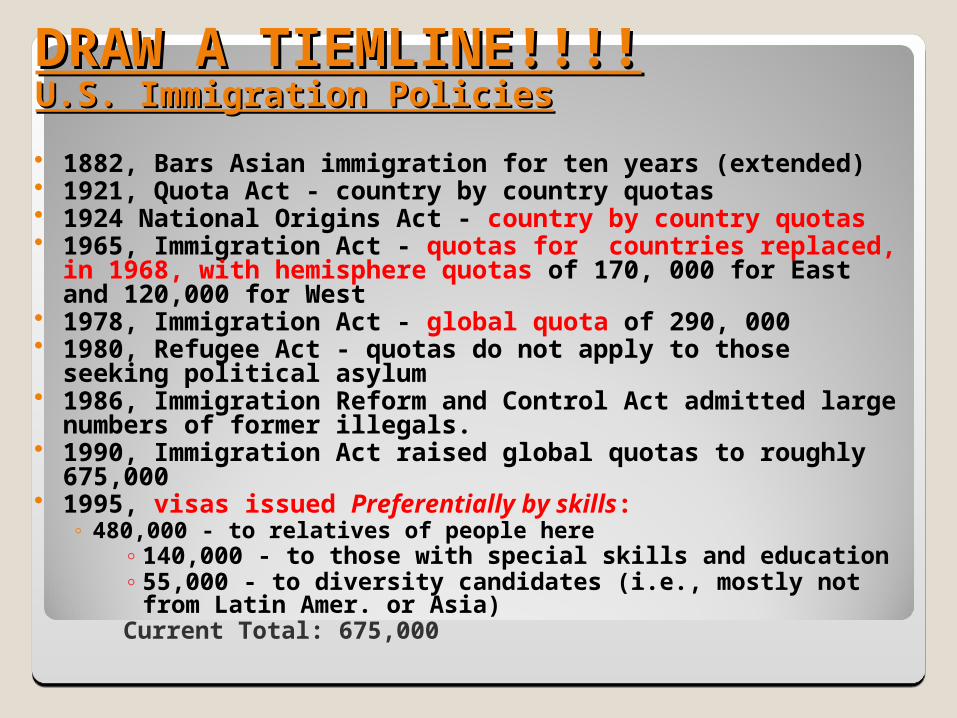
DRAW A TIEMLINE!!!!DRAW A TIEMLINE!!!!U.S. Immigration PoliciesU.S. Immigration Policies
1882, Bars Asian immigration for ten years (extended) 1921, Quota Act - country by country quotas 1924 National Origins Act - country by country quotas 1965, Immigration Act - quotas for countries replaced, in
1968, with hemisphere quotas of 170, 000 for East and 120,000 for West
1978, Immigration Act - global quota of 290, 000 1980, Refugee Act - quotas do not apply to those seeking
political asylum 1986, Immigration Reform and Control Act admitted large
numbers of former illegals. 1990, Immigration Act raised global quotas to roughly
675,000 1995, visas issued Preferentially by skills:
◦ 480,000 - to relatives of people here◦140,000 - to those with special skills and education◦55,000 - to diversity candidates (i.e., mostly not from
Latin Amer. or Asia)Current Total: 675,000
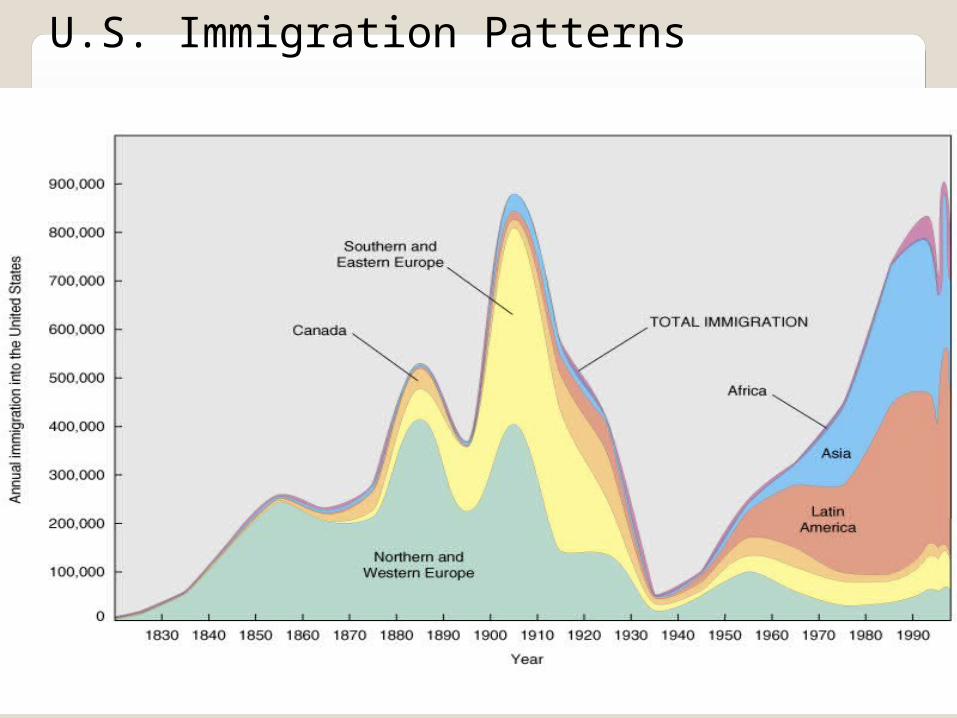
U.S. Immigration Patterns
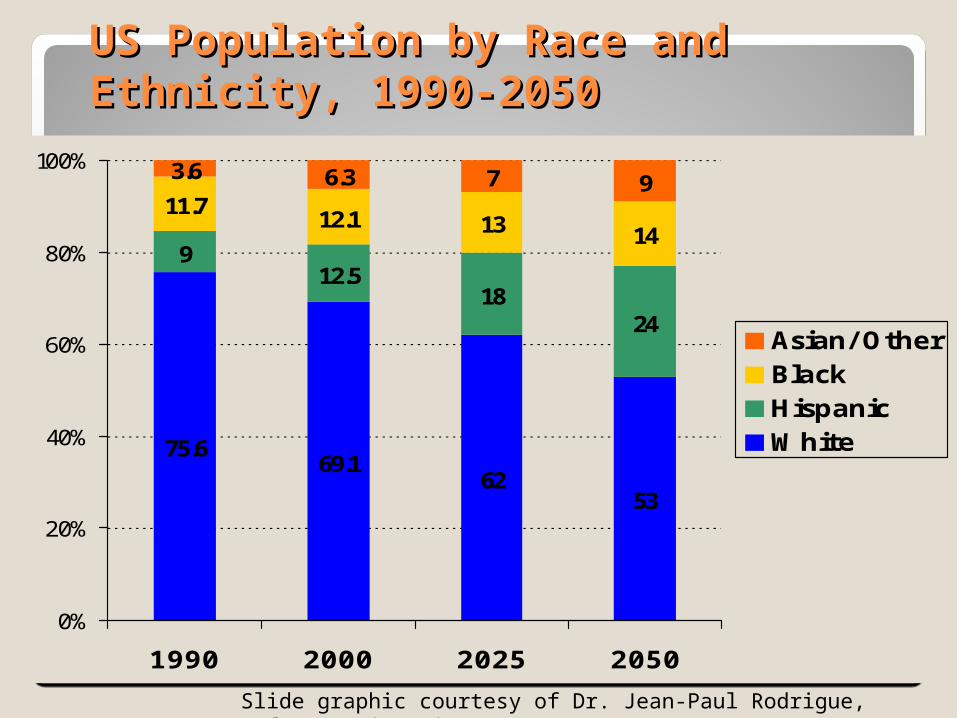
US Population by Race and US Population by Race and Ethnicity, 1990-2050Ethnicity, 1990-2050
75.669.1
6253
912.5
1824
11.712.1 13 14
3.6 6.3 7 9
0%
20%
40%
60%
80%
100%
1990 2000 2025 2050
Asian/ OtherBlackHispanicWhite
Slide graphic courtesy of Dr. Jean-Paul Rodrigue, Hofstra University
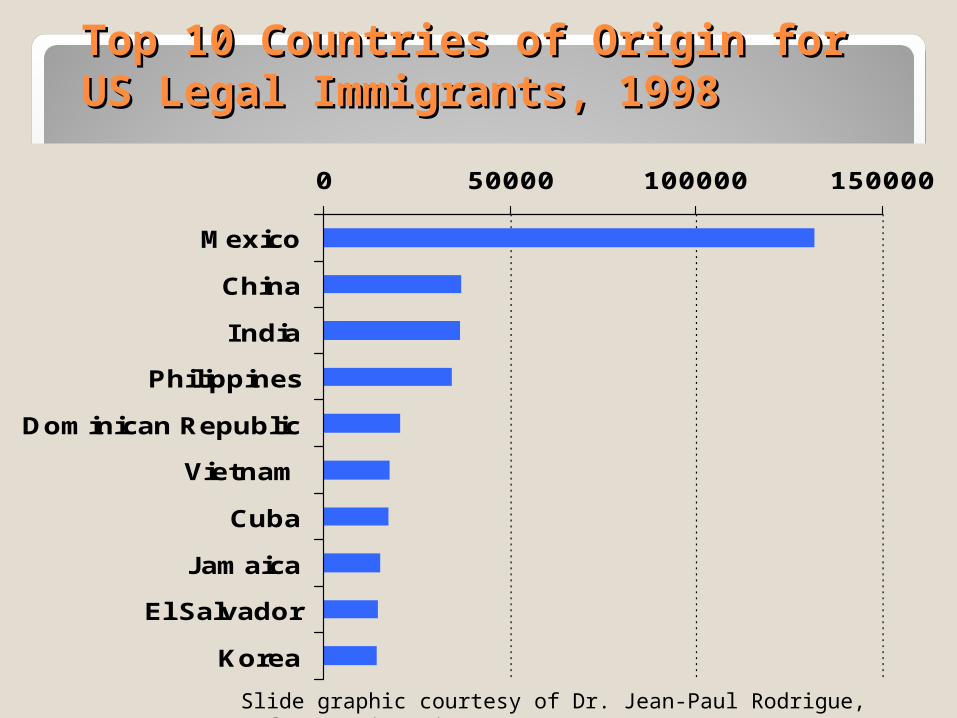
Top 10 Countries of Origin for Top 10 Countries of Origin for US Legal Immigrants, 1998US Legal Immigrants, 1998
0 50000 100000 150000
Mexico
China
India
Philippines
Dominican Republic
Vietnam
Cuba
Jamaica
El Salvador
Korea
Slide graphic courtesy of Dr. Jean-Paul Rodrigue, Hofstra University
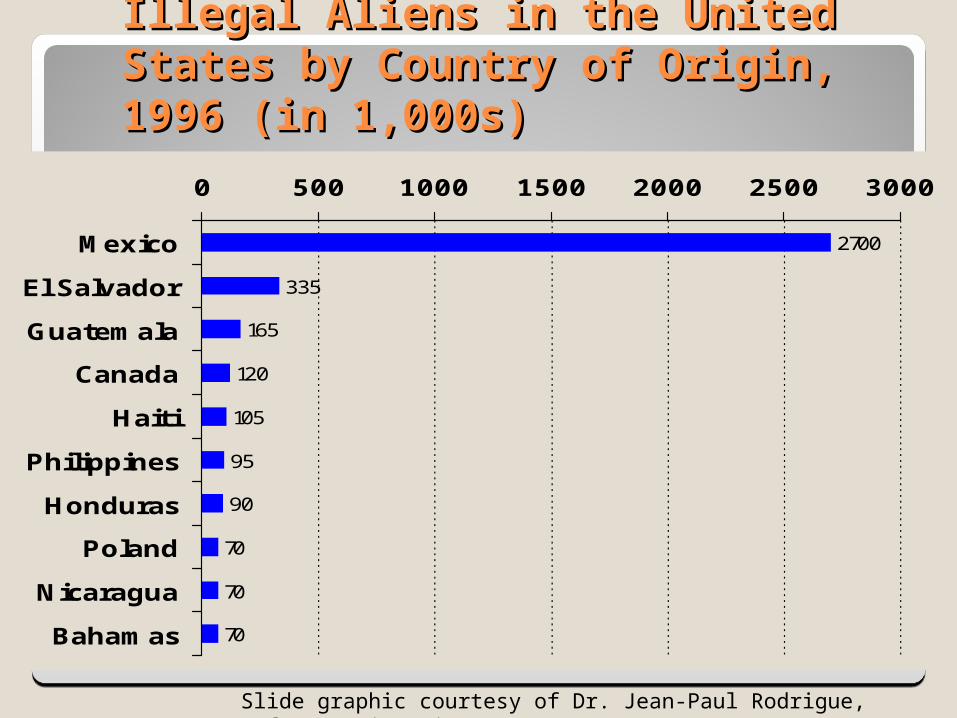
Illegal Aliens in the United Illegal Aliens in the United States by Country of Origin, States by Country of Origin, 1996 (in 1,000s)1996 (in 1,000s)
2700
335
165
120
105
95
90
70
70
70
0 500 1000 1500 2000 2500 3000
Mexico
El Salvador
Guatemala
Canada
Haiti
Philippines
Honduras
Poland
Nicaragua
Bahamas
Slide graphic courtesy of Dr. Jean-Paul Rodrigue, Hofstra University
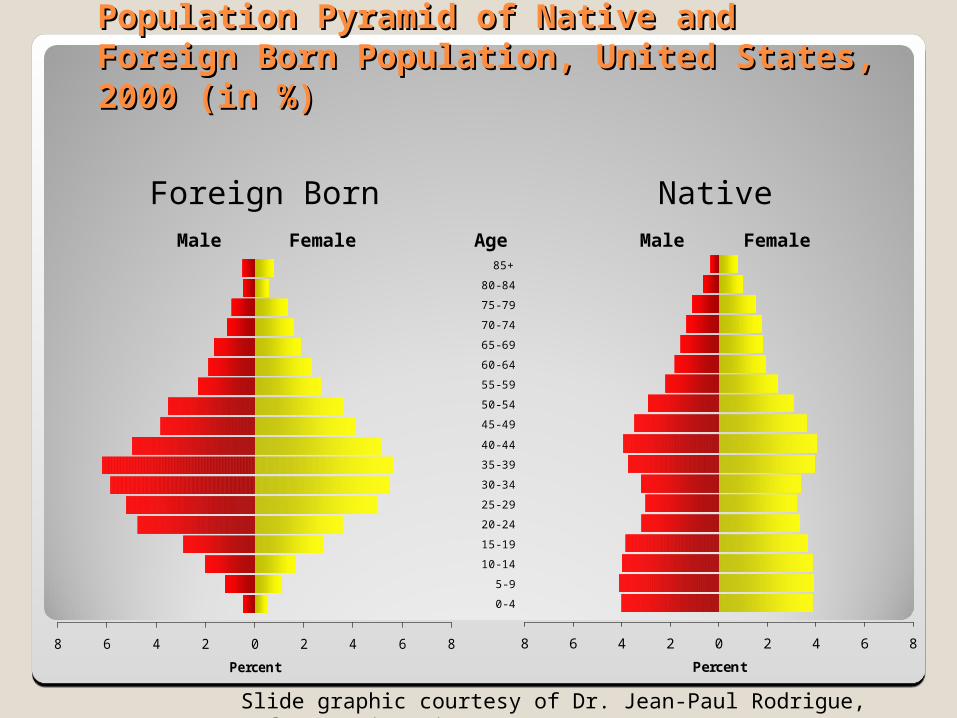
Population Pyramid of Native and Foreign Population Pyramid of Native and Foreign Born Population, United States, 2000 (in Born Population, United States, 2000 (in %)%)
8 6 4 2 0 2 4 6 8
Percent
Male Female FemaleMale
Foreign Born Native
8 6 4 2 0 2 4 6 8
0- 4
5- 9
10- 14
15- 19
20- 24
25- 29
30- 34
35- 39
40- 44
45- 49
50- 54
55- 59
60- 64
65- 69
70- 74
75- 79
80- 84
85+
Percent
Age
Slide graphic courtesy of Dr. Jean-Paul Rodrigue, Hofstra University
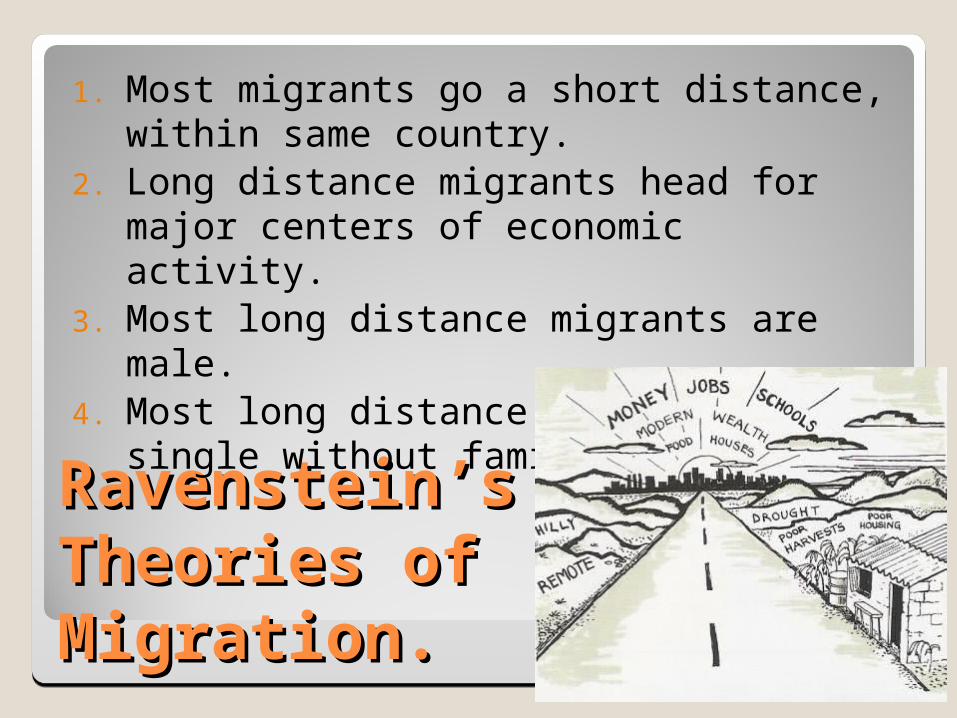
Ravenstein’s Ravenstein’s Theories of Theories of Migration.Migration.
1. Most migrants go a short distance, within same country.
2. Long distance migrants head for major centers of economic activity.
3. Most long distance migrants are male.4. Most long distance migrants are single
without families.
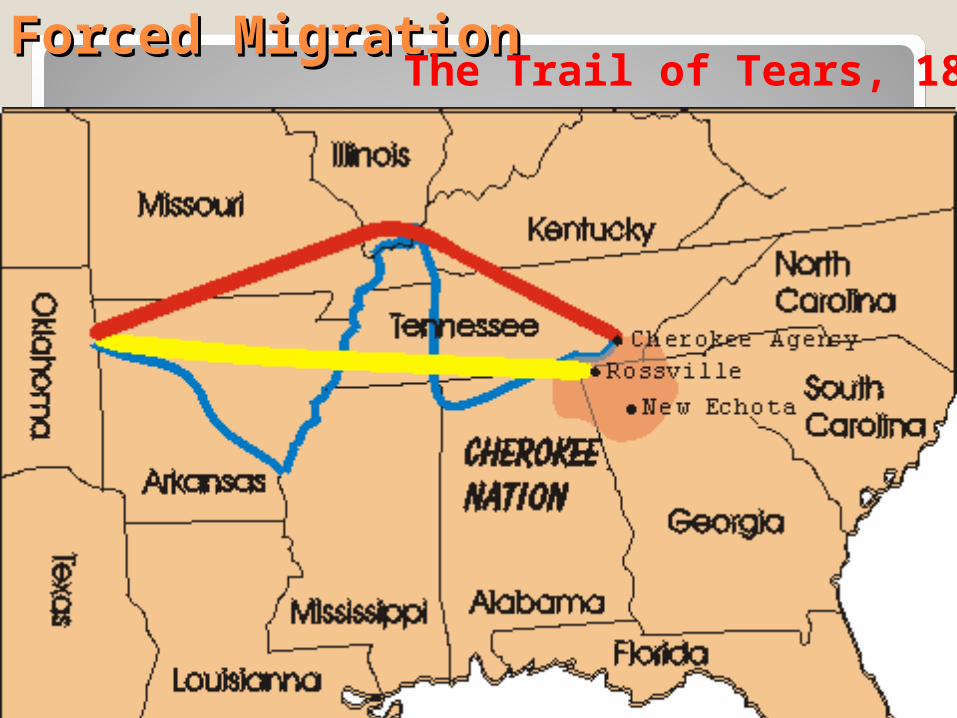
Forced MigrationForced MigrationThe Trail of Tears, 1838