might i interest you in an extended warranty? risk of product failure (after the base warranty...
TRANSCRIPT

Might I Interest You in an Extended Warrantylowast
Hyeong-Tak Lee Sriram Venkataraman
Kenan-Flagler Business School Kenan-Flagler Business School
July 1 2016
Abstract
Retailers routinely market extended warranties to durable-goods buyers Extended warranties are
optional and need be purchased at an additional cost However manufacturer-backed base warranties
come bundled with the product at no additional cost The question of whether and how base warshy
ranties affect buyersrsquo purchase of extended warranties remains central to how and to whom extended
warranties get marketed We test the impact of base warranties on the purchase-incidence rate of exshy
tended warranties in the used-vehicles market In this market two otherwise identical vehicles may
only differ (marginally) in the amount of their residual base warranties Additionally the expiry terms
of the base warranties are a deterministic function of the vehicle exceeding certain pre-determined cutshy
offs (mileage cutoffs) We employ a regression discontinuity design by comparing extended-warranty
purchase-incidence rates just below and above the expiry of manufacturer-backed warranties We find
that used-vehicle buyers do indeed adjust their likelihood of purchase of extended warranties in a statisshy
tically and economically significant way in response to the stock of residual base warranty still available
in the vehicle purchased We quantify the window of opportunity wherein auto dealers have the highshy
est likelihood of success selling extended warranties and also quantify how this window of opportunity
varies by country of origin of the automaker
Keywords Extended warranties durable goods retailing lowastHyeong-Tak Lee is a doctoral candidate in marketing at the Kenan-Flagler Business School University of North Carolina
- Chapel Hill Email Hyeong-Tak_Leekenan-flagleruncedu Sriram Venkataraman is an associate professor of marketing at the Kenan-Flagler Business School University of North Carolina - Chapel Hill Email venkatskenan-flagleruncedu The authors acknowledge the support of a prominent syndicated-market-research data provider for releasing the data used in this study This study has benefited substantially from conversations with professors Pradeep K Chintagunta Preyas Desai Katrijn Gielens Timothy Gilbride Rajdeep Grewal Jeff Inman Pranav Jindal Tarun Kushwaha Don Lehmann Shijie Liu Gary Lilien Robert Meyer J Andrew Petersen Arvind Rangaswamy JB Steenkamp David Stewart and Russell Winer All errors are our own The usual disclaimer applies
1
1 Introduction
The automobile industry is a vital part of the US economy and contributes approximately 36 or $500
billion to the total GDP output (Bureau of Labor Statistics 2009) Given its economic significance and
rich institutional features the automobile industry has had natural appeal for academic inquiry in marshy
keting and economics The extant academic literature is rich in insights around pricing (Boyle and Hog-
arty 1975 Bresnahan 1981 Berry et al 1995 Sudhir 2001) consumer-directed price promotions (Pauwels
et al 2004 Bruce et al 2006) trade promotions (Bruce et al 2005) channel pass-through (Busse et al
2006) information search (Punj and Staelin 1983) leasing versus selling (Desai and Purohit 1998 1999
Bhaskaran and Gilbert 2005) new- versus used-car competition (Purohit 1992) consumer-adoption deshy
cisions (Schiraldi 2011) dealer-consumer negotiations (Desai and Purohit 2004) product obsolescence
(Levinthal and Purohit 1989) hybrid car adoption (Huang 2010 Gallagher and Muehlegger 2011) etc
Amid the ongoing global economic crisis the US auto industry has experienced tremendous strucshy
tural changes and garnered renewed interest among scholars to study how these changes impact auto
buyers and sellers This study investigates one such feature of the current marketplace ie the aggresshy
sive marketing of extended warranties by auto dealers1 Extended warranties are marketed by dealers
after the buyer commits to the purchase of the vehicle (new and used)2 An extended warranty is an
agreement between an administrator and a vehicle owner wherein the administrator agrees to pay for
the replacement or repair for a specific coverage period of vehicle parts in the event of a mechanical
breakdown Unlike base warranties which are provided by manufacturers and come bundled with the
product at no additional cost to the buyer (Soberman 2003) extended warranties are optional and can
be purchased by the buyer separately at an additional cost (Chu and Chintagunta 2009 2011 Desai and
Padmanabhan 2004)3 Extended warranties are purchased by buyers so as to insure themselves against
the risk of product failure (after the base warranty expires) Extended warranties supplement manushy
facturersrsquo original warranties and provide a broad array of coverage options but do not usually cover
routine maintenance or repairs due to excessive use4
1While vehicle buyers can purchase extended warranties any time before the base warranty expires (albeit at a higher price) these are most often purchased at the point of purchase (Jindal 2015) Buyers of older used vehicles with expired base warranties can either purchase the extended warranty at the point of purchase or elect to forgo altogether the insurance benefits from having warranty coverage
2Prices charged by the dealers for extended warranties are never advertised which severely limits the ability of the buyer to engage in price comparisons
3Extended warranties can be underwritten by either the manufacturer or independent third parties (Chu and Chintagunta 2011 Jindal 2015)
4Coverage of the extended warranty kicks in after the vehiclersquos bumper-to-bumper base warranty expires
2
In 2012 alone consumers spent $147 billion on extended service contracts5 Yet very little empirical
research exists on this important topic The few empirical studies that do exist either investigate the role
of base warranties (Chu and Chintagunta 2009 2011) or extended warranties (Chen et al 2009 Jindal
2015) but not both Therefore key managerially relevant questions remain unanswered For example
1 Ceteris paribus do purchase-incidence rates for extended warranties vary systematically before and
after expiry of the base warranty
2 Should extended warranties be marketed more aggressively to auto buyers before or after their
manufacturer-issued base warranty expires
These questions of whether and how base warranties affect buyersrsquo purchase of extended warranties are
central to how and to whom extended warranties get marketed
These aforementioned research questions are also relevant to policy makers as the number of conshy
sumers who choose to insure against product failure has steadily increased For example in the US
auto industry over the past fifteen years the purchase rates for extended warranties has risen steadily
from 20 to 42 (Warranty Week 2010) This has occurred despite concerns raised in the popular press
that these extended warranties are not worth buying Additionally recessionary concerns in concert
with automobiles becoming more reliable have owners and potential buyers holding on to their current
vehicles longer than they have done in years past6 As buyers anticipate holding on to their vehicles
longer and well past their vehiclersquos base warranty extended warranties have continued to experience
a healthy compound annual rate of 135 since 2009 As markets rebound and credit becomes more
easily available to auto buyers industry insiders anticipate that a flood of used vehicles will enter the
secondary market as their previous owners trade these in for new (or used) vehicles If the current
owner of a soon-to-be-traded-in vehicle purchased an extended warranty the residuals on the vehiclersquos
extended and base warranty will get transferred at no additional cost to the subsequent buyer of her
vehicle In turn for the reduced uncertainty she faces with the purchase of a warrantied used vehicle
the subsequent buyer may anticipate paying a higher sales price7 Correspondingly should the base
warranty be expired and the previous owner not have purchased an extended warranty the subsequent
5Source Warranty Week 6In fact a recent study by Polk reports that the average age for vehicles in America has steadily climbed to an all-time high
of 114 years in 2013 - up from 9 years in 2006 This upward trend in the age of existing vehicles is expected to continue for the next four to five years Source httpwwwcnbccomid100940923
7These motivations have also led to a rapid growth in the market for certified pre-owned vehicles Herein automakers recondition the certified pre-owned vehicles through a comprehensive inspection and often bundle the extended bumpershyto-bumper and power-train warranties (Source AutoTradercom 2013) In turn consumers pay a price premium for this certification in exchange for alleviating the risk involved with the purchase of a used vehicle
3
buyer may anticipate paying a lower price for this vehicle relative to a like vehicle with a residual base
andor extended warranty The buyer of the used vehicle can also decide to purchase or forgo the
extended warranty She does so depending on her own intrinsic preferences and expectations about
product quality and repair costs and the presence and size of the residual warranty on her purchased
vehicle
This study investigates these aforementioned questions in the empirical context of used-vehicle sales
We focus on the used-vehicles market for several reasons In the US the volume of used-vehicle sales is
larger than new-vehicle sales Unlike new vehicles not all used goods have residual base warranties We
exploit this rich and ldquopre-determinedrdquo variation in the availability and size of residual base warranty to
quantify the tradeoff that buyers make between base and extended warranties Herein the terms of the
base warranties are pre-determined and expire upon select vehicle characteristics exceeding a certain
threshold value Furthermore the expiry terms of the base warranties (i) cannot be manipulated by
the buyerseller (ii) are pre-determined by the automobile manufacturer and (iii) are a deterministic
function of the vehicle exceeding certain pre-determined cutoffs (mileage cutoffs in our case)
These unique institutional features of the secondary market for automobiles allow us to quantify how
extended-warranty-purchase rates of otherwise identical vehicles vary pre- and post-expiry of the base
warranty after controlling for other concomitant factors However the buyerrsquos intrinsic risk preference ndash
which drives her decision to purchase an extended warranty ndash also drives her decision to select a vehicle
withwithout a residual warranty Identification in our setting comes from the assumption that potential
outcomes are smooth in the region around the expiry of the base warranty threshold after controlling
for systematic variation in transacted prices pre- and post-expiry of the base warranty Because the
terms of the base warranty are pre-determined concerns about strategic behavior by agents that pose a
threat to causal inference are allayed in the ldquolocalrdquo region where our causal effect is estimated (McCrary
2008) Since manufacturer-backed warranties include both basic and power-train warranties we recover
estimates of the tradeoffs that buyers make for both of these manufacturer-bundled warranties
Key findings are as follows
1 The purchase rates for extended warranties rise gradually leading up to the expiry of the basic
warranty
2 Purchase rates drop by approximately 3 percent at the point when the basic warranty expires
3 Thereafter the purchase rates remain constant and at a rate much higher than the pre-basicshy
4
warranty-expiry level
Our empirics also reveal interesting new insights for managers when it comes to tradeoffs that buyers
make between power-train and extended warranties Contrary to the tradeoffs buyers make with basic
warranties purchase rates for extended warranties
1 Remain constant leading up to the expiry of the power-train warranty
2 Rise sharply by about 102 percent at the point when the power-train warranty expires
3 Fall steadily to a rate well below their pre power-train-expiry level after expiry of the power-train
warranty
These findings suggests that the most opportune time to market an extended warranty is shortly before
the basic warranty expires and then again at or just after the power-train warranty expires Dealers can
harvest many more opportunities within this window than outside of it8 These findings suggest that
after controlling for the strategic sorting of buyers when it comes to the purchase of extended warranties
for used vehicles insurance motivations dominate in the region around the expiry of the basic warranty
However signaling motivations dominate in the region around expiry of the power-train warranty We
elaborate on this point later in the study
Our net effects also differ by country of origin of the automaker For example the drop in purchase
rates when the basic warranty expires is more precipitous for domestic vehicles (64 versus 3 across
all vehicles) However purchase-incidence rates do not change in the region pre- and post-expiry of
the manufacturer-backed power-train warranty These effects are reversed for foreign auto makers
Purchase-incidence rates rise by as much as 15 for foreign automakers at the point when their power-
train warranties expire However the purchase rates remain unchanged at the point of expiry of their
basic warranty
Taken together our net-effect findings have important implications for marketing managers (auto
dealers and warranty underwriters) as they provide valuable guidance on how and to which consumers
extended warranties should be marketed The rest of the study is organized as follows In Section 2 we
briefly review the extant literature on warranties In section 3 we describe our empirical setting and
8For one to generate normative recommendations for optimally targeting buyers one would need to recover the underlying risk preferences of used-vehicle buyers Jindal (2015) proposes a framework to explore this in the context of new durable goods using stated-choice data Understanding how Jindalrsquos empirical strategy can be extended to a used-goods setting using observational data alone is outside the scope of this study
5
data This is followed by a detailed review of the causal-inference-motivated empirical design The last
section concludes with a summary of our findings and directions for future research
2 Related Literature
Scholarly inquiry on the provisioning of warranties is very rich in theory The theoretical underpinnings
can be broadly classified into distinct yet related research streams that differ primarily on the economic
role played by warranties In the following subsections we review each of these economic motives
21 Warranties as an Insurance Motive
Warranties are a binding contract made by a seller to a buyer wherein the seller assumes specific responshy
sibilities if the purchased product fails to meet the specifications or legitimate contractual expectations
of the buyer (Parisi 2004) Warranties often offer consumers compensation andor replacement when
the product fails Under the assumption that consumers are risk-averse and firms are risk-neutral warshy
ranties operate as a risk-sharing mechanism where risk stems from uncertainty about product quality
(Heal 1977) In settings where consumers are risk-neutral or risk-loving they do not need any warranty
protection because they willingly bear all the risk However as long as the consumers are risk-averse
warranties serve as an insurance against product failure under pre-determined conditions (Kelley and
Conant 1991)
Thus insurance motivations imply a positive correlation between consumersrsquo degree of risk-aversion
and their intrinsic preference towards warranty (base andor extended) Therefore all else being equal
we expect that higher-risk-averse consumers will more likely purchase extended warranties and condishy
tional on purchasing extended warranties elect longer-term warranties By virtue of being risk-averse
these consumers are also more likely to purchase used vehicles with higher residual base warranties
than consumers with low risk-aversion Hence because of insurance motivations ceteris paribus theshy
ory would predict that the conditional likelihood of buyers purchasing extended warranties for used
vehicles would be higher prior to the expiry of a base warranty than after expiry
22 Warranties as a Signaling Motive
Spence (1973) was the first to theorize that the signaling mechanism could be used to realize informashy
tion flow credibly amongst market agents Herein consumers treat the provisioning of a warranty as
6
a credible indicator of product quality (Murthy and Blischke 2006) The seminal Spence (1977) study
explores the quality signaling of price and warranties when the quality of the product is not readily obshy
servable to consumers In equilibrium the quality can be credibly signaled and suitably inferred from
warranties under two conditions i) the provision of warranties is costly to the seller and ii) the proshy
duction cost rises with product reliability Grossman (1981) shows that when the quality of the product
is ex post verifiable high-quality sellers can distinguish themselves from low-quality sellers by offering
warranties
Predictions from these aforementioned signaling studies imply that warranty provisioning helps
firms credibly signal higher product quality to consumersbuyers9 Correspondingly we expect that
a higher-quality seller will offer longer and more attractive warranties than a lower-quality-producing
competitor Predictions from these studies suggest that ceteris paribus buyers perceive the used vehishy
cles with the residual warranty to be of better quality compared to a like vehicle without any residual
warranty Since these buyers associate residual warranties with higher quality these buyers are less
inclined to buy extended warranties on the used vehicles with residual warranties than like vehicles
without any residual warranties This prediction runs counter to the aforementioned insurance motives
of warranties Therefore the net effect of these two countervailing motives remains an open research
question and one that is critical to how and to whom extended warranties are marketed
23 Warranties as an Incentive Motive
The incentive motive examines consumersrsquo and firmsrsquo incentives as they pertain to the provision of
warranties (Cooper and Ross 1985 Dybvig and Lutz 1993 Lutz 1989 Mann and Wissink 1989 Priest
1981) The firm faces two incentives to enhance product durability as a result of warranty provisioning
The first is to signal the product quality using the warranty the same as the signaling motive The
difference is that as the firm endogenously determines the quality level of the product it encounters the
tradeoff between product cost and warranty cost When the product is sold with a warranty the firm
may cheat on quality to lower the production cost at the same time such firm behavior leads to a higher
warranty cost Hence the warranty deters firms from deviating on quality (Spence 1977) Cooper and
Ross (1985) and Lutz (1989) consider firmsrsquo signaling incentives to consumers who choose how much
maintenance efforts to exert on their purchases Both papers analyze a model in which the buyer and
9When a lower-quality firm offers warranty terms comparable to a higher-quality seller it will incur very high costs to serve its warranty commitments This deters a low-quality firm from providing the same warranty terms as a higher-quality firm This is what makes the signaling via warranties credible (Chu and Chintagunta 2011 Kirmani and Rao 2000)
7
seller can influence the product performance Lutz (1989) shows that a negative relationship between
warranties and product quality is possible in the presence of consumer moral hazard Here when not
all firms provide warranties faced with quality uncertainty consumers will opt out of firms that do not
offer warranties This will result in all firms providing warranties Since low-quality products cannot
bear the warranty costs they will be driven out of the market Taken together the two countervailing
incentive mechanisms of warranties explain the mixed empirical findings of the relationship between
product reliability and warranty provisioning
24 Warranties as a Sorting Motive
The sorting theory posits that warranties are a credible way for firms to screen consumers Effective
screening facilitates extraction of greater surplus by price-discriminating across these screened conshy
sumers (Kubo 1986 Matthews and Moore 1987 Lutz and Padmanabhan 1998 Padmanabhan and Rao
1993 Padmanabhan 1995) A key assumption of the sorting motive is the presence of a heterogeneous
preference for risk-aversion amongst consumers (Grossman 1981 Lutz and Padmanabhan 1998) Padshy
manabhan and Rao (1993) show that the optimal combination of price and warranty can increase a manshy
ufacturerrsquos profit in a market where (i) consumers exhibit a heterogeneous preference for risk-aversion
and (ii) there is room for consumer-side moral hazard Padmanabhan (1995) considers the role of heteroshy
geneity in consumersrsquo usage of warranties and consumer moral hazard which then creates variation in
their willingness to pay for a price-warranty contract Lutz and Padmanabhan (1998) show that manushy
facturer profits from the high-valuation consumers remain unchanged The presence of an independent
insurer causes the manufacturer to drop a product intended for low-valuation consumers resulting in a
reduction in the overall profits for the manufacturer
In sum sorting theory predicts that households with the same observed characteristics demand difshy
ferent levels of warranties depending on their inherent preference for risk Understanding how sorting
amongst buyers (through warranties and prices paid for these warranties) impacts purchase rates for
extended warranties remains unexplored and is key to how dealers price-discriminate across buyers
25 Papers That Consider Base and Extended Warranties
Lastly we identified four published papers that consider the interaction between base and extended
warranties Padmanabhan and Rao (1993) present a model that designs optimal warranty policy for
manufacturers under the situation in which consumers are heterogeneous in their risk preference and
8
product failure depends on the level of consumersrsquo maintenance effort and usage both of which are
unobserved to the firm Lutz and Padmanabhan (1995) study why manufacturers offer minimal base-
warranty contracts in the presence of consumer moral hazard in a competitive insurance market They
show that manufacturersrsquo optimal strategy is to unbundle the base warranty from the product because
bundling creates a cost disadvantage over an independent insurer Lutz and Padmanabhan (1998) conshy
sider the same problem under conditions of producer moral hazard and the independent insurer They
find that the heterogeneity in risk preference significantly affects a menu of base warranties and that
the profitability from screening hinges on the degree of competition with the independent insurer In
the context of channel distribution Jiang and Zhang (2011) show that a retailerrsquos service plan and
manufacturer-issued base warranty are substitutes Jiang and Zhang (2011) assume that there is no
consumer-side moral hazard The primary goal of these papers is the development of a theoretical
model to design an optimal base-warranty policy when the insurance market is competitive and conshy
sumers vary in their willingness to pay for warranties In contrast the objective of the current study is
to examine how the presence of a residual base warranty affects the demand for an extended warranty
Padmanabhan and Rao (1993) examine the effect of the duration of a base warranty on extended-
warranty sales in the new-vehicle market In their new-vehicle setting when quality is unobservable a
high-quality automaker offers more comprehensive base warranty coverage than a lower-quality seller
Longer and more attractive base warranties reduce consumersrsquo need for (optional) extended coverage
As a result the authors estimate a negative correlation between the average length of the base warranty
and the choice probability of an extended warranty
In contrast our analysis is conducted in the context of the used-car market The distinction is subshy
stantively quite important Since new vehicles have their entire base warranty intact new-vehicle buyers
face limited variation in the amount of base warranty that needs to be traded off against an extended
warranty Unlike new vehicles not all used goods have residual base warranties We exploit this rich
and ldquopre-determinedrdquo variation in the availability and size of residual base warranties to quantify the
tradeoff that buyers make between base and extended warranties Herein the terms of the base warshy
ranties are pre-determined and expire upon select vehicle characteristics exceeding a certain threshold
value Hence our empirical setting lends itself nicely to an RD-based quasi-experimental design (Imshy
bens and Lemieux 2008) Because of the quasi-experimental design the empirical strategy permits reshy
liable causal inference of the aforementioned tradeoffs made by used-vehicle buyers Specifically we
provide estimates for the pooled ldquolocalrdquo net effect and also quantify how this net effect varies with veshy
9
hicle characteristics We focus on recovering the variation in the attachment rate in the region very close
to the expiry of the base warranty Identification comes from the assumption that potential outcomes are
smooth in the region around the expiry of the base warranty threshold after controlling for systematic
variation in transacted prices pre- and post-expiry of the base warranty Because the terms of the base
warranty are pre-determined concerns about strategic behavior by agents that pose a threat to causal
inference are allayed (McCrary 2008)10
3 Data
We leverage a novel new database from a major auto-industry market-research firm11 The data proshy
vided to us include detailed transaction-level information for every vehicle purchased at 50 randomly
selected dealerships across Georgia North Carolina South Carolina Tennessee and Virginia between
July 2009 and July 2014 For each transaction the data contain a VIN identifier of the vehicle purshy
chased date of purchase age of the buyer ZIP code of the buyer odometer mileage etc We coded up
a VIN-decoder that permits recovery of VIN-specific attributes including vehicle make model trim
model-year engine size etc12 For each transaction we know information on the transaction price for
the vehicle purchased whether or not the sale was accompanied by a trade-in the price of the trade-in
(if any) and the price paid for the extended warranty (if any) In addition we observe whether the
vehicle purchased was leased financed or paid in full
The full dataset contain 135813 transactions spanning sales of both new and used vehicles Given
our research objectives we limited our attention to only used-vehicle transactions made by individual
buyers13 We also eliminated observations where the purchased vehicle already included an extended
warranty (either purchased by the previous owner or if the vehicle came certified) We do so because
for these vehicles we cannot directly ascertain the warranty residuals (at the point of purchase) andor
the price paid for the inclusion of the extended warranty by the current buyer
Since vehicle VINs do not directly contain information on the manufacturer-backed factory warshy
ranties we augmented our sales-transactions database with auxiliary data obtained from Carscom and
companiesrsquo websites We report the factory-warranty terms across key manufacturers and their brands
10Later in the paper we discuss how our analysis is robust to threats from self-selection 11Our non-disclosure agreement prevents us from disclosing the identity of our data source 12We built our VIN-decoder using the yearly-vehicle-attribute details generously provided to us by our data source 13The data released include all types of sales made at these dealerships These include individual fleet and B2B sales Since
the economic motives for these agents differ drastically from individual buyers we left these out of our empirical analysis Individual transactions were screened based on whether birth dates were included for the buyers
10
in Table 1 As seen in Table 1 there is rich variation in factory-warranty terms across manufacturers
Herein the basic warranty or ldquobumper-to-bumperrdquo policy covers the cost of most repairs except normal
wear and tear (such as replacement of oil filters) A power-train warranty on the other hand covers
major internal parts of the vehicle such as the engine and transmission Basic warranties are in effect
between two through five years from the date when the factory warranty is activated14 The most comshy
monly occurring basic warranties are 3-years36000 miles (4146) 4-years50000 miles (3902) and
5-years60000 miles (731) Power-train warranties have more expansive coverage than basic warshy
ranties They range anywhere from two to ten years The 4-years50000 miles (2439) 5-years60000
miles and 5-years100000 miles (2195) are the most commonly occurring power-train warranty terms
Both the basic and power-train warranty terms vary across manufacturers For example Ford
(brands include Ford and Mercury) Toyota (brands include Toyota and Scion) Nissan Honda Subaru
Mazda and Volkswagen provide a power-train warranty coverage for 5-years60000 miles In contrast
General Motors (brands include Chevrolet GMC and Pontiac) and Chrysler (with Chrysler and Dodge)
offer 5-years100000 miles coverage Even within a manufacturer warranty terms vary across brands
For example General Motors Honda Nissan and Toyota offer two policies and Ford provides three
policies across different brands within their product portfolios However warranty coverage remains
the same across models within the same brand (for example Hyundai Elentra and Hyundai Sonata both
have 5-years60000 miles and 6-years100000 miles coverage) Amongst manufacturers with multiple
warranty policies the most widely offered combination of basic and power-train warranties includes
the 3-years36000 miles and 5-years60000 miles (3529) coverage plans
In addition to manufacturer-backed factory warranties buyers (of both new and used vehicles) have
the option to extend the duration of their purchased vehiclersquos factory-warranty coverage by purchasing
an extended warranty Similar to the factory-warranty terms auto manufacturers offer a fairly differenshy
tiated menu of extended-warranty plans For example Honda and Mazda sell one extended-warranty
policy while General Motors Nissan and Toyota present three varying coverages for the extended
warranties they underwrite Ford and Volkswagen provide the most differentiated extended-warranty
plans with four and five products respectively The specific terms of extended warranties also vary
across automakers The Ford-PremiumCARE plan covers 13 major auto parts with deductibles of $0 to
$100 with varying yearmileage limits (112000 to 575000)15 Toyota Certified Platinum VSA overlaps
14Usually this happens when the vehicle is originally delivered to the dealer from the assembly plant 15These include the engine transmission rear-wheel-drive axle front-wheel-drive axle steering brakes front and rear
suspension electrical air conditioning and heating high-tech emissions audio and the safety These details were obtained
11
the most with Ford-PremiumCARErsquos coverage in terms of components but differs along other dimenshy
sions (7-years100000 miles versus 8-years125000 miles) Extended warranties can be sold either by
the manufacturer the dealer or a third-party Manufacturers sell extended warranties either direct-toshy
the-consumer or through their expansive franchised dealer-network General Motors is the only exshy
ception Ally Financial Inc runs GMrsquos extended warranty business Additionally well-established
third-party warranty companies such as GE Capital Lubrico Global and Pafco underwrite the exshy
tended warranty contracts sold by dealers (Soberman 2003) Table 2 presents details on the extended
warranties offered by select manufacturers16
For our empirical analysis we limited the set of brands to the top 15 in terms of cumulative sales
Collectively these included brands account for 8475 of all the used-vehicle sales in our sample After
applying the aforementioned screening criteria our final estimation sample consists of 20817 observashy
tions (or about 1533 of the transactions originally contained in our database) Our estimation sample
spans 41 dealers covers 15 automakers and includes a total of 2216 unique make-model-dealer combishy
nations Table 3 contains summary statistics for the key variables of interest
4 Empirical Strategy
New vehicles (for the most part) have their entire factory-warranty coverage intact at the time of purshy
chase This leaves little variation to assess how buyers trade off factory warranties against optional
extended warranties However used vehicles vary drastically in age and mileage Correspondingly
this induces natural variation in factory-warranty residuals across transacted vehicles Because factory-
warranty terms are pre-determined (set at the time the vehicle was manufactured) these terms cannot
be strategically manipulated by either the previous owner or the dealer Herein the factory warranties
expire upon select vehicle characteristics exceeding a pre-determined set of threshold values We exploit
this rich and pre-determined variation in the availability and size of residual-factory warranties to quanshy
tify the tradeoff that buyers make between factory (basic and power-train) and extended warranties
Our empirical setting therefore lends itself nicely to a regression-discontinuity-based quasi-experimental
design which also affords us a reliable causal inference The regression-discontinuity (RD) approach is
a quasi-experimental research design in which observational units are assigned to a treatment based
on whether their value of an observed covariate is above or below a known cutoff This discontinushy
from Fordrsquos website 16Ford does not offer zero deductibles for used vehicles
12
ous jump induces ldquovariationrdquo in the treatment assignment that may be regarded as being unrelated to
potential confounders for observations near the cutoff or threshold In our empirical setting too the
likelihood of receiving a treatment (ie a vehicle with an expired base warranty) jumps sharply based
on an observable covariate of the purchased vehicle (mileage of the vehicle) Using an RD-based-causalshy
inference-design approach we estimate the average local effect (of the expiry of the base warranty on
purchase rates of extended warranties) Specifically we quantify the impact of the expiry of each type
of base warranty on the purchase rates of extended warranties in the region ldquolocalrdquo to the expiry of the
respective base warranties In the section below we first discuss the RD design more generally followed
by a detailed exposition of the sharp RD approach that we take to our data17
41 Overview of Regression-Discontinuity Design
Researchers are often interested in the causal effect of a binary intervention or treatment Units may be
individuals firms products (a unique vehicle in our setting) etc Each of these units is either exposed
or not exposed to a treatment The effect of the treatment is potentially heterogenous across units Let
Yi(0) and Yi(1) denote the potential outcomes when observational unit i = 1 2 n is not exposed
and when it is exposed to a treatment respectively If we had access to panel data wherein every time
the observational unit is observed the unit is randomly assigned to either the treatment or no treatment
condition Then we would simply focus on the differences Yi(1) minus Yi(0) to make a causal inference
Unfortunately in most empirical settings we never observe the pair Yi(0) and Yi(1) together This
problem arises because most often the researcher either has one observation per unit (as is the case in
our empirical setting) or the unit is either in the exposednot-exposed condition (in a panel setting)
Causal inference therefore typically focuses on the average effects of the treatment Yi(1) minus Yi(0) across
units rather than on unit-level effects For unit i we observe the outcome corresponding to the treatment
received If Wi isin 0 1 denote the no treatment and the treatment condition of unit i respectively then
the observed outcome can be expressed as
Yi = (1 minus Wi) lowast Yi(0) + Wi lowast Yi(1) =
⎧ ⎪⎨ ⎪⎩
Yi(0) if Wi = 0
Yi(1) if Wi = 1
17For a more expansive review of the technical details the reader is referred to Lee and Lemieux (2010) Imbens and Lemieux (2008) and Van der Klaauw (2008)
13
The unique feature of the RD design is that assignment to the treatment is determined either completely
or partly by the value of a predictor Xi (which has a continuous support ex mileage in our setting)
being on either side of a fixed threshold Additionally predictor Xi itself can have a direct impact on the
potential outcomes Therefore any discontinuity in the conditional distribution of the outcome Yi(bull)
as a function of this covariate ndash at the cutoff value ndash is interpreted as evidence of a causal effect of the
treatment
Such treatment assignments often arise in practice For example in Thistlethwaite and Campbellrsquos
(1960) original application of the RD method an award was made to students whose test score was
higher than a minimum score on a scholarship examination Hahn et al (1999) study the effect of an
anti-discrimination law that only applies to firms with at least 15 employees In the seminal Card et
al (2008) study eligibility for medical services through Medicare is pre-determined by age In Ludwig
and Miller (2007) the Head Start program funding rates are governed by Office of Economic Opportushy
nity (OEO) cutoffs18 Matsudaira (2007) investigates the effect of a remedial summer-school program
that is mandatory for students who score less than some cutoff level on a test In our empirical setshy
ting treatment occurs when the mileage on a vehicle reaches andor exceeds a certain pre-determined
mileage cutoff Specifically upon reaching this mileage cutoff the manufacturer-issued basic andor
power-train warranty gets voided
In the sharp RD setting (SRD) the assignment to the treatment Wi is a deterministic function of one
(or many) covariates each of which is observed and has continuous support Let X denote the forcing
variable (or treatment-assignment variable) then Wi = 1(Xi ge z) Herein all units with a covariate
value of at least z are assigned to the treatment group and all units with a covariate value of less than
z are assigned to the control group In this design the average causal effect of the treatment is the
discontinuity in the conditional expectation of the outcome given the covariate at the discontinuity
point Formally
τSRD = E[Yi(1) minus Yi(0)|Xi = z] = lim E[Yi|Xi = z] minus lim E[Yi|Xi = z] (1) xdarrz xuarrz
Recall that matching-type treatment-effect estimators are grounded in the ldquounconfoundednessrdquo asshy
sumption (see Rosenbaum and Rubin 1983 Imbens 2004) That is
18The Head Start program was established in 1965 as part of the War on Poverty initiative The federal program provides preschool health and other social services to poor children age three to five and their families
14
Yi(0) Yi(1) perp Wi|Xi (2)
This assumption readily holds in SRD because conditional on the covariates there is no variation
in the treatment Matching-type approaches also requires that for all values of the covariates the data
contain both treated and control units
0 lt Pr(Wi = 1|Xi = z) lt 1 (3)
This assumption by construction does not hold in SRD design Instead in SRD for all values of x the
probability of assignment is either 0 or 1 rather than always between 0 and 1 As a result there are no
values of x with overlap Therefore SRD warrants the unavoidable need for extrapolation However
in large samples the amount of extrapolation required to make inferences is arbitrarily small as we
only need to infer the conditional expectation of Y(w) given the covariates ε away from where it can be
estimated So as to avoid non-trivial extrapolation we focus on the average treatment effect at Xi = z
That is
τSRD = E[Yi(1) minus Yi(0)|Xi = z] = E[Yi(1)|Xi = z] minus E[Yi(0)|Xi = z] (4)
However by design there are no units with Xi = z for which we observe Yi(0) We therefore exploit
the fact that we observe units with covariate values arbitrarily close to z However in order to justify
this averaging one needs to assume smoothness which is often formulated in terms of conditional
expectations (Hahn et al 2001)
Taking advantage of the local continuity condition enables us to make individual units in a neighshy
borhood of Xi = z comparable Therefore by comparing the average outcomes just above and beshy
low the threshold now we can identify the average treatment effect for units close to the forcing varishy
ablecovariate cutoff value19 In the simplest case flexible estimation of RD treatment effects approxishy
mates the regression function of the outcome near the cutoff value of the forcingrunning variable for
control and treated groups separately and computes the estimated effect as the difference of the values
of the regression functions at the cutoff for each group
19Before employing the RD approach researchers need to test the validity of these RD design requirements for their individshyual empirical settings (Lee 2008)
15
minushn le Xi lt z z le Xi le hn
(5)
Yi = αminus + (Xi minus z) middot βminus + εminusi Yi = α+ + (Xi minus z) middot β+ + ε+i
Correspondingly the treatment effect at the cutoff off the running variable is given by
τSRD = α+ minus αminus (6)
As noted above RD design is predicated on comparing treated and untreated units in a region
ldquonearrdquo the cutoff value of the runningforcing variable Several approaches have been advanced to
date to identify observations that constitute being sufficiently ldquonearrdquo These approaches vary from beshy
ing completely ad hoc to methods that are grounded in exploiting the variation in the data The latter are
collectively referred to as bandwidth-selection estimators Bandwidth-selection estimators help choose
the optimal bandwidth h around Xi = z ie the cutoff of the running variable In the most general
form the bandwidth-selection estimator tries to strike a delicate balance between prediction accuracy
and the precision of an estimator in the region around the cutoff On the one hand a larger bandwidth
affords the researcher more observations and in doing so helps the researcher obtain more precise esshy
timates of the treatment effect However a model applied to a large bandwidth is more likely to suffer
predictive inaccuracy Furthermore if the underlying conditional expectation of the outcome is nonshy
linear then a linear model may still be a good approximation within a narrow bandwidth However
a linear parameterization may be unable to accurately approximate variation in the data over a wider
bandwidth Therefore the key intuition for bandwidth selection is that one needs to trade off the bias
and the variance of τSRD(hn) Heuristically
uarr Bias(τSRD) =rArr darr h and uarr Var(τSRD) =rArr uarr h
There are two approaches for data-driven bandwidth selection (i) cross-validation and (ii) direct
plug-in rules based on mean square error (MSE) expansions20 The direct plug-in (DPI) approach is
based on a MSE expansion of the sharp RD estimators leading to the MSE-optimal choice
20See Lee and Lemieux (2010) for the application of cross-validation methods in RD settings
16
ˆ ˆ minus15 h = C middot n (7)
where 1
C = 3V3V 5
(8)2B2
In the expressions above B and V are the leading asymptotic bias and variance of the RD estimator
In practice one discards 50 of the observations on either side of the threshold (Imbens and Lemieux
2008) Ludwig and Miller (2007) implement their bandwidth-selection procedure by using only data
within 5 percentage points of the threshold on either side If the curvature of the density of the running
variable is similar on both sides close to the cutoff point then in large samples the optimal bandwidth
will be similar on both sides of the cutoff In the case of the cross-validation-based approach to bandshy
width selection
n
hCV = arg min sum w(Xi) (Yi minus micro1(Xi h))2 (9)
h i=1
The cross-validation approach boils down to selecting an optimal bandwidth h that minimizes the
MSE between the predicted and actual Y The limitation of cross-validation is that the bandwidth-
selection criterion is evaluated over the entire support of X as opposed to the distribution of the running
variable only around the cutoff z For this reason in our empirical analysis we limit our analysis to the
direct plug-in bandwidth-selection estimators Specifically we run our analysis using the estimator
proposed in Imbens and Kalyanaraman (2012) and Calonico et al (2014)
42 Model specification
In much of the empirical literature focused on recovery of the treatment effects (including the differenceshy
in-difference approach) the researcher will estimate a regression function across the entire sample of
treated and control units of the form
17
logit
Pr Ydjst = 1|Mileagedjst Xdjst
=
=
logPr Ydjst = 1|Mileagedjst Xdjst
1 minus Pr Ydjst = 1|Mileagedjst Xdjst
β0 + β1 lowast Ddjst + β2 lowast Mileagedjst
+ β3 lowast Ddjst middot Mileagedjst
+γ lowast Xdjst + εdjst
This approach has some undesirable properties First the resulting estimator puts uniform weight
across all observational units when estimating the model In our empirical setting this would amount to
not distinguishing between used vehicles whose mileage is far away from the cutoff from those whose
mileage is very proximate to the cutoff It is reasonable to assume that vehicles with odometer readings
that are far away from the cutoff are qualitatively very different than those that are closer to the cutoff
These qualitative differences may stem from different levels of wear-and-tear maintenance number of
previous owners etc Since these are unobservable to the econometrician the recovered treatment effect
may suffer bias However these qualitative differences while not absent are unlikely to be systematic
or large when one limits the estimation to a ldquonarrowrdquo region around the cutoff
So as to mitigate this concern we use the SRD design outlined above In our specific empirical
setting the running variable is the odometer mileage of the used vehicle being purchased As discussed
in the data section manufacturer-backed factory warranties include basic and power-train warranties
Each of these factory warranties expires when the vehicle reaches or exceeds the pre-determined basic
or power-train warranty terms (eg 3 years36000 miles or 5 years60000 miles) Because the expiry
of a factory warranty is decided at pre-determined levels the treatment assignment in our setting is
deterministic in mileage (a requirement for SRD) Therefore using the approach outlined above affords
us the ability to answer the following question By how much do purchase rates of extended warranties
for used vehicles change at the point when the vehicle hits the pre-determined factory-warranty-expiry
level
But the demand for extended warranties can also depend on other covariates in addition to the forcshy
ing covariate that is the basis of the assignment mechanism in our RD design Including other covariates
can help eliminate sample biases present in the model specification outlined above and improve the preshy
cision of our treatment effect estimate τ In addition they can be useful for evaluating the plausibility of
the identification strategy (more on this later) For example vehicle characteristics such as the automoshy
18
bile manufacturer auto brand and car model might systematically impact attachment rates for extended
warranties Attachment rates can also be impacted by non-vehicle-related factors such as characteristics
of the auto dealership (aggressive sales force franchisednon-franchised site exclusive underwriter of
extended warranties in the market etc) and characteristics of the auto buyerrsquos local market (average
road-driving conditions number of repair shops and average cost of repairs etc)
To address these empirical issues we estimate the SRD in the following steps First we employ the
bandwidth-selection estimator advanced in Imbens and Kalyanaraman (2012) (henceforth IK) as well
as in Calonico et al (2014) (henceforth CCT) Both the bandwidth-selection estimators rely on nonshy
parametric local-polynomial approximation (see Calonico et al2014) The resulting bandwidth permits
us to exploit only the variation in the observations around the neighborhood where the basicpowershy
train warranty of the specific vehicle expires Next we calibrate a logistic regression where the depenshy
dent variable is a logit transformation of conditional probability of the buyer of a used vehicle j buying
an extended warranty for her vehicle from dealer d located in state s at time t and parameterized as
Pr Ydjst = 1|Mileagedjst Xdjst logit Pr Ydjst = 1|Mileagedjst Xdjst = log 1 minus Pr Ydjst = 1|Mileagedjst Xdjst
= β0 + β1 lowast Ddjst + β2 lowast Mileagedjst
+ β3 lowast Ddjst middot Mileagedjst
+γ lowast Xdjst + εdjst hn le Mileage le hn
where Ddjst is an indicator variable that takes on value 1 when zbasicpowerminustrain cuto f f le Mileagedjst le
hn and 0 otherwise Mileagedjst is the odometer mileage of the used car hn is the bandwidth proposed
by IK andor CCT and Xdjst includes other vehicle dealer and buyer-market characteristics
Extended warranties are marketed only after the buyer commits to a specific vehicle However
transacted prices on the vehicle purchased may still impact extended-warranty-purchase-probability
If transaction price proxies for vehicle unobservables including product quality then consumers may
associate higher-quality products with greater reliability which may therefore result in a reduced likeshy
lihood to purchase extended warranties Another possibility is that a budget-constrained buyer upon
paying a higher transacted price on the vehicle may have fewer additional resources to spare for purshy
chasing extended warranties This too would reduce the likelihood of a buyer purchasing extended
warranties However if higher prices also translate to more expensive-to-maintain vehicles then the
19
buyer may be more likely to purchase extended warranties to insure against product failure Therefore
the net effect of the used-vehicle-transacted prices on purchase probability of the extended warranty
remains an open empirical question
To quantify this net effect in the region ldquolocalrdquo to the expiry of the warranty we also include the veshy
hicle transacted price as an additional covariate For the same reasons we also include the price of the
vehicle traded in (should there be a trade-in) Time-invariant dealer- and buyer-market unobservables
are controlled via dealer- and buyer-market fixed effects To control for aggregate time-varying unobshy
servables (seasonality weather gas prices etc) we include year and month dummies 21 Finally εdjst
captures other drivers that impact buyersrsquo extended warranty-purchase decisions but are unobserved to
the econometrician and that are specific to product and vary by dealer state transacted year and month
Our key parameters of interest are β1 and β3 β1 estimates the average effect of the basicpower-train
warranty expiry on the probability of choosing an extended warranty β3 allows a varying slope for the
impact of vehicle mileage pre- and post-expiry of the basic warranty
5 Threats to Identification
The most serious threat to identification in RD design is the strategic manipulation of the forcingrunning
variable (McCrary 2008) In our empirical setting the vehicle mileage is hard to manipulate by either
the auto buyer or dealer Therefore this concern about identification is mostly tempered by the institushy
tional setting itself To formally rule out this primary threat to identification we perform the McCrary
test McCrary (2008) tests the continuity of the density of the running variable (that underlies the assignshy
ment at the discontinuity point) against the alternative of a jump in the density function at that point
Herein the logarithm of the difference in the height of density functions on both sides of the cutoff is
non-parametrically estimated and tested against its asymptotic normal distribution We conduct this
test on the running variable only on the observations identified as being local to the cutoff by the IK and
CCT bandwidth estimators
The results of the McCrary test on the running variable for the estimator suggested by IK and CCT is
reported in Tables 4 and 5 A positive (negative) McCrary test statistic implies that the density of the runshy
ning variable is higher (lower) post-expiry of the basicpower-train warranty than pre-expiry of these
21Copeland (2014) highlights seasonality in consumer mix Since automakers frequently use cash-back rebates at the end of the model year to boost sales consumers time their purchase decisions to avail of lower prices Including month fixed-effects helps control for sortingstrategic timing of purchase by deal-prone buyers
20
warranties However none of these estimates is statistically significant The estimate and correspondshy
ing confidence intervals are plotted in Figure 71 Taken together these tests confirm that the strategic
manipulation of the running variable is absent and therefore does not pose any threat to identification
The second threat to identification is discontinuity of the density of continuous covariates Recall
that we have two continuous covariates in the model namely the transacted price of the vehicle and the
value of the vehicle traded in (should there be a trade-in) To test the discontinuity of these covariates
we first visually inspect the covariates Figures 74 and 75 depict the RD for the transaction price and
trade-in value Each point is the average price of the corresponding covariate within the focal 1000-mile
bin These plots reveal a noticeable discontinuity for trade-in values at the 60000-miles power-trainshy
warranty mark No apparent graphical discontinuity is found at other mileage markers around the
warranty cutoffs Next we formally assess the statistical significance of this discontinuity in the trade-
in value at the power-train-warranty-mark We do so by running a non-parameteric local polynomial
RD-based regression separately for each covariate (including the used-vehicle transacted price) Here
we treat the covariates as the outcome variable A statistically significant treatment effect would imply
that the density of the covariate exhibits a discontinuity at the running-variable cutoff which limits our
ability to make causal claims on the recovered-treatment-effect estimate The results for these tests are
reported in Tables 6 and 7 They suggest that the trade-in value at the 60000-mile mark turns out to
be statistically significant and so presents a threat to identification Therefore for the recovery of the
treatment effect at the 60000-mile power-train warranty cutoff we restrict the estimation sample only to
observations without trade-ins The test does not reveal any discontinuity for the basic-warranty cutoff
In summary after careful review of the key threats to identification and employing the necessary
safeguards we are sufficiently confident that causal inference using RD design is credible and has strong
internal validity
6 Results
After allaying concerns about potential threats to identification we conduct the statistical inference usshy
ing a local linear regression We do so after limiting the observations to those that lie within the opshy
timal bandwidth around the threshold We choose the bandwidth using the procedures suggested by
IK and CCT and assess whether substantive findings are sensitive to the choice of bandwidth estimashy
21
tors22 We report key statistics for the bandwidth-limited sample for IK and CCT in Tables 8 and 9
The CCT-optimal bandwidths for the basic warranty and power-train-warranty cutoffs at 60000 and
100000 miles are 12021 18320 and 43981 miles23 On average the CCT- based estimator yields a more
compact bandwidth than the IK-based bandwidth estimator
To examine the effect of the base warranty on purchasing an extended warranty we begin by first
graphing the relationship between the mileage of the used vehicle and the probability of buying the
extended warranty at the base-warranty thresholds in Figure 72 Each panel illustrates the average
attachment rate for an extended warranty within a mileage bin The vertical line denotes the basic-
warranty-cutoff mark The 4th-order polynomial fitted lines without covariates (ie without Xdjst) are
overlaid in each plot Figure 72 presents model-free evidence on discontinuous jumps at the basic
mark and at the power-train cutoff of 60000 miles and a noticeable drop at the 100000-miles cutoff It
highlights that the expiry of basicpower-train warranties has a causal influence on the probability of
buying extended warranties It is well known however that the simple comparison of pre- and post-
expiry of the basicpower-train warranties does not necessarily suggest anything about the attachment
rate of extended warranties Thus we estimate the proposed local linear regression with other covariates
beyond the running variable Tables 10 and 11 report estimates from the SRD with the transaction price
and trade-in value and a battery of fixed effects to control for plausible unobservables These include
manufacturer dummies model dummies dealer dummies buyer state-of-residence dummies and year
and month dummies
Our main finding is that there is a discontinuous change in the probability of purchasing extended
warranties upon the expiry of the basic warranty The RD estimates also confirm that the purchase rate
for extended warranties rises gradually up to the cutoff point where the basic warranty expires At the
cutoff point there is a discontinuous drop of 324 in the attachment rate for extended warranties Howshy
ever post-expiry of the basic warranty the attachment rate for extended warranties remains constant
at a level higher than its pre-basic-warranty-expiry level In fact after expiry of the basic warranty the
attachment rate settles at the pre-expiry level of 35200 miles These findings suggest that buyers who
purchase used vehicles that are 800 miles short of the expiry of the basic warranty are the ones who
22We select the optimal plug-in bandwidth because the conventional cross-validation approach yields a bandwidth that is optimal for fitting a curve over the entire support of the data while we are interested in the best-fitting bandwidth around the cutoff point
23The IK-optimal bandwidths for the basic- and power-train-warranty cutoffs are 14848 21047 and 61569 miles respecshytively
24([β0 + β1 + (β2 minus β3) lowast 36 000] minus [β0 + β2 lowast 36 000])
22
are most likely to purchase extended warranties relative to other buyers of pre-basic-warranty-expiry
used vehicles Therefore dealers need to target extended warranties most aggressively to buyers of
purchased vehicles that have 800 miles or less to go before their basic warranty expires The next-mostshy
attractive segment is buyers of vehicles with expired basic warranties Taken together dealerships have
a very small window of opportunity to win a sale before expiry of the basic warranty and a much wider
window of opportunity to market extended warranties after expiry of the basic warranty
On the contrary to the left of the power-train warranty mark of 60000 miles the attachment rate
for extended warranties remains constant As soon as the power-train warranty runs out the purchase
probability discontinuously jumps by 10 and then steadily decreases with mileage In this case the
region from 60000 to 63700 miles ie 3700 miles post expiry of the power-train warranty ndash is the most
attractive ldquosweet spotrdquo for dealerships to market extended warranties The next-most-attractive segment
is the buyers of used vehicles who purchase vehicles before the expiry of the power-train warranty In
sum results show that there is a statistically significant effect of warranty expiry on purchase rates for
extended warranties on used vehicles Given the high profit margins that dealerships realize on the sale
of extended warranties the recovered effects can have an economically significant impact on dealersrsquo
revenues from the marketing of extended warranties
Earlier in the article we discussed the insurance and signaling roles of warranties Recall that each
of these motives has polar-opposite predictions on the demand for extended warranties According to
the insurance motive we expect the likelihood of purchasing extended warranties to be higher for the
used vehicles prior to the expiry of the base warranty than post-expiry In contrast signaling theory
predicts that buyers perceive used vehicles with residual warranties to be of better quality compared
to those without and will therefore be less prone to buying the extended warranty on the vehicles that
have remaining base warranties than those that do not Our ldquonet-effectrdquo findings suggest that the net
effect of these two countervailing motives for basic warranties is negative This implies that in the
local region around the expiry of the basic warranty insurance motives and sorting motives dominate
all other motives The positive net effect for power-train warranties suggests that in the local region
around the expiry of the power-train warranty signaling motives are dominant25
The discussion on the average effects of expiry of basicpower-train warranties raises the following
question To what extent do the pooled effects vary by the country of origin of the automaker Sepashy
25Our inference procedure given recovered estimates is as follows Using the estimates for the intercept discontinuity vehicle mileage and the interaction of discontinuity and vehicle mileage in Table 11 we compute the log-of-the-odds ratio before and after the expiry of the basic warranty
23
rately running local linear regressions of basicpower-train-warranty marks for domestic and imported
brands in our data allows one to answer that question26 These findings suggest that the treatment effect
of the basic-warranty mark is driven by domestic vehicles while non-domestic brands exhibit discontishy
nuity at the power-trainwarranty mark (Tables 12 and 13) On one hand compared to the average drop
of 3 in the attachment rate at the cutoff of the basic warranty domestic brands show a discontinuous
decrease of 6 On the other hand the purchase probability discontinuously jumps by 15 for the imshy
ported vehicles once the power-train warranty expires while the pooled effect is estimated to be a 10
increase We interpret these results as follows The fact that domestic brands exhibit a larger drop in
attachment rate than the average change implies that the basic warranties serve insurance and sorting
roles more for the US automakers than non-domestic brands The empirical evidence is consistent with
trade-publication reports that consistently rank the domestic brands lower than their Japanese rivals in
terms of reliability (Consumer Reports 2014) Hence by providing manufacturer-backed warranties the
degree to which insurance and sorting motives dominate other economic roles is greater for less durable
US automakers than imported brands In the case of a power-train warranty that covers major internal
parts of the vehicle such as the engine and transmission consumers are likely to encounter more expenshy
sive repairs for imported vehicles than domestic cars when engine parts fail Moreover replacing these
parts in the aftermarket can be less available and more expensive for the non-domestic brands which
leads to a higher jump at the threshold of the power-train warranty than the pooled average
Lastly the the positive coefficient for the used-vehicle transacted price indicates that ceteris paribus
buyers of expensive used vehicles are more likely to purchase extended warranties This finding sugshy
gests that heterogeneity in buyersrsquo risk preferences may be at work Specifically risk-averse consumers
are willing to pay a price premium to reduce the risk To mitigate risk these consumers purchase more
expensive vehicles than other buyers with a higher tolerance for risk These high-risk-averse consumers
are also more likely to purchase extended warranties and do so at a higher rate than buyers with a higher
tolerance for risk It is buyersrsquo risk preferences that seed a positive correlation between the types of veshy
hicles purchased and the corresponding attachment for extended warranties The positive correlation
generates the positive price coefficient While studying the effect of heterogeneous risk preferences is
not central to this essay inclusion of the vehicle transacted prices helps us at least control for it
26Domestic brands include Ford GMC Chevrolet Jeep Dodge Pontiac Chrysler and Mercury Imported vehicles are Honda Toyota Nissan Mazda Volkswagen Subaru and Scion
24
61 Robustness Checks and Alternative Explanations
In this section we address a number of alternative explanations and factors that might affect our findshy
ings
Placebo Test Do discontinuities occur at mileage marks other than the vehiclersquos basic and powershy
train-warranty marks Evidence of such discontinuities can call into question the causal mechanism
we posit To rule out this legitimate concern we perform the aforementioned local linear regression for
every 10000-mile threshold Nine out of ten times we do not find any discontinuity in the demand for
extended warranties around the local region of the cutoffs The only exception is the 40000-mile marker
where we find significant discontinuity However this is not surprising since 932 of the bandwidth
around the 40000-mile mark overlaps with the expiry of the basic warranty at the 36000-mile mark
The bandwidth and results are shown in the Online Appendix Tables 14 and 15
Product Availability Another concern is that the expiry of the base warranty can be confounded
with the product availability This could manifest in two ways First reduced availability very likely
increases the transacted price of the used vehicle Higher transaction prices in turn will lead consumers
to protect their vehicles (consistent with insurance motivations) and result in higher purchase rates of
extended warranties Second in the market where auto dealers maintain a low inventory level or offer
a narrow range of products consumers can purchase extended warranties in lieu of limited access to
aftermarket parts and more expensive repairs should the vehicle parts need replacements If this is the
case product availability can be a source of unobserved heterogeneity around the warranty thresholds
and be correlated with the recovered treatment effect To address this concern we create a measure
of product availability by counting the number of similar vehicles (ie of the same make-model as
the focal vehicle) offered by the same auto dealer in the particular year-month when the focal vehicle
was sold Then we perform a battery of tests First the McCrary test is conducted to check if product
availability exhibits discontinuity before and after the warranty marks The Online Appendix Table
16 shows that the McCrary test rejects the null hypothesis which implies that there is no systematic
difference between the densities of product availability measures pre- and post-expiry of basicpowershy
train-warranty thresholds Second we run a local linear regression that directly allows the product
availability to impact extended-warranty-purchase rates As seen in the Online Appendix Table 17
this analysis also yields statistically insignificant estimates of product availability which further allays
treatment-effect bias that might stem from product availability
Endogenous Choice of Extended-Warranty Terms Consumers pre- and post-expiry of basicpowershy
25
train-warranty marks may choose the different terms of extended warranties If consumers to the left
of the cutoff systematically purchase the shorter period of extended warranties than those to the right
or vice versa it can be evidence of self-sorting due to their risk preferences Under the assumption that
extended-warranty premiums reflect the terms of warranties we estimate an non-parametric RD on the
extended-warranty prices As can be seen in the Online Appendix Table 18 the extended-warranty price
does not show any discontinuity pattern at the 36000-mile or the 60000-mile marks where we obtain
significant RD estimates on the attachment rates for extended warranties At the 100000-mile mark we
find a significant negative RD estimate of the extended-warranty premium meaning that consumers
tend to buy cheaper or less comprehensive extended-warranty products post-expiry of the power-train
warranty Since our main findings rest on the basic warranty mark of 36000-miles and the power-train
warranty of 60000-miles our treatment-effect estimates are also robust to the concern of endogenous
choice of extended-warranty terms
7 Conclusion
Thus far we have studied the interaction between manufacturer-backed factory warranties (that come
bundled with the product at no additional cost) and optional extended warranties (that need to be purshy
chased separately) in the used-vehicle market Our empirical context is a preferred setting to investigate
the interaction because it provides a unique opportunity to test the net effect of insurance signaling
and sorting roles on the tradeoff that buyers make between manufacturer-backed factory warranties
and extended warranties We employ an RD design and show how the demand for extended warranties
dropsincreases as the manufacturer-backed basicpower-train warranty expires Our ldquonet-effectrdquo findshy
ings suggest that the net effect of these two countervailing motives for basic warranties is negative This
implies that in the local region around the expiry of the basic warranty insurance motives and sorting
motives dominate all other motives The positive net effect for power-train warranties suggests that in
the local region around the expiry of the power-train warranty signaling motives are dominant
Taken together our findings highlight potential complementarities between manufacturer-backed
factory warranties and extended warranties Specifically as soon as the basic warranty expires there is a
discontinuous drop of 3 in the attachment rate for extended warranties while the purchase probability
discontinuously jumps by 10 upon passing the power-train-warranty mark of 60000 miles In addishy
tion post-expiry of the basic warranty the attachment rate for extended warranties remains constant at
26
a level higher than its pre-basic-warranty-expiry level In fact after expiry of the basic warranty the atshy
tachment rate settles at the pre-expiry level of 35200 miles That is ceteris paribus the attachment rate for
extended warranties post-expiry of the basic warranty remains steady at a level equal to the attachment
rate for used vehicles that are 800 miles short of the expiry of their basic warranty For the power-train
warranty of 60000 miles following the sudden bump in the demand for extended warranties at the exshy
piry the attachment rates steadily decreases with mileage In this case the region from 60000 to 63700
miles ie 3700 miles post-expiry of the power-train warranty is where consumers choose the extended
warranties the most These findings have important managerial implications First buyers who purshy
chase used vehicles that are 800 miles short of the expiry of the basic warranty are the ones who are
most likely to purchase extended warranties relative to other buyers of pre-basic-warranty-expiry used
vehicles Therefore dealers need to target extended warranties most aggressively to buyers of purchased
vehicles that have 800 miles or fewer to go before their basic warranty expires The next-most-attractive
segment is buyers of vehicles with expired basic warranties As for the power-train-warranty mark
3700 miles post-expiry of the power-train warranty is the most profitable consumer segment for auto
dealers The next-most-attractive segment is buyers who purchase used vehicles prior to the expiry of
the power-train warranty Given the high profit margins that dealerships realize on the sale of extended
warranties the recovered effects can have an economically significant impact on dealersrsquo revenues from
the marketing of extended warranties
Although this study makes several contributions to the empirical literature on product warranties
it has some limitations First this is a descriptive study albeit using a causal-inference approach Thereshy
fore we cannot currently examine how changes to manufacturer-backed factory warranties andor the
price of extended warranties will impact extended-warranty-adoption rates of individual buyers Anshy
swering such normative questions requires a structural modeling framework to recover the structural
primitives that drive buyersrsquo choice of extended warranties27 Second we limit our analysis to used
vehicles alone in part because new vehicles have limited variation in residual base warranties Hence
we cannot readily make any statements about the window of opportunity that auto dealers have to sell
extended warranties to buyers of new vehicles A few niche automakersrsquo vehicles were intentionally left
out of our analysis These were excluded in part because they had very different base-warranty mileage
cutoffs than those we have currently included in the analysis However the empirical framework we adshy
27Jindal (2015) proposes a framework to explore this in the context of new durable goods using stated-choice data Extending Jindalrsquos empirical framework to accomodate tradeoff buyers make between base and extended warranties using observational data alone is non trivial and is outside the scope of this study
27
vance in this study can be readily extended to quantify the sales-opportunity window for these vehicles
and assess how it varies relative to the ones we currently include in the study We hope this study and its
findings help garner greater interest amongst marketing scholars to advance more research in the area
of product warranties and assess if the economic benefits these products accrue justify the premiums
consumers pay to protect themselves from modest levels of product failure
References
1 Autotradercom (2013) ldquoCertified Pre-Owned Understanding the Customerrdquo (November 2013) (accessed February 16 2015) [available at httpdigitalsolutionsautotradercomwp-contentuploads2014012013shyAutoTradercom-CPO-Study-Results-Full-Reportpdf]
2 Berry Steven James Levinsohn and Ariel Pakes (1995) ldquoAutomobile Prices in Market Equilibriumrdquo Econoshymetrica 63(4) 841-90
3 Bhaskaran Sreekumar R and Stephen M Gilbert (2005) ldquoSelling and Leasing Strategies for Durable Goods with Complementary Productsrdquo Management Science 51(8) 1278-90
4 Boyle Stanley E and Thomas F Hogarty (1975) ldquoPricing Behavior in the American Automobile Industry 1957-71rdquo Journal of Industrial Economics 24(2) 81-95
5 Bresnahan Timothy F (1981) ldquoDuopoly Models with Consistent Conjecturesrdquo American Economic Review 71(5) 934-45
6 Bruce Norris Preyas S Desai and Richard Staelin (2005) ldquoThe Better They Are the More They Give Trade Promotions of Consumer Durablesrdquo Journal of Marketing Research 42(1) 54-66
7 Bruce Norris Preyas S Desai and Richard Staelin (2006) ldquoEnabling the Willing Consumer Rebates for Durable Goodsrdquo Marketing Science 25(4) 350-66
8 Busse Meghan Jorge Silva-Risso and Florian Zettelmeyer (2006) ldquo$1000 Cash Back The Pass-Through of Auto Manufacturer Promotionsrdquo American Economic Review 96(4) 1253-70
9 Calonico Sebastian Matias D Cattaneo and Rocio Titiunik (2014) ldquoRobust Nonparametric Confidence Intervals for Regression-Discontinuity Designsrdquo Econometrica 82(6) 2295-2326
10 Card David Carlos Dobkin and Nicole Maestas (2008) ldquohe Impact of Nearly Universal Insurance Coverage on Health Care Utilization Evidence from Medicarerdquo American Economic Review 98(5) 2242-58
11 Chen Tao Ajay Kalra and Baohong Sun (2009) ldquoWhy Do Consumers Buy Extended Service Contractsrdquo Journal of Consumer Research 36(4) 611-23
12 Chu Junhong and Pradeep K Chintagunta (2009) ldquoQuantifying the Economic Value of Warranties in the US Server Marketrdquo Marketing Science 28(1) 99-121
13 Chu Junhong and Pradeep K Chintagunta (2011) ldquoAn Empirical Test of Warranty Theories in the US Computer Server and Automobile Marketsrdquo Journal of Marketing 75(2) 75-92
14 Cooper Russell and Thomas W Ross (1985) ldquoProduct Warranties and Double Moral Hazardrdquo RAND Jourshynal of Economics 16(1) 103-13
15 Copeland Adam (2014) ldquoIntertemporal Substitution and New Car Purchasesrdquo RAND Journal of Economics 45(3) 624-44
28
16 Desai P S amp Padmanabhan P (2004) Durable good extended warranty and channel coordination Review of Marketing Science 2(1)
17 Desai Preyas S and Devavrat Purohit (1998) ldquoLeasing and Selling Optimal Strategies for a Durable Goods Firmrdquo Management Science 44(11) 19-34
18 Desai Preyas S and Devavrat Purohit (1999) ldquoCompetition in Durable Goods Markets The Strategic Conshysequences of Leasing and Sellingrdquo Marketing Science 18(1) 42-58
19 Desai Preyas S and Devavrat Purohit (2004) ldquolsquoLet Me Talk to My Managerrsquo Haggling in a Competitive Environmentrdquo Marketing Science 23(2) 219-33
20 Dybvig Philip H and Nancy A Lutz (1993) ldquoWarranties Durability and Maintenance Two-sided Moral Hazard in a Continuous-Time Modelrdquo Review of Economic Studies 60(3) 575-97
21 Gallagher Kelly S and Erich Muehlegger (2011) ldquoGiving Green To Get Green Incentives and Consumer Adoption of Hybrid Vehicle Technologyrdquo Journal of Environmental Economics and Management 61(1) 1-15
22 Grossman Sanford J (1981) ldquoThe Informational Role of Warranties and Private Disclosure About Product Qualityrdquo Journal of Law and Economics 24(December) 461-83
23 Hahn Jinyong Petra Todd and Wilbert van der Klaauw (2001) ldquoIdentification and Estimation of Treatment Effects with a Regression-Discontinuity Designrdquo Econometrica 69(1) 201-09
24 Heal Geoffrey (1977) ldquoGuarantees and Risk-Sharingrdquo Review of Economic Studies 44(3) 549-60
25 Huang Edward (2010) ldquoDo Public Subsidies Sell Green Cars Evidence from the US rsquoCash for Clunkersrsquo Programrdquo Social Science Research Network httpssrncomabstract=1591323
26 Imbens Guido W (2004) ldquoNonparametric Estimation of Average Treatment Effects under Exogeneity A Reviewrdquo Imbens G Nonparametric Estimation of Average Treatment Effects under Exogeneity A Reviewrdquo Review of Economics and Statistics 84(1) 4-29
27 Imbens Guido W and Thomas Lemieux (2008) ldquoRegression Discontinuity Designs A Guide to Practicerdquo Journal of Econometrics 142(2) 611-14
28 Imbens Guido W and Karthik Kalyanaraman (2012) ldquoOptimal Bandwidth Choice for the Regression Disshycontinuity Estimatorrdquo Review of Economic Studies 79(3) 1-27
29 Jiang Bo and Xubing Zhang (2011) ldquoHow Does a Retailerrsquos Service Plan Affect a Manufacturerrsquos Warshyrantyrdquo Management Science 57(4) 727-40
30 Jindal Pranav (2015) ldquoRisk Preferences and Demand Drivers of Extended Warrantiesrdquo Marketing Science 34(1) 39-58
31 Kelley Craig A and Jeffrey S Conant (1991) ldquoExtended Warranties Consumer and Manufacturer Percepshytionsrdquo Journal of Consumer Affairs 25(1) 68-83
32 Kirmani Amna and Akshay R Rao (2000) ldquoNo Pain No Gain A Critical Review of the Literature on Signaling Unobservable Product Qualityrdquo Journal of Marketing 64(April) 66-79
33 Kubo Yuji (1986) ldquoQuality Uncertainty and Guarantee A Case of Strategic Market Segmentation by a Monopolistrdquo European Economic Review 30(5) 1063-79
34 Lee David S (2008) ldquoRandomized Experiments from Non-random Selection in US House Electionsrdquo Jourshynal of Econometrics 142(2) 675-97
35 Lee David S and Thomas Lemieux (2010) ldquoRegression Discontinuity Designs in Economicsrdquo Journal of Economic Literature 48(June) 281-355
36 Levinthal Daniel A and Devavrat Purohit (1989) ldquoDurable Goods and Product Obsolescencerdquo Marketing Science 8(1) 35ndash56
29
37 Ludwig Jens and Douglas L Miller (2007) ldquoDoes Head Start Improve Childrenrsquos Life Chances Evidence from a Regression Discontinuity Designrdquo Quarterly Journal of Economics 122(1) 159-208
38 Lutz Nancy A (1989) ldquoWarranties As Signals Under Consumer Moral Hazardrdquo RAND Journal of Economics 20(2) 239-55
39 Lutz Nancy A and V Padmanabhan (1995) ldquoWhy Do We Observe Minimal Warrantiesrdquo Marketing Science 14(4) 417-41
40 Lutz Nancy A and V Padmanabhan (1998) ldquoWarranties Extended Warranties and Product Qualitiesrdquo International Journal of Industrial Organization 16(4) 463-93
41 Mann Duncan P and Jennifer P Wissink (1989) ldquoHidden0 Actions and Hidden Characteristics in Warranty Marketsrdquo International Journal of Industrial Organization 8(1) 53-71
42 Matthews Steven and John Moore (1987) ldquoMonopoly Provision of Quality and Warranties An Exploration in the Theory of Multidimensional Screeningrdquo Econometrica 55(2) 441-67
43 McCrary Justin (2008) ldquoManipulation of the Running Variable in the Regression Discontinuity Design A Density Testrdquo Journal of Econometrics 142(2) 698-714
44 Murthy D N Prabhakar and Wallace R Blischke (2006) Warranty Management and Product Manufacture Springer London UK
45 Padmanabhan V (1995) ldquoUsage Heterogeneity and Extended Warrantiesrdquo Journal of Economic and Manageshyment Strategy 4(1) 35-53
46 Padmanabhan V and Ram C Rao (1993) ldquoWarranty Policy and Extended Service Contracts Theory and an Application to Automobilesrdquo Marketing Science 12(3) 230-47
47 Parisi Francesco (2004) ldquoThe Harmonization of Legal Warranties in European Sales Law An Economic Analysisrdquo American Journal of Comparative Law 52(2) 403-31
48 Pauwels Koen Jorge Silva-Risso Shuba Srinivasan and Dominique M Hanssens (2004) ldquoNew Products Sales Promotions and Firm ValueThe Case of the Automobile Industryrdquo Journal of Marketing 68(4) 142shy56
49 Priest George L (1981) ldquoA Theory of the Consumer Product Warrantyrdquo The Yale Law Journal 90(6) 1297shy1352
50 Punj Girish N and Richard Staelin (1983) ldquoA Model of Consumer Information Search Behavior for New Automobilesrdquo Journal of Consumer Research 9(4) 366-380
51 Purohit Devavrat (1992) ldquoExploring the Relationship Between the Markets for New and Used Durable Goods The Case of Automobilesrdquo Marketing Science 11(2) 154ndash167
52 Rosenbaum Paul R and Donald B Rubin (1983) ldquoThe Central Role of the Propensity Score in Observational Studies for Causal Eeffectsrdquo Biometrika 70(1) 41-55
53 Schiraldi Pasquale (2011) ldquoAutomobile Replacement A Dynamic Structural Approachrdquo RAND Journal of Economics 42(2) 266ndash91
54 Soberman D A (2003) Simultaneous signaling and screening with warranties Journal of Marketing Reshysearch 40(2) 176-192
55 Spence Michael A (1973) ldquoJob Market Signalingrdquo Quarterly Journal of Economics 87(3) 629-49
56 Spence Michael A (1977) ldquoConsumer Misperceptions Product Failure and Producer Liabilityrdquo Review of Economics Studies 44(3) 561-72
57 Sudhir K (2001) ldquoCompetitive Pricing Behavior in the US Auto Market A Structural Analysisrdquo Marketing Science 20(1) 42-60
30
58 Thistlethwaite Donald L and Donald T Campbell (1960) ldquoRegression-Discontinuity Analysis An Altershynative to the Ex Post Facto Experimentrdquo Journal of Educational Psychology 51(6) 309-17
59 Van der Klaauw Wilbert (2008) ldquoRegressionndashDiscontinuity Analysis A Surveyof Recent Developments in Economicsrdquo Labour 22(2) 219-45
31
Table 1 A list of Manufacturer Warranties (yearsmiles) Manufacturer Brand Basic warranty Powertrain warranty
Audi Audi 450000 450000 Bentley Bentley 3Unlimited 3Unlimited BMW BMW Mini 450000 450000
Chrysler Chrysler Dodge Jeep 336000 5100000 Ferrari Ferrari 2Unlimited 2Unlimited
Ford Ford Mercury 336000 560000
Lincoln 450000 670000 Volvo 450000 450000
General Motors Chevrolet GMC Pontiac 336000 5100000 Buick Cadillac Hummer 450000 5100000
Honda Honda 336000 560000 Acura 450000 670000
Hyundai Hyundai Kia 560000 10100000 Jaguar Jaguar 450000 450000
Lamborghini Lamborghini 3Unlimited 3Unlimited Land Rover Land Rover 450000 450000
Lotus Lotus 336000 336000 Maserati Maserati 450000 450000 Maybach Maybach 450000 450000
Mazda Mazda 336000 560000 Mercedes-Benz Mercedes-Benz 450000 450000
Mitsubishi Mitsubishi 560000 10100000
Nissan Nissan 336000 560000 Infiniti 460000 670000
Porsche Porsche 450000 450000 Rolls-Royce Rolls-Royce 4Unlimited 4Unlimited
Subaru Subaru 336000 560000 Suzuki Suzuki 336000 7100000
Toyota Toyota Scion 336000 560000
Lexus 450000 670000 Volkswagen Volkswagen 336000 560000
32
Table 2 Select Extended Warranties
Man
ufac
ture
r Pr
ovid
err
Plan
s Te
rms
(Yea
rs1
k m
iles)
D
educ
tibl
es ($
) N
umbe
r of
auto
par
tsco
vere
d
Ford
Fo
rd C
redi
t
Pow
ertr
ainC
are
375
to 7
125
0
501
002
00
4 Ba
seC
are
348
to 7
125
0
501
002
00
9 Ex
traC
are
348
to 7
125
0
501
002
00
10
Prem
ium
Car
e 3
48 to
71
25
050
100
200
13
Gen
eral
Mot
ors
Ally
Fin
anci
al In
c
Basi
c G
uard
no
t spe
cifie
d no
t spe
cifie
d 6
Val
ue G
uard
no
t spe
cifie
d no
t spe
cifie
d 11
M
ajor
Gua
rd
not s
peci
fied
not s
peci
fied
13
Hon
da
Hon
da F
inan
cial
Serv
ices
H
onda
Car
e no
t spe
cifie
d no
t spe
cifie
d 11
Maz
da
Maz
da
Maz
da E
xten
ded
Con
fiden
ce
1 ye
ar to
91
00
0 to
100
7
Nis
san
Nis
san
Pow
ertr
ain
Plan
2
24 to
71
00
0 to
100
4
Del
uxe
Plan
2
24 to
71
00
0 to
100
10
Su
prem
e Pl
an
224
to 7
100
0
to 1
00
10
Suba
ru
Suba
ru
Add
ed S
ecur
ity
Cla
ssic
up
to 7
100
no
t spe
cifie
d 10
Add
ed S
ecur
ity
Gol
dPl
us
up to
71
00
050
100
10
Toyo
ta
Toyo
ta F
inan
cial
Serv
ices
Pow
ertr
ain
Prot
ecti
on
610
0 no
t spe
cifie
d 4
Gol
d Pr
otec
tion
3
50 to
81
25
not s
peci
fied
4 Pl
anti
num
Pro
tect
ion
350
to 8
125
no
t spe
cifie
d 13
Volk
swag
en
Volk
swag
en C
redi
t
Pow
ertr
ain
Plan
up
to 1
000
00 m
iles
not s
peci
fied
4 Si
lver
Pla
n up
to 1
000
00 m
iles
not s
peci
fied
9 G
old
Plan
up
to 1
000
00 m
iles
not s
peci
fied
9 G
old
Plus
Pla
n up
to 1
000
00 m
iles
not s
peci
fied
10
Plan
tinu
m P
lan
up to
100
000
mile
s no
t spe
cifie
d 10
33
Table 3 Summary Statistics Mean SD Minimum Maximum
Extended warranty attachment rate 533 499 0 1 Mileage 4852899 3390152 10 298736
Cash price 19059124 823571 1 165000 Trade-in values 35984 627997 0 58000
Table 4 McCrary Density Test (Post-IK Bandwidth Sample) Basic warranty
mark (36k miles) Powertrain
warranty mark (60k miles)
Powertrain warranty mark
(100k miles)
Log discontinuity estimate 006 (072) 047 (107) -183 (161) Observations 9556 5232 3399
Note Standard errors in parentheses
Table 5 McCrary Density Test (Post-CCT Bandwidth Sample) Basic warranty Powertrain Powertrain
mark (36k miles) warranty mark warranty mark (60k miles) (100k miles)
Log discontinuity estimate
019 (093) 042 (104) -235 (21)
Observations 7882 4482 2048 Note Standard errors in parentheses
Table 6 Nonparametric Estimate of Discontinuity in Transacted Price and Trade-In Value (Post-IK Bandshywidth Sample)
Basic warranty mark (36k miles)
Powertrain warranty mark
(60k miles)
Powertrain warranty mark
(100k miles)
Transacted Price 19077 (46726) -12878 (69613) 64158 (13151) Trade-In Value -36624 (48429) -16126 (67053) 10766 (11013) Observations 9556 5232 3399
Note Standard errors in parentheses
Table 7 Nonparametric Estimate of Discontinuity in Transacted Price and Trade-In Value (Post-CCT Bandwidth Sample)
Basic warranty mark (36k miles)
Powertrain warranty mark (60k miles)
Powertrain warranty mark (100k miles)
Transacted Price 21035 (49375) 4164 (61116) 63294 (13536)
Trade-In Value -38941 (50639)
-16402 (70338) 6904 (12773)
Observations 7882 4482 2048 Note Standard errors in parentheses
34
Table 8 Summary Statistics of Post-IK Bandwidth Sample Basic Warranty Mark Mean SD Minimum Maximum
Extended warranty attachment rate 558 497 0 1 Mileage 3519026 82729 21160 50848
Cash price 2023945 700961 33961 69995 Trade-in values 35895 607894 0 54000
Powertrain Warranty Mark (60000 miles) Mean SD Minimum Maximum
Extended warranty attachment rate 557 497 0 1 Mileage 5624865 1192015 38954 81045
Cash price 1716727 611475 2900 48900 Trade-in values 299032 548259 0 4432865
Powertrain Warranty Mark (100000 miles) Mean SD Minimum Maximum
Extended warranty attachment rate 469 499 0 1 Mileage 6905263 2511698 38434 161452
Cash price 2023945 700961 33961 69995 Trade-in values 300253 551499 0 44451
Table 9 Summary Statistics of Post-CCT Bandwidth Sample Basic Warranty Mark Mean SD Minimum Maximum
Extended warranty attachment rate 557 497 0 1 Odometer Mileage 3536771 670014 23986 48015
Transacted Price of Used-Vehicle 2011278 693968 33961 6322524 Transacted Price of Trade-in Vehicle 35343 60518 0 54000
Powertrain Warranty Mark (60000 miles) Mean SD Minimum Maximum
Extended warranty attachment rate 562 496 0 1 Odometer Mileage 5706623 1042061 41684 78318
Transacted Price of Used-Vehicle 1704796 606737 2900 48900 Transacted Price of Trade-in Vehicle 300092 549333 0 4432865
Powertrain Warranty Mark (100000 miles) Mean SD Minimum Maximum
Extended warranty attachment rate 436 496 0 1 Odometer Mileage 8213496 2013451 56064 143962
Transacted Price of Used-Vehicle 152483 709555 100 55000 Transacted Price of Trade-in Vehicle 293889 553429 0 4078255
Note Standard errors in parentheses
35
Table 10 Regression Discontinuity Estimates (Post-IK Bandwidth Sample) Basic warranty
mark (36k miles) Powertrain
warranty mark (60k miles)
Powertrain warranty mark
(100k miles) Intercept -2944
(606) -2465
(890) -1008 (814)
Discontinuity 774 (378)
2372 (800)
543 (0972)
Discontinuity Vehicle Mileage -00002 (000001)
-00004 (000001)
-000008 (0000008)
Odometer Mileage 00002 (000007)
000012 (0000009)
-000006 (0000003)
Transacted Price of Used-Vehicle 00005 (0000006)
00008 (000001)
00005 (000001)
Transacted Price of Trade-in Vehicle -00001 (0000004)
-0000006 (0000008)
Make Dummy yes yes yes Model Dummy yes yes yes Dealer Dummy yes yes yes
Buyer-State Dummy yes yes yes Year Dummy yes yes yes
Month Dummy yes yes yes AIC 12589 37609 4224
Observations 9556 2918 3399 Note Standard errors in parentheses
36
Table 11 Regression Discontinuity Estimates (Post-CCT Bandwidth Sample) Basic warranty
mark (36k miles) Powertrain
warranty mark (60k miles)
Powertrain warranty mark
(100k miles) Intercept -3092
(0668) -246 (1006)
-1267 (0981)
Discontinuity 1057 (0500)
1902 (0937)
605 (1155)
Discontinuity Vehicle Mileage -00003 (000001)
-00003 (000002)
-00001 (000001)
Vehicle Mileage 00003 (000001)
00002 (000001)
-000005 (0000005)
Cash Price 00006 (0000007)
00008 (00001)
00005 (000001)
Trade-In Value -000008 (0000004)
-000007 (000001)
Make Dummy yes yes yes Model Dummy yes yes yes Dealer Dummy yes yes yes State Dummy yes yes yes Year Dummy yes yes yes
Month Dummy yes yes yes AIC 10385 32454 25405
Observations 7882 2494 2048 Note Standard errors in parentheses
37
Table 12 Regression Discontinuity Estimates by Domestic versus Imported Brands (Basic warranty 36k miles)
Domestic Imported Intercept -1902
(818) -1139 (1194)
Discontinuity 908 (557)
1076 (955)
Discontinuity Vehicle Mileage -000027 (000015)
-000028 (000026)
Vehicle Mileage 00002 (00001)
000016 (00002)
Cash Price 000035 (0000085)
000079 (000017)
Trade-In Value -0000081 (0000055)
-0000026 (000001)
Make Dummy yes yes Model Dummy yes yes Dealer Dummy yes yes State Dummy yes yes Year Dummy yes yes
Month Dummy yes yes AIC 57112 26547
Observations 4340 1969 Bandwidth (21268 50732) (24981 47019)
Note Standard errors in parentheses
38
Table 13 Regression Discontinuity Estimates by Domestic versus Imported Brands (Power-train warshyranty)
Domestic except Ford (100k miles)
Imported (60k miles)
Intercept -1325 (1692)
-2798 (945)
Discontinuity -1421 (1514)
2071 (842)
Discontinuity Vehicle Mileage 000011 (000015)
-000032 (000013)
Vehicle Mileage -000013 (000013)
0000073 (0000096)
Cash Price 000041 (000022)
000099 (000015)
Trade-In Value 0000074 (000017)
-000026 (0000093)
Make Dummy yes yes Model Dummy yes yes Dealer Dummy yes yes State Dummy yes yes Year Dummy yes yes
Month Dummy yes yes AIC 11431 32641
Observations 867 2315 Bandwidth (74296 125704) (39091 80909)
Note Standard errors in parentheses
39
Figure 1 McCrary Test
40
Figure 2 Impact of the BasicPowertrain Warranty on Extended Warranty Purchase
41
Online Appendix
Table 14 Robustness Check Placebo Test Results (Basic Warranty) 10k miles 20k miles 30k miles 40k miles 50k miles
Intercept 285
(1531) -321 (103)
-154 (682)
-315 (62)
-173 (932)
Discontinuity -1316 (1272)
665 (862)
151 (423)
752 (466)
208 (387)
Discontinuity Vehicle Mileage
0002 (0001)
-000054 (000043)
0000032 (00014)
-00002 (000011)
-000004 (0000072)
Vehicle Mileage -00022 (00012)
00011 (000035)
-00009 (00001)
000021 (0000074)
0000023 (0000045)
Bandwidth (7215 12785) (14612 25388)
(18124 41876)
(25620 54380)
(29114 70886)
Table 15 Robustness Check Placebo Test Results (Power-train Warranty) 40k miles 50k miles 60k miles 70k miles 80k miles 90k miles
Intercept -173
(932) -121 (903)
-246 (101) -274 (854)
-101 (133)
-106 (125)
Discontinuity -332 (832)
-268 (833)
190 (937)
107 (719)
-121 (124)
152 (126)
Discontinuity Vehicle Mileage
0000035 (00002)
0000086 (000016)
-000032 (000015)
-000021 (00001)
000015 (000015)
-0000142 (000014)
Vehicle Mileage 0000072 (000014)
-0000014 (000011)
000017 (000011)
000011 (0000064)
-000025 (000013)
-000024 (00001)
Bandwidth (26818 53182)
(33373 66627)
(41680 78320)
(42466 97534)
(61437 98563)
(66754 113246)
Table 16 Robustness Check McCrary Test of The Effect of Product Availability Basic Warranty
Mark (36k miles) Powertrain
Warranty Mark (60k mile)
Powertrain Warranty Mark
(100k mile)
Log discontinuity estimate 022 (097)
-012 (124)
144 (253)
Observations 5848 3310 938
42
Table 17 Robustness Check Regression Discontinuity allowing The Effect of Product Availability Basic warranty mark
(36k miles) Powertrain warranty
mark (60k miles) Powertrain warranty
mark (100k miles) Intercept -741
(854) -2854 (1130)
-1626 (1502)
Discontinuity 1295 (658)
1865 (1013)
-1179 (1539)
Discontinuity Vehicle Mileage -000036 (000018)
-00003 (000016)
0000067 (000014)
Vehicle Mileage 000023 (000013)
000015 (000013)
-000008 (000011)
Product Availability -000032 (0006)
000049 (0011)
0097 (016)
Cash Price 000051 (000008)
000075 (000014)
000031 (00002)
Trade-In Value -0000056 (0000054)
0000018 (000016)
Make Dummy yes yes yes Model Dummy yes yes yes Dealer Dummy yes yes yes State Dummy yes yes yes Year Dummy yes yes yes
Month Dummy yes yes yes AIC 68708 25844 1190
Observations 5263 1819 937
Table 18 Non-parametric Regression Discontinuity Estimate in Extended Warranty Price Basic warranty Powertrain Powertrain
mark (36k miles) warranty mark warranty mark (60k miles) (100k miles)
Vehicle Mileage -6875 12204 -44023 (62053) (10085) (20519)
Observations 5340 2917 1613
43
Figure 3 Discontinuity in Transaction Price of Used Vehicles
44
Figure 4 Discontinuity in Trade-In Value
45
- Introduction
- Related Literature
-
- Warranties as an Insurance Motive
- Warranties as a Signaling Motive
- Warranties as an Incentive Motive
- Warranties as a Sorting Motive
- Papers That Consider Base and Extended Warranties
-
- Data
- Empirical Strategy
-
- Overview of Regression-Discontinuity Design
- Model specification
-
- Threats to Identification
- Results
-
- Robustness Checks and Alternative Explanations
-
- Conclusion
-
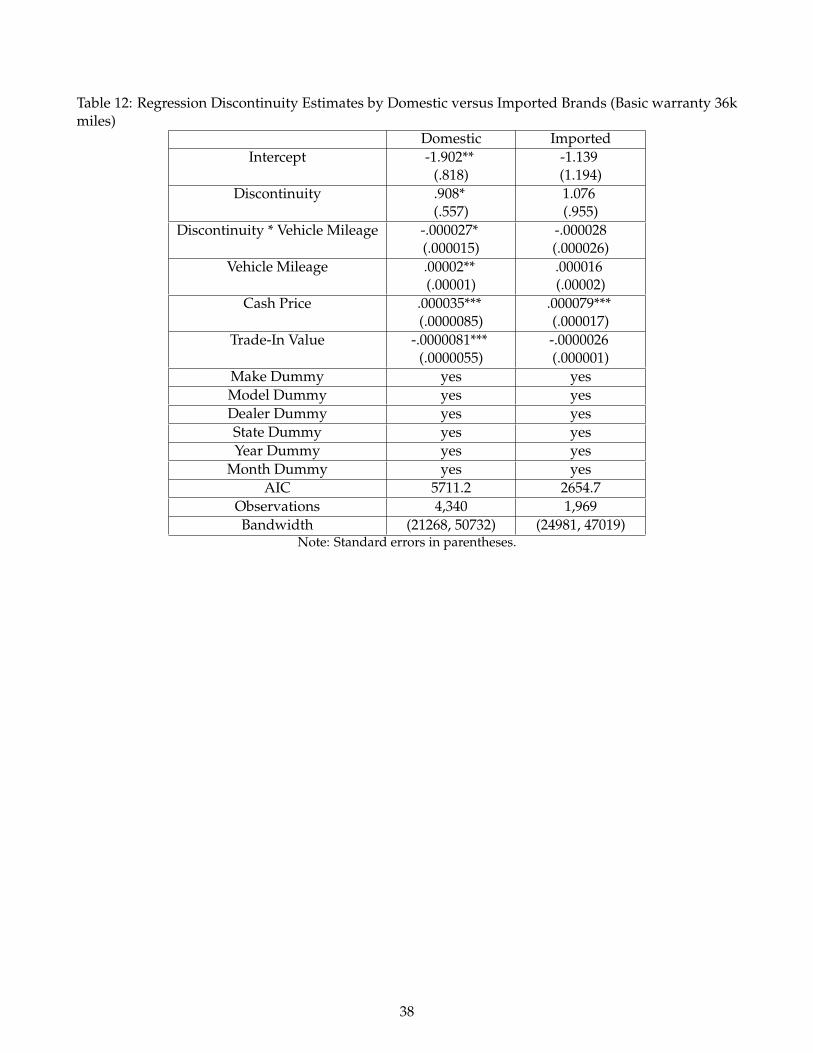
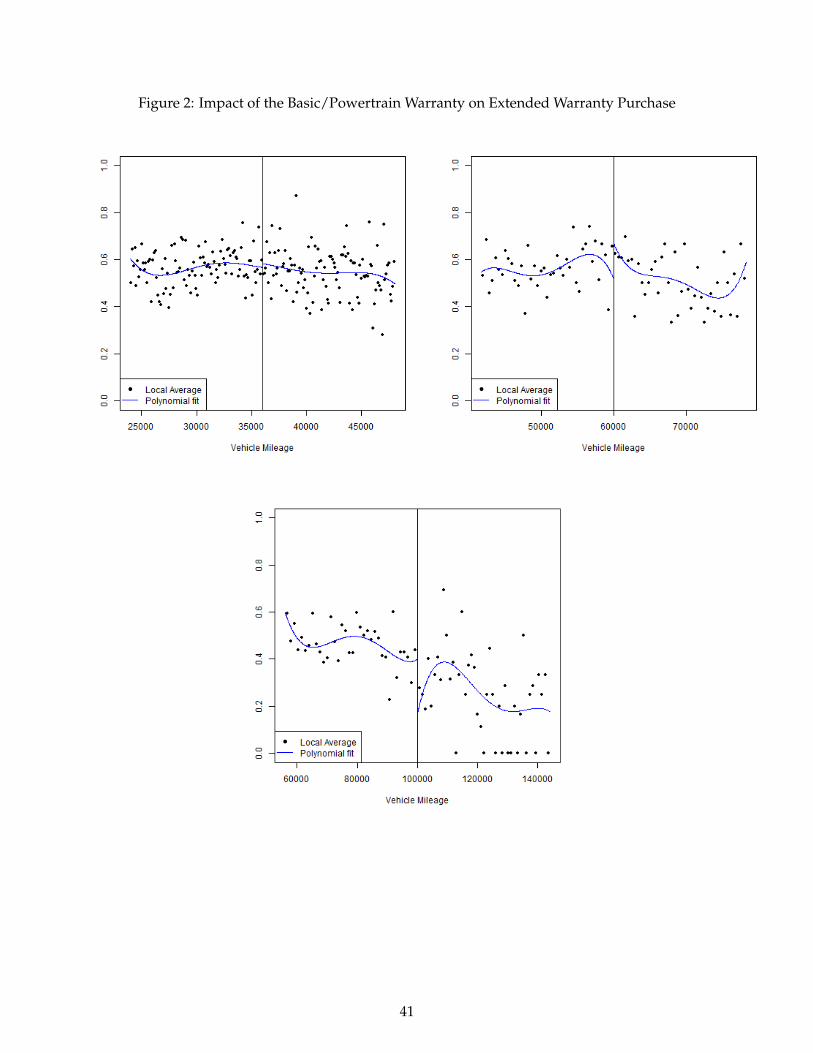