midterm pre-election review 31 january 2019
TRANSCRIPT

Midterm – Pre-election Review
31 January 2019
Luis F. Dumlao, Ph.D.
Dean, John Gokongwei School of Management
Associate Professor of Economics
Ateneo de Manila University
This presentation was made with the assistance of Kiel Denzon, MA.

Outline
Midterm – Pre-election Review
• Presyo, Trabaho, Kita (PTK)Presyo: Inflation
Trabaho: Unemployment rate
Kita: Gross Domestic Product (GDP)
• Ten Point Socioeconomic Agenda
• 2019
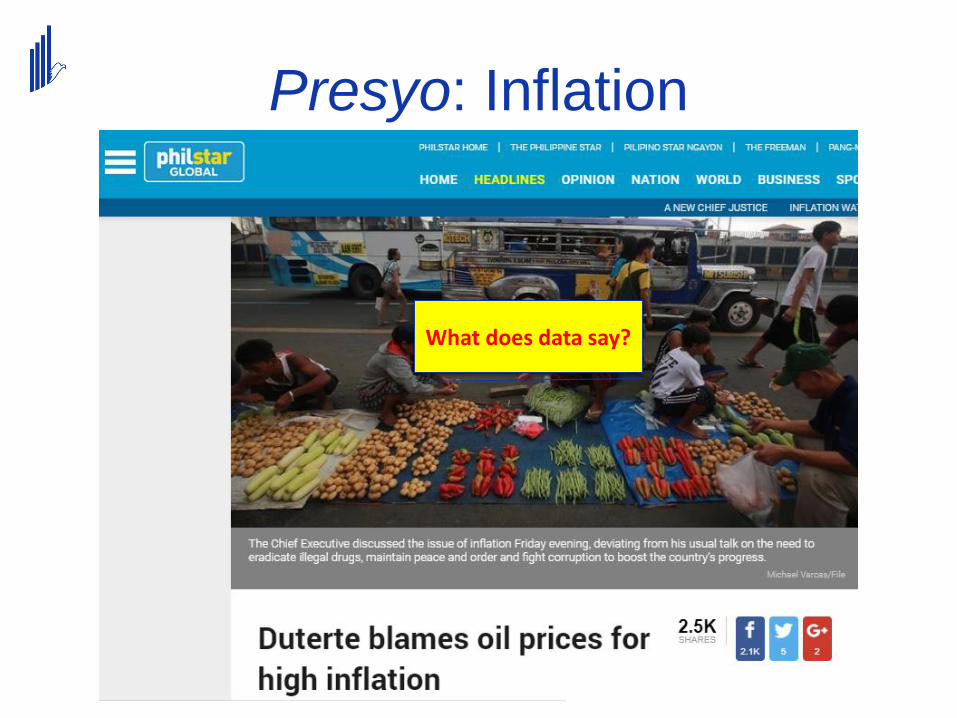
Presyo: Inflation
What does data say?

Source: CPI from PSA. Inflation is author’s calculation.
0.0
10.0
20.0
30.0
40.0
50.0
60.0
First Oil Crisis
Second Oil Crisis
Philippine Debt Crisis
Global recession& Gulf War
Asian Financial Crisis& El Nino
Oil - - VAT
Great Recession
PRESENT 5.2%
Inflation historically1. Spikes are usually externally driven and due to supply side
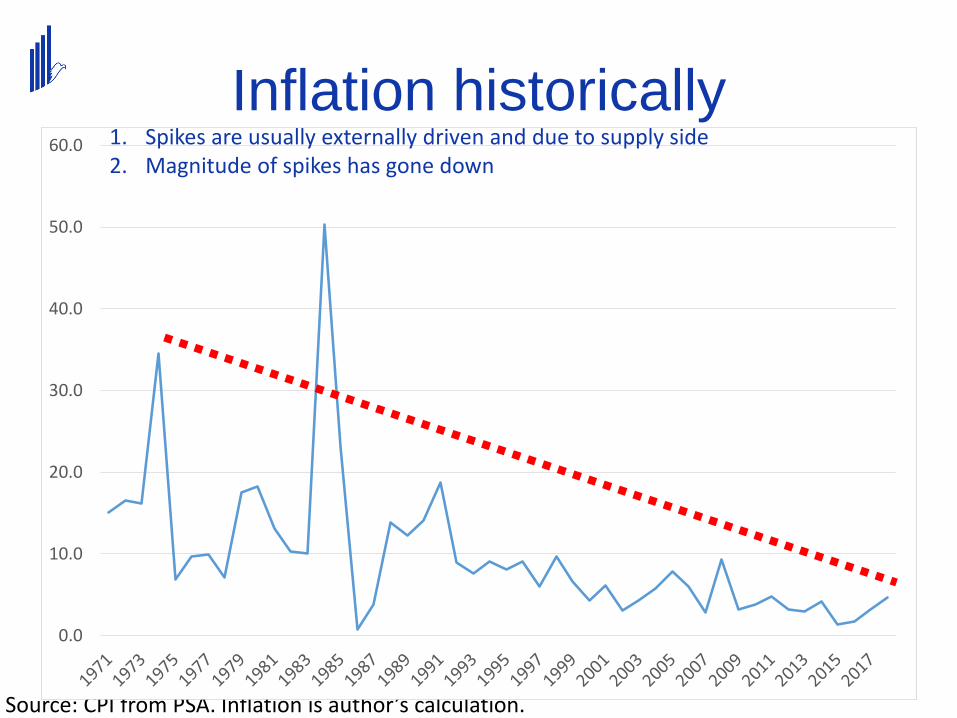
Inflation historically
Source: CPI from PSA. Inflation is author’s calculation.
0.0
10.0
20.0
30.0
40.0
50.0
60.0 1. Spikes are usually externally driven and due to supply side2. Magnitude of spikes has gone down

Inflation historically
Source: CPI from PSA. Inflation is author’s calculation.
0.0
10.0
20.0
30.0
40.0
50.0
60.0 1. Spikes are usually externally driven and due to supply side2. Magnitude of spikes has gone down3. Variability has tamed4. Next major crisis will still have adverse effect, but less as in the past
?

Source: CPI from PSA. Inflation is author’s calculation.
Inflation in the Midterm
-2.0
0.0
2.0
4.0
6.0
8.0
10.0
12.0Ja
n-0
1
Sep
-01
May
-02
Jan
-03
Sep
-03
May
-04
Jan
-05
Sep
-05
May
-06
Jan
-07
Sep
-07
May
-08
Jan
-09
Sep
-09
May
-10
Jan
-11
Sep
-11
May
-12
Jan
-13
Sep
-13
May
-14
Jan
-15
Sep
-15
May
-16
Jan
-17
Sep
-17
May
-18
Arroyo Aquino Duterte Average
Picked, 6.7,September & October

Dubai Crude
Source: Index Mundi.
Downloaded from: https://www.indexmundi.com/commodities/?commodity=crude-oil-dubai&months=12
2015:01, inflation: 0.7% 2018:10, inflation: 6.7%

Inflation and Annual Average
Change in Dubai Crude
-1%
1%
3%
5%
7%
9%
11%
-60% -40% -20% 0% 20% 40% 60% 80% 100%
Inflation = 3.2% + 5.4% D%Oil Price= 3.2% + 5.4% (42%)= 5.5% < 6.7%

Inflation by Category
September 2018
6.7
2.57
0.400.35
0.300.13
-1.00
-0.50
0.00
0.50
1.00
1.50
2.00
2.50
3.00
-10.0
-5.0
0.0
5.0
10.0
15.0
20.0
25.0
30.0
Inflation Wtd Excess over 3
Target 3.00Food 2.57Oil (0.40+0.35) 0.75Sin tax 0.30
6.62

Inflation by Sub-Category
September 20180.70
0.600.56
0.47 0.45
0.34
0.26 0.25
0.15
0.070.04 0.04
-0.27-0.30
-0.20
-0.10
0.00
0.10
0.20
0.30
0.40
0.50
0.60
0.70
-15.0
-10.0
-5.0
0.0
5.0
10.0
15.0
20.0
25.0
30.0
35.0
Inflation Weighted Excess of 3%
Target 3.00Food (0.70+0.60+0.47+0.34) 2.11Oil (0.56+0.45) 1.01Tob.&Sugar (0.26+0.25+0.07)0.58
6.70

Trabaho: Unemployment
Has “build, build, build” created “jobs, jobs, jobs”?

Source of percentage data: PSA, others are author’s estimate.
Population: 107M

Source of percentage data: PSA, others are author’s estimate.
Age <15: 35M/107MAge =>15: 72M/107M

Source of percentage data: PSA, others are author’s estimate.
Age <15: 35M/107MLF Participants: 44M/72M, 60.6%
Non-Participants: 28M/72M

Source of percentage data: PSA, others are author’s estimate.
Age <15: 35M/107M
Non-Participants: 28M/72M
Employed: 42M/44M, 94.4%
Unemployed: 2M/44M, 5.1%

Source of percentage data: PSA, others are author’s estimate.
Employed: 38M/44MAge <15: 35M/107M
Unemployed: 2M/44M, 5.1%
UNDER Employed: 6M/44M, 13.3%
OFW: 10M/28M
Non-Participants: 28M/72M

Trabaho (Official Statistics)
2014 2016 2018Population 15 y.o. and over 62,189 68,125 71,339 Labor Force Participation Rate 64.4 63.4 60.9Employment Rate 93.2 94.5 94.7Unemployment Rate 6.8 5.5 5.3Underemployment Rate 18.4 18.3 16.4
• Decrease of LFPR despite increase in population 15 y.o. and over. Pessimism in labor market?
• Decreasing yet slowing decrease in unemployment.• Decreasing yet speeding decrease in
underemployment. Improvement of jobs.

Trabaho (Our Headcount)
2014-16 2016-18Population 15 y.o. and over 5,936 3,214 Labor Force Participants 3,142 254 Employed 3,489 327 Unemployed (348) (73)Underemployed 601 (722)
• Pessimism in labor market?• From 3.142M (53%) to 254T (8%).
Correct if due to frustration. Wrong if better school, free tuition or rice allowance.
• Slowing decrease in unemployment? Correct. Job creation: 3.489M to 327T.
• Improvement in jobs?Correct. From (+) 601T to (-) 722M. 327T new + 395T “reclassified” quality jobs.

Kita: Gross Domestic Product

GDP Growth: 2001-2018Q3
Source of growth: PSA. Steady State are author’s estimate.
0.0
1.0
2.0
3.0
4.0
5.0
6.0
7.0
8.0
9.0
10.0
Global Financial Crisis
Budget Tightening
Positive but Declining Gap18 years of accelerating steady state growth
National income to double in 12 years

GDP Growth: 2001-2018Q3
Source of growth: PSA. Steady State are author’s estimate.
0.0
1.0
2.0
3.0
4.0
5.0
6.0
7.0
8.0
9.0
10.0
Highest Average6.60 vs 6.06
Although slowing, 6.12 (present growth) > 6.06 (previous avg)


10-point socioeconomic agenda1. Continuing and maintaining current macroeconomic policies, including fiscal, monetary and trade policies;
2. Instituting progressive tax reform and more effective tax collection while indexing taxes to inflation;
3. Increasing competitiveness and the ease of doing business, drawing upon successful models used to attract business to local cities such as Davao, as well as pursuing the relaxation of the Constitutional restrictions on foreign ownership, except with regards to land ownership, in order to attract foreign direct investments;
4. Accelerating annual infrastructure spending to account for 5 percent of the gross domestic product, with public-private partnerships playing a key role;
5. Promoting rural and value chain development toward increasing agricultural and rural enterprise productivity and rural tourism;
6. Ensuring security of land tenure to encourage investments and address bottlenecks in land management and titling agencies;
7. Investing in human capital development, including health and education systems, as well as matching skills and training to meet the demands of businesses and the private sector;
8. Promoting science, technology and the creative arts to enhance innovation and creative capacity toward self-sustaining and inclusive development;
9. Improving social protection programs, including the government’s conditional cash transfer program, in order to protect the poor against instability and economic shocks; and
10. Strengthening the implementation of the Responsible Parenthood and Reproductive Health Law to enable especially poor couples to make informed choices on financial and family planning.

1. Presyo: operational lapses in the supply chain.
2. Trabaho: not much creation of jobs, but more on improvement of jobs.
3. Kita: steady state projects doubling of income in 12 years; average is highest though slowing growth, present growth is still higher than previous average.
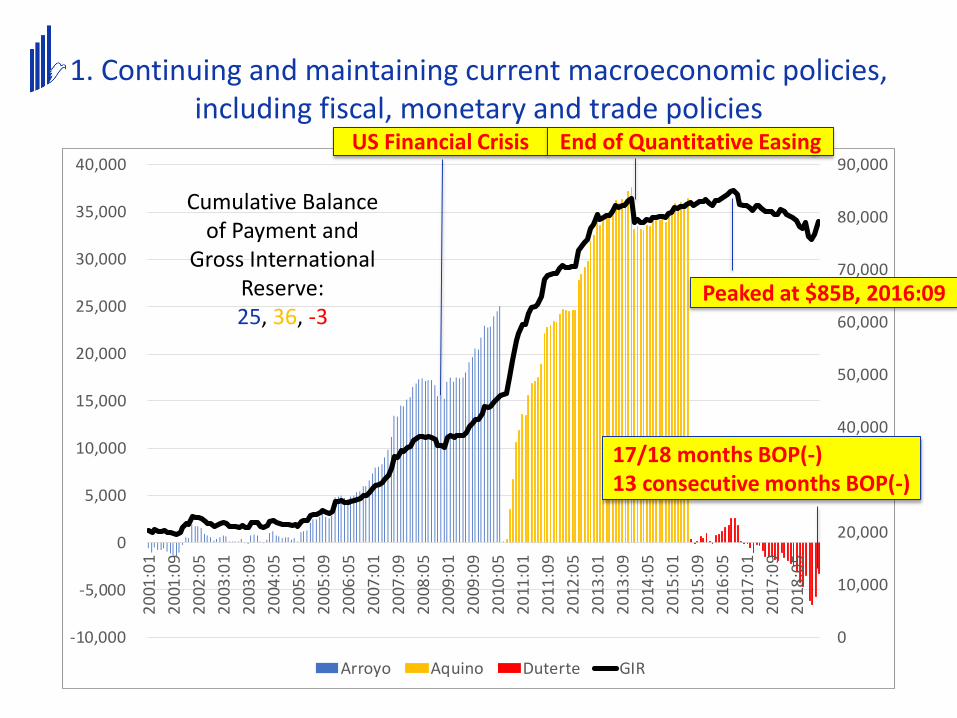
1. Continuing and maintaining current macroeconomic policies, including fiscal, monetary and trade policies
1. Continuing and maintaining current macroeconomic policies, including fiscal, monetary and trade policies
0
10,000
20,000
30,000
40,000
50,000
60,000
70,000
80,000
90,000
-10,000
-5,000
0
5,000
10,000
15,000
20,000
25,000
30,000
35,000
40,0002
001
:01
20
01:0
9
20
02:0
5
20
03:0
1
20
03:0
9
20
04:0
5
20
05:0
1
20
05:0
9
20
06:0
5
20
07:0
1
20
07:0
9
20
08:0
5
20
09:0
1
20
09:0
9
20
10:0
5
20
11:0
1
20
11:0
9
20
12:0
5
20
13:0
1
20
13:0
9
20
14:0
5
20
15:0
1
20
15:0
9
20
16:0
5
20
17:0
1
20
17:0
9
20
18:0
5
Arroyo Aquino Duterte GIR
US Financial Crisis End of Quantitative Easing
17/18 months BOP(-)13 consecutive months BOP(-)
Peaked at $85B, 2016:09
Cumulative Balance of Payment and
Gross International Reserve:25, 36, -3

1. Continuing and maintaining current macroeconomic policies, including fiscal, monetary and trade policies
As debt grows to P7 trillion
Debt-to-GDP ratio declines to 45%
No need to pay the debt. Just outgrow it.

1. Continuing and maintaining current macroeconomic policies, including fiscal, monetary and trade policies
No need to pay the debt. Just outgrow it.

2. Instituting progressive tax reform and more effective tax
collection while indexing taxes to inflation
In 2017, RA 10963 or TRAIN Law was enacted. Package 1 seeks to reduce the personal income tax (PIT), simplify VAT, update excise taxes on petroleum products, add excise tax on sugar sweetened beverages and others (DOF).

2. Instituting progressive tax reform and more effective tax
collection while indexing taxes to inflation

2. Instituting progressive tax reform and more effective tax
collection while indexing taxes to inflation
0%
5%
10%
15%
20%
25%
30%
35%
10
,00
0
27
0,0
00
53
0,0
00
79
0,0
00
1,0
50
,00
0
1,3
10
,00
0
1,5
70
,00
0
1,8
30
,00
0
2,0
90
,00
0
2,3
50
,00
0
2,6
10
,00
0
2,8
70
,00
0
3,1
30
,00
0
3,3
90
,00
0
3,6
50
,00
0
3,9
10
,00
0
4,1
70
,00
0
4,4
30
,00
0
4,6
90
,00
0
4,9
50
,00
0
5,2
10
,00
0
5,4
70
,00
0
5,7
30
,00
0
5,9
90
,00
0
6,2
50
,00
0
6,5
10
,00
0
6,7
70
,00
0
7,0
30
,00
0
7,2
90
,00
0
7,5
50
,00
0
7,8
10
,00
0
8,0
70
,00
0
8,3
30
,00
0
8,5
90
,00
0
8,8
50
,00
0
9,1
10
,00
0
9,3
70
,00
0
9,6
30
,00
0
9,8
90
,00
0
Before After
1. Progressive2. Tax Cut3. Unless you make Php15.6 million per year

2. Instituting progressive tax reform and more effective tax
collection while indexing taxes to inflation
Ortigas to Katipunan ExperienceTypical Sedan/Sports Utility Vehicle
P2.65 X 300 liters X 50 weeks = P39,750 / year

2. Instituting progressive tax reform and more effective tax
collection while indexing taxes to inflation

2. Instituting progressive tax reform and more effective tax
collection while indexing taxes to inflation
0%
5%
10%
15%
20%
25%
30%
35%
100
,00
0
300
,00
0
500
,00
0
700
,00
0
900
,00
0
1,1
00,
000
1,3
00,
000
1,5
00,
000
1,7
00,
000
1,9
00,
000
2,1
00,
000
2,3
00,
000
2,5
00,
000
2,7
00,
000
2,9
00,
000
3,1
00,
000
3,3
00,
000
3,5
00,
000
3,7
00,
000
3,9
00,
000
4,1
00,
000
4,3
00,
000
4,5
00,
000
4,7
00,
000
4,9
00,
000
Before After
Utility motorcycle, Picanto, Vios, Lancer,
Innova, etc.
Benz (utility), Fortuner, Explorer, Hi-Ace, etc.
Land Cruiser, Expedition,
BMW (sedan),
Porche, etc.

2. Instituting progressive tax reform and more effective tax
collection while indexing taxes to inflation
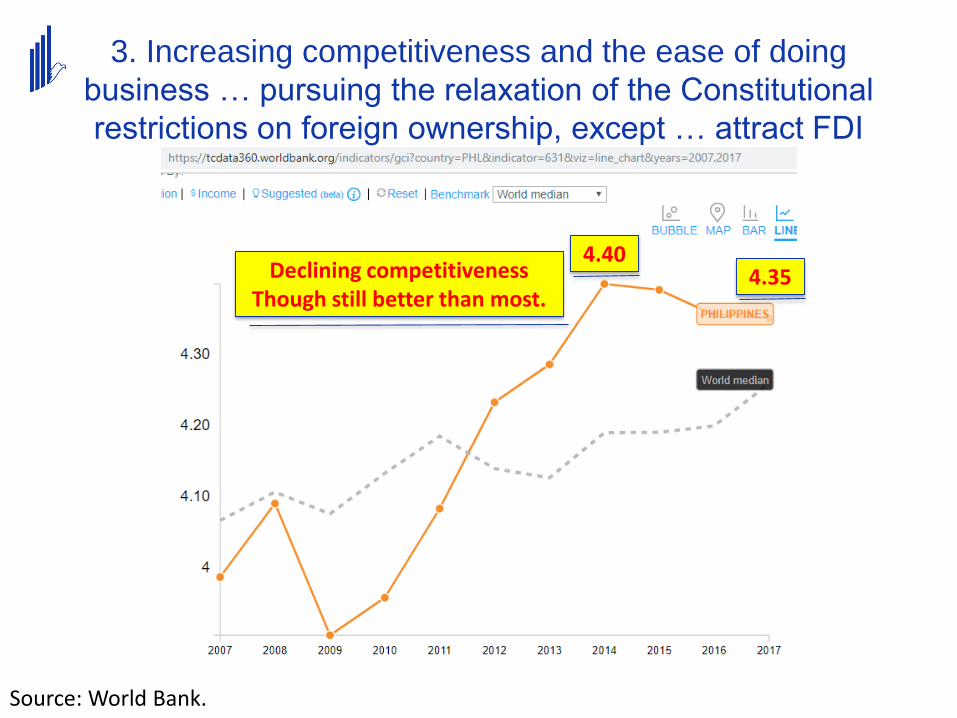
3. Increasing competitiveness and the ease of doing
business … pursuing the relaxation of the Constitutional
restrictions on foreign ownership, except … attract FDI
Source: World Bank.
4.404.35Declining competitiveness
Though still better than most.

3. Increasing competitiveness and the ease of doing
business … pursuing the relaxation of the Constitutional
restrictions on foreign ownership, except … attract FDI
Source: World Bank.
52
47
57 57
36%34%
41% 42%
0%
5%
10%
15%
20%
25%
30%
35%
40%
45%
0
10
20
30
40
50
60
14-15 15-16 16-17 17-18
Rank Percent
54. Latvia55. Viet Nam56. Philippines57. Kazakhstan58. Rwanda

3. Increasing competitiveness and the ease of doing
business … pursuing the relaxation of the Constitutional
restrictions on foreign ownership, except … attract FDI
Source: World Bank.
1. Most competitive in Macroeconomic environment & Market size.
2. Not competitive in 10 of 12 pillars.
3. Least competitive in Institutions, Infrastructure and Innovation.
4. Biggest drops in Institutions (public and private).
5. The rest are relatively steady, but need improvement.

3. Increasing competitiveness and the ease of doing
business … pursuing the relaxation of the Constitutional
restrictions on foreign ownership, except … attract FDI
In 2018, EO no. 65 has allowed up to 100% foreign ownership on five investment areas/activities (NEDA):• Internet businesses• Teaching at higher levels provided that the subject
being taught is not a professional subject• Training centers that are engaged in short-term high
level skills development that do not form part of the formal education system
• Adjustment companies, lending companies, financing companies and investment houses
• Wellness centers

3. Increasing competitiveness and the ease of doing
business … pursuing the relaxation of the Constitutional
restrictions on foreign ownership, except … attract FDI
0
10,000
20,000
30,000
40,000
50,000
60,000
70,000
80,000
2013 2014 2015 2016 2017 2018 Q1-Q3
Philippines Malaysia Indonesia Thailand Singapore Vietnam

4. Accelerating annual infrastructure spending to account
for 5 percent of the gross domestic product, with public-
private partnerships playing a key role
2.5 years
Less than 1 year

5. Promoting rural and value chain development toward
increasing agricultural and rural enterprise productivity and
rural tourism
-6.0%
-4.0%
-2.0%
0.0%
2.0%
4.0%
6.0%
8.0%
10.0%2
01
1Q
1
20
11
Q2
20
11
Q3
20
11
Q4
20
12
Q1
20
12
Q2
20
12
Q3
20
12
Q4
20
13
Q1
20
13
Q2
20
13
Q3
20
13
Q4
20
14
Q1
20
14
Q2
20
14
Q3
20
14
Q4
20
15
Q1
20
15
Q2
20
15
Q3
20
15
Q4
20
16
Q1
20
16
Q2
20
16
Q3
20
16
Q4
20
17
Q1
20
17
Q2
20
17
Q3
20
17
Q4
20
18
Q1
20
18
Q2
20
18
Q3
20
18
Q4
Aquino Duterte Steady State
Source of growth: Philippine Statistics Authority. Others are author’s estimate.
Neglect Growth, sustainable?

5. Promoting rural and value chain development toward
increasing agricultural and rural enterprise productivity and
rural tourism
Source: Philippine Statistics Authority.
Despite Boracay’s closure, there is an 8.32% increase in tourist arrivals for the period of January to September. There were 5.4
million tourist arrivals for Jan-Sept 2018 versus 5.0 million for Jan-Sept 2017 (DoT).

6. Ensuring security of land tenure to encourage
investments and address bottlenecks in land management
and titling agencies
• In 2016, the Land Administration and Management System (LAMS) was launched. It is a computer database that allows processing, tracking and retrieval of land information (DENR).
• The 1st National Land Summit was held last January 2018 (DENR).
• For faster resolutions of cases, 159 lawyers were hired and assigned to Community Environmental and Natural Resources Offices (DENR).
• A 30-year road map for the land sector is underway (DENR).
• No hard data whether security of land tenure has been ensured or whether the base case bottleneck scenario has improved.

7. Investing in human capital development,
including health and education systems …
• As of 2017, 66% of Filipinos are covered by PhilHealth versus 58.2% coverage in 2013 (PSA). The administration’s target is 100% PhilHealth coverage (DOF).
• Last July 2016, RA no. 10931 or the “Universal Access to Quality Tertiary Education Act” was signed. It provides for free tuition fees for SUCs starting AY2018-2019, and tertiary education subsidy (TES) for those enrolled in private HEIs and other educational expenses among others (CHED).
• In April 2018, 75,242 teaching positions for kindergarten, elementary, junior high school and senior high school have been approved for creation (DBM). The target is to hire an additional 181,980 teachers by 2020 (DOF).
• As of November 2018, Php 84.887 billion has been released for the construction of 33,828 classrooms (DBM). The target is to construct 113,553 classrooms (DOF).

8. Promoting science, technology and the creative arts to
enhance innovation and creative capacity toward self-
sustaining and inclusive development
• The Philippines ranked 17th out of 126 countries in 2018 in terms of science & engineering graduates (Global Innovation Index). Science & engineering graduates have a 28.7% share of total tertiary graduates (GII).
• Comparing with other ASEAN countries (DOST):
– Malaysia: 4 33.8% share
– Brunei: 8 30.5% share
– Philippines: 17 28.7% share
– Thailand: 20 26.9% share
– Vietnam: 44 22.7% share
– Indonesia: 54 20.7% share
“Share” is competitive, but not because of present policy and not because of RA 10931
Discipline Group 2015-16 2016-17 2017-18
No
dra
mat
ic
incr
ease
(so
me
de
crea
sed
) in
th
e sh
are
of
grad
uat
es
Engineering and Technology 12.60% 12.50% 12.43%
Fine and Applied Arts 0.68% 0.45% 0.55%
Information Technology 11.23% 11.11% 10.59%
Natural Science 1.10% 0.97% 0.98%
Trade, Craft and Industrial 0.02% 0.01% 0.01%

9. Improving social protection programs, including the
government’s conditional cash transfer program, in order to
protect the poor against instability and economic shocksRice subsidy worth P600 per month per household
Education 13.9Health 14.0Rice 17.3

9. Improving social protection programs, including the
government’s conditional cash transfer program, in order to
protect the poor against instability and economic shocksCould be
from P45B to P75B of CCT?

10. Strengthening the implementation of the Responsible
Parenthood and Reproductive Health Law
2016 2017
Contraceptive prevalence rate 47.89% 52.89%
Total Current Users 5,519,132 6,089,077
New Acceptors 1,738,121 1,442,782
4.1
3.73.5
3.0
2.7
0.0
0.5
1.0
1.5
2.0
2.5
3.0
3.5
4.0
4.5
19
93
19
94
19
95
19
96
19
97
19
98
19
99
20
00
20
01
20
02
20
03
20
04
20
05
20
06
20
07
20
08
20
09
20
10
20
11
20
12
20
13
20
14
20
15
20
16
20
17

10. Strengthening the implementation of the Responsible
Parenthood and Reproductive Health Law
4.1
3.73.5
3.0
2.7
0.0
0.5
1.0
1.5
2.0
2.5
3.0
3.5
4.0
4.5
19
93
19
94
19
95
19
96
19
97
19
98
19
99
20
00
20
01
20
02
20
03
20
04
20
05
20
06
20
07
20
08
20
09
20
10
20
11
20
12
20
13
20
14
20
15
20
16
20
17
NoEducation
CollegeEducation
4.6 2.0
Poorest20%
Wealthiest20%
4.3 1.7

Source: www.picswe.com.

Inflation per Major Commodity
Source of percentage data: PSA, others are author’s estimate.
September2018
December2018
All Items 6.7 5.1
Food & Non-Alcoholic Bev. 9.7 6.7
Alcoholic Beverages and Tobacco 21.8 21.7
Clothing and Footwear 2.5 2.8
Housing, Water, Electricity, Gas, and Other Fuels 4.6 4.1
Furnishing, Household Equipment and Routine Maintenance of the House 3.6 3.8
Health 4.1 4.8
Transport 8.0 4.0
Communication 0.5 0.4
Recreation and Culture 3.0 3.2
Education -3.8 -3.8
Restaurant and Miscellaneous Goods and Services 4.0 4.3
Key #1
Key #2

Sources of Inflation
Source of percentage data: PSA, others are author’s estimate.
3.70
2.57
0.40 0.35 0.30
-0.22
2.13
1.41
0.080.24 0.30
-0.50
0.00
0.50
1.00
1.50
2.00
2.50
3.00
3.50
4.00
September December
• 2.57+0.40+0.35+0.30 = 3.63• 1.41+0.08+0.24+0.30 = 2.03

Inflation per Major Commodity
Source of percentage data: PSA, others are author’s estimate.
September 2018 December 2018
Philippines 6.7 5.1
National Capital Region 6.3 4.8
Cordillera Administrative Region 5.0 3.4
I - Ilocos Region 8.6 7.0
II - Cagayan Valley 7.6 6.0
III - Central Luzon 4.5 4.0
IVA - CALABARZON 6.2 4.8
IVB - MIMAROPA 7.3 6.7
V - Bicol Region 10.1 7.0
VI - Western Visayas 7.6 5.7
VII - Central Visayas 7.0 5.3
VIII - Eastern Visayas 6.5 4.4
IX - Zamboanga Peninsula 7.7 6.6
X - Northern Mindanao 6.9 5.7
XI - Davao Region 7.9 5.3
XII - SOCCSKSARGEN 8.2 5.6
Caraga 6.1 4.2
Autonomous Region in Muslim Mindanao 9.0 7.5
Dec
line
acr
oss
all
regi
on
s

Inflation 2019
Source of percentage data: PSA, others are ACERD’s forecast.
3.3
6.7
5.25.2
0
1
2
3
4
5
6
7
8
Jan
-18
Feb
-18
Mar
-18
Ap
r-18
May
-18
Jun
-18
Jul-
18
Au
g-1
8
Sep
-18
Oct
-18
No
v-1
8
De
c-1
8
Jan
-19
Feb
-19
Mar
-19
Ap
r-19
May
-19
Jun
-19
Jul-
19
Au
g-1
9
Sep
-19
Oct
-19
No
v-1
9
De
c-1
9
Jan-19 4.5
Feb-19 4.0
Mar-19 3.7
Apr-19 3.5
May-19 3.7
Jun-19 3.5
Jul-19 3.3
Aug-19 2.7
Sep-19 2.1
Oct-19 2.2
Nov-19 2.6
Dec-19 3.5

Unemployment: 2017-18
Source of percentage data: PSA, others are author’s estimate.
Unemployment Underemployment
2017 2018 2017 2018Philippines 5.7 5.3 16.1 16.4
National Capital Region 7.4 6.6 9.3 7.2Cordillera Administrative Region 4.3 4.1 14.8 15.2
I - Ilocos Region 8.9 6.8 19.9 22.1II - Cagayan Valley 3.2 3.0 13.6 19.5III - Central Luzon 6.6 5.8 11.4 11.4IVA - CALABARZON 7.0 6.6 14.0 13.4IVB - MIMAROPA 4.8 4.7 23.7 20.6
V - Bicol Region 4.6 4.9 27.6 29.6VI - Western Visayas 5.4 5.3 16.7 18.6
VII - Central Visayas 4.5 5.3 17.5 17.8
VIII - Eastern Visayas 4.4 4.2 22.6 21.4
IX - Zamboanga Peninsula 4.0 4.1 17.3 18.9
X - Northern Mindanao 5.3 4.1 18.6 20.8XI - Davao Region 4.9 4.3 17.8 15.4XII - SOCCSKSARGEN 4.0 3.9 17.9 17.0Caraga 5.1 4.0 23.1 25.4
Autonomous Region in Muslim Mindanao 3.4 3.7 7.0 8.4
• Unemployment decreased by 0.4%. Improving employment?
• Under-employment increased by 0.3%. Worsening jobs?
• What about NCR and Davao?

Employment: 2018-17>= 15 y.o. LFP Employed Unemployed Underemployed
Philippines 1,449 687 826 -139 229
National Capital Region 100 -13 33 -46 -104Cordillera Administrative Region 29 8 9 -1 5
I - Ilocos Region 50 127 161 -33 78
II - Cagayan Valley 36 36 37 -1 93III - Central Luzon 137 174 203 -29 21
IVA - CALABARZON 309 93 113 -20 -20IVB - MIMAROPA 46 -11 -9 -2 -41
V - Bicol Region 96 89 77 12 69VI - Western Visayas 105 46 45 1 67
VII - Central Visayas 103 -130 -149 19 -18VIII - Eastern Visayas 71 72 73 -1 -6IX - Zamboanga Peninsula 58 -22 -24 2 18
X - Northern Mindanao 60 121 142 -21 72XI - Davao Region 66 -45 -31 -14 -53
XII - SOCCSKSARGEN 63 24 24 0 -14Caraga 41 69 78 -9 44Autonomous Region in Muslim Mindanao 79 48 43 5 17
• Improving employment? Yes, by 826,000 w/ 687,000 new & 139,000 previously unemp.• Low quality jobs? Yes, with 229,000/826,000 or 1/4. But improvement in NCR & Davao.

Unemployment: 2017-18
Source of percentage data: PSA, others are author’s estimate.
Share Thousands (000) Change
2017 2018 2017 2018 (000) %ALL 100.0 100.0 40,334 41,160 826 2.0AGRICULTURE 25.4 24.3 10,261 10,001 -259 -2.5INDUSTRY 18.3 19.1 7,370 7,845 475 6.4
SERVICES 56.3 56.6 22,703 23,313 610 2.7
BY SHARE 50.8 50.4
Agriculture, hunting and forestry 22.5 21.6 9,066 8,875 -192 -2.1
Wholesale & retail; repair: motor vehicles & motorcycles 19.6 19.4 7,900 7,993 93 1.2
Construction 8.8 9.4 3,537 3,865 328 9.3
BY JOB CREATION 23.4 24.4Construction 8.8 9.4 3,537 3,865 328 9.3Public admin. and defense; compulsory social security 6.0 6.2 2,408 2,560 152 6.3
Manufacturing 8.6 8.8 3,481 3,626 144 4.1
BY JOB LOSS 29.8 28.5Agriculture, hunting and forestry 22.5 21.6 9,066 8,875 -192 -2.1
Fishing and aquaculture 3.0 2.7 1,194 1,127 -67 -5.6Accommodation and food service activities 4.3 4.2 1,740 1,729 -11 -0.6
Construction gainsAgriculture loses

Business cycle of income
Source of data in black: PSA. Rest are author’s outlook.
2018
2019
2019Steady StateQ1 Q2 Q3 Q4
GROSS DOMESTIC PRODUCT 6.1 6.2 6.0 6.2 6.2 6.1 6.1 6.4 6.1
AGRI., HUNTING, FORESTRY & FISHING 0.3 0.8 1.2 1.2 1.2 1.2 1.2 1.6 1.1
Agriculture and forestry 1.0 2.1
Fishing -0.3 -1.5
INDUSTRY SECTOR 6.5 6.8 6.8 7.2 6.9 6.8 6.9 7.1 6.7
Mining and Quarrying -1.1 1.0 4.4 5.2 6.4 6.4 5.5 4.3 5.9
Manufacturing 4.8 4.9 3.7 5.2 6.1 6.5 5.4 6.9 6.2
Construction 15.0 15.9 21.1 14.5 10.6 9.1 13.3 9.2 9.7
Electricity Gas and Water Supply 5.0 5.3 6.6 5.4 4.9 4.7 5.4 4.7 4.8
SERVICE SECTOR 6.8 6.6 6.3 6.3 6.4 6.4 6.3 6.7 6.5
Transport Communication and Storage 5.9 5.1 2.2 2.8 3.4 3.8 3.1 5.6 4.6
Trade and Repair of Vehicles & HH Goods 5.7 5.9 5.8 6.0 6.1 6.2 6.0 6.4 6.2
Financial Intermediation 7.3 7.1 6.5 7.1 7.4 7.7 7.2 7.8 7.9
R. Estate Renting & Bus. Actvty 5.0 4.8 4.5 5.8 6.6 6.9 6.0 7.5 7.2
Other Services 7.3 7.7 8.7 7.7 7.3 7.0 7.7 6.6 6.8
Public Administration & Defense 15.8 14.6 13.8 9.8 7.5 6.2 9.1 5.6 5.8
Due to construction
Secular growth Due to Mfg & RE

Business cycle of expenditure,
2018
Source of data in black: PSA. Rest are author’s outlook.
2018
2019
2019Steady StateQ1 Q2 Q3 Q4
GROSS DOMESTIC PRODUCT 6.1 6.2 6.0 6.2 6.2 6.1 6.1 6.4 6.1
HOUSEHOLD FINAL CONSUMPTION 5.5 5.6 5.1 5.3 5.3 5.4 5.3 6.0 5.5
GOVERNMENT FINAL CONSUMPTION 13.4 12.8 12.1 10.2 9.1 8.4 9.9 8.0 8.1
CAPITAL FORMATION (FC + CI) 16.7 13.9 5.9 8.5 10.0 11.7 9.1 11.2 13.1
Fixed Capital (FC) 14.0 12.9
Construction 13.2 15.1 19.0 13.2 9.8 8.7 12.3 9.5 9.7
Durable Equipment 16.9 13.4 0.2 4.3 7.2 10.9 5.6 14.8 14.3
Breeding Stock & Orchard Develop’t 4.8 1.6
Intellectual Property Products 23.9 24.8
Changes in Inventories (CI) -4.9 -42.5
EXPORTS 11.5 9.0
Less: IMPORTS 14.5 11.0
Due to construction
Consumption & Investment

The Peso
What theories say?
US Japan UK Euro Phil.
Peso per 52.31 0.48 68.41 59.79
Inflation 1.9 0.8 2.1 1.6 5.1
91-day t-bill 2.37 -0.1 0.5 6.06
Purchasing Power Parity 53.95 0.500 70.42 61.85
Uncovered Interest Parity 54.20 0.510 72.19
Source of exchange rates: XE.com, 10 September 2018.Source of Treasury Bill: Moody’s Analytics (https://www.economy.com/united-kingdom/treasury-bills-over-31-days), 10 September 2018.Source of inflation: Trading Economics (https://tradingeconomics.com/united-states/inflation-cpi). Philippines’ is author’s estimate. 10 September 2018.
What theory says?

Dubai Crude
Source: Index Mundi.
Downloaded from: https://www.indexmundi.com/commodities/?commodity=crude-oil-dubai&months=12

Oil in the future
Downloaded from: https://knoema.com/yxptpab/crude-oil-price-forecast-long-term-2016-to-2025-data-and-charts

Oil in the future
Source: Chicago Mercantile Exchange.
Downloaded from: http://www.cmegroup.com/trading/energy/crude-oil/light-sweet-
crude_quotes_settlements_futures.html

Summary
Midterm• Problematic inflation due to lapse in supply chain.• Not much jobs, more of improvement in jobs.• Healthy growth and finance.
10-point Socio Economic Agenda• Macroeconomic fundamentals remain strength while Institutions the
opposite.• Clear pick-ups: public infrastructure and rice allowance (and tourism).• The rest are not clear.
2019• Inflation: 4.5 in January 2019, 3.3 average in 2019.• Unemployment rate remaining at 5.5 percent. While jobs will be created
enough to “offset” increase in labor force participants, the challenge is in the creation of quality jobs.
• The economy will grow at around 6.4 percent likely led by construction.• Dollar: P53.95 to P54.20.

Follow us on the following Social Media Platforms
Ateneo Eagle Watch
@admueaglewatch
Ateneo Eagle Watch
@ADMUEagleWatch
Rotary Club Pasig, 15 February 2018