mid-year economic and fiscal outlook · pdf filethe mid-year economic and fiscal outlook ......
TRANSCRIPT

MID-YEAR ECONOMIC AND FISCAL OUTLOOK REPORT
2017

1
Table of Contents INTRODUCTION ........................................................................................................ 1
PART 1 ....................................................................................................................... 2
THE MID-YEAR ECONOMIC AND FISCAL OUTLOOK ............................................. 2
1.1 ECONOMIC OUTLOOK ................................................................................ 2
International Economic Outlook – A Firming Recovery ......................................... 2
Commodity Prices .................................................................................................. 4
Exchange Rate Developments ................................................................................ 7
Domestic Economic Outlook .................................................................................. 8
2017 Economic Outlook ........................................................................................ 8
Employment ......................................................................................................... 10
Inflation Outlook .................................................................................................. 11
Monetary Developments ....................................................................................... 13
Balance of Payments ............................................................................................ 14
International Reserves .......................................................................................... 16
1.2 THE FISCAL OUTLOOK ............................................................................. 16
1.3 TOTAL REVENUE AND GRANTS ............................................................... 17
TAX REVENUE ..................................................................................................... 18
Taxes on Payroll and Workforce ........................................................................... 18
Taxes on Goods and Services ............................................................................... 19
Taxes on International Trade and Transactions .................................................. 19
GRANTS ............................................................................................................... 20
OTHER REVENUE ............................................................................................... 20
1.4 REVENUE MEASURES UPDATE ............................................................... 21
1.5 EXPENDITURE AND NET LENDING.......................................................... 21
Operational Budget Expenditure ......................................................................... 22
Capital Budget Expenditure ................................................................................. 24
1.6 STATUS OF TRUST ACCOUNTS ................................................................ 25
District Services Improvement Program (DSIP) Trust Accounts .......................... 26
1.7 FINANCING ................................................................................................. 27
External Funding ................................................................................................. 27
Domestic Funding ................................................................................................ 27
2017 Net Financing .............................................................................................. 29
1.8 PUBLIC DEBT ............................................................................................. 29

2
1.9 RISKS TO THE MID-YEAR ECONOMIC AND FISCAL OUTLOOK ............. 30
1.10 2017 AND BEYOND ................................................................................ 31
1.11 FISCAL OUTTURN TABLES .................................................................... 32
PART 2 ..................................................................................................................... 38
2017 MID -YEAR EXPENDITURE ........................................................................... 38
2.1 FUNDED EXPENDITURE SINCE THE 2017 BUDGET ................................. 38
APPROPRIATION TRANSFERS ............................................................................ 39
Section 3 Transfers (Secretary’s Advance) ............................................................ 39
Section 4 Transfers .............................................................................................. 40
2.2 2017 BUDGET EXECUTION ......................................................................... 40
Spending on the Medium Term Development Plan (MTDP) Enablers ................. 41
FUNDING FOR CAPITAL INVESTMENT EXPENDITURE .................................... 42
GRANT FINANCING ............................................................................................. 43
PART 3 ATTACHMENTS......................................................................................... 1

1
INTRODUCTION
The Mid-Year Economic and Fiscal Outlook (MYEFO) Report is released in accordance with the requirements of sections 9 to 12 of the Papua New Guinea Fiscal Responsibility Act (FRA) 2006. The purpose of the MYEFO Report is to provide updated fiscal information, especially for the current financial year, to allow the Parliament and the public to assess developments against those set out in the 2017 Budget. The MYEFO contains the following: Part 1: The Mid-Year Economic and Fiscal Outlook 1.1 The Economic Outlook
1.2 The Fiscal Outlook 1.3 Total Revenue and Grants 1.4 Expenditure and Net Lending 1.5 Status of Trust Accounts 1.6 Financing 1.7 Public Debt 1.8 Risks to the Mid-Year Economic and Fiscal Outlook 1.9 2017 and Beyond 1.10 Fiscal Outturn Tables
Part 2: Mid-Year Expenditure Estimates by Agency 2.1 Funded Expenditure since the 2017 Budget 2.2 2017 Budget Execution
Part 3: Attachments The MYEFO essentially covers General Government fiscal and financial operations in the government sector and is based on the same reporting standards as the 2017 Budget. Generally, this follows the cash reporting standards laid down in the Government Finance Statistics (GFS) Manual 2014 published by the International Monetary Fund (IMF). This is a gradual shift from the 1986 GFS to the 2014 GFS and is part of the ongoing reform of the Budget process and Budget reporting. The information on National Account presented in this report is based on the official release by National Statistical Office in December 20161.
1 The Gross Domestic Product (GDP) has been rebased to 2013

2
PART 1
THE MID-YEAR ECONOMIC AND FISCAL OUTLOOK
1.1 ECONOMIC OUTLOOK International Economic Outlook – A Firming Recovery According to the 2017 July World Economic Outlook (WEO) report published by the International Monetary Fund (IMF), the global economic activity remains on track maintaining a pick-up in growth as reported in the April WEO. Global growth for 2016 is estimated at 3.2 per cent, slightly higher than the 2017 April forecast, primarily reflecting much higher growth in Iran and stronger activity in India following national accounts revisions. In 2017, global growth is projected at 3.5 per cent and 3.6 per cent in 2018. The unchanged global growth projections mask somewhat different contributions at the country level. The US growth projections are lower than those in April, primarily reflecting the assumptions that fiscal policy will be less expansionary going forward than previously anticipated. Growth has been revised up for Japan and the euro area, where positive surprises to activity in late 2016 and early 2017 point to solid momentum. China’s growth has also been revised up, reflecting a strong first quarter of 2017 and expectations of continued fiscal support. Although projected global growth rates for 2017-18 are higher than the 3.2 per cent estimated for 2016, are below pre-crisis averages, especially for most advanced economies and for commodity-exporting emerging and developing economies. Among the former, many face excess capacity as well as headwinds to potential growth from aging populations, weak investment, and slowly advancing productivity.

3
Chart 1: World Economic Growth (1983-2018)
Source: International Monetary Fund, World Economic Outlook (July) 2017
Growth in the advanced economies is projected at 2.0 per cent and 1.9 per cent for 2017 and 2018 in the July 2017 WEO respectively compared to 1.9 per cent and 2.0 per cent projected as at the April 2017 WEO. Growth in the US has been revised down from 2.3 per cent to 2.1 per cent for 2017and from 2.5 per cent to 2.1 per cent in 2018. While downward revision in the 2017 forecast reflects in part the weak growth outturn in the first quarter of the year. Fiscal policy will continue to be less expansionary than previously assumed, given the uncertainty about the timing and the nature of the USA fiscal policy changes and market expectations of fiscal stimulus have also receded. The growth forecast in the United Kingdom (UK) has also been revised down for 2017 on weaker-than-expected activity in the first quarter which contrasted with other Euro area countries, including France, Germany, Italy and Spain, growth for the first quarter was generally above expectations mainly driven by stronger momentum in domestic demand. Canada’s growth forecast was also revised upwards driven by a buoyant domestic demand boosting growth to 3.7 per cent and key economic indicators pointing to a resilient second-quarter. Japan, where private consumption, investment, and exports support first-quarter growth. In the Emerging Markets and Developing Economies (EMDEs), growth is projected to see a sustained pickup in activity with growth rising from 4.3 per cent in 2016 to 4.6 per cent in 2017 and 4.8 per cent in 2018. These forecasts reflect upward revisions, relative to April, of 0.2 percentage point for 2016, and 0.1 percentage for 2017 primarily driven by commodity importers, but its pickup reflects a gradual improved conditions in large commodity exporters that have experienced recession in 2015-16.
-1
0
1
2
3
4
5
6
-1
0
1
2
3
4
5
6
1983 1988 1993 1998 2003 2008 2013 2018
Per cent Per centF
ore
ca
st

4
China’s growth is expected to remain at 6.7 per cent in 2017, the same level as in 2016, and to decline only modestly in 2018 to 6.4 per cent. The forecast for 2017 was revised up by 0.1 percentage point reflecting the stronger than expected outturn in the first quarter of the year underpinned by previous policy easing and supply-side reforms. For 2018, the upward revision of 0.2 percentage point mainly reflects expectation that authorities will delay the needed fiscal adjustment thus maintaining high public investment to meet their target of doubling 2010 real GDP by 2020. Growth in India is forecast to pick up further in 2017 and 2018, in line with the April 2017 forecast. While activity slowed following the currency exchange initiative, growth for 2016 is estimated at 7.1 per cent, higher than anticipated due to strong government spending and data revisions that showed stronger momentum in the first part of the year. Over the medium- term, the global growth is projected to gradually increase to 3.8 per cent by 2022, driven by the EMDEs, reflecting strengthening of growth in commodity exporters, an acceleration of activity in India resulting from the implementation of structural reforms and a successful rebalancing of China’s economy to trend growth rates Commodity Prices Mineral Commodities Movements in commodity prices continued to track developments in the global economy over the first half of 2017. The IMF Commodity Price Index rose by 14.1 per cent, compared to the corresponding period of 2016. Prices of PNG’s key export commodities, especially oil continues to be influenced by the OPEC and non-OPEC supply cut agreement and the US shale oil supply outlook. Copper prices rose considerably driven by unexpected supply disruptions. Gold on the other hand, has been weighed down by unfavourable developments in the US economy. Oil prices have been supported by the agreement among major oil producers (OPEC and non-OPEC members) to trim supply, and more recently the unexpected extension of this agreement through to March 2018. However, prices faced strong resistance from persistently high stocks, supported by ongoing growth in the US shale oil output and rising production from Libya and Nigeria. In the first half of the year, the crude oil (WTI) price averaged US$50 per barrel.
Chart 2: IMF Commodity Price Index Chart 3: Oil Price
70
110
150
190
230
70
110
150
190
230
Jun-11 Jun-13 Jun-15 Jun-17
Index 2005=100 Index 2005=100
30
50
70
90
110
30
50
70
90
110
Jun-11 Jun-13 Jun-15 Jun-17
Budget
MYEFO
US$ per Barrel US$ per Barrel
Long run average ($50/bl)

5
Source: International Monetary Fund (IMF) Source: IMF and Energy Information Administration
Copper prices have generally increased over the first half of 2017 as a result of continued supply disruptions among the world’s largest copper mines, despite weaker demand for the metal in China (the world’s largest consumer of the metal) and stronger US dollar. These two factors going forward will continue to weigh down on prices. In the first half of the year, copper prices averaged US$5,746 per tonne.
Chart 4: Copper Price Chart 5: Gold Price
Source: IMF and London Metal Exchange Source: IMF and Bank of England
Gold prices continued to be influenced by global developments associated with the US economy. Gold was trending upwards in the first quarter at the back of strong investment demand amid slow growth faced in the US economy and geopolitical uncertainties. However, prices have dipped on the ensuing months reflecting decisions by the US Federal Reserve to raise interest rate. In the first half of 2017, gold prices averaged US$1,239.0 per ounce. Reflective of the developments in the global mineral commodity prices, the 2017 Budget assumptions for PNG’s key mineral exports have been revised2. The Budget copper price assumption of US$4,832 per tonne (Chart 4) has been revised up to US$5,704 per tonne. The gold price has been revised down to US$1,239 per ounce from US$1,301 per ounce at Budget (Chart 5). The Budget oil price assumption of US$50 per barrel has been maintained (Chart 3). Agriculture Commodities Coffee Coffee prices have receded from the 2016 highs. The downward trend is reflective of anticipated decrease in Brazil’s output resulting from a lower 2016/2017 crop. Higher output and exports from other coffee producing countries Vietnam, Columbia and Indonesia have compensated for the fall in Brazil’s output. Cocoa Cocoa prices continued to decline since July 2016, due to excess supply conditions. World cocoa production for the 2017/2018 (starting June 2017) is expected to increase by 18.0 per cent from the previous season. With demand anticipate to grow at only 3.0 per cent,
2The price forecast methodology applied is the weighted average of the actual year-to-date average price from Jan 04 to Jun 30, and an assumption
for the remainder of the year.
3000
5000
7000
9000
11000
3000
5000
7000
9000
11000
Jun-11 Jun-13 Jun-15 Jun-17
US$ per tonne US$ per tonne
BUDGET
MYEFO
Long-run average ($4,000/tn)
600
925
1250
1575
1900
600
925
1250
1575
1900
Jun-11 Jun-13 Jun-15 Jun-17
US$ per ounce US$ per ounce
BUDGET
MYEFO
Long-run average ($700/oz)

6
the current season is expected to record a surplus of 382,000 tonnes weighing down on the price of cocoa.
Chart 6: Coffee Price Chart 7: Cocoa Price
Source: International Coffee Organisation Source: International Cocoa Organisation
Palm Oil Palm oil prices performed below expectations over the first half of 2017, despite a strong start in the first quarter. Faster-than-expected recovery in output illustrated by increased production of Malaysia palm oil, combined with slower demand driven by availability of other competitive vegetable oils and the uncertainty in global economic conditions have suppressed the price of palm oil in the first half of the year. Copra Oil Prices for copra oil remain high reflecting output reduction in Philippines, exacerbated by the emergence in demand for fresh water coconut (kulau) that has led to less dry nuts available for copra oil production.
1000
2500
4000
5500
7000
1000
2500
4000
5500
7000
Jun-11 Jun-13 Jun-15 Jun-17
US$ per tonne US$ per tonne
MYEFO
BUDGET
1500
2125
2750
3375
4000
1500
2125
2750
3375
4000
Jun-11 Jun-13 Jun-15 Jun-17
US$ per tonne US$ per tonne
MYEFO
BUDGET

7
Chart 8: Palm Oil Price Chart 9: Copra Oil Price
Source: Malaysia Palm Oil Council Source: Index Mundi
Exchange Rate Developments PNG’s Trade Weighted Index (TWI)3 has moderated over the first half of 2017 reflective of mixed performance of the Kina against PNG’s major trading currencies. As shown in Chart 10, PNG’s TWI fell by 1.5 per cent over the first half of 2017, compared to 2016. The Kina depreciated by 1.4 per cent and 2.9 per cent against the US dollar (USD) and the Australian dollar (AUD), respectively (Chart 11). Compared to two last years, the exchange rate market has somewhat stabilised against the US dollar as foreign exchange imbalance subsided in the first quarter. This has translated into a marginal depreciation of the Kina against the US dollar. The depreciation against the Australian dollar is attributed to cross currency movements.
Chart 10: Trade Weighted Index Chart 11: Exchange Rate Developments
Source: Bank of PNG Source: Bank of PNG
3 The Trade Weighted Index (TWI) measures the value of the Kina against a basket of currencies of PNG’s major trading partners.
400
600
800
1000
1200
400
600
800
1000
1200
Jun-11 Jun-13 Jun-15 Jun-17
US$ per tonne US$ per tonne
MYEFO
BUDGET
600
950
1300
1650
2000
600
950
1300
1650
2000
Jun-11 Jun-13 Jun-15 Jun-17
US$ per tonne US$ per tonne
MYEFO
BUDGET
39
44
49
54
39
44
49
54
Jun-11 Jun-13 Jun-15 Jun-17
Index: 1995=100 Index: 1995=100
0.31
0.36
0.41
0.46
0.51
0.31
0.36
0.41
0.46
0.51
Jun-11 Jun-13 Jun-15 Jun-17
Dollar per Kina Dollar per Kina
US Dollar per Kina
AUS Dollar per Kina

8
The PNG Kina appreciated against the Chinese Yuan (up 2.1 per cent), British Pound (up 5.9 per cent), Japanese Yen (up 1.7 per cent), Malaysian Ringgit (up 4.4 per cent), Philippines Peso (up 3.6 per cent), Singapore dollar (up 0.2 per cent) and the Euro (up 0.6 per cent). Domestic Economic Outlook 2016 Economic Update In 2016, the PNG economy was estimated to have grown by 2.0 per cent. The major driver of this growth include a rebound in the agriculture sector after suffering from the drought in 2015 and the mining sector with the resumption of production at the Ok Tedi mine. The growth in 2016 was also supported by the oil and gas sector driven by increased gas production from the PNG LNG project. The improvements in these key export sectors have supported economic activity in the other non-mining sectors following the downturn brought on by plummeting commodity prices, drought, the foreign exchange imbalance to service imports and the reduction in Government spending in the economy. While still recovering, the non-mining sector is estimated to have grown by a moderate growth of 0.7 per cent. 2017 Economic Outlook In 2017, the domestic economy is projected to continue grow at 2.7 per cent, slightly lower by 0.1 percentage point from the 2017 Budget estimate of 2.8 per cent. This reflects lower than anticipated growth in the mining and the agriculture sectors of the economy while the oil and gas sector is projected to contract by 0.5 per cent.
Chart 12: Economic Growth (2011-2017)
Source: Department of Treasury
The mining and quarrying sector is projected to grow at 11.9 per cent in 2017, driven by a rebound from the Ok Tedi mine and the Ramu Nickel mine after a lackluster performance in 2016. However, this is lower than the projected 14.3 per cent at the 2017 Budget, reflective of lower than anticipated gold production from two major mines, Ok Tedi and Pogera.

9
Table 1: Key Economic Parameters
2016 2017 2017
Actual Budget MYEFO
Total Nominal GDP (Kina Million)
67,762.2
74,625.3
74,225.0
Economic Growth (%) Total Real GDP (est.) 2.0 2.8 2.7 Non-Mining Real GDP (est.) 0.7 2.3 2.3 Inflation (%) Year average 6.7 7.0 6.8 Interest Rate (%) Kina Facility Rate (KFR) 6.25 6.25 6.25 3 year Inscribed Stock (IS) 9.7 9.7 9.7 Mineral Prices Gold (US$/ounce) 1,248 1,301 1,239 Copper (US$/tonne) 4,865 4,832 5,704 Oil (Kutubu:US$/barrel) 44 50 50 LNG (US$ per thousand cubic feet) 7.6 8.0 8.0 Agriculture Prices Coffee (US$ per tonne) 3,627 3,852 3,417 Palm Oil (US$ per tonne 640 630 630 Cocoa (US$ per tonne 2,892 3,092 2,025 Copra Oil (US$ per tonne) 1,459 1,325 1,661
Source: Department of Treasury
The agriculture, forestry and fishery sector is projected to grow at 3.2 per cent, slightly lower than the 2017 Budget estimate of 3.3 per cent. This reflects low log production in 2017. Other agricultural commodities are set to perform well at expected levels due to improved weather and growing conditions. Palm oil production is expected to return to normal following the effect of the El-Nino weather phenomenon. Supply response from cocoa is expected to gain momentum with new areas coming into production especially the Sepik provinces despite sharp contraction in cocoa prices. Copra oil production will continue to benefit from favorable prices while coffee production to moderate in 2017 as the crop recovers from a bumper season in 20164.
4 Coffee outlook does not capture the possible impact of the Coffee Berry Borer (CBB) due to non-availability of relevant information.

10
Chart 13: Sectors Contribution to Total Real GDP (% growth)
Source: Department of Treasury
The non-mining sector is expected to be supported by 2017 Election related spending and activities associated with the preparations of Asia Pacific Economic Cooperation (APEC) 2018. Improvements in some of the challenges faced by businesses, including foreign exchange imbalance, in 2017 are also expected to support this sector. The total non-mining GDP is expected to grow by 2.3 per cent5, generally in line with the budget estimate. Employment Total employment has increased by 3.6 per cent through-the-year to March quarter 2017 reflecting increase in employment in the mining sector (Chart 14). Employment in the mining sector grew by 8.9 per cent through-the-year to March quarter 2017, attributed to the full operation of a key mine following its resumption in early 2016.
5 Excluding taxes and subsidies, non-mining real GDP is 2.2% reflective of the downward revision to the agriculture fishery and forestry and the finance and insurance activities sectors.
-2.00 0.00 2.00 4.00 6.00 8.00 10.00 12.00 14.00 16.00
Agriculture, Forestry and FishingOil and Gas ExtractionMining and Quarrying
ManufacturingElectricity Gas & Airconditioning
Water Supply & Waste ManagementConstruction
Wholesale and retail tradeTransport and Storage
Accomodation and Food ServicesInformation and Communication
Financial and Insurance ActivitiesReal Estate Activities
Professional and ScientificAdministrative and Support Services
Public Administration and DefenceEducation
Health and Social Work ActivitiesOther Service Activities
2017 Budget 2017 MYEFO

11
Chart 14: Employment Growth (through-the-year % growth)
Source: Bank of PNG
Non-mining sector employment contracted by 2.5 per cent through-the-year to March quarter 2017, an improvement from a contraction of 4.1 per cent in the corresponding period of 2016 and still reflecting sluggish performance from the non-mining sectors. Non-mining employment contracted in a number of sectors including building and construction (down 13.6 per cent), transport (down 10.0 per cent), retail (down 5.6 per cent), wholesale (down 3.1 per cent), and finance and other services (down 1.3 per cent). On the other hand, the manufacturing sector and the agriculture, forestry and fishery sector recorded growth in employment by 1.9 per cent and 0.6 per cent respectively.
Inflation Outlook Headline inflation is projected to be 6.8 per cent in 2017, slightly higher than the 2016 outcome of 6.7 per cent. This is reflective of the gradual recovery in the domestic economy, global commodity prices especially crude oil price and weak Kina exchange rate against major trading currencies. The headline inflation is projected to be slightly below the 2017 Budget projection of 7.0 per cent reflective of the low March quarter inflation outcome, stable Kina exchange rate and crude oil price remaining at low levels.
-25
0
25
50
75
-25
0
25
50
75
Mar-09 Mar-10 Mar-11 Mar-12 Mar-13 Mar-14 Mar-15 Mar-16 Mar-17
Per cent, tty Per cent, tty
Mining Employment
Non-Mining Employment
12
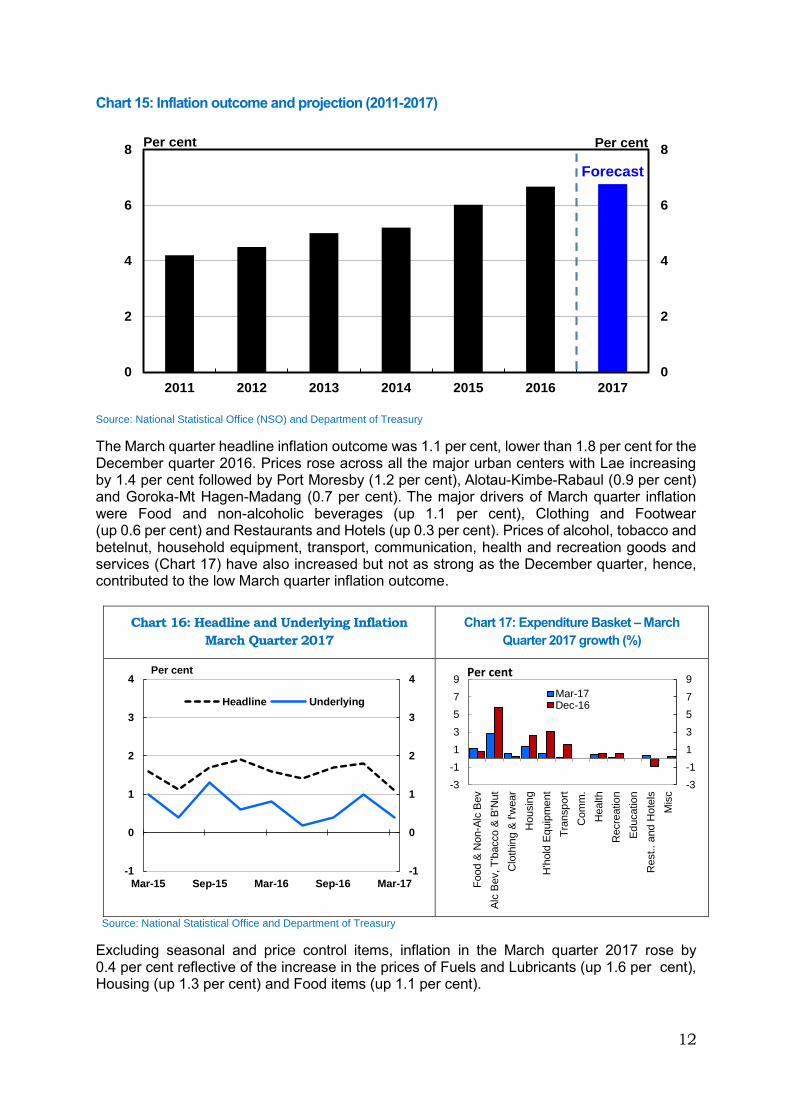
Chart 15: Inflation outcome and projection (2011-2017)
Source: National Statistical Office (NSO) and Department of Treasury
The March quarter headline inflation outcome was 1.1 per cent, lower than 1.8 per cent for the December quarter 2016. Prices rose across all the major urban centers with Lae increasing by 1.4 per cent followed by Port Moresby (1.2 per cent), Alotau-Kimbe-Rabaul (0.9 per cent) and Goroka-Mt Hagen-Madang (0.7 per cent). The major drivers of March quarter inflation were Food and non-alcoholic beverages (up 1.1 per cent), Clothing and Footwear (up 0.6 per cent) and Restaurants and Hotels (up 0.3 per cent). Prices of alcohol, tobacco and betelnut, household equipment, transport, communication, health and recreation goods and services (Chart 17) have also increased but not as strong as the December quarter, hence, contributed to the low March quarter inflation outcome.
Chart 16: Headline and Underlying Inflation
March Quarter 2017
Chart 17: Expenditure Basket – March
Quarter 2017 growth (%)
Source: National Statistical Office and Department of Treasury
Excluding seasonal and price control items, inflation in the March quarter 2017 rose by 0.4 per cent reflective of the increase in the prices of Fuels and Lubricants (up 1.6 per cent), Housing (up 1.3 per cent) and Food items (up 1.1 per cent).
0
2
4
6
8
0
2
4
6
8
2011 2012 2013 2014 2015 2016 2017
Per cent Per cent
Forecast
-1
0
1
2
3
4
-1
0
1
2
3
4
Mar-15 Sep-15 Mar-16 Sep-16 Mar-17
Headline Underlying
Per cent
-3
-1
1
3
5
7
9
-3
-1
1
3
5
7
9
Fo
od &
Non-A
lc B
ev
Alc
Bev, T
'bacco &
B'N
ut
Clo
thin
g &
f'w
ear
Housin
g
H'h
old
Equip
me
nt
Tra
nsp
ort
Com
m.
Health
Recre
atio
n
Ed
ucation
Rest.. and H
ote
ls
Mis
c
Mar-17Dec-16
Per cent

13
Imported inflation grew slightly by 0.3 per cent in the March quarter 2017 (Chart 18). Prices have increased for Boys Wear (up 2.0 per cent), Fuels and Lubricants (up 1.6 per cent), Oils and Fats (up 1.6 per cent) and Men’s Wear (up 1.2 per cent). Overall, the March quarter inflation was not as high as 1.1 per cent for the previous quarter, reflective of decline in the prices of head wears, sewing items and household furniture and fittings.
Chart 18: Tradable and non-Tradable Inflation
March Quarter 2017
Chart 19: Headline and Underlying Inflation through
the year (March 2016 to March 2017)
Source: National Statistical Office Source: Bank of PNG
Domestic inflation was1.6 per cent in the March quarter 2017 (Chart 18) due to the rise in the price of fruits and vegetables (up 4.9 per cent), betelnut (up 4.7 per cent), rental (up 2.0 per cent), cooking (up 2.9 per cent), household maintenance (up 1.4 per cent), motor vehicle registration and maintenance (up 2.8 per cent), medical supplies (up 0.8 per cent) and accommodation (up 0.6 per cent). Overall, the March quarter inflation for domestic goods and services was not as high as 1.1 per cent for the previous quarter, reflective of decline in the prices of alcohol, beverages and tobacco, fish and housing maintenance. Generally, headline inflation over the first quarter of 2017 averaged 6.0 per cent, a moderating trend from 6.8 per cent and 6.6 per cent in the last two quarters respectively (Chart 19). Monetary Developments The Bank of PNG maintained its neutral monetary policy stance aimed at supporting economic activity by maintaining its Kina Facility Rate (KFR) at 6.25 per cent. In 2016, the Broad Money supply (M3) rose by 9.0 per cent from 2015 outcome reflective of a significant increase in net claims on Government by 48.9 per cent. Credit to the private sector increased by 5.4 per cent while Net Foreign Assets declined by 14.9 per cent. In the first quarter of 2017, broad money supply increased on average by 1.9 per cent, driven primarily by net claims on Central Government (up 12.7 per cent) to an average of K9,504.8 million. The high net claims on the Central Government is reflective of the issuance of securities to finance the 2017 Budget in the first quarter in light of slower revenues and carry over expenditures from 2016. The Net Foreign Assets increased on average by 6.4 per cent to K5,591.7 million, while credit to the private sector contracted by 2.9 per cent to K11,018.4 million.
-1
0
1
2
3
4
-1
0
1
2
3
4
Mar-15 Jul-15 Nov-15 Mar-16 Jul-16 Nov-16 Mar-17
Per cent Per cent
Tradable
Non-Tradable
0
2
4
6
8
10
0
2
4
6
8
10
Mar-15 Sep-15 Mar-16 Sep-16 Mar-17
Headline Underlying
Per centPer cent

14
Chart 20: Monetary and Credit Growth (through the year % growth)
Source: Bank of PNG
According to the Bank of PNG 2017 March Monetary Policy Statement (MPS), the broad money supply is projected to increase by 10.3 per cent in 2017. The Bank projected Net Claims on Government and credit to the private sector to increase by 16.6 per cent and 6.9 per cent respectively, while Net Foreign Asset is projected to increase significantly by 30.9 per cent. The Monetary base is projected to increase by 2.5 per cent, a significant moderation from 24.4 per cent in 2016. Balance of Payments In 2016, the current account balance remained in surplus at K16,790.0 million (24.8 per cent of GDP) or 38.2 per cent higher than 2015 surplus. The high surplus was attributed mainly to the combined effects of improved export earnings from the agriculture and the mining sectors and contraction in import spending. Goods and services exports rose by 7.0 per cent over 2015 while imports contracted by 19.0 per cent. According to the Bank of PNG6 December Quarterly Economic Bulletin, the low supply of foreign currency restricted some import demand from being met. The contraction in imports was mainly from general imports. In the first quarter of 2017, the current account balance continued to be in surplus at K4,661.1 million. Continued exports of LNG and condensate and improved export earnings from the agriculture and the mining sectors have contributed to the surplus in the current account balance. Imports rose by 22.8 per cent following an increase of 25.6 per cent in the previous quarter. The improved exports continued to support the demand for imports through foreign currencies.
6
2016 December Quarterly Economic Bulletin
-400
-200
0
200
400
600
800
1000
-30
-20
-10
0
10
20
30
40
50
60
70
2011 2012 2013 2014 2015 2016 2017
Money Supply (LHS) Net Foreign Assets (LHS)
Credit to Private Sector (LHS) Net Claims on Government (RHS)
Per cent RLHS)

15
Chart 21: Balance of Payment Quarterly (Kina, million: 2014-2017)
Source: Department of Treasury
The income account recorded a deficit of K181.0 million. This continued to reflect lower dividend payments to foreign shareholders and compensation of employees. The transfer account continued to remain in surplus, totaling K109.8 million in the first quarter of 2017. The surplus continued to be driven by transfer receipts from gifts and grants. The capital and financial account continued to increase in deficit, recording K4,303.3 million in the first quarter of 2017. The net impact on the overall balance of payment in the first quarter was a surplus of K368.5 million, an improvement from a deficit of K210.3 million for the previous quarter. Chart 22: Balance of Payment Annual (Kina, million: 2011-2017)
Source: Department of Treasury
In 2017, current account balance is projected to remain in surplus driven by continued exports from LNG, full year operation of Ok Tedi, ramp up of production at the Ramu Nickel mine and
-2000
-1000
0
1000
2000
3000
4000
5000
6000
-2000
-1000
0
1000
2000
3000
4000
5000
6000
Mar-14 Jun-14 Sep-14 Dec-14 Mar-15 Jun-15 Sep-15 Dec-15 Mar-16 Jun-16 Sep-16 Dec-16 Mar-17
Current Accoun Balance Trade Balance Income Balance Transfers Balance
Kina Million
-4000
-2000
0
2000
4000
6000
8000
10000
-10000
-5000
0
5000
10000
15000
20000
25000
2011 2012 2013 2014 2015 2016 2017
CURRENT ACCOUNT BALANCE (LHS) Trade Balance (LHS)
Income Balance (RHS) Transfers Balance (RHS)
Kina Million (RHS)Kina Million (LHS)

16
continued improvements in exports from the agriculture sector. Imports are expected to stabilise in line with the gradual recovery in the domestic economy. The deficit in income account is projected to increase due to improved exports to support dividend payments to foreign shareholders. The surplus in the transfer account is projected to continue due to payments for gifts and grants. Meanwhile, the capital and financial account is projected to remain in deficit due to continued build-up of off-shore foreign currency accounts. International Reserves International reserves were US$1,678.2 million (K5,257.5 million) at the end of 2016. At the end of the first quarter of 2017, international reserves totaled K5,626.1 million, an improvement of K368.6 million. According to Bank of PNG, this reserve level is sufficient for 6.4 months of total import cover and 13.5 months of non-mineral import covers. Chart 23: International Reserves Annual (Kina, million: 2011-2017)
Source: Department of Treasury
The Bank of PNG has estimated that by the end of 2017 the level of foreign exchange reserves will increase to US$2,106.6 million (K6,617.5 million)7. The increase in the level of reserves mainly reflects improved inflows from non-mineral export receipts, expected proceeds from external financing, receipts for royalty and development levy associated with the PNG LNG Project and concessional loan drawdowns from bilateral and multilateral sources.
1.2 THE FISCAL OUTLOOK The Fiscal Outlook for 2017 has weakened in the first half of the year as per the June Outturn Report. This is expected to result in a net borrowing (deficit) of K2,820.4 million or 3.8 per cent of GDP, which is an increase of K944.0 million, compared to the initial net borrowing (deficit) of K1,876.5 million or 2.5 per cent of GDP at the time of the 2017 Budget using new GDP. This primarily reflects a projected shortfall in tax and non-tax revenue receipts, particularly from Company Income Taxes, and dividends from State entities and projected increase in expenditure, particularly compensation of employees. Total Revenue and Grants are projected to be lower than the 2017 Budget estimates. Total revenue is projected to be lower by K514.0 million. Total Expenditure and Net Lending are projected to be higher by K430.1 million than the 2017 Budget estimates.
7 Source: March Monetary Policy Statement (BPNG)
0
1000
2000
3000
4000
5000
6000
7000
8000
9000
10000
2011 2012 2013 2014 2015 2016 2017 (Mar Qtr)
Kina Million

17
Debt to GDP ratio at the time of the 2017 Budget was 29.0 per cent using new GDP. Based on the 2017 MYEFO projections, total public debt is projected to increase to K25,939.4 million, pushing the debt to GDP ratio to 34.9 per cent which is 4.9 percentage points above the legislated debt limit of 30.0 per cent. Major expenditure commitments in MTDP Enablers in the 2017 Budget will continue to be delivered. This includes key Government priorities such as Tuition Fee Free Education and Infrastructure such as roads and bridges. The immediate challenge for the Government now is to tighten the fiscal position throughout the second half of 2017. The performance of borrowing in particular external financing and all funding sources will continue to be monitored and if necessary adjustments will be made as and when required. The updated fiscal estimates for 2017 are set out in Table 2. Table 2: Budget Balance 2016-2017 (Kina, million)
Details 2016
Actual 2017
Budget June
Outturn 2017
MYEFO Budget
Variation
Total Revenue and Grants 10,485.5 11,473.1 4,441.4 10,959.2 -514.0*
Total Expenditure and Net Lending 13,572.4 13,349.5 5,225.8 13,779.6 -430.1
Net Lending (+)/Net Borrowing (-) -3,086.9 -1,876.5 -784.4 -2,820.4 -944.0
% of GDP 4.6% 2.5% 1.0% 3.8% -1.0% Source: Department of Treasury *K513.9m – round off
1.3 TOTAL REVENUE AND GRANTS The Government’s Total Revenue and Grants at the 2017 Budget was projected to be K11,473.1 million underpinned by an expected gradual recovery in the economy from improved exports, stimulus from election related spending and APEC preparations which were expected to generate additional activities from which to support revenues to the Government. In the first half of the year, all tax revenues except Company Income Tax, have been trending better against the 2017 Budget estimates. While Donor Grants are expected to be in line with the 2017 Budget estimate, there has been no dividend receipts from the State entities to date. However, Tax Revenue is still projected to be lower by K288.9 million while Other Revenue is projected to be lower by K225.1 million. Overall, Total Revenue and Grants projection of K11,473.1 million is projected to be lower by K514.0 million to K10,959.2 million at the end of the year due to weaker outlook for Company Income Tax collection.
Table 3: Total Revenue and Grants 2016-2017 (Kina, million)
2016
Actual 2017
Budget June
Outturn 2017
MYEFO Budget
Variation
Tax Revenue 8,421.6 9,158.2 4,011.1 8,869.3 -288.9
Per cent of GDP 14% 12.3% 5.0% 11.9% -0.4%
Grants 1,430.0 968.1 387.2 968.1 0.0
Per cent of GDP 1.2% 1.3% 0.5% 1.3% 0.0%
Other Revenue 633.9 1,346.9 43.1 1,121.8 -225.1
Per cent of GDP 1.5% 1.8% 0.1% 1.5% -0.3%
Total Revenue and Grants 10,485.5 11,473.1 4,441.1 10,959.2 -514.0
Per cent of GDP 16.2% 15.4% 5.0% 14.8% -0.8% Source: Department of Treasury

18
TAX REVENUE Taxes on Income, Profits and Capital Gains is projected to decrease by K284.2 million relative to the 2017 Budget estimate, driven mainly from a reduction in Company Income Tax anticipated to be lower by K290.3 million. In the first half of the year, the Company Income Tax amounted to K647.5 million which is 27 per cent of the Budget estimate. The weak receipts collections reflected reduced profits of businesses as they adjust to current economic environment. Table 4: Taxes on Income, Profits and Capital Gains 2016-2017 (Kina, million)
2016
Actual 2017
Budget June
Outturn 2017
MYEFO Budget
Variation
Taxes on Income, Profits and Capital Gains 5,286.2 5,818.9 2,318.8 5,534.7 -284.2
Personal Income Tax 2,844.3 3,035.7 1,498.2 3,035.7 0.0
Company Tax 2,093.8 2,433.9 647.5 2,143.6 -290.3
Mining and Petroleum Taxes* 92.0 77.1 41.7 77.1 0.0
Royalties Tax 26.6 44.0 10.4 27.3 -16.7
Management Tax 17.7 10.9 6.9 19.2 8.3
Dividend Withholding Tax Non Mining 132.6 138.8 70.1 146.3 7.5
Interest Withholding Tax 78.7 77.8 43.8 85.0 7.2
Sundry IRC Taxes & Income 0.5 0.5 0.1 0.5 0.0
Source: Department of Treasury *The MPT estimates for the 2017 Budget and the 2017 MYEFO captures the 50% component that flows directly to WPA. The other 50% flows to SWF & drawdown to Budget.
The Personal Income Tax (PIT) collections in the first half of the year amounted to K1,498.2 million or 49.0 per cent against the Budget estimate of K3,035.7 million. Increase in lodgments from new taxpayers was driven by a compliance exercise. The Mining and Petroleum Tax estimate at the 2017 Budget was K154.3 million. Collections in the first half of the year amounted to K41.7 million or 27.0 per cent against the 2017 Budget estimate. With prices of key mineral exporters above the 2016 levels, receipts are expected to be better than 2016 outcome of K92.0 million. The Dividend Withholding Tax and Interest Withholding Tax collections in the first half of the year totaled 51.0 per cent and 56.0 per cent respectively relative to the 2017 Budget estimates. Collections for these two tax heads are expected to strengthen in the remaining six months of the year to achieve the 2017 Budget estimate. Taxes on Payroll and Workforce Taxes on Payroll and Workforce amounted to K5.6 million or 32 per cent against budget in the first half of the year. Taxes on Payroll and Workforce is projected to decrease by K5.9 million. Table 5: Taxes on Payroll and Workforce 2016-2017 (Kina, million)
Tax on Payroll & Workforce 2016
Actual 2017
Budget June
Outturn 2017
MYEFO Budget
Variation
Training Levy 14.4 17.6 5.6 11.7 -5.9
Total 14.4 17.6 5.6 11.7 -5.9
Source: Department of Treasury

19
Taxes on Goods and Services Taxes on Goods and Services are projected to decrease by K11.7 million from the 2017 Budget estimate of K2,762.2 million. This is due to lower than anticipated collections in the first half of the year from the Gaming Machine Tax and Bookmakers Turnover Tax (BTT). Gaming Machine Tax has tracked at 42.0 per cent relative to the 2017 Budget while BTT tracked 22.0 per cent below the 2017 Budget estimate. Goods and Services Taxes (GST) is expected to be in line with the 2017 Budget estimate of K1,484.7 million. Collections at the ports and inland amounted to 50.0 per cent and 36.0 per cent, respectively, relative of the 2017 Budget estimates. The compliance efforts and the introduction of the Container Examination Facility (CEF) service is expected to support GST collections and transfers to the Waigani Public Account (WPA). Of this gross GST collections, K855.5 million was remitted to WPA in the first half of the year. Table 6: Taxes on Goods and Services 2016-2017 (Kina, million)
2016
Actual 2017
Budget June
Outturn 2017
MYEFO Budget
Variation
Taxes on Goods and Services 2,584.1 2,762.2 1,424.6 2,754.6 -7.6
GST1 1,442.6 1,484.7 864.1 1,484.7 0.0
Sales taxes 0.0 0.0 0.0 0.0 -
Bank Account Debit Fees 0.0 0.0 0.0 0.0 -
Stamp Duties 79.2 42.9 24.3 50.9 8.0
Excise Duty 603.7 691.1 298.5 691.1 0.0
Import Excise 272.2 300.3 142.1 300.3 0.0
Bookmakers' Turnover Tax 7.8 42.4 9.5 36.4 -6.0
Gaming Machine Turnover Tax 163.5 180.5 75.1 171.0 -9.5
Departure Tax 4.4 11.3 5.6 11.3 0.0
Motor Vehicle Registration 6.2 6.2 2.5 6.2 0.0
Commercial Vehicle Licenses 0.5 1.0 0.4 1.0 0.0
Other taxes on use of goods and on permission to use goods or perform activities
0.8 0.8 0.3 0.8 0.0
Other taxes on goods and services 3.1 0.9 2.2 0.9 0.0 Source: Department of Treasury *GST represents the total of collections by Provinces, PNG Ports and less Refunds.
Excise Duty is anticipated to be in line with the 2017 Budget estimate of K691.1 million. Collections in the first half of the year amounted to K298.5 million or 43.0 per cent against the 2017 Budget estimate. Collections are expected to improve with activities expected to pick up in the second half of the year. Measures being undertaken by the Interagency Taskforce to address illicit trade and compliance issues are expected to support collections in the second half of the year. Import Excise is also expected to be in line with the 2017 Budget estimate of K300.3 million. Collections in the first half of the year amounted to K142.1 million or 47.0 per cent against the 2017 Budget estimate. Import Excise is expected to gain support from the newly commissioned (CEF) at Motukea, Port Moresby. The CEF was commissioned in May 2017. Taxes on International Trade and Transactions Taxes on International Trade and Transactions are projected to increase slightly by K6.9 million relative to the 2017 Budget estimate of K559.5 million mainly from Import Duty which is expected to be higher by K8.6 million as a result of improvement in the foreign exchange market driven largely by improved commodity prices, particularly copper and oil prices, and supported by the newly commissioned CEF. Collections in the first half of the year amounted

20
to K111.3 million or 48.0 per cent against the 2017 Budget estimate. Table 7: Taxes on International Trade and Transactions 2016-2017 (Kina, million)
2016
Actual 2017
Budget June
Outturn 2017
MYEFO Budget
Variation
Taxes on Inter. Trade & Transactions
536.8 559.5 262.1 568.2 8.7
Import Duty 242.9 230.0 111.3 238.6 8.7
Other Import Taxes 0.0 2.9 0.0 2.9 0.0
Export Tax 294 326.6 150.8 326.6 0.0
Source: Department of Treasury
Export Tax is expected to be in line with the 2017 Budget estimate of K326.6 million. Collections amounted to K150.8 million or 46.0 per cent against the Budget estimate in the first half of 2017. GRANTS Donor Grants for 2017 is estimated at Budget K968.1 million. In the first half of the year, a total of K387.2 million was expended. Donor Grants are subject to exchange rate fluctuations, nevertheless, the projection is maintained as at 2017 Budget. Table 8: Grants – 2016-2017 (Kina, million)
2016
Actual 2017
Budget June
Outturn 2017
MYEFO Budget
Variation
GRANTS 1,430.0 968.1 387.2 968.1 0.0
From Foreign Governments (Donors) 1,261.3 830.0 0.0 0.0 0.0
Current 1,207.1 0.0 0.0 0.0 0.0
Cash 0.0 0.0 0.0 0.0 0.0
In-Kind 0.0 0.0 0.0 0.0 0.0
Capital 54.3 830.0 332.0 830.0 0.0
Cash 0.0 830.0 332.0 830.0 0.0
In-Kind 54.3 0.0 0.0 0.0 0.0
From Inter. Organizations (Donors) 168.7 138.0 55.2 138.0 0.0
Current 147.0 0.0 0.0 0.0 0.0
Cash 0.0 0.0 0.0 0.0 0.0
In-Kind 147.0 0.0 0.0 0.0 0.0
Capital 21.7 138.1 55.2 138.1 0.0
Cash 21.7 138.1 55.2 138.1 0.0
In-Kind 0.0 0.0 0.0 0.0 0.0 Source: Department of Treasury
OTHER REVENUE Other Revenue at Budget was estimated at K1,346.9 million, comprising of Property Income (K1,130.1 million), Sales of Goods and Services (K115.2 million), Fines, Penalties and Forfeits (K0.8 million) and Transfers Not Elsewhere Classified (K100.8 million). The Property Income of K1,130.1 million, includes dividends from State Authorities comprising of National Fisheries Authority (K150.0 million), National Gaming Board (K75.0 million), Motor Vehicle Insurance (K25.0 million), Bank of Papua New Guinea (K150.0 million), dividends from State Owned Enterprises (SOEs) through Kumul Consolidated Holdings Ltd (K100.0 million), Kumul Petroleum Holding Limited (K300.0 million), Ok Tedi (K200.0 million), Other dividends of K75.0 million, Interest (K4.0 million) and Rent (K51.1 million).

21
The Total Dividend of K1,075.0 million is anticipated to be lower by K225.0 million to K850.0 million. This reflects lower than anticipated receipts mainly from KPHL. Consultations with the relevant entities are ongoing to ensure the revised dividend payments are collected over the remaining part of the year. Sales of Goods and Services mainly Departmental Fees and Charges are expected to be in line with the Budget including Fines and Penalties and Transfers not elsewhere classified. Table 9: Other Revenue – 2016-2017 (Kina, million)
Source: Department of Treasury
1.4 REVENUE MEASURES UPDATE In the 2017 National Budget, eleven (11) major taxation measures including minor technical measures were implemented largely consistent with the recommendations of the 2015 Tax Review. This was part of the Governments on-going effort to modernise and develop an efficient tax system that is able to support PNG’s economic and social development objectives. The measures focused on increasing revenue, improve compliance, encouraging spending in productive areas and making taxation treatment simple and efficient. The minor taxation measures were implemented to improve compliance and administration. Some of the tax policy measures were expected to raise K200.0 million to support the 2017 Budget. These measures were implemented and the expected revenues are on track to be achieved.
1.5 EXPENDITURE AND NET LENDING The Total Expenditure and Net Lending is projected to increase to K13,779.6 million, K430.1 million higher than the 2017 Budget estimate of K13,349.5 million. Lower than expected gains from Compensation of Employees (PE) reforms and under budgeting are contributing to the projected increase of K430.1 million. For the purpose of MYEFO, it is projected that all the other expenditure items will be in line with the appropriation
2016
Actual
2017
Budget
June
Outturn
2017
MYEFO
Budget
Variation
OTHER REVENUE 633.9 1,346.90 43.2 1,121.80 -225.1
Property Income 551.3 1,130.10 9.7 905.1 -225.0
Interest 0.0 4.0 0.0 4.0 0.0
Dividends 528.9 1,075.00 0.0 850 -225.0
Mining Petroleum and Gas Dividends 300.5 500 0.0 350 -150.0
Dividends from Statutory Authorities 225 375 0.0 375 0.0
Shares in Private Enterprise 0.0 0.0 0.0 0.0 0.0
Dividends from State Owned Enterprises 0.0 125.0 0.0 125.0 0.0
Other Dividends 3.4 75.0 0.0 0.0 -75.0
Rent 22.4 51.1 9.7 51.1 0.0
Sales of goods and services 63.6 115.2 23.8 115.2 0.0
Administrative fees 28.7 62.8 7.3 62.8 0.0
Incidental sales by nonmarket establishments 34.9 52.4 16.5 52.4 0.0
Fines, penalties, and forfeits 1.8 0.8 0.8 0.8 0.0
Transfers not elsewhere classified 17.2 100.8 8.9 100.8 0.0
Current transfers not elsewhere classified 17.2 100.8 8.9 100.8 0.0
Capital transfers not elsewhere classified 0.0 0.0 0.0 0.0 0.0

22
Table 10: Total Expenditure and Net Lending 2016-2017 (Kina, million)
Source: Department of Treasury and Department of National Planning & Monitoring
Total Expenditure and Net Lending up to 30th June 2017 amounted to K5,225.8 million, which is 39.1 per cent of the Budget (Table 10). The low level of expenditure to date is largely due to:
The careful release of warrants to match anticipated revenues and financing capacity in the first half of the year. This requires prioritisation of expenditures to assist minimise pressures on the Government’s cash position and also ensures the 2017 Budget is implemented in a sustainable manner encompassing the set fiscal frameworks.
The slow implementation of development projects, which is 30.1 per cent of the 2017 Budget. Many development projects are expected to increase their rate of spending through the year once they move from the design stage to construction phase.
Table 11: Expenditure by Agency Type and Funding Source 2016-2017 (Kina, million)
Details 2016
Actual 2017
Budget June
Outturn 2017
MYEFO
National Departments 5,390.3 5,905.9 2,520.2 6,096.3 Provincial Governments 3,658.4 3,733.7 1,126.4 3,965.6 Autonomous Bougainville Government 211.0 250.9 58.0 258.7 Commercial & Statutory Authorities 624.6 655.3 250.1 655.3 Interest Payments 1,264.3 1,382.8 792.1 1,382.8 Loans 993.8 452.8 91.9 452.8 Donor Grants 1,430.0 968.1 387.2 968.1 Total Expenditure & Net Lending 13,572.4 13,349.5 5,225.8 13,779.6
Source: Department of Treasury and Department of National Planning & Monitoring
Operational Budget Expenditure The total Operational component of the 2017 Budget is K9,336.2 million (Table 10). This is projected to increase to K9,766.3 million for the 2017 MYEFO. The estimated increase is K430.1 million or 4.6 per cent and is largely attributed to Compensation of Employees (Personal emoluments) expenditure. The total Government Operational Expenditure up to 30th June 2017 was K4,380.6 million which is 32.8 per cent of the 2017 Budget. Total Goods and Services Expenditure In the first half of the year, Total Goods & Services (G&S) including grants to other general government units, other expenses and net acquisition of non-financial assets was K1,965.4 million or 31.0 per cent of the 2017 Budget appropriation.
Funding Source 2016 Actual
2017 Budget
June Outturn
2017 MYEFO
Operational Component 9,099.0 9,336.2 4,380.6 9,766.3
Capital Investment Component 4,473.4 4,013.3 845.2 4,013.3
GoPNG 2,049.6 2,592.4 366.1 2,592.4
Donor Support Grants 1,430.0 968.1 387.2 968.1
Loans 993.8 452.8 91.9 452.8
Total Expenditure & Net Lending 13,572.4 13,349.5 5,225.8 13,779.6
% of GDP 20.1% 17.8% 7.0% 18.6%

23
Priority spending over the first half of the year includes: Tuition Fee Free Education of K281.0 million or 47.0 per cent against the 2017 estimate; the 2017 National Election of K213.4 million or 53.0 per cent against the 2017 estimate; the Medical Supplies Procurement and Distribution of K73.8 million or 46.0 per cent against the 2017 estimate; the Office Rentals of K101.8 million or 80.0 per cent against the 2017 Budget estimate; and Utilities of K39.6 million or 17.9 per cent against the 2017 estimate. Over the same period, Interest payments were K792.0 million or 57.3 per cent against the 2017 Budget appropriation (Table 11). The trend from 2016 up to June outturn has indicated a lower expenditure in goods and services which offsets the increasing spending in Compensation of Employees (PE) in the same period for National Departments and Provinces. Compensation of Employees – Personnel Emolument Expenditure In the first half of the year, the Compensation of Employees (PE) expenditure was K2,101.3 million8 or 54.2 per cent against the 2017 Budget estimates (Table 12). Based on half year projections, the current trend of the Compensation of Employees expenditure is exceeding the appropriation by K263.5 million. Based on this trajectory, it is projected to exceed the 2017 appropriation by K430.1 million, which includes the 3.0 per cent salary increment, at the end of the fiscal year. The on-going overspending in the Compensation of Employees (PE) has been largely due to structural issues, including continuous under budgeting. Substantial increases are projected to come from the National Departments Salaries & Allowance, Teachers’ Salaries under Provincial Government, Retirement and Overtime as shown in the table below. Table 12: GoPNG Funding – Major Increases in Compensation of Employees
Compensation of Employees 2016
Actual 2017
Budget June
Outturn 2017
MYEFO (-) Over / (+) Under
National Depts. Salaries & Allowances 1,949.6 1,764.5 936.4 1,929.0 -164.5
Teachers Salary Grants to Prov. 1,340.9 1,108.6 655.8 1,350.9 -242.3
Retirement 441.8 358.4 221.4 442.8 -84.4
Overtime 25.7 20.3 14.4 28.9 -8.6 Source: Department of Treasury (IFMS 2161 Report)
Going forward, personal emoluments is projected to increase by K430.1 million, mainly comprise of 37.9 per cent in Salaries from National Department and 49.7 per cent in Teachers’ Salaries from Provinces. Table 13: Total Government Domestic Funding by Economic Item and Description Type 2016-2017 (Kina, million)
Economic Items 2017
Budget YTD
Warrants June
Outturn 2017
MYEFO
Compensation of Employees 3,874.6 1,303.8 2,101.3 4,304.7 Wages and Salaries [GFS] 3,516.2 1,195.1 1,854.1 3,861.8
Wages and salaries in cash 3,418.3 1,144.2 1,839.7 3,819.4 Wages and salaries in kind 97.9 50.9 25.8 42.4
Employers' social contributions 358.4 108.7 221.4 442.8
8 Note that Compensation of Employees as per the report from IFMS has reported an outcome of K2,200.3 million and was adjusted down by K98.9
million to K2,101.3 million after identifying some posting errors. especially from automated State’s 8.4% employer contribution to Nambawan Super
Limited

24
Actual social contributions (Retirement) 358.4 108.7 221.4 442.8 Use of goods and services 3,500.2 1,567.1 983.8 3,500.2
Use of goods and services 3,500.2 1,567.1 983.8 3,500.2 Grants 1,800.5 426.7 725.3 1,800.5
Grants to other general government units 1,800.5 426.7 725.3 1,800.5 Grants to other general governments current 927.4 392.2 535.8 927.4 Grants to other general governments capital 873.1 34.5 29.5 873.1
Other expenses 78.3 53.8 36.1 78.3 Transfers not elsewhere classified 78.3 53.8 36.1 78.3
Other expense - Current transfers not elsewhere classified
78.3 53.8 36.1 78.3
Net Acquisition Nonfinancial assets 812.7 459.6 220.2 812.7 Acquisition of Fixed assets (Buildings and
Structures) 812.7 459.6 220.2 812.7
Grand Total 10,066.4 3,811.0 4,064.7 10,496.4 Source: Department of Treasury (IFMS 2161 Report)
Notes Excludes Debt Service costs, Interest payment, Donor grants and Concessional Loans. *Bookmakers’ turnover tax and GST transfers to province are excluded in this table as well, due to insufficient data on how these funds are being expended at the provincial level.
Total Government funded expenditure as at June 2017 was K4,064.7 million, which is 40.4 per cent of the appropriation of K10,066.4 million. Of the K4,064.7 million, 51.7 per cent was expended on Compensation of Employees, 24.2 per cent on the Use of Goods and Services, 17.8 per cent on Grants, 5.4 per cent on Net Acquisition of Non-Financial Assets, and Other Expense by less than 0.9 per cent which are reflected in the table above. Capital Budget Expenditure Total Capital Investment Component Expenditure was K4,013.3 million at the time of the 2017 Budget (Table 10). This was revised up to K4,035.3 million with K22.0 million transferred from the Operational component. The composition of the K22.0 million is as follows; UPNG Dormitories (K5.0 million), COVEC & China Railway outstanding payment (K10.0 million), Ganim High School (K2.0 million), Mendi Quarry Development (K1.5 million), Chuave District Feeder Road (K0.5 million), Angoram Highway Construction (K0.5 million) and Aitape-Lumi Road Construction (K2.5 million). Total Expenditure to date under the Capital Investment component in 2017 is K845.2 million (Table 10), which includes domestically funded expenditures, Project Support Grants and expenditures under Loans by Development Partners. External Concessional Loan Funded Expenditure: Disbursement of domestic funding in the Capital Investment component has been low this year 2017. To date, warrants released are 29.3 per cent of the revised Budget, whereas in 2016, this figure was 28.5 per cent. However, at this time in 2014 and 2015, this figure was higher at 58.0 per cent and 43.0 per cent respectively. For the Loan disbursement/drawdowns appropriation of K452.8 million for this year, a total of K91.9 million or 20.1 per cent have been drawn down to date. Donor Project Expenditure To date, K387.2 million or 40.0 per cent have been expended out of the K968.1 million appropriated in the 2017 Budget for donor project grants. Not all donors have reported on their

25
actual expenditure to date, so these figures are likely to be underestimated. A complete donor grant financing report will be available later in the year because some donors have a different Financial Year.
1.6 STATUS OF TRUST ACCOUNTS A total of K11,756.7 million, up to and including the 2017 Budget appropriations has been appropriated to Budget Funded Trust Accounts since 2005 for implementation of priority budget expenditure programs. These trust accounts have largely been funded from additional mineral revenue in previous Supplementary Budgets and recent Supplementary and Annual Budgets. The purpose of holding funds in the Trust Account is to spread spending over time to help manage inflationary pressures in the economy and to give time to agencies to properly plan and implement projects. Table 13 shows the movements of funds for these trust accounts for the period 1st January to 30th June 2017. Table 13: Movement of Funds in Budget Funded Trust Accounts from 1st January to
30th June 2017 (Kina, million)
Description
Balance as at 1-Jan-17
Debit (Receipt)
Credit (Payment)
Balance as at 30-June-2017
Outstanding Special Support Grants 0.1 0.0 0.0 0.1
Education Sector Infrastructure Rehabilitation 0.0 0.0 0.0 0.0
Higher Education Sector Infrastructure Rehabilitation
16.1 0.0 2.5 13.6
National Parliament Infrastructure Rehabilitation 0.0 0.0 0.0 0.0
Transport Sector Infrastructure Rehabilitation 0.0 0.0 0.0 0.0
Resettlement of Rabaul Volcano Victims 0.2 0.0 0.0 0.2
Hospital and Healthcare Centre Rehabilitation 2.5 0.0 0.0 2.5
Rehabilitation of Housing for Nurses 0.0 0.0 0.0 0.0
Rehabilitation of Housing for Police 0.0 0.0 0.0 0.0
Highlands Highway Rehabilitation 0.0 0.0 0.0 0.0
District Services Improvement Program 0.0 0.0 0.0 0.0
Urbanisation Pilot 0.0 0.0 0.0 0.0
Housing Development Pilot 0.0 0.0 0.0 0.0
Lae City Roads Rehabilitation 2.1 0.0 0.0 2.1
Madang Marine Park Development 3.0 0.0 0.6 2.4
Konebada Petroleum Park 0.0 0.0 0.0 0.0
Central City 26.7 0.0 0.0 26.7
Petroleum Outstanding Commitments 0.0 0.0 0.0 0.0
Infrastructure Development Grants 50.5 0.0 0.0 50.5
Coastal Vessels 0.1 0.0 0.0 0.1
PNG LNG High Impact Infrastructure 0.7 0.0 0.0 0.7
Port Moresby Roads 0.4 0.0 0.0 0.4
District Offices Rehabilitation 0.0 0.0 0.0 0.0
Rural District Roads Support 2.1 0.0 0.0 2.1
Mining Legal Costs 0.1 0.0 0.0 0.1
Variarata National Park Rehabilitation 0.0 0.0 0.0 0.0
REDD Program 0.0 0.0 0.0 0.0
Provincial Government Members entitlement 0.0 0.0 0.0 0.0
Outstanding MOA Liabilities 0.0 0.0 0.0 0.0
Kokopau to Arawa Road Upgrading 0.0 0.0 0.0 0.0
Coastal Fisheries Development Program 0.0 0.0 0.0 0.0
National High School Renovation and Upgrading 0.0 0.0 0.0 0.0
Trans East-West New Britain Highway 0.1 0.0 0.0 0.1
Central Malalaua Highway 0.0 0.0 0.0 0.0
Tuition Fee Free Education 4.1 281.0 252.4 32.7

26
Description
Balance as at 1-Jan-17
Debit (Receipt)
Credit (Payment)
Balance as at 30-June-2017
2015 Pacific Games 0.1 0.0 0.0 0.1
Port Moresby General Hospital Infrastructure and Improvement
0.0 0.0 0.0 0.0
Defence Barracks Maintenance and Improvement
0.0 0.0 0.0 0.0
LNG Project Development Cost 0.3 1.5 0.0 1.8
2010 National Census 0.0 0.0 0.0 0.0
PNG LNG Additional Equity 0.7 0.0 0.0 0.7
Public Service Audit Program 0.1 0.0 0.0 0.1
Regional, Provincial Treasury and District Admin Office
0.0 0.0 0.0 0.0
PNG Fire Service Infrastructure Rehabilitation 0.3 0.0 0.3 0.0
Restoration and Development Grant (ABG) 6.1 15.0 19.5 1.6
Trade Skills Scholarships 9.2 0.0 9.0 0.2
Rural Airstrip Rehabilitation & Maintenance Program
0.0 0.0 0.0 0.0
Special Intervention Fund (ABG) 0.0 10.9 4.4 6.5
2017 National Elections 43.3 155.6 183.3 15.6
TOTAL 168.9 464.0 472.0 160.9
Source: Department of Finance.
Note: The opening balances for the Urbanization Pilots, Transport Sector Infrastructure Rehabilitation and District Services Improvement Program Accounts have been adjusted to reflect all their subsidiary accounts.
The opening balance of the Budget Funded Trust Accounts as at 1stJanuary 2017 was K168.9 million. Expenditure incurred in this period totalled K472.0 million with K464.0 million as receipts within the same period and the closing balance at 30th June 2017 was K160.9 million. As at the reporting date, the Trust appropriations for the 2017 Budget cannot be highlighted as all these funds were and could still be issued directly to the department and agencies concerned. The K133.0 million for 2017 National Elections and K321.0 million for Tuition Fee Free (TFF) are yet to be raised for Trust Accounts. The remaining funds will be released into the following Trust Accounts:
TFF – K321.0 million
2017 National Elections – K133.0 million Following is a summary of expenditure above K5.0 million from Budget Funded Trust Accounts for the period 1st January to 30th June 2017:
K252.4 million was transferred from the TFF Trust Account for tuition fees paid for children all across Papua New Guinea schools under the Tuition Fee Free Education Policy.
K183.3 million was transferred from the 2017 National General Election - Finance Procurement, Personnel and Logistics Trust Account for the purpose of the 2017 National election.
K19.5 million was transferred from the Restoration and Development Grant (ABG) Trust Account for Restoration and Development impact projects across Bougainville.
K9.0 million was transferred from the Trade Skills Scholarship Trust Account for Technical and Vocational Educational Training (TVET) program.
District Services Improvement Program (DSIP) Trust Accounts DSIP Trust Accounts were designed to fund priority expenditure programs in the districts. A total of K1,602.0 million has been paid into the DSIP Trust Account over the period 2006 up
27
to and including 30th June 2012. However, the DSIP Trust was revoked between May and June 2016 and all the bank accounts were also closed as a result. As at the 30th June 2016, the remaining total balance of all the DSIP trust accounts was K18.3 million. All these funds were all transferred to their respective DSIP Operating in August 2016. The subsidiary DSIP Trust Accounts for the 89 districts is zero given that they have all been closed.
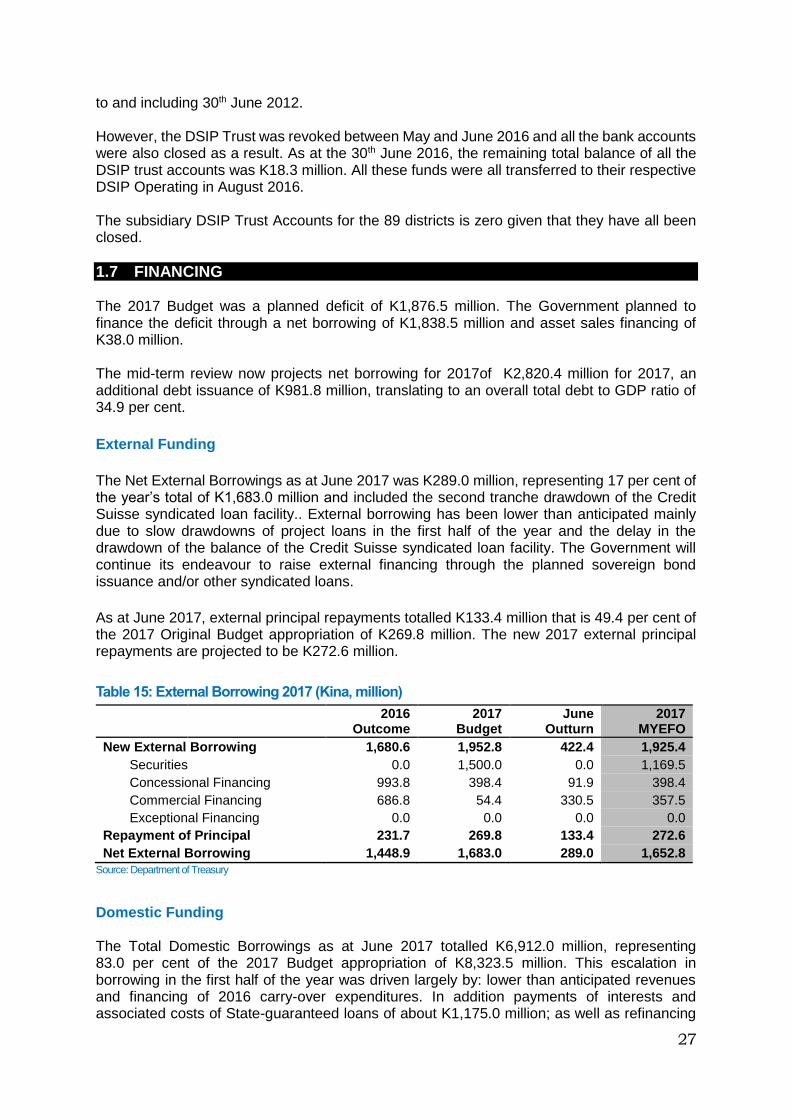
1.7 FINANCING The 2017 Budget was a planned deficit of K1,876.5 million. The Government planned to finance the deficit through a net borrowing of K1,838.5 million and asset sales financing of K38.0 million. The mid-term review now projects net borrowing for 2017of K2,820.4 million for 2017, an additional debt issuance of K981.8 million, translating to an overall total debt to GDP ratio of 34.9 per cent.
External Funding
The Net External Borrowings as at June 2017 was K289.0 million, representing 17 per cent of the year’s total of K1,683.0 million and included the second tranche drawdown of the Credit Suisse syndicated loan facility.. External borrowing has been lower than anticipated mainly due to slow drawdowns of project loans in the first half of the year and the delay in the drawdown of the balance of the Credit Suisse syndicated loan facility. The Government will continue its endeavour to raise external financing through the planned sovereign bond issuance and/or other syndicated loans.
As at June 2017, external principal repayments totalled K133.4 million that is 49.4 per cent of the 2017 Original Budget appropriation of K269.8 million. The new 2017 external principal repayments are projected to be K272.6 million.
Table 15: External Borrowing 2017 (Kina, million)
2016
Outcome 2017
Budget June
Outturn 2017
MYEFO
New External Borrowing 1,680.6 1,952.8 422.4 1,925.4
Securities 0.0 1,500.0 0.0 1,169.5
Concessional Financing 993.8 398.4 91.9 398.4
Commercial Financing 686.8 54.4 330.5 357.5
Exceptional Financing 0.0 0.0 0.0 0.0
Repayment of Principal 231.7 269.8 133.4 272.6
Net External Borrowing 1,448.9 1,683.0 289.0 1,652.8
Source: Department of Treasury
Domestic Funding The Total Domestic Borrowings as at June 2017 totalled K6,912.0 million, representing 83.0 per cent of the 2017 Budget appropriation of K8,323.5 million. This escalation in borrowing in the first half of the year was driven largely by: lower than anticipated revenues and financing of 2016 carry-over expenditures. In addition payments of interests and associated costs of State-guaranteed loans of about K1,175.0 million; as well as refinancing

28
of short-term maturing securities (Treasury Bills). The new Domestic Borrowing for 2017 is expected to increase to K12,536.2 million. This represents about 51.0 per cent increase from the budget estimate of K8,323.5 million. With the projected deficit of K2,820.4 million, interest expense is also projected to increase from K1,316.9 million to K1,530.6 million. This is an increase of K213.6 million which is about 16.0 per cent from the 2017 debt service budget appropriation. This increase for domestic borrowing will place additional pressure on the Government given the current saturated domestic financial market. The domestic principal repayments as at end June 2017 totalled K6,255.6 million. This reflects 76.6 per cent of the original appropriation of K8,167.8 million utilised. Out of this total principal repayments, Treasury Bills comprised 89.1 per cent which is mostly frequent refinancing and roll-over of short-term Treasury Bills. Included also is the K165.2 million from the Credit Suisse syndicate loan used to restructure the domestic debt portfolio by early repaying large maturity peak in Treasury Bills maturities to smooth out the Government’s domestic debt repayment and maturity profile. As the appetite for shorter termed Government securities increased, the Government responded to investors’ appetite by increasing issuance of shorter termed Treasury Bills such as the 91 days and 63 days bills compared to the usual 182 days and 364 days bills. In addition, a new line was introduced in the second quarter for the nine months paper (273 days) to allow for flexibility and more options for investors to meet their investment requirement(s). With the increase in shorter-end issuances, frequent refinancing of these short-termed securities on the other hand led to an accelerated increase in domestic principal repayments. While on the longer termed Government securities (Treasury Bonds or Inscribed Stock) the demand in general has decline on its longer end (10 and 12 years Treasury Bonds) and maintaining steady demand on its shorter end (3 years and 5 years). In general demand for Government securities has been geared towards short term debt instruments (1 year or less to 5 years) for the first six months of 2017. While the Government endeavours to meet its obligations, it is also very mindful of its refinancing and liquidity risks. It plans to ensure that its domestic debt maturity profile smoothens out to match its market size. This is a strategy that requires maintaining of effective communication with its investors on issuance plans and maturities.
Table 16: Domestic Borrowing 2017 (Kina, million)
2016
Outcome 2017
Budget June
Outturn 2017
MYEFO
New Domestic Borrowing 14,117.7 8,323.5 6,912.0 12,536.2 Treasury Bills Financing 13,092.9 7,423.5 6,242.3 11,636.2 Inscribed Stocks Financing 1,024.8 900.0 669.7 900.0 Loans 0.0 0.0 0.0 0.0
Repayment of Principal 11,622.8 8,167.8 6,255.6 11,529.1
Treasury Bills Maturities 11,158.8 7,485.5 5,573.2 10,846.8 Inscribed Stocks Maturities 464.0 682.3 682.3 682.3 Loans 0.0 0.0 0.0 0.0
Net Domestic Borrowing 2,494.9 155.7 656.4 1,007.0
Source: Department of Treasury

29
2017 Net Financing
As at June 2017, Total Net Borrowing was K1,106.0 million, comprising K656.4 million in net domestic borrowing, K289.0 million in net external borrowing and K160.6 million parity changes incurred from exchange rate movements. The 2017 Net External Borrowing is projected to be lower at K1,652.8 million from the Budget estimate of K1,683.0 million while Net Domestic Borrowing is expected to increase to K1,007.0 million from the Budget estimate of K155.6 million. Total Net Borrowing is projected to increase to K2,820.4 million at the end of 2017.
Table 17: Summary of Net Borrowings 2017
FINANCING 2016
Outcome 2017
Budget June
Outturn 2017
MYEFO
Net Domestic Borrowing 2,494.9 155.7 656.4 1,007.0 Net External Borrowing 1,448.9 1,683.0 289.0 1,652.8
Parity Change* 0.0 0.0 160.6 160.6 Total Net Borrowing 3,943.9 1,838.7 1,106.0 2,820.4
Deficit 3,943.9 1,838.7 1,106.0 2,820.4 Change in WPA Balance (Cash on hand used) 0.0 0.0 0.0 0.0
Source: Department of Treasury
* Parity refers to the effect of exchange rate movements between the currencies of two countries making the purchasing power
of both currencies equal. The gains and losses add to or reduce the stock of debt.
1.8 PUBLIC DEBT
Total Public Debt Outstanding is projected to increase to K25,939.4 million, an increase of K4,316.1 million from the 2017 Budget estimate of K21,623.3 million. The increase in the debt levels is due to rolling over of Government Treasury Bills and marginal increase in Treasury Bills financing in 2017. Also captured in the Total Public Debt Stock Outstanding are the State-guaranteed loans now being serviced by the State. Table 18: Central Government Debt 2017 (Kina, million)
2016
Outcome
2017
Budget
June
Outturn
2017
MYEFO
Domestic 16,437 13,525 18,268.3 18,618.9
Treasury Bills 8,664 5,659 9,332.6 9,452.9
Inscribed Stock 7,773 7,866 7,760.8 7,991.1
Loans 0.0 0.0 1,175.0 1,175.0
Domestic Debt as % GDP 24.3% 18.1% 25% 25.1%
External 5,507 8,098 5,956.7 7,320.5
International Agencies (Concessional) 4,820 4,735 4,702.9 4,891.3
Commercial Loans 687 1,710 1,042.8 1,069.8
Extraordinary 0.0 153 210.9 189.9
Securities 0.0 1,500 0.0 1,169.5
External Debt as % GDP 8.1% 10.9% 8.0% 9.9%
Total Public Debt Outstanding 21,944 21,623* 24,225.0 25,939.4
As % GDP 32.4% 29.0% 32.6% 34.9%
Source: Department of Treasury
*Taking into account the 2016 FBO Debt Stock, the 2017 Debt Stock as budgeted will have been K23,820.5 million.

30
One measure of debt sustainability is the debt to GDP ratio. According to the FRA, the debt ratio limit is 30.0 per cent of GDP. The updated MYEFO estimate is projected to be 34.9 per cent of GDP, which is 4.9 percentage points above the legislated limit. As in the previous year, the escalated financing task in 2017 has resulted in a large accumulation of Treasury Bills (short-term debt) in the debt portfolio. Given that debt to GDP ratio is above the sustainable limit, the Government is committed to ensuring that its spending on budgeted expenditures are prioritised and adjusted and that it refrains from off budget expenditures. This is particularly in relation to its debt position and the financial risks that it faces, predominantly with its current revenue and expenditure trajectories. The exponential growth in Treasury Bills in the domestic debt portfolio materialises the risk of refinancing for the Government.
Consistent with the Medium Term Debt Strategy (MTDS), the Government plans to continue its effort to restructure its domestic debt portfolio in consultation with domestic Investors by retiring portion of its short-term debt (Treasury Bills). This will assist the Government in reducing its refinancing risk. The financing of this domestic debt restructure will be made available through the external sources of funding such as the proceeds from Sovereign Bond Issuance or any syndicated loans. The restructuring of the domestic debt portfolio is expected to happen towards the second half of 2017. However, this exercise depends entirely on securing full external financing as planned in the 2017 Budget as well as improvements in internal revenue collections. In the likely event that revenue falls, a reduction in expenditure through a Supplementary Budget is required of the Government to keep debt within legal limits and consistent with the MTDS.
1.9 RISKS TO THE MID-YEAR ECONOMIC AND FISCAL OUTLOOK Although the global economy has improved, inherent uncertainties in this recovery climate and still will pose a risk for the PNG economy, particularly if commodity prices remain below current levels. The Government will be possibly instituting a Medium Term Revenue Strategy to further bolster the new Medium Term Fiscal Strategy but it will need to cognisant that these measures will take effect in the medium term. Unbudgeted approval of tax exemptions will increase the fragility of the State’s tax collection results thus far. On the expenditure side, the Government must pursue its public sector reform agenda to address the issues of Personal Emoluments blow outs, duplication of roles of Departments, Agencies and Offices and general Budget Discipline in the cost, efficiency and productivity of the public service delivery. Measures identified in the 2017 Budget to address these structural impediments are well underway but significant results are only expected in the medium term. The 2016 Final Budget Overcome (FBO), confirmed these significant structural issues associated with PE, with a recorded overrun of K471.0 million. The domestic and external financing pressures are growing with the MYEFO projections. Government will need to consider a Supplementary Budget to identify the unrealisable revenue in the 2017 Budget and to adjust the expenditure envelope accordingly This will ease the financing pressure.

31
In relation to Monetary Policy, despite an improvement, the foreign exchange imbalance continues to impede economic activity and the inflation outlook. And whilst we are through the most recent spell of the El Nino phenomenon, it is anticipated that this may reoccur in the medium term. Key mines and agriculture production have been slow to recover and so economic strategy will need to include the safeguards for natural phenomena. To mitigate these risks and ensure macroeconomic stability, Government will continue to carefully monitor economic developments affecting our revenue streams, and take, if required, the necessary steps, including a Supplementary Budget to ease the financing pressures; while ensuring the delivery of key services.
1.10 2017 AND BEYOND The revised economic and fiscal forecasts for 2017 and the assumptions that underlie them will impact on 2017 and beyond. These forecasts will be updated in the 2018 Budget.

32
1.11 FISCAL OUTTURN TABLES
TABLE 1(I): CENTRAL GOVERNMENT REVENUE ECONOMIC CLASSIFICATION (Kina, million)
2016
Actual
2017
Budget
June
Outturn
2017
MYEFO Variation
REVENUE1 10,485.5 11,473.2 4,441.4 10,959.2 -514.0
TAXES 8,421.6 9,158.2 4,011.1 8,869.3 -288.9
Taxes on Income, Profits and Capital Gains 5,286.2 5,818.8 2,318.8 5,534.7 -284.1
Payable by individuals 2,844.3 3,035.7 1,498.2 3,035.7 0.0
Personal Income Tax 2,844.3 3,035.7 1,498.2 3,035.7 0.0
Payable by corporations and other enterprises 2,230.1 2,565.9 706.6 2,267.2 -298.7
Company Tax 2,093.8 2,433.9 647.5 2,143.6 -290.3
Mining and Petroleum Taxes 92.0 77.1 41.7 77.1 0.0
Royalties Tax 26.6 44.0 10.4 27.3 -16.7
Management Tax 17.7 10.9 6.9 19.2 8.3
Other taxes on income, profits and capital gains 211.8 217.1 114.0 231.8 14.7
Dividend Withholding Tax Non Mining 132.6 138.8 70.1 146.3 7.5
Interest Withholding Tax 78.7 77.8 43.8 85.0 7.2
Sundry IRC Taxes & Income 0.5 0.5 0.1 0.5 0.0
Taxes on Payroll and Workforce 14.4 17.6 5.6 11.7 -5.9
Training Levy 14.4 17.6 5.6 11.7 -5.9
Taxes on Goods and Services 2,584.1 2,762.2 1,424.6 2,754.6 -7.6
General taxes on goods and services 1,521.8 1,527.7 888.4 1,535.6 7.9
Value Added Tax 1,442.6 1,484.7 864.1 1,484.7 0.0
GST2 1,442.6 1,484.7 864.1 1,484.7 0.0
Taxes on financial and capital transactions 79.2 42.9 24.3 50.9 -28.3
Stamp Duties 79.2 42.9 24.3 50.9 8.0
Excise 875.9 991.4 440.7 991.4 115.5
Excise Duty 603.7 691.1 298.5 691.1 0.0
Import Excise 272.2 300.3 142.1 300.3 0.0
Taxes on specific services 175.7 234.2 90.2 218.7 -15.5
Bookmakers' Turnover Tax 7.8 42.4 9.5 36.4 -6.0
Gaming Machine Turnover Tax 163.5 180.5 75.1 171.0 -9.5
Departure Tax 4.4 11.3 5.6 11.3 0.0
Taxes on use of goods and on permission to use goods or perform activities 7.5 8.0 3.1 8.0 0.0
Motor vehicles taxes 6.8 7.2 2.9 7.2 0.0
Other taxes on use of goods and on permission to use goods or perform activities 0.8 0.8 0.3 0.8 0.0
Other taxes on goods and services 3.1 0.9 2.2 0.9 0.0
Sundry Taxes (Customs) 3.1 0.9 2.2 0.9 0.0
Taxes on International Trade and Transactions 536.8 559.5 262.1 568.2 8.7
Customs and other import duties 242.9 232.9 111.3 241.6 8.7
Import Duty 242.9 230.0 111.3 238.6 8.6
Other Import Taxes - 2.9 - 2.9 0.0
Taxes on exports 294.0 326.6 150.8 326.6 0.0
Export Tax 294.0 326.6 150.8 326.6 0.0
0.0
GRANTS 1,430.0 968.1 387.2 968.1 0.0
From Foreign Governments - 830.0 332.0 830.0 0.0
Current - - - - 0.0
Cash - - - - 0.0
In-Kind - - - - 0.0
Capital - 830.0 332.0 830.0 0.0
Cash - 830.0 332.0 830.0 0.0
In-Kind - - - - 0.0
From International Organizations - 138.1 55.2 138.1 0.0
Current - - - - 0.0
Cash - - - - 0.0
In-Kind - - - - 0.0
Capital - 138.1 55.2 138.1 0.0
Cash - 138.1 55.2 138.1 0.0
In-Kind - - - - 0.0
0.0
OTHER REVENUE 633.9 1,346.9 43.1 1,121.9 -225.0
Property Income 551.3 1,130.1 9.7 905.1 -225.0
Interest - 4.0 - 4.0 0.0
Interest from residents other than general government - 4.0 - 4.0 0.0
Dividends 528.9 1,075.0 - 850.0 -225.0
Mining Petroleum and Gas Dividends 300.5 500.0 - 350.0 -150.0
Dividends from Statutory Authorites 228.4 375.0 - 375.0 0.0
Dividends from State Ow ned Enterprises - 125.0 - 125.0 0.0
Other Dividends - 75.0 - - -75.0
Rent 22.4 51.1 9.7 51.1 0.0
Sales of goods and services 63.5 115.2 23.8 115.2 0.0
Administrative fees 28.7 62.8 7.3 62.8 0.0
Incidental sales by nonmarket establishments 34.9 52.4 16.5 52.4 0.0
Fines, penalties, and forfeits 1.8 0.8 0.8 0.8 0.0
Transfers not elsewhere classified 17.2 100.8 8.9 100.8 0.0
Current transfers not elsewhere classified 17.2 100.8 8.9 100.8 0.0
Subsidies - - - - 0.0
Other current transfers 17.2 100.8 8.9 100.8 0.0
Capital transfers not elsewhere classified - - - - 0.0
Premiums, fees and claims related to nonlife insurance and standardised guarantee schemes - - - - 0.0
Source: Department of Treasury
1. Under the GFS 2014 methodology, non-paybale infrastructure tax credits, revenue on asset sales and GST transfers to WPA and Trust Accounts are excluded.
2. GST represents the total of collections by Provinces, PNG Ports and less Refunds.

33
TABLE 1 (II): CENTRAL GOVERNMENT REVENUE AND GRANTS 1986 GFS CLASSIFICATION (Kina, million)
2016 2017 June % of 2017
Actual Budget Outurn Budget MYEFO
TAX REVENUE 8,060.9 8,686.8 3,999.3 46% 8,398.0
TAX ON INCOME AND PROFITS 5,555.6 6,099.9 2,438.9 40% 5,802.5
Personal Income Tax 2,844.3 3,035.7 1,498.2 49% 3,035.7
Company tax 2,093.8 2,433.9 647.5 27% 2,143.6
DWT 132.6 138.8 70.1 51% 146.3
Mining and Petroleum Taxes 92.0 77.1 41.7 54% 77.1
Interest w ithholding tax 78.7 77.8 43.8 56% 85.0
Other Direct 150.7 156.1 62.5 40% 143.8
Gaming Tax 163.5 180.5 75.1 42% 171.0
DOM. TAXES ON GOODS AND SERVICES 1,696.3 1,730.0 1,156.2 67% 1,730.0
Excise 603.7 691.1 298.5 43% 691.1
GST 1,089.5 1,035.1 855.4 83% 1,035.0
Other Indirect 3.1 3.8 2.2 3.8
TAXES ON INTERNATIONAL TRADE 809.0 856.9 404.3 47% 865.6
Import Duty 242.9 230.0 111.3 48% 238.6
Export Duty 294.0 326.6 150.8 46% 326.6
Excise Duty on Imports 272.2 300.3 142.1 47% 300.3
NON TAX REVENUE 815.5 1,433.9 53.4 4% 1208.8
PROPERTY INCOME 528.9 1,152.2 0.0 0% 927.1
Dividends 228.4 500.0 0.0 0% 500.0
Mining and Petroleum Dividends 300.5 500.0 0.0 0% 350.0
Other 0.0 75.0 0.0 0% 0.0
SWF Transfer 0.0 77.2 0.0 0% 77.1
INTEREST AND FEES FROM LENDING 0.0 4.0 0.0 0% 4.0
OTHER NON TAX REVENUE 286.6 277.7 53.4 19% 277.7
INJECTIONS FROM TRUST ACCOUNTS 0.0 0.0 0.0 0% 0.0
ASSET SALES 0.0 0.0 0.0 0% 0.0
TOTAL REVENUE 8,876.4 10,120.7 4,052.7 40% 9,606.9
% of GDP
GRANTS 1430.0 968.1 387.2 40% 968.1
Budgetary Support 0.0 0.0 0.0
Project Support Grants 1430.0 968.1 387.2 40% 968.1
TOTAL REVENUE AND GRANTS 10,306.4 11,088.8 4,439.9 40% 10,575.0
% of GDP
Source: Department of Treasury.

34
TABLE 2: CENTRAL GOVERNMENT EXPENDITURE AND NET LENDING (Kina, million)
Source: Department of Treasury.
* Includes GST and Bookmakers Tax transfers to Provinces.
2016
Actuals
2017
Budget
June
Outturn
2017
MYEFO
National Departments 5,390.3 5,906.5 2,520.2 6,096.3
Compensation of Employees 2,394.5 2,072.9 1,143.5 2,262.7
Wages and salaries 1,980.1 1,729.8 931.8 1,919.6
Employers' social contributions 414.4 343.1 211.7 343.1
Actual social contributions 414.4 343.1 211.7 423.7
Use of goods and services 1,746.2 2,482.9 895.0 2,482.9
Grants 610.7 692.8 295.1 692.8
Grants to other general government units 610.7 692.8 295.1 692.8
Grants to other general governments current 610.7 692.8 295.1 692.8
Other expenses 79.2 62.5 30.2 62.5
Net Aquisition Nonfinancial assets 554.8 595.4 156.3 595.4
Aquisition of Fixed assets (Buildings and Structures) 554.8 595.4 156.3 595.4
Out of scope for GFS coding purposes 5.0 0.0 0.0 0.0
Provincial Governments 3,658.4 3,725.3 1,126.4 3,965.6
Compensation of Employees 1,641.7 1,411.2 789.9 1,651.5
Wages and salaries 1,641.7 1,411.2 787.0 1,645.6
Employers' social contributions 0.0 0.0 2.9 5.9
Actual social contributions 0.0 0.0 2.9 0.0
Use of goods and services 809.7 818.9 36.6 818.9
Interest 0.0 100.0 77.4 100.0
Grants 1,184.0 1,340.3 218.0 1,340.3
Grants to other general government units 1,184.0 1,340.3 218.0 1,340.3
Grants to other general governments current 468.9 574.3 200.0 574.3
Grants to other general governments capital 715.1 766.1 18.0 766.1
Net Aquisition Nonfinancial assets 23.0 55.0 4.5 55.0
Aquisition of Fixed assets (Buildings and Structures) 23.0 55.0 4.5 55.0
NFA:Fixed assets 23.0 55.0 4.5 55.0
Autonomous Bougainville Government 211.0 248.5 58.0 248.5
Compensation of Employees 113.9 106.0 46.5 106.0
Wages and salaries 113.9 106.0 46.1 106.0
Employers' social contributions 0.0 0.0 0.3 0.7
Actual social contributions 0.0 0.0 0.3 0.0
Use of goods and services 24.8 24.8 0.0 24.8
Grants 72.3 117.7 11.5 117.7
Grants to other general government units 72.3 117.7 11.5 117.7
Commercial & Statutory Authorities 624.6 665.6 250.1 665.6
Compensation of Employees 313.2 281.4 121.4 281.4
Wages and salaries 285.9 266.1 115.0 266.1
Employers' social contributions 27.3 15.3 6.4 15.3
Actual social contributions 27.3 15.3 6.4 15.3
Use of goods and services 185.0 173.6 52.3 173.6
Grants 18.2 32.8 11.2 32.8
Other expenses 8.0 15.8 5.8 15.8
Net Aquisition Nonfinancial assets 100.2 162.1 59.4 162.1
Aquisition of Fixed assets (Buildings and Structures) 100.2 162.1 59.4 162.1
Debt Service 1,264.3 1,382.8 792.1 1,382.8
Use of goods and services 16.2 17.2 38.2 17.2
Use of goods and services 16.2 17.2 38.2 17.2
Use of goods and services 16.2 17.2 38.2 17.2
Interest 1,248.1 1,365.6 753.9 1,365.6
To nonresidents 1,171.1 167.9 67.4 167.9
Interest to Non residents 1,171.1 167.9 67.4 167.9
To residents other than general government 77.0 1,197.8 686.5 1,197.8
Interest to residents other than general governments 77.0 1,197.8 686.5 1,197.8
Donor Support Grants 1,430.1 968.1 387.2 968.1
Loans 993.8 452.8 91.9 452.8
Total Expenditure and Net Lending 13,572.5 13,349.5 5,225.9 13,779.6
as % of GDP 20.0% 17.9% 7.0% 18.5%

35
TABLE 3 (I): TRANSACTIONS IN ASSETS AND LIABILITIES FOR CENTRAL GOVERNMENT (Kina, million)
2016
Outcome
2017
Budget
June
Outturn
2017
MYEFO
0.0 -1,937.4 0.0 0.0
0.0 -1,937.4 0.0 0.0
0.0 -1,873.6 0.0 0.0
0.0 -63.8 0.0 0.0
0.0 0.0 0.0 0.0
3,943.8 1,838.6 1,106.0 1,668.3
2,494.9 155.6 656.4 580.9
2,494.9 155.6 656.4 580.9
14,117.7 8,323.5 6,912.0 8,763.2
11,622.8 8,167.9 -6,255.6 8,182.3
1,934.1 -62.1 11,815.5 -136.8
13,092.9 7,423.5 6,242.3 7,363.2
11,158.8 7,485.5 -5,573.2 7,500.0
560.8 217.7 -12.6 717.7
1,024.8 900.0 669.7 1,400.0
464.0 682.3 -682.3 682.3
0.0 38.0 0.0 0.0
1,448.9 1,683.0 449.6 1,087.4
0.0 1,500.0 0.0 604.1
0.0 1,500.0 0.0 604.1
0.0 0.0 0.0 0.0
0.0 0.0 0.0 0.0
0.0 0.0 0.0 604.1
0.0 1,500.0 0.0 0.0
0.0 1,500.0 0.0 0.0
0.0 0.0 0.0 0.0
1,448.9 183.0 449.6 483.3
1,680.6 452.8 422.4 755.9
231.7 269.8 -133.4 272.6
160.6
803.6 128.6 109.9 162.8
993.8 398.4 91.9 398.4
190.2 269.8 -110.0 235.6
128.1
686.8 54.4 356.0 357.5
686.8 54.4 330.5 357.5
0.0 0.0 0.0 0.0
25.5
-41.5 0.0 -16.4 -37.0
0.0 0.0 0.0 0.0
41.5 0.0 -23.3 37.0
0.0 0.0 7.0
0.0 0.0 0.0 0.0
0.0 0.0 0.0 0.0
0.0 0.0 0.0 0.0
External
Net Acquisition of Financial Assets
Domestic
Currency and deposits
Other accounts receivable
Net Incurrence of Liabilities
Domestic
Debt securities
New instruments
Amortisation
Treasury Bills
New instruments
Amortisation
Treasury Bonds
New instruments
Amortisation
Other accounts payable
External
Debt securities
New instruments
Amortisation
Holdings gains and losse*
Concessional financing
New borrow ing
Commercial financing
Extraordinary financing
New instruments
Amortisation
Holdings gains and losse*
Loans
New borrowing
Amortisation
Holdings gains and losse*
Concessional financing
New borrowing
Amortisation
Holdings gains and losse*
Commercial financing
New borrowing
Amortisation
Holdings gains and losse*
Extraordinary financing
* Holdings gains and losses (or revaluation) is a change in the monetary value of an asset of
liability resulting from changes in the level and structure of prices (for example, from changes in
interest rates) and/or exchange rates, assuming that the assets or liabilities has not changed
Amortisation
Holdings gains and losse*
Insurance, pension, and standardized guarantee schemes
Financial derivatives and employee stock options
Other accounts payable
1. Central government representing National, Provincial and Local Level Governments, Autonomous
Bouganville Government and Commercial and Statutory Authorities

36
TABLE 3 (II): STATEMENT OF OPERATIONS FOR THE CENTRAL GOVERNMENT (Kina, million)
10,485.5 11,473.2 4,441.4 10,959.2
8,421.6 9,158.2 4,011.1 8,869.3
1,430.0 968.1 387.2 968.1
633.9 1,346.9 43.1 1,121.9
15.5% 15.4% 6.0% 14.8%
12,894.4 12,537.0 5,005.7 12,967.1
4,021.6 3,871.4 2,101.3 4,301.5
2,781.9 3,517.4 1,022.0 3,517.4
1,248.1 1,465.6 831.3 1,465.6
4,309.0 3,604.4 1,015.0 3,604.4
441.8 0.0 0.0 0.0
92.1 78.2 36.1 78.2
19.0% 16.8% 6.7% 17.5%
-2,408.9 -1,063.8 -564.2 -2,007.9
677.9 812.5 220.2 812.5
677.9 812.5 220.2 812.5
13,572.3 13,349.5 5,225.9 13,779.6
-3,086.9 -1,876.3 -784.4 -2,820.4
-4.6% -2.5% -1.1% -3.8%
857.0 1,937.4 0.0 -
857.0 1,937.4 - -
- - - -
3,943.9 1,838.6 1,106.0 1,668.3
2,494.9 155.6 656.4 580.9
1,448.9 1,683.0 449.6 1,087.4
-4,800.9 -3,776.0 -1,100.4 -3,605.7
-7.1% -5.1% -1.5% -4.9%
Net Change in Stock -7,887.7 -5,652.3 -1,884.8 -6,426.1
67,762.2 74,625.3 74,225.0 74,225.0
Source: Department of Treasury
June
Outturn
2017
MYEFO
1. Central government representing National, Provincial and Local Level Governments, Autonomous Bouganville Government and
Commercial and Statutory Authorities. The statement is produced to reflect transactions on a modif ied cash basis of accounting
Grants
Social benefits
Other expense
Expense as percentage of GDP
Gross operating balance
TRANSACTIONS IN NONFINANCIAL ASSETS:
Net/gross investment in nonfinancial assets
Fixed assets
Net lending (+) / Net borrowing (–)
Expenditure
2. Include items that may require reclassif ication due to interfaces from the legacy systems, (The Provincial Government
Accounting System, ALESCO payroll and the Department of Public Works and Implementation, Oracle system).
3. Total nominal GDP by economic activity, Actual: National Statistics Office and Projections: Treasury Department.
(Kina Million)2016
Actuals
2017
Budget
TRANSACTIONS AFFECTING NET WORTH:
Revenue
Taxes
Grants
Other Revenue
Revenue as percentage of GDP
Expense2
Compensation of employees
Use of goods and services
Interest
Net incurrence of liabilities
Domestic
External
Gross Domestic Product3
Net lending/borrowing as percentage of GDP
TRANSACTIONS IN FINANCIAL ASSETS AND LIABILITIES (FINANCING):
Net acquisition of financial assets
Domestic
External
Net cash inflow from financing activities
Net cash inflow as percentage of GDP

37
TABLE3 (III): STATEMENT SOURCES AND USES OF CASH FOR THE CENTRAL GOVERNMENT (Kina, million)
10,485.5 11,473.2 4,441.4 10,959.2
8,421.6 9,158.2 4,011.1 8,869.3
1,430.0 968.1 387.2 968.1
633.9 1,346.9 43.1 1,121.9
15.5% 15.4% 6.0% 14.8%
10,902.8 11,109.9 4,354.1 11,533.4
3,901.7 3,415.2 1,854.1 3,838.7
2,781.9 3,514.6 1,004.9 3,514.6
1,248.1 1,465.6 831.3 1,465.6
2,879.0 2,636.3 627.8 2,636.3
92.1 78.2 36.1 78.2
16.1% 14.9% 5.9% 15.5%
-417.3 363.3 87.3 -574.2
677.9 812.7 220.2 812.7
677.9 812.7 220.2 812.7
11,580.7 11,922.6 4,574.3 12,346.1
-1,095.3 -449.4 -132.8 -1,386.9
-1.6% -0.6% -0.2% -1.9%
857.0 1,937.4 0.0 0.0
857.0 1,937.4 0.0 0.0
0.0 0.0 0.0 0.0
3,943.9 1,838.6 1,106.0 1,838.6
2,494.9 155.6 656.4 155.6
1,448.9 1,683.0 449.6 1,683.0
-3,086.9 -3,776.0 -1,106.0 -1,838.6
-4.6% -5.1% -1.5% -2.5%
-4,182.1 -4,225.4 -1,238.9 -3,225.5
Gross Domestic Product 67,762.2 74,625.3 74,225.0 74,225.0
June
Outturn
2017
MYEFO
Source: Department of Treasury
1. Central government representing National, Provincial and Local Level Governments, Autonomous Bouganville Government and Commercial and
Uses of goods and services
Interest
Grants
Other payments
Expense as percentage of GDP
Net cash inflow from operating activities
CASH FLOWS FROM TRANSACTIONS IN NONFINANCIAL ASSETS:
Net cash outflow from investment in nonfinancial assets
Fixed assets
2. Include items that may require reclassif ication due to interfaces from the legacy systems, (The Provincial Government Accounting System,
3. Total nominal GDP by economic activity, Actual: National Statistics Office and Projections: Treasury Department.
(Kina Million)2016
Actual
2017
Budget
CASH FLOWS FROM OPERATING ACTIVITIES
Revenue Cash Flows
Taxes
Grants
Other Revenue
Revenue as percentage of GDP
Expense cash flows 2
Compensation of employees
Net change in the stock of cash
Net incurrence of liabilities
Domestic
External
Net cash inflow from financing activities
Net cash inflow as percentage of GDP
CASH FLOWS FROM TRANSACTIONS IN FINANCIAL ASSETS AND LIABILITIES (FINANCING):
Net acquisition of financial assets other than cash
Domestic
External
Expenditure cash flows
Cash surplus (+) / Cash deficit (–)
Surplus/Deficit as percentage of GDP

38
PART 2
2017 MID -YEAR EXPENDITURE
2.1 FUNDED EXPENDITURE SINCE THE 2017 BUDGET
The total appropriated expenditure for 2017 was K13,349.5 million which includes debt interest payments and excludes debt amortisation. The 2017 Budget has continued to support the Government’s expenditure for key policies including Tuition Fee Free Education, Fee Free Primary Health Care, Infrastructure, Agriculture, Tourism, Rural Development, Small to Medium Enterprises (SMEs), facilitating the 2017 General Elections and Hosting of the 2018 APEC Summit. Table 19 shows a summary of the 2017 Budget and expenditure up to June. Table19: Summary of 2017 Budget by Budget Components (Kina, million)
Details 2017
Original Budget
2017 Revised Budget
Warrants as at 30th
June
June Outturn
Expenditure vs Rev.
Budget (%)
Operational 8,956.9 8,934.9 4,462.0 4,380.7 47.0%
Personnel Emoluments 3,847.9 3,819.5 1,277.2 2,100.2 50.0%
Goods & Services 3,626.1 3,632.5 1,768.2 1,411.0 38.8%
Debt Interest 1,382.9 1,382.9 1,382.9 792.1 57.3%
Debt (Interest Repayment)
100.0 100.0 33.7 77.4 77.4%
Capital Investment 2,592.3 2,614.3 765.6 366.1 14.0%
Personnel Emoluments 26.7 26.7 26.6 1.1 4.1%
Goods & Services 2,565.6 2,587.6 739.0 364.9 14.1%
Donor Grants 968.1 968.1 0.0 387.2 40.0%
Goods & Services 968.1 968.1 0.0 387.2 40.0%
Concessional Loans 452.8 452.8 0.0 91.9 20.3%
Goods & Services 452.8 452.8 0.0 91.9 20.3%
Grand Total 13,349.5 13,349.5 5,227.6 5,225.9 39.1% Source: Department of Treasury
Expenditure up to the end of June totaled K5,225.9 million against total authorised warrant of K5,227.6 million. Total warrants authorised is K1,447.1 million or 21.7 per cent lower than pro- rata (50.0 per cent) while expenditure is also trending behind by K1,448.8 million or by 21.7 per cent lower than the pro-rata. This is due to slow remittance of funds pertaining mainly to stringent expenditure management measures introduced by the Government to match the performance of revenue collections. The 2017 mid-year expenditure level has increased by 9.2 per cent compared to the corresponding period of 2016. The notable difference is the emphasis placed on ensuring that the 2017 National Election operations is sufficiently funded. The Operational Budget expended a total of K4,380.7 million up to the end of June or 47.0 per cent of the 2017 Revised Operational Budget and 98.2 per cent of its warranted K4,462.0 million. GoPNG Capital Investment Expenditure up to the end of June stood at K366.1 million or 14.0 per cent of the 2017 Revised Capital Budget and 47.8 per cent of the warranted K765.6 million. Drawdowns from donor grants totaled K387.2 million while concessional loans drawdowns totaled K91.9 million. Compensation of Employees (PE) expended a total of K2,101.3 million or 50.0 per cent of its 2017 revised appropriation. Expenditure in compensation of employees exceeded its authorised warrants by 62.4 per cent reflecting the unwarranted expenses on the government payroll and is trending above the 50.0 per cent pro-rata of its revised appropriation by

39
0.5 per cent. A continuation of this trend would result in an increase of its total budget by K430.1 million. This is expected to increase further when all expenditures in compensation of employees is updated and captured on IFMS. Goods and Services (GS) expended K2,255.0 million or 29.5 per cent of its revised budget appropriation. Expenditure in GS is below its authorised warrants by 10.1 per cent and is running below the 50.0 per cent pro-rata of its revised budget by 9.0 per cent. This is due to the current fiscal conditions of lower revenue collections which is not allowing for timely expenditure to take place. Although warrants are being released, only priority funding are being remitted to agencies, as such expenditure is lower than expected. Refer to Attachment (F) for compensation of employees (PE) and GS expenditure up to June by Account Type. APPROPRIATION TRANSFERS Section 3 Transfers (Secretary’s Advance) Under the Miscellaneous expenditure the Government has appropriated funding in 2017 to cater for unforeseen expenditure that might arise during the course of the fiscal year. This appropriation is known as Section 3 (Secretary’s Advance) and Section 4 Transfers and the Appropriation Act allows movements under this funding. Secretary’s Advance (SA) was appropriated K62.0 million in 2017. As at the end of June, K59.8 million or 96.4 per cent of the SA has been expended. A total of K17.8 million or 30.0 per cent was expended in February, K31.0 million or 52.0 per cent was expended in March and K11.0 million or 18.0 per cent was expended in April to June. The major expenditure that consumed the largest share of the SA is Outstanding Service Bills of K23.5 million or 39.0 per cent followed by counter funding of Capital expenditure by K15.8 million or 26.0 per cent and Operations of K9.18 million or 15.0 per cent. See Table 20 for the transfers. Table 20: Secretary’s Advance expenditure since the 2017 Budget (Kina, million)
Date Div Particulars /Description
Section 3
Plus (+) Minus (-)
3/02/2017 208 To cater for OS Service Bills 3,838,270
6/02/2017 257 For CSTB and Public Enterprise 3,000,000
7/02/2017 208 To settle Kara Hire Cars auth. by Sec. 1,570,000
14/02/2017 208 For Police & Defence O/S hire car bills. 5,000,000
20/02/2017 509 To cater for outstanding bills for 2016 1,000,000
21/02/2017 208 To settle o/s bill as directed by Sec 2,000,000
24/02/2017 203 To cater for GG's Funeral & Repat. Costs 1,400,000
6/03/2017 503 For OC's Election Awareness Program 1,400,000
10/03/2017 206 For hosting of Prov. & Dist. T/Conference 5,000,000
22/03/2017 208 To settle legal bills for Twivey lawyers 1,100,000
22/03/2017 203 Hela call operation - NEC Dec. 218/336. 4,000,000
24/03/2017 585 Chuave Dist. Feeder Rd - Treasurer's Dir 3,500,000
27/03/2017 208 For MEPD to cater for TBLP 76,350
28/03/2017 208 Petroleum Incentive bonus 1,500,000
28/03/2017 254 Mining Incentive Bonus 1,000,000
29/03/2017 208 Transfer to cater for Marko Ltd - Defence 3,421,706
31/03/2017 208 Huawei/TBEA - Counterpart Funding. 10,000,000
6/04/2017 208 Outstanding Bills settlement - Mr. Kuman 180,000
13/04/2017 208 To cater for IMF/World Bank Meeting 403,660
27/04/2017 208 To settle 'The Treasury o/s bills/claims 3,857,000

40
12/05/2017 208 o/s to pay Stretton Reality for services 173,100
16/05/2017 208 To cater for Mobile Works Ltd o/s bills 2,312,874
17/05/2017 208 To support St John's operations 700,000
5/06/2017 208 To settle Mr. Kambori's consultancy fee 100,000
21/06/2017 228 For Police Dept (IAD) office setup. 1,500,000
21/06/2017 207 To cater for PNG Trade Commerce Staff pay. 1,000,000
21/06/2017 233 To cater Censorship Priority Programs 800,000
Total 59,832,960
Source: Department of Treasury
Section 4 Transfers The Appropriation Act also allows for Section 4 movements. The movements are transfers within agencies and from one agencies to another. At the end of June, Section 4 transfers amounted to K963.2 million of which K98.5 million was for transfers made within agencies (internal transfers) and K864.7 million was for transfers made between agencies. Attachment E shows movements in Section 4 Transfers.
2.2 2017 BUDGET EXECUTION The 2017 Budget appropriation of K13,349.5 million provided for a continuing focus of spending on the Government’s key policy priorities. Major spending commitments in 2017 are listed in Table 21. Table 21: Summary by Government Priorities (Kina, million)
Details 2017
Budget Revised Budget
War. as at 30th June
War. Auth. vs Revised Budget (%)
June Outturn
Exp. vs Revised
Budget (%)
Agriculture and SME Funding 30.0 30.0 21.0 70.0% 10.0 33.3%
APEC 250.0 200.0 0.0 0.0% 0.0 0.0%
Court House Design and Maintenance 80.0 80.0 40.0 50.0% 0.0 0.0%
Court Orders 50.0 50.0 24.0 48.0% 4.9 9.8%
District Support Grants 55.5 55.5 0.0 0.0% 0.0 0.0%
DSIP 890.0 890.0 24.0 2.7% 23.5 2.6%
Education Fee Free Subsidy 602.0 602.0 330.0 54.8% 281.0 46.7%
Emergency Roads & Bridges Funding 10.7 10.7 10.0 93.5% 8.9 83.2%
Free Primary Health Care 20.0 20.0 0.0 0.0% 0.0 0.0%
Highlands H/Way Roads Maintenance 53.4 43.4 32.1 74.0% 27.3 62.9%
Highlands H/Way - Lae - Komo Upgrading & Sealing
20.0 20.0 17.0 85.0% 17.0 85.0%
HIV/AIDS 8.0 8.0 0.0 0.0% 0.0 0.0%
Hospital Rehabilitation & Redevelopment
27.9 27.9 10.5 37.6% 0.0 0.0%
Infrastructure Development Grants (IDG)
120.0 120.0 0.0 0.0% 0.0 0.0%
Lae-Nadzab Road (4Lane) 25.0 25.0 25.0 100.0% 25.0 100.0%
Maintenance of National Priority Roads
76.3 76.3 53.4 70.0% 48.4 63.4%
Medical Equipment 1.2 1.2 1.2 100.0% 0.0 0.0%
Medical Supplies 160.7 160.7 76.4 47.5% 73.8 45.9%
MOAs 3.5 3.5 1.2 34.3% 0.0 0.0%
National Land and Housing Program 19.0 19.0 19.0 100.0% 1.3 6.8%
Others 10,118.2 10,178.2 4,502.8 44.2% 4,598.1 45.2%
Port Moresby City Roads 21.0 21.0 8.0 38.1% 0.0 0.0%
Port Moresby General Hospital Rehabilitation
5.0 5.0 2.0 40.0% 0.0 0.0%
Provincial Support Improvement Program (PSIP)
220.0 220.0 0.0 0.0% 0.0 0.0%
Restoration Development Grants (ABG)
10.0 10.0 7.0 70.0% 0.0 0.0%
Special Interventions Program -Bougainville
70.0 70.0 15.0 21.4% 10.0 14.3%
Special Support Grant (SSG) 22.9 22.9 8.0 34.9% 8.0 34.9%
Grand Total 12,970.3 12,970.3 5,227.6 40.3% 5,137.2 39.6%

41
Source: Department of National Planning and Department of Treasury
This table excludes reporting of GST Transfers and Bookmakers Turnover Tax to Provinces.
Total Government expenditure of K5,225.8 million up to June 2017 is comprised of GoPNG funded expenditure of K4,658.1 million, K387.2 million from Donor Grants and K91.9 million from Concessional Loans. Note from Table 22 (below) that expenditures from Donor Grants and Concessional Loans are reflected separately as a result of delay in IFMS postings. Table 22 shows expenditure as at 30th June by agency type and Budget components. Table 22: Detail by Agency Type and Budget Component (Kina, million)
Details 2017
Budget
2017 Rev.
Budget
Warrant as at 30th June
Expenditure as at 30th June
Expenditure vs Rev.
Budget (%)
National Departments 4,418.4 3,943.4 2,040.8 1,683.3 42.7%
Operational 3,513.5 3,028.5 1,599.6 1,477.8 48.8%
Capital Investment 904.9 914.9 441.2 205.5 22.5%
Commercial & Stat. Authorities 665.8 655.3 392.1 250.1 38.2%
Operational 360.6 350.1 177.2 144.6 41.3%
Capital Investment 305.2 305.2 214.9 105.5 34.6%
Provincial Administrations 3,970.1 3,984.6 560.9 1,184.4 29.7%
Operational 2,587.8 2,590.3 451.4 1,129.3 43.6%
Capital Investment 1,382.3 1,394.3 109.5 55.1 4.0%
Miscellaneous 1,491.4 1,962.3 850.9 836.8 42.6%
Operational 1,491.4 1,962.3 850.9 836.8 42.6%
Debt Services 1,382.9 1,382.9 1,382.9 792.1 57.3%
Operational 1,382.9 1,382.9 1,382.9 792.1 57.3%
Donor Grants 968.1 968.1 0.0 387.2 40.0%
Concessional Loans 452.8 452.8 0.0 91.9 20.3%
Grand Total 13,349.5 13,349.5 5,227.6 5,225.8 39.1% Source: Department of Treasury
National Departments expended the highest, followed by Provincial Administrations and Commercial and Statutory Authorities. Debt services has been fully warranted as debt repayment is a Government priority and has expended K792.1 million or 57.2 per cent of the 2017 Budget appropriation. Spending on the Medium Term Development Plan (MTDP) Enablers The Overall Capital Investment Budget Ceiling at the time of the 2017 Budget was K4,013.3 million including both loans and grants. This was revised up to K4,035.3 million by K22.0 million transferred from Operational Budget. The revised Direct GoPNG Financing of the 2017 Budget is K2,614.4 million, while the balance has been sourced from loans and grants. The 2017 Budget is driven by key priorities of the MTDP2, where ongoing commitments are maintained through to 2017 to achieve planned development outcomes despite of the prevailing macroeconomic and fiscal challenges. Key sectors of the MTDP2 priority have been progressively achieved with increasing focus on the economic sector, mainly the agriculture sector to address inclusive, sustainable and broad based economic growth. The 2017 Budget recorded increased funding towards MTDP priority areas. The focus is on Higher Education, Law & Justice, Agriculture, Small and Medium Enterprises (SMEs) and Tourism sectors. Sub-national empowerment, mainly grants, transfers and subsidies to local governments, and administration costs for office establishments and renovation works, and this is the largest

42
funded MTDP 2 priority in the budget. Most of the funds are allocated from the Operational Expenditure budget. Table 23: Identifies expenditure by MTDP enablers to 30 June 2017 against Revised Appropriation (Kina, million)
MTDP2 Priority Appropriation Expenditure % of
Appropriation % of Total
Expenditure
Education 831.80 372.90 45% 6%
Health 737.20 391.80 53% 7%
Transport Infrastructure 591.30 167.30 28% 3%
Law and Justice 94.30 12.90 14% 0%
Land and Housing 60.90 7.50 12% 0%
SME 32.00 4.30 13% 0%
Tourism and Culture 15.00 2.00 13% 0%
Agriculture and Livestock 105.60 11.80 11% 0%
Mineral and Petroleum Resources 180.00 24.70 14% 0%
Strategic Assets 8.00 - 0% 0%
Forestry and Biodiversity 3.50 0.88 25% 0%
Fisheries and Marine Resources 2.50 0.70 28% 0%
Water Resources 3.60 - 0% 0%
Clean and Renewable Energy 26.00 6.50 25% 0%
Sub-National Empowerment 17,048.00 4,957.90 29% 83%
Total 19,739.70 5,961.18 30%
Source: Department of National Planning and Monitoring
Up to June, only 30.0 per cent of funds were released. Most of these funds were disbursed for sub-national empowerment. FUNDING FOR CAPITAL INVESTMENT EXPENDITURE Capital Expenditure Budget of the Capital Investment Program is K4,035.3 million, and comprises K2,614.4 million is direct Government financing, K452.8 million are loans funds and K968.1 million are donor grants. The main priorities of the Budget are to:
facilitate the 2017 National General Election and the hosting of the 2018 APEC
Summit;
place more emphasis on monitoring, evaluation and compliance to achieve improved
development outcomes;
continue to support policy priorities in education, health, infrastructure, agriculture and
SME sectors; and
promote the efficient and effective implementation of major projects through improving
design, scoping and the implementation processes.
The Warrant released is 30.0 per cent of the revised appropriation. The spending is just 49.0 per cent of the warrants authorised. Table 24: Some Domestic Expenditure towards Government Priority Projects 2017(Kina, million)
Program/Project Initial
Appro. Current Appro.
War. Auth.
Total Exp. + Commitments
War. (%)
Exp. (%)
Capital Expenditure Budget Totals 2,592.4 2,614.4 765.6 377.8 30% 49%
Infrastructure Development Grant 120.0 120.0 0.0 0.0 0% funds yet to be released
DSIP-Morobe 90.0 90.0 2.0 2.0 2% 100%
Court House Design and Maintenance 80.0 80.0 40.0 0.0 50% 0%
DSIP-EHP 80.0 80.0 3.5 3.5 4% 100%
Special Interventions Program -Bougainville 70.0 70.0 15.0 10.0 21% 67%
DSIP - East Sepik 60.0 60.0 0.5 0.5 1% 100%
DSIP - Simbu 60.0 60.0 2.0 2.0 3% 100%

43
DSIP -Madang 60.0 60.0 1.0 1.0 2% 100%
DSIP -Enga 50.0 50.0 1.5 1.5 3% 100%
DSIP -SHP 50.0 50.0 2.5 2.5 5% 100%
Civil Aviation Sector Development Investment
40.0 40.0 32.5 11.5 81% 35%
District Support Improvement Program 40.0 40.0 1.5 1.5 4% 100%
DSIP-.MBay 40.0 40.0 0.5 0.5 1% 100%
DSIP -Central 40.0 40.0 0.5 0.0 1% 0%
DSIP -ENB 40.0 40.0 0.5 0.5 1% 100%
DSIP -WHP 40.0 40.0 1.0 1.0 3% 100%
Agriculture and SME Funding 30.0 30.0 21.0 10.0 70% 48%
DSIP -ABG 30.0 30.0 1.5 1.5 5% 100%
DSIP -Fly 30.0 30.0 0.0 0.0 0% funds yet to be released
DSIP -Hela 30.0 30.0 1.0 1.0 3% 100%
DSIP -Jiwaka 30.0 30.0 1.5 1.5 5% 100%
DSIP -NCD 30.0 30.0 1.5 1.5 5% 100%
Outstanding Ward Counselors Allowance 25.9 25.9 25.9 0.0 100% 0%
Lae-Nadzab Road (4Lane) 25.0 25.0 25.0 25.0 100% 100%
DSIP -Gulf 20.0 20.0 0.0 0.0 0% funds yet to be released
DSIP -NIP 20.0 20.0 0.5 0.5 3% 100%
DSIP -Oro 20.0 20.0 1.0 1.0 5% 100%
DSIP -WNB 20.0 20.0 0.0 0.0 0% funds yet to be released
Highlands Highway - Lae - Komo Upgrading & Sealing
20.0 20.0 17.0 17.0 85% 100%
Highlands Region Roads Improvement Investment Program
20.0 20.0 12.0 2.5 60% 21%
Highlands Region Roads Improvement Program (HRRIIP II )
20.0 10.0 10.0 3.0 50% 30%
PNG Church State Partnership Program 20.0 0.0 0.0 0.0 0% Appropriation
zeroed
Port Moresby City Roads 20.0 20.0 8.0 0.0 40% 0%
TIPA Administration Relocation (HIP) Component
20.0 20.0 14.0 2.0 70% 14%
National Land and Housing Program 19.0 19.0 19.0 1.5 100% 8%
National Highway - Hiritano 15.0 15.0 6.0 6.0 40% 100%
Tourism Sustainable Development Program 15.0 15.0 10.0 2.6 67% 26%
ADB Bridge Replacement & Improve Rural Access Project
10.0 10.0 7.0 4.0 70% 57%
Source: Department of National Planning and Monitoring
Projects such as the Lae-Nadzab Road (4 Lane), East/West New Britain Highway, EDF NAO Institutional Capacity Project, Highlands Region Road Improvement Investment Program.- Phase I, Hiri-Lai Road, and Lae City Roads-(GoPNG) have near all the funds allocated for the year. Notably, funds for the Provincial Support Improvement Programs (PSIP) are yet to be released. Spending of these priorities are affected by cash flow challenges. DNPM will maintain and increase liaison with implementing agencies to ensure that Government’s key priorities are delivered within the realities of the 2017 Budget. GRANT FINANCING In the 2017 National Budget, grant financing is wholly allocated to finance the Capital Expenditure budget. Grant financing is K968.1 million, of which K830.0 million is funded by Foreign Governments, which is about 86.0 per cent of the total grant allocation. The Australian Government through the Department of Foreign Affairs and Trade (DFAT) is the largest financier allocating K727.0 million. The Japanese Government through Japanese International Cooperation Agency (JICA), the New Zealand Government through the NZAID, and the United States of America through the USAID are other grant financiers. International Organisations have allocated K138.0 million as grant financing. The European Union allocated the largest of K104.0 million.

44
Up to June, disbursements amounted to K387.2 million, which is about 40.0 per cent of total grant appropriation. This is partially based projection on trend analysis. According to DNPM, a notable number of donors submit expenditure reports between August and September, by then the MYEFO would be published. There is an ongoing need for DNPM to improve projections for the MYEFO and allocations for grants in-kind. Table 25: Grants 2017 (Kina, million)
2017 Budget June Outturn 2017 MYEFO
GRANTS 968.1 387.2 968.1 From Foreign Governments (Donors) 830.0 0.0 0.0 Current 0.0 0.0 0.0
Cash 0.0 0.0 0.0 In-Kind 0.0 0.0 0.0
Capital 830.0 332.0 830.0 Cash 830.0 332.0 830.0 In-Kind 0.0 0.0 0.0
From Inter. Organizations (Donors) 138.0 55.2 138.0 Current 0.0 0.0 0.0
Cash 0.0 0.0 0.0 In-Kind 0.0 0.0 0.0
Capital 138.1 55.2 138.1 Cash 138.1 55.2 138.1 In-Kind 0.0 0.0 0.0
Source: Department of National Planning & Monitoring
1
PART 3 ATTACHMENTS
ATTACHMENT A
ATTACHMENT B
SUMMARY OF NATIONAL BUDGET EXPENDITURE
NATIONAL DEPARTMENT BUDGET EXPENDITURE
ATTACHMENT C COMMERCIAL STATUTORY AGENCY BUDGET EXPENDITURE
ATTACHMENT D
ATTACHMENT E
ATTACHMENT F
PROVINCIAL ADMINISTRATION BUDGET EXPENDITURE
MOVEMENTS IN SECTION 4 TRANSFERS
GOODS & SERVICES AND PERSONNEL EMOLUNMENTS EXPENDITURE

2
Attachment A:
SUMMARY OF NATIONAL BUDGET EXPENDITURE MYEFO 2017 (KINA, MILLION)
Details 2017
Budget 2017 Rev.
Budget Warrant as
at 30th June June
Outturn
Operational 8,956.9 8,934.9 4,462.0 3,595.5
National Departments 3,513.5 3,028.5 1,599.6 1,576.7
Goods & Services 1,801.0 1,335.7 783.3 502.7
Personnel Emoluments 1,712.5 1,692.9 816.3 1,074.1
Commercial & Statutory Authorities 360.6 350.1 177.2 144.6
Goods & Services 79.3 58.2 28.8 23.3
Personnel Emoluments 281.3 292.0 148.3 121.3
Provincial Administrations 2,208.5 2,211.0 451.4 864.4
Goods & Services 691.3 693.8 198.1 28.1
Personnel Emoluments 1,517.3 1,517.3 253.3 836.4
Miscellaneous 1,491.4 1,962.3 850.9 836.8
Goods & Services 1,154.5 1,644.8 791.6 669.4
Personnel Emoluments 336.9 317.5 59.3 167.4
Debt Services 1,382.9 1,382.9 1,382.9 172.9
Goods & Services 1,382.9 1,382.9 1,382.9 172.9
Capital Investment 2,592.4 2,614.4 765.6 366.1
National Departments 904.9 914.9 441.2 205.5
Goods & Services 878.3 888.3 414.7 204.6
Personnel Emoluments 26.6 26.6 26.5 1.0
Commercial & Statutory Authorities 305.2 305.2 214.9 105.5
Goods & Services 305.0 305.0 214.8 105.4
Personnel Emoluments 0.2 0.2 0.2 0.1
Provincial Administrations 1,382.3 1,394.3 109.5 55.0
Goods & Services 1,382.3 1,394.3 109.5 55.0
Donor Grants 968.1 968.1 0.0 387.2
Concessional Loans 452.1 452.1 0.0 91.9
Grand Total 12,970.2 12,970.2 5,227.6 5,225.8
Source: Department of Treasury.

3
Attachment B:
NATIONAL BUDGET EXPENDITURE MYEFO 2017 (KINA, MILLION)
Details 2017
Budget
2017 Rev.
Budget
Warrants as at 30th June
June Outturn
Operational 8,957.0 8,934.5 4,461.7 4,380.5
Personnel Emoluments 3,847.6 3,819.4 1,276.7 2,198.9
201-National Parliament 79.9 79.9 47.1 43.2
202-Office of Governor-General 1.9 2.9 1.9 1.8
203-Department of Prime Minister & NEC 43.1 43.1 14.5 27.6
204-National Statistical Office 4.8 4.8 2.3 3.3
205-Office of Bougainville Affairs 1.6 1.7 0.9 1.3
206-Department of Finance 14.3 14.3 7.2 7.8
207-Treasury and Finance - Miscellaneous 336.9 317.5 59.3 167.4
208-Department of Treasury 13.9 13.9 7.4 7.6
209-Registrar For Political Parties 3.7 3.7 1.5 2.4
211-PNG Customs Service 30.0 30.0 15.3 15.7
212-Information Technology Division 3.1 3.1 1.6 1.1
213-Fire Services 12.2 12.2 6.1 8.1
215-PNG Immigration and Citizenship Services 8.2 8.2 2.1 5.4
216-Internal Revenue Commission 45.1 45.1 0.0 20.5
217-Department of Foreign Affairs and Trade 25.9 5.8 2.4 6.3
218-Office of the Public Prosecutor 5.3 5.3 2.7 3.1
219-PNG Institute of Public Administration 4.1 4.1 1.1 2.6
220-Department of Personnel Management 11.6 16.6 10.8 9.7
221-Public Service Commission 4.2 4.2 2.1 2.3
222-Office of the Public Solicitor 8.2 8.2 4.1 4.2
223-Judiciary Services 67.4 67.4 33.7 43.0
224-Magisterial Services 32.1 32.1 16.1 25.5
225-Department of Attorney-General 71.5 71.5 35.7 45.8
226-Department of Corrective Institutional Services 87.2 86.7 43.4 37.8
227-Provincial Treasuries 28.0 28.0 13.3 16.4
228-Department of Police 196.5 196.5 98.3 115.5
229-Department of National Planning and Monitoring 8.9 8.9 4.4 6.1
230-Electoral Commission 5.2 5.2 2.6 2.2
231-National Intelligence Organisation 2.3 2.3 1.2 1.2
232-Provincial and Local Government Affairs 7.8 7.8 3.9 4.5
233-Office of Censorship 1.9 1.9 0.9 0.8
234-Department of Defence 115.1 115.2 57.6 96.3
235-Department of Education 108.6 108.6 54.3 71.4
236-Department of Higher Education Research Science & Technology
4.3 4.3 2.2 1.9
237-PNG National Commission for UNESCO 0.0 0.0 0.0 0.8
238-Milne Bay Provincial Health Authority 21.1 21.1 10.6 22.6
239-Western Highlands Provincial Health Authority 25.4 25.4 12.7 19.9
240-Department of Health 57.2 57.2 28.6 44.7
241-Hospital Management Services 302.7 297.4 149.5 171.9
242-Department of Community Development 7.0 7.0 2.9 5.5
243-National Volunteer Services 2.2 2.2 1.1 0.9
244-Eastern Highlands Provincial Health Authority 28.8 28.8 14.4 26.9
245-Conservation and Environment Protection Authority 5.6 5.6 2.3 3.4
246-Office of Urbanization 1.1 1.1 0.4 1.0
247-Department of Agriculture and Livestock 7.1 7.1 3.3 4.9
248-Southern Highlands Provincial Health Authority 1.0 1.0 0.0 8.9
249-New Ireland Provincial Health Authority 1.0 1.0 0.0 0.0
251-PNG Science & Technology Secretariat 1.8 1.8 0.9 0.9
252-Department of Lands and Physical Planning 12.0 12.0 5.0 8.1
253-West New Britain Provincial Health Authority 28.1 28.1 14.0 18.6
254-Department of Mineral Policy and Geo-hazards Management
3.9 3.9 1.6 2.4
255-Departmentof Petroleum and Energy 7.0 7.1 3.5 4.3
256-Manus Provincial Health Authority 11.9 11.9 5.9 4.5
257-Department of Public Enterprises 1.9 1.9 0.9 0.9
258-Department of Information and Communication 1.3 1.3 0.5 0.8
259-Department of Transport 9.3 9.3 4.6 5.9
260-Enga Provincial Health Authority 22.1 22.1 11.2 16.3
261-Department of Commerce and Industry 6.4 6.4 3.2 3.8
262-Department of Industrial Relations 11.3 11.3 5.7 6.9
263-National Tripartite Consultative Council 0.4 0.4 0.2 0.2
264-Department of Works and Implementation 49.3 49.3 20.9 31.9
265-Hela provincial Health Authority 1.0 1.0 0.0 0.0

4
Details 2017
Budget
2017 Rev.
Budget
Warrants as at 30th June
June Outturn
266-Sandaun Provincial Health Authority 19.8 19.8 9.9 11.3
267-Department of Implementation and Rural Development
5.4 5.4 2.7 2.4
268-Central Supply & Tenders Board 1.4 1.4 1.0 0.8
269-Office of Tourism Arts and Culture 0.0 0.0 0.0 0.3
501-Konebada Petroleum Park Authority 0.0 2.0 0.3 0.0
502-Office of the Auditor-General 11.5 11.5 5.8 4.8
503-Ombudsman Commission 12.1 12.1 6.1 4.0
505-National Research Institute 3.0 3.0 1.5 1.2
506-National Training Council 0.9 0.9 0.4 0.5
507-National Economic & Fiscal Commission 1.8 1.8 0.8 0.1
509-Border Development Authority (BDA) 1.9 1.9 1.0 0.8
510-Legal Training Institute 1.6 1.6 0.8 0.7
511-Papua New Guinea Climate Change Authority 3.4 3.4 1.4 2.2
512-University of Papua New Guinea 46.0 54.7 34.4 27.2
513-University of Technology 32.6 32.6 19.0 14.0
514-University of Goroka 17.2 17.2 8.6 5.7
515-University of Environment & Natural Resources 16.6 16.6 8.3 5.5
516-Papua New Guinea Sports Foundation 5.5 5.5 2.8 2.3
517-National Narcotics Bureau 2.1 2.1 1.0 1.0
518-PNG Maritime College 3.7 3.7 1.9 1.6
519-National Aids Council Secretariat 7.1 7.1 3.5 2.9
520-Institute of Medical Research 8.4 8.4 4.2 3.5
521-National Youth Commission 1.6 1.6 0.8 1.3
522-Constitutional and Law Reform Commission 2.4 2.4 1.2 0.8
523-Papua New Guinea Accidents Investigation Commission
4.4 4.4 1.8 1.8
525-National Broadcasting Commission 15.7 15.7 6.5 6.5
526-National Maritime Safety Authority 1.4 1.4 0.7 0.6
531-Small Business Development Corporation 2.5 2.5 1.3 1.1
532-National Institute of Standards & Industrial Technology
2.0 2.0 0.9 1.2
533-Industrial Centres Development Corporation 2.1 2.1 1.0 0.9
536-Kokonas Indastri Koporesen 0.1 0.1 0.0 0.0
539-National Museum and Art Gallery 3.7 3.7 1.8 1.4
541-National Housing Corporation 0.0 0.0 0.0 -0.7
542-National Cultural Commission 2.7 2.7 1.3 1.5
549-Office of Coastal Fisheries Development Agency 1.8 1.8 0.8 0.1
550-Cocoa Coconut Institute Ltd 4.3 4.3 2.2 1.8
551-National Fisheries Authority 0.0 0.0 0.0 0.0
553-Fresh Produce Development Company 3.2 3.2 1.6 1.6
554-PNG Coffee Industry Corporation 1.8 1.8 0.9 0.8
557-PNG National Forest Authority 20.0 20.0 8.3 6.7
558-Tourism Promotion Authority 2.0 2.0 0.8 0.7
562-National Agriculture Research Institute 7.2 7.2 3.0 3.0
563-National Agriculture Quarantine & Inspection Authority
8.2 8.2 3.4 4.8
565-Civil Aviation Safety Authority 9.9 9.9 4.1 4.1
566-Cocoa Board 3.3 3.3 1.6 1.4
569-Independent Consumer and Competition Commission
5.6 5.6 2.3 1.8
571-Fly River Provincial Administration 51.6 51.6 10.8 28.8
572-Gulf Provincial Administration 29.8 29.8 6.4 15.8
573-Central Provincial Administration 61.6 61.6 11.1 38.1
574-National Capital District 0.0 0.0 0.0 0.0
575-Milne Bay Provincial Administration 69.6 69.6 12.4 33.6
576-Oro Provincial Administration 38.0 38.0 7.0 19.1
577-Southern Highlands Provincial Administration 92.1 92.1 13.0 60.3
578-Enga Provincial Administration 65.5 65.5 11.2 42.1
579-Western Highlands Provincial Administration 90.4 90.4 14.3 49.4
580-Simbu Provincial Administration 80.9 80.9 13.7 44.0
581-Eastern Highlands Provincial Administration 95.0 95.0 17.2 51.3
582-Morobe Provincial Administration 160.5 160.5 21.5 88.4
583-Madang Provincial Administration 113.2 113.2 19.4 62.6
584-East Sepik Provincial Administration 84.3 84.3 16.9 51.4
585-Sandaun Provincial Administration 55.1 55.1 11.3 27.9
586-Manus Provincial Administration 28.8 28.8 4.5 14.7
587-New Ireland Provincial Administration 58.8 58.8 7.8 29.3
588-East New Britain Provincial Administration 91.6 91.6 15.2 51.3

5
Details 2017
Budget
2017 Rev.
Budget
Warrants as at 30th June
June Outturn
589-West New Britain Provincial Administration 67.7 67.7 10.5 30.2
590-Autonomous Bougainville Administration 106.0 106.0 15.9 46.5
591-Hela Provincial Administration 34.8 34.8 6.8 23.8
592-Jiwaka Provincial Administration 41.8 41.8 6.2 27.6
Goods & Services 5,109.4 5,115.1 3,185.0 2,181.6
201-National Parliament 27.0 26.0 16.4 10.2
202-Office of Governor-General 1.7 3.1 2.8 3.3
203-Department of Prime Minister & NEC 17.5 95.7 83.1 31.4
204-National Statistical Office 0.8 0.8 0.4 0.9
205-Office of Bougainville Affairs 0.9 1.0 0.6 1.3
206-Department of Finance 6.1 11.1 8.0 7.8
207-Treasury and Finance - Miscellaneous 1,154.5 1,644.8 791.6 670.1
208-Department of Treasury 15.1 63.4 59.0 57.3
209-Registrar For Political Parties 2.0 1.8 1.0 1.7
211-PNG Customs Service 16.8 15.7 8.1 0.9
212-Information Technology Division 7.0 6.7 3.4 2.5
213-Fire Services 3.9 3.2 1.7 1.9
216-Internal Revenue Commission 20.0 18.0 8.0 0.7
217-Department of Foreign Affairs and Trade 17.2 2.5 1.5 2.1
218-Office of the Public Prosecutor 1.6 1.6 1.1 1.1
219-PNG Institute of Public Administration 1.5 0.3 0.3 0.8
220-Department of Personnel Management 3.4 3.0 1.7 2.1
221-Public Service Commission 1.3 1.0 0.6 1.1
222-Office of the Public Solicitor 3.0 2.8 1.6 1.9
223-Judiciary Services 57.7 50.2 25.6 9.9
224-Magisterial Services 5.1 3.7 1.8 2.2
225-Department of Attorney-General 28.2 21.3 11.3 8.7
226-Department of Corrective Institutional Services 37.5 29.5 15.9 13.4
227-Provincial Treasuries 5.2 4.8 2.5 1.8
228-Department of Police 102.4 61.5 37.0 27.6
229-Department of National Planning and Monitoring 3.2 2.9 1.5 1.9
230-Electoral Commission 8.2 7.2 3.9 3.6
231-National Intelligence Organisation 1.5 1.3 0.7 1.1
232-Provincial and Local Government Affairs 4.9 11.8 10.6 3.7
233-Office of Censorship 0.4 1.2 1.1 1.6
234-Department of Defence 103.9 71.5 39.0 26.0
235-Department of Education 672.4 256.5 98.5 18.4
236-Department of Higher Education Research Science & Technology
56.8 56.6 36.3 28.0
238-Milne Bay Provincial Health Authority 5.3 4.6 2.1 2.6
239-Western Highlands Provincial Health Authority 6.0 3.9 1.8 2.0
240-Department of Health 194.7 191.0 95.6 87.3
241-Hospital Management Services 97.8 66.1 37.9 33.3
242-Department of Community Development 1.3 0.8 0.5 1.2
243-National Volunteer Services 0.7 0.6 0.3 1.0
244-Eastern Highlands Provincial Health Authority 5.5 4.4 2.2 2.2
245-Conservation and Environment Protection Authority 4.3 2.1 1.3 0.7
246-Office of Urbanization 0.1 0.1 0.1 0.8
247-Department of Agriculture and Livestock 2.3 2.9 2.0 1.4
249-New Ireland Provincial Health Authority 0.0 0.0 0.0 0.7
251-PNG Science & Technology Secretariat 0.9 0.9 0.5 1.1
252-Department of Lands and Physical Planning 17.6 16.7 8.0 5.7
253-West New Britain Provincial Health Authority 6.5 5.6 2.7 2.5
254-Department of Mineral Policy and Geo-hazard Management
6.1 6.1 5.8 3.8
255-Departmentof Petroleum and Energy 8.6 7.8 6.6 6.9
256-Manus Provincial Health Authority 5.0 4.7 2.4 2.3
257-Department of Public Enterprises 3.4 2.9 1.5 1.9
258-Department of Information and Communication 1.5 1.3 0.6 1.2
259-Department of Transport 6.5 5.2 2.8 2.7
260-Enga Provincial Health Authority 5.1 4.6 2.3 2.3
261-Department of Commerce and Industry 4.6 3.9 1.9 2.1
262-Department of Industrial Relations 6.9 6.1 4.4 4.3
263-National Tripartite Consultative Council 0.2 0.2 0.1 0.8
264-Department of Works and Implementation 168.4 148.9 111.4 93.6
266-Sandaun Provincial Health Authority 5.8 4.9 2.8 2.8
267-Department of Implementation and Rural Development
1.5 1.0 0.6 0.9
268-Central Supply & Tenders Board 0.8 0.7 0.4 0.8

6
Details 2017
Budget
2017 Rev.
Budget
Warrants as at 30th June
June Outturn
299-Treasury and Finance - Public Debt Charges 1,382.9 1,382.9 1,382.9 870.2
502-Office of the Auditor-General 5.7 5.7 2.4 3.1
503-Ombudsman Commission 5.6 6.0 3.8 2.3
505-National Research Institute 2.1 1.5 0.8 1.3
506-National Training Council 0.8 0.7 0.3 1.0
507-National Economic & Fiscal Commission 1.0 0.9 0.9 1.6
509-Border Development Authority (BDA) 1.1 1.9 1.5 2.1
510-Legal Training Institute 0.8 0.7 0.4 1.0
511-Papua New Guinea Climate Change Authority 3.3 2.7 1.1 1.8
512-University of Papua New Guinea 3.2 0.0 0.0 0.7
513-University of Technology 7.8 3.1 1.5 1.7
514-University of Goroka 1.4 0.5 0.3 0.9
515-University of Environment & Natural Resources 1.4 0.8 0.4 1.0
516-Papua New Guinea Sports Foundation 2.1 2.0 1.0 1.4
517-National Narcotics Bureau 0.4 0.4 0.0 0.7
518-PNG Maritime College 0.2 0.2 0.1 0.8
519-National Aids Council Secretariat 1.1 0.5 0.2 0.9
520-Institute of Medical Research 1.6 1.1 0.6 1.2
521-National Youth Commission 1.2 1.1 0.6 1.2
522-Constitutional and Law Reform Commission 0.6 0.4 0.2 0.9
523-Papua New Guinea Accidents Investigation Commission
0.7 0.2 0.1 0.8
525-National Broadcasting Commission 6.9 2.0 1.3 2.0
526-National Maritime Safety Authority 1.0 0.9 0.4 1.1
530-Investment Promotion Authority 2.2 2.2 1.1 1.6
531-Small Business Development Corporation 0.1 0.0 0.0 0.7
532-National Institute of Standards & Industrial Technology
1.9 1.6 0.7 1.1
533-Industrial Centres Development Corporation 0.1 0.1 0.0 0.7
536-Kokonas Indastri Koporesen 1.0 1.0 0.5 1.1
539-National Museum and Art Gallery 2.9 1.0 0.5 1.1
541-National Housing Corporation 0.1 0.1 0.1 0.8
542-National Cultural Commission 0.8 0.6 0.4 1.0
545-Rural Airstrip Authority 2.7 2.7 1.1 1.8
549-Office of Coastal Fisheries Development Agency 0.3 0.2 0.1 0.8
553-Fresh Produce Development Company 1.6 1.4 0.7 1.4
554-PNG Coffee Industry Corporation 1.3 1.1 0.6 1.2
557-PNG National Forest Authority 3.1 2.6 1.1 1.6
558-Tourism Promotion Authority 6.9 6.7 2.8 3.0
562-National Agriculture Research Institute 1.1 1.0 0.4 1.1
565-Civil Aviation Safety Authority 0.5 0.5 0.2 0.9
566-Cocoa Board 0.6 0.3 0.2 0.8
569-Independent Consumer and Competition Commission
2.0 1.6 0.7 1.3
571-Fly River Provincial Administration 39.4 39.4 10.9 0.7
572-Gulf Provincial Administration 23.7 23.7 5.0 0.7
573-Central Provincial Administration 31.4 31.4 9.0 3.4
574-National Capital District 103.3 103.3 34.4 0.1
575-Milne Bay Provincial Administration 34.0 34.0 9.5 3.5
576-Oro Provincial Administration 20.2 20.2 4.3 0.7
577-Southern Highlands Provincial Administration 20.8 20.8 6.3 2.3
578-Enga Provincial Administration 27.7 27.7 7.7 3.0
579-Western Highlands Provincial Administration 27.4 27.4 7.6 0.7
580-Simbu Provincial Administration 34.5 34.5 10.6 4.7
581-Eastern Highlands Provincial Administration 47.8 47.8 10.4 0.7
582-Morobe Provincial Administration 6.9 6.9 0.8 0.7
583-Madang Provincial Administration 47.9 47.9 13.3 0.7
584-East Sepik Provincial Administration 58.5 58.5 16.3 0.7
585-Sandaun Provincial Administration 38.8 38.8 10.6 0.7
586-Manus Provincial Administration 8.0 8.0 2.2 1.4
587-New Ireland Provincial Administration 4.2 4.2 1.0 1.0
588-East New Britain Provincial Administration 33.4 33.4 7.1 0.7
589-West New Britain Provincial Administration 14.1 14.1 3.9 2.0
590-Autonomous Bougainville Administration 21.8 24.3 7.6 0.7
591-Hela Provincial Administration 21.8 21.8 6.3 2.9
592-Jiwaka Provincial Administration 25.6 25.6 13.0 11.0
Capital Investment 2,592.3 2,614.6 765.7 366.1
Personnel Emoluments 26.8 26.8 26.7 1.2
206-Department of Finance 0.3 0.3 0.2 0.9

7
Details 2017
Budget
2017 Rev.
Budget
Warrants as at 30th June
June Outturn
229-Department of National Planning and Monitoring 25.9 25.9 25.9 0.0
247-Department of Agriculture and Livestock 0.4 0.4 0.4 0.1
516-Papua New Guinea Sports Foundation 0.0 0.0 0.0 0.0
536-Kokonas Indastri Koporesen 0.2 0.2 0.2 0.2
Goods & Services 2,565.5 2,587.8 739.0 364.9
202-Office of Governor-General 2.0 2.0 2.0 0.0
204-National Statistical Office 4.0 4.0 2.4 1.9
206-Department of Finance 12.7 12.7 3.8 2.1
208-Department of Treasury 121.0 151.0 31.0 31.0
211-PNG Customs Service 5.0 5.0 5.0 0.0
213-Fire Services 2.0 2.0 1.0 0.0
216-Internal Revenue Commission 10.0 10.0 4.0 0.0
223-Judiciary Services 82.5 82.5 40.0 0.0
224-Magisterial Services 2.5 2.5 1.5 1.0
225-Department of Attorney-General 3.0 3.0 1.3 1.1
226-Department of Corrective Institutional Services 5.0 5.0 5.0 1.0
228-Department of Police 10.0 0.0 0.0 0.0
229-Department of National Planning and Monitoring 84.0 64.0 57.5 17.9
232-Provincial and Local Government Affairs 2.0 2.0 1.5 0.1
234-Department of Defence 10.0 10.0 0.0 0.0
235-Department of Education 19.5 19.5 15.5 2.1
236-Department of Higher Education Research Science & Technology
52.5 52.5 42.5 18.1
240-Department of Health 30.0 30.0 13.4 3.5
241-Hospital Management Services 68.0 68.0 34.0 5.0
242-Department of Community Development 1.5 21.5 6.5 1.9
245-Conservation and Environment Protection Authority 1.5 1.5 1.5 0.0
247-Department of Agriculture and Livestock 1.6 1.6 0.6 0.2
251-PNG Science & Technology Secretariat 0.5 0.5 0.4 0.4
254-Department of Mineral Policy and Geo-hazard Management
2.0 2.0 1.5 0.2
255-Departmentof Petroleum and Energy 6.0 6.0 2.0 0.5
258-Department of Information and Communication 1.5 1.5 1.5 1.5
261-Department of Commerce and Industry 9.0 9.0 2.3 1.9
262-Department of Industrial Relations 3.0 3.0 1.0 0.2
264-Department of Works and Implementation 273.0 263.0 136.0 112.7
267-Department of Implementation and Rural Development
53.0 53.0 0.0 0.0
503-Ombudsman Commission 1.0 1.0 1.0 0.5
511-Papua New Guinea Climate Change Authority 1.0 1.0 1.0 1.0
512-University of Papua New Guinea 20.0 20.0 12.0 10.0
513-University of Technology 10.0 10.0 6.0 5.0
514-University of Goroka 1.0 1.0 1.0 0.0
515-University of Environment & Natural Resources 5.0 5.0 1.0 0.0
516-Papua New Guinea Sports Foundation 26.0 26.0 15.7 5.7
518-PNG Maritime College 4.0 4.0 0.0 0.0
522-Constitutional and Law Reform Commission 1.0 1.0 0.2 0.2
524-Independent Public Business Corporation 2.5 2.5 2.5 2.5
526-National Maritime Safety Authority 1.0 1.0 0.2 0.2
531-Small Business Development Corporation 2.0 2.0 2.0 0.3
532-National Institute of Standards & Industrial Technology
1.0 1.0 0.6 0.6
535-Mineral Resources Authority 7.0 7.0 4.2 0.0
536-Kokonas Indastri Koporesen 13.9 13.9 13.7 8.7
537-National Airports Corporation 47.5 47.5 40.0 16.0
538-Papua New Guinea Air Services Limited 5.0 5.0 3.0 0.0
539-National Museum and Art Gallery 5.0 5.0 5.0 0.0
541-National Housing Corporation 7.0 7.0 3.5 3.5
543-National Development Bank 35.0 35.0 26.0 12.0
546-PNG Power Limited 13.0 13.0 10.5 2.0
547-Telikom (PNG) Limited 2.0 2.0 2.0 0.0
551-National Fisheries Authority 15.0 15.0 4.0 2.0
553-Fresh Produce Development Company 5.0 5.0 5.0 5.0
554-PNG Coffee Industry Corporation 14.2 14.2 14.2 14.2
557-PNG National Forest Authority 2.0 2.0 1.0 0.5
558-Tourism Promotion Authority 15.0 15.0 10.0 2.6
562-National Agriculture Research Institute 5.0 5.0 1.5 0.0
563-National Agriculture Quarantine & Inspection Authority
5.0 5.0 3.0 0.5

8
Details 2017
Budget
2017 Rev.
Budget
Warrants as at 30th June
June Outturn
566-Cocoa Board 13.0 13.0 13.0 10.0
567-National Road Authority 20.0 20.0 12.0 2.5
571-Fly River Provincial Administration 46.4 46.4 0.0 0.0
572-Gulf Provincial Administration 32.5 32.5 0.0 0.0
573-Central Provincial Administration 52.4 52.4 0.5 0.0
574-National Capital District 63.1 68.1 15.5 2.5
575-Milne Bay Provincial Administration 54.0 54.0 0.5 0.5
576-Oro Provincial Administration 31.6 31.6 1.0 1.0
577-Southern Highlands Provincial Administration 75.7 77.3 12.0 10.6
578-Enga Provincial Administration 67.7 69.7 3.5 3.5
579-Western Highlands Provincial Administration 53.0 53.0 1.0 1.0
580-Simbu Provincial Administration 73.2 73.7 2.5 2.0
581-Eastern Highlands Provincial Administration 95.6 95.6 6.5 3.5
582-Morobe Provincial Administration 106.7 106.7 2.0 2.0
583-Madang Provincial Administration 84.5 84.5 3.0 1.0
584-East Sepik Provincial Administration 79.5 80.0 1.0 0.5
585-Sandaun Provincial Administration 58.2 60.7 7.0 1.5
586-Manus Provincial Administration 21.3 21.3 0.0 0.0
587-New Ireland Provincial Administration 35.9 35.9 0.5 0.5
588-East New Britain Provincial Administration 58.9 58.9 2.5 0.5
589-West New Britain Provincial Administration 31.1 31.1 0.0 0.0
590-Autonomous Bougainville Administration 120.6 120.7 23.5 11.5
591-Hela Provincial Administration 98.5 98.5 25.5 11.5
592-Jiwaka Provincial Administration 41.8 41.8 1.5 1.5
Donor Grants 968.1 968.1 0.0 387.2
Goods & Services 968.1 968.1 0.0 387.2
Concessional Loans 452.8 452.8 0.0 91.9
Goods & Services 452.8 452.8 0.0 91.9
Grand Total 12,970.2 12,970.2 5,227.4 5,225.8
Source: Department of Treasury.

9
Attachment C:
COMMERCIAL STATUTORY AGENCY BUDGET EXPENDITURE MYEFO 2017 (KINA, MILLION)
Details 2017
Budget 2017 Rev.
Budget Warrants as at 30th June
June Outturn
Operational 360.6 350.1 177.2 144.6
Personnel Emoluments 281.3 292.0 148.3 121.3
501-Konebada Petroleum Park Authority 0.0 2.0 0.3 0.0
502-Office of the Auditor-General 11.5 11.5 5.8 4.8
503-Ombudsman Commission 12.1 12.1 6.1 4.0
505-National Research Institute 3.0 3.0 1.5 1.2
506-National Training Council 0.9 0.9 0.4 0.5
507-National Economic & Fiscal Commission 1.8 1.8 0.8 0.1
509-Border Development Authority (BDA) 1.9 1.9 1.0 0.8
510-Legal Training Institute 1.6 1.6 0.8 0.7
511-Papua New Guinea Climate Change Authority 3.4 3.4 1.4 2.2
512-University of Papua New Guinea 46.0 54.7 34.4 27.2
513-University of Technology 32.6 32.6 19.0 14.0
514-University of Goroka 17.2 17.2 8.6 5.7
515-University of Environment & Natural Resources 16.6 16.6 8.3 5.5
516-Papua New Guinea Sports Foundation 5.5 5.5 2.8 2.3
517-National Narcotics Bureau 2.1 2.1 1.0 1.0
518-PNG Maritime College 3.7 3.7 1.9 1.6
519-National Aids Council Secretariat 7.1 7.1 3.5 2.9
520-Institute of Medical Research 8.4 8.4 4.2 3.5
521-National Youth Commission 1.6 1.6 .8 1.3
522-Constitutional and Law Reform Commission 2.4 2.4 1.2 0.8
523-Papua New Guinea Accidents Investigation Commission
4.4 4.4 1.8 1.8
525-National Broadcasting Commission 15.7 15.7 6.5 6.5
526-National Maritime Safety Authority 1.4 1.4 0.7 0.6
531-Small Business Development Corporation 2.5 2.5 1.3 1.1
532-National Institute of Standards & Industrial Technology
2.0 2.0 0.9 1.2
533-Industrial Centres Development Corporation 2.1 2.1 1.0 0.9
536-Kokonas Indastri Koporesen 0.1 0.1 0.0 0.0
539-National Museum and Art Gallery 3.7 3.7 1.8 1.4
541-National Housing Corporation .0 .0 .0 -.7
542-National Cultural Commission 2.7 2.7 1.3 1.5
549-Office of Coastal Fisheries Development Agency 1.8 1.8 0.8 0.1
550-Cocoa Coconut Institute Ltd 4.3 4.3 2.2 1.8
551-National Fisheries Authority 0.0 0.0 0.0 0.0
553-Fresh Produce Development Company 3.2 3.2 1.6 1.6
554-PNG Coffee Industry Corporation 1.8 1.8 0.9 0.8
557-PNG National Forest Authority 20.0 20.0 8.3 6.7
558-Tourism Promotion Authority 2.0 2.0 0.8 0.7
562-National Agriculture Research Institute 7.2 7.2 3.0 3.0
563-National Agriculture Quarantine & Inspection Authority
8.2 8.2 3.4 4.8
565-Civil Aviation Safety Authority 9.9 9.9 4.1 4.1
566-Cocoa Board 3.3 3.3 1.6 1.4
569-Independent Consumer and Competition Commission 5.6 5.6 2.3 1.8
Goods & Services 79.3 58.2 28.8 23.3
502-Office of the Auditor-General 5.7 5.7 2.4 2.4
503-Ombudsman Commission 5.6 6.0 3.8 1.6
505-National Research Institute 2.1 1.5 0.8 0.6
506-National Training Council 0.8 0.7 0.3 0.3
507-National Economic & Fiscal Commission 1.0 0.9 0.9 0.9
509-Border Development Authority (BDA) 1.1 1.9 1.5 1.4
510-Legal Training Institute 0.8 0.7 0.4 0.3
511-Papua New Guinea Climate Change Authority 3.3 2.7 1.1 1.1
512-University of Papua New Guinea 3.2 0.0 0.0 0.0
513-University of Technology 7.8 3.1 1.5 1.0
514-University of Goroka 1.4 0.5 0.3 0.2
515-University of Environment & Natural Resources 1.4 0.8 0.4 0.3
516-Papua New Guinea Sports Foundation 2.1 2.0 1.0 0.7
517-National Narcotics Bureau 0.4 0.4 0.0 0.0
518-PNG Maritime College 0.2 0.2 0.1 0.1
519-National Aids Council Secretariat 1.1 0.5 0.2 0.2
520-Institute of Medical Research 1.6 1.1 0.6 0.5
521-National Youth Commission 1.2 1.1 0.6 0.5
522-Constitutional and Law Reform Commission 0.6 0.4 0.2 0.2

10
Details 2017
Budget 2017 Rev.
Budget Warrants as at 30th June
June Outturn
523-Papua New Guinea Accidents Investigation Commission
0.7 0.2 0.1 0.1
525-National Broadcasting Commission 6.9 2.0 1.3 1.3
526-National Maritime Safety Authority 1.0 0.9 0.4 0.4
530-Investment Promotion Authority 2.2 2.2 1.1 0.9
531-Small Business Development Corporation 0.1 0.0 0.0 0.0
532-National Institute of Standards & Industrial Technology
1.9 1.6 0.7 0.4
533-Industrial Centres Development Corporation 0.1 0.1 0.0 0.0
536-Kokonas Indastri Koporesen 1.0 1.0 0.5 0.4
539-National Museum and Art Gallery 2.9 1.0 0.5 0.4
541-National Housing Corporation 0.1 0.1 0.1 0.1
542-National Cultural Commission 0.8 0.6 0.4 0.3
545-Rural Airstrip Authority 2.7 2.7 1.1 1.1
549-Office of Coastal Fisheries Development Agency 0.3 0.2 0.1 0.1
553-Fresh Produce Development Company 1.6 1.4 0.7 0.7
554-PNG Coffee Industry Corporation 1.3 1.1 0.6 0.5
557-PNG National Forest Authority 3.1 2.6 1.1 0.9
558-Tourism Promotion Authority 6.9 6.7 2.8 2.3
562-National Agriculture Research Institute 1.1 1.0 0.4 0.4
565-Civil Aviation Safety Authority 0.5 0.5 0.2 0.2
566-Cocoa Board 0.6 0.3 0.2 0.1
569-Independent Consumer and Competition Commission 2.0 1.6 0.7 0.6
Capital Investment 305.2 305.2 214.9 105.5
Personnel Emoluments 0.2 0.2 0.2 0.1
516-Papua New Guinea Sports Foundation 0.0 0.0 0.0 0.0
536-Kokonas Indastri Koporesen 0.2 0.2 0.2 0.2
Goods & Services 305.0 305.0 214.8 105.4
503-Ombudsman Commission 1.0 1.0 1.0 0.5
511-Papua New Guinea Climate Change Authority 1.0 1.0 1.0 1.0
512-University of Papua New Guinea 20.0 20.0 12.0 10.0
513-University of Technology 10.0 10.0 6.0 5.0
514-University of Goroka 1.0 1.0 1.0 0.0
515-University of Environment & Natural Resources 5.0 5.0 1.0 0.0
516-Papua New Guinea Sports Foundation 26.0 26.0 15.7 5.7
518-PNG Maritime College 4.0 4.0 0.0 0.0
522-Constitutional and Law Reform Commission 1.0 1.0 0.2 0.2
524-Independent Public Business Corporation 2.5 2.5 2.5 2.5
526-National Maritime Safety Authority 1.0 1.0 0.2 0.2
531-Small Business Development Corporation 2.0 2.0 2.0 0.3
532-National Institute of Standards & Industrial Technology
1.0 1.0 0.6 0.6
535-Mineral Resources Authority 7.0 7.0 4.2 0.0
536-Kokonas Indastri Koporesen 13.9 13.9 13.7 8.7
537-National Airports Corporation 47.5 47.5 40.0 16.0
538-Papua New Guinea Air Services Limited 5.0 5.0 3.0 0.0
539-National Museum and Art Gallery 5.0 5.0 5.0 00.0
541-National Housing Corporation 7.0 7.0 3.5 3.5
543-National Development Bank 35.0 35.0 26.0 12.0
546-PNG Power Limited 13.0 13.0 10.5 2.0
547-Telikom (PNG) Limited 2.0 2.0 2.0 0.0
551-National Fisheries Authority 15.0 15.0 4.0 2.0
553-Fresh Produce Development Company 5.0 5.0 5.0 5.0
554-PNG Coffee Industry Corporation 14.2 14.2 14.2 14.2
557-PNG National Forest Authority 2.0 2.0 1.0 0.5
558-Tourism Promotion Authority 15.0 15.0 10.0 2.6
562-National Agriculture Research Institute 5.0 5.0 1.5 0.0
563-National Agriculture Quarantine & Inspection Authority
5.0 5.0 3.0 0.5
566-Cocoa Board 13.0 13.0 13.0 10.0
567-National Road Authority 20.0 20.0 12.0 2.5
Donor Grants 61.7 61.7 0.0 0.0
Goods & Services 61.7 61.7 0.0 0.0
506-National Training Council 35.9 35.9 0.0 0.0
516-Papua New Guinea Sports Foundation 7.2 7.2 0.0 0.0
546-PNG Power Limited 8.0 8.0 0.0 0.0
553-Fresh Produce Development Company 7.5 7.5 0.0 0.0
557-PNG National Forest Authority 3.1 3.1 0.0 0.0
Concessional Loans 233.7 233.7 0.0 0.0
Goods & Services 233.7 233.7 0.0 0.0

11
Details 2017
Budget 2017 Rev.
Budget Warrants as at 30th June
June Outturn
509-Border Development Authority (BDA) 4.6 4.6 0.0 0.0
511-Papua New Guinea Climate Change Authority 3.6 3.6 0.0 0.0
524-Independent Public Business Corporation 75.0 75.0 0.0 0.0
526-National Maritime Safety Authority 8.2 8.2 0.0 0.0
537-National Airports Corporation 66.3 66.3 0.0 0.0
546-PNG Power Limited 68.6 68.6 0.0 0.0
547-Telikom (PNG) Limited 4.5 4.5 0.0 0.0
558-Tourism Promotion Authority 2.9 2.9 0.0 0.0
Grand Total 961.2 950.7 392.1 250.1
Source: Department of Treasury.

12
Attachment D:
PROVINCIAL ADMINISTRATION BUDGET EXPENDITURE MYEFO 2017 (KINA, MILLION)
Details 2017
Budget 2017 Rev.
Budget Warrant as
at 30th June
June Outturn
Operational 2,208.5 2,211.0 451.4 864.4
Personnel Emoluments 1,517.3 1,517.3 253.3 836.4
571-Fly River Provincial Administration 51.6 51.6 10.8 28.8
572-Gulf Provincial Administration 29.8 29.8 6.4 15.8
573-Central Provincial Administration 61.6 61.6 11.1 38.1
574-National Capital District 0.0 0.0 0.0 0.0
575-Milne Bay Provincial Administration 69.6 69.6 12.4 33.6
576-Oro Provincial Administration 38.0 38.0 7.0 19.1
577-Southern Highlands Provincial Administration 92.1 92.1 13.0 60.3
578-Enga Provincial Administration 65.5 65.5 11.2 42.1
579-Western Highlands Provincial Administration 90.4 90.4 14.3 49.4
580-Simbu Provincial Administration 80.9 80.9 13.7 44.0
581-Eastern Highlands Provincial Administration 95.0 95.0 17.2 51.3
582-Morobe Provincial Administration 160.5 160.5 21.5 88.4
583-Madang Provincial Administration 113.2 113.2 19.4 62.6
584-East Sepik Provincial Administration 84.3 84.3 16.9 51.4
585-Sandaun Provincial Administration 55.1 55.1 11.3 27.9
586-Manus Provincial Administration 28.8 28.8 4.5 14.7
587-New Ireland Provincial Administration 58.8 58.8 7.8 29.3
588-East New Britain Provincial Administration 91.6 91.6 15.2 51.3
589-West New Britain Provincial Administration 67.7 67.7 10.5 30.2
590-Autonomous Bougainville Administration 106.0 106.0 15.9 46.5
591-Hela Provincial Administration 34.8 34.8 6.8 23.8
592-Jiwaka Provincial Administration 41.8 41.8 6.2 27.6
Goods & Services 691.3 693.8 198.1 28.1
571-Fly River Provincial Administration 39.4 39.4 10.9 0.0
572-Gulf Provincial Administration 23.7 23.7 5.0 0.0
573-Central Provincial Administration 31.4 31.4 9.0 2.7
574-National Capital District 103.3 103.3 34.4 0.0
575-Milne Bay Provincial Administration 34.0 34.0 9.5 2.8
576-Oro Provincial Administration 20.2 20.2 4.3 0.0
577-Southern Highlands Provincial Administration 20.8 20.8 6.3 1.6
578-Enga Provincial Administration 27.7 27.7 7.7 2.3
579-Western Highlands Provincial Administration 27.4 27.4 7.6 0.0
580-Simbu Provincial Administration 34.5 34.5 10.6 4.0
581-Eastern Highlands Provincial Administration 47.8 47.8 10.4 0.0
582-Morobe Provincial Administration 6.9 6.9 .8 0.0
583-Madang Provincial Administration 47.9 47.9 13.3 0.0
584-East Sepik Provincial Administration 58.5 58.5 16.3 0.0
585-Sandaun Provincial Administration 38.8 38.8 10.6 0.0
586-Manus Provincial Administration 8.0 8.0 2.2 0.7
587-New Ireland Provincial Administration 4.2 4.2 1.0 0.3
588-East New Britain Provincial Administration 33.4 33.4 7.1 0.0
589-West New Britain Provincial Administration 14.1 14.1 3.9 1.3
590-Autonomous Bougainville Administration 21.8 24.3 7.6 0.0
591-Hela Provincial Administration 21.8 21.8 6.3 2.2
592-Jiwaka Provincial Administration 25.6 25.6 13.0 10.3
Capital Investment 1,382.3 1,394.3 109.5 55.0
Goods & Services 1,382.3 1,394.3 109.5 55.0
571-Fly River Provincial Administration 46.4 46.4 0.0 0.0
572-Gulf Provincial Administration 32.5 32.5 0.0 0.0
573-Central Provincial Administration 52.4 52.4 0.5 0.0
574-National Capital District 63.1 68.1 15.5 2.5
575-Milne Bay Provincial Administration 54.0 54.0 0.5 0.5
576-Oro Provincial Administration 31.6 31.6 1.0 1.0
577-Southern Highlands Provincial Administration 75.8 77.3 12.0 10.5
578-Enga Provincial Administration 67.7 69.7 3.5 3.5
579-Western Highlands Provincial Administration 53.0 53.0 1.0 1.0
580-Simbu Provincial Administration 73.2 73.7 2.5 2.0
581-Eastern Highlands Provincial Administration 95.6 95.6 6.5 3.5
582-Morobe Provincial Administration 106.7 106.7 2.0 2.0
583-Madang Provincial Administration 84.5 84.5 3.0 1.0
584-East Sepik Provincial Administration 79.5 80.0 1.0 0.5
585-Sandaun Provincial Administration 58.2 60.7 7.0 1.5
586-Manus Provincial Administration 21.3 21.3 0.0 0.0
587-New Ireland Provincial Administration 35.9 35.9 0.5 0.5

13
Details 2017
Budget 2017 Rev.
Budget Warrant as
at 30th June
June Outturn
588-East New Britain Provincial Administration 58.9 58.9 2.5 0.5
589-West New Britain Provincial Administration 31.1 31.1 0.0 0.0
590-Autonomous Bougainville Administration 120.7 120.7 23.5 11.5
591-Hela Provincial Administration 98.5 98.5 25.5 11.5
592-Jiwaka Provincial Administration 41.8 41.8 1.5 1.5
Grand Total 3,590.8 3,605.2 560.9 919.4
Source: Department of Treasury.

14
Attachment E:
MOVEMENTS IN SECTION 4 TRANSFERS
Date
Dept
Particulars /Description
Section 4
Transfer Within Transfer Out Transfer In
Dept Amount Dept Amount Dept Amount
18/01/2017 225 To rectify budget errors. 225 2,142,300
20/01/2017 226 Transfer to correct 2017 Budget errors 226 12,757,900
20/01/2017 235 Transfer to cater for TFF 207 -75,000,000 235 75,000,000
24/01/2017 223 To rectify 2017 budget errors. 223 4,689,000
24/01/2017 224 To rectify 2017 budget error. 224 2,188,800
25/01/2017 512 Transfer to cater for PE Awards 207 -5,500,000 512 5,500,000
26/01/2017 512 Rectify contra - entry. 207 -11,000,000 512 11,000,000
26/01/2017 217 transfer to Finance as per BMC 207 -6,727,500 217 6,727,500
1/02/2017 208 6 months wages- short-term contracts/GDPs 208 864,100
1/02/2017 232 purchase Secretary's vehicle 232 195,333
2/02/2017 234 Transfer to correct 2017 Budget errors 234 28,454,630
6/02/2017 235 TFF 207 -37,500,000 235 37,500,000
6/02/2017 257 CSTB & Public Enterprise 208 -3,000,000 257 3,000,000
9/02/2017 207 To Cater for NES staff unbudgeted PE 203 -1,000,000 207 1,000,000
10/02/2017 232 purchase support vehicle for Secretary 232 16,700
13/02/2017 252 Transfer to settle OS Security Bills. 252 1,029,850
13/02/2017 208 Freda Mine LO Meeting - Hon. Mirisim req. 207 -400,000 208 400,000
13/02/2017 228 Rectify budget error 228 12,650,000
14/02/2017 207 To pay o/s overtime for Sec Per & Staff 202 -976,400 207 976,400
20/02/2017 236 Transfer from TESAS vote to Overseas Sch. 236 1,000,000
23/02/2017 228 To cater for travel expense 228 70,000
23/02/2017 205 To cater for Rec leave fares 205 90,000
24/02/2017 207 To offset SA funds as direct by Secretary
2/03/2017 207 Trfer to NCOBA - Minister's Support Fund 205 -250,000 207 250,000
2/03/2017 217 from Dofa to Foreign vote in 207 207 -27,096,497 217 27,096,497
10/03/2017 207 Apec Preparations 203 -50,000,000 207 50,000,000
13/03/2017 241 Transfer funds to go directly to POMGEN 207 -24,758,410 241 24,758,410
14/03/2017 255 To cover for wages for casuals/contr. off 255 124,179
16/03/2017 206 SA Doc file name 00283129 refer to 10049 206 5,000,000
16/03/2017 206 Contra Entry to Doc 00284351 206 5,000,000
16/03/2017 235 Transfer TFF funds to Division 207 Finance 207
-187,500,000 235 187,500,000
16/03/2017 207 To cater for COI Land purchase by Defence 203 -1,500,000 207 1,500,000
27/03/2017 585 Correction to Section 3 mvnt SA #2649 584 -2,000,000 585 2,000,000
30/03/2017 208 to support the work of internal APEC Team 207 -500,000 208 500,000
4/04/2017 232 Disaster Office -DPLLG 207 -1,186,000 232 1,186,000
4/04/2017 220 Retrenchment - DPM 2017 207 -5,000,000 220 5,000,000
4/04/2017 522 Centralise Utility Payment arrangement 207 -96,925,011 522 96,925,011
4/04/2017 590 To cater for MV NUKUMANU's maintenance 207 -2,504,000 590 2,504,000
5/04/2017 209 Transfer of K160,000 to be centralized 207 -160,000 209 160,000
7/04/2017 569 207 -25,906,845 569 25,906,845
11/04/2017 207 for Sir Somare's farewell 201 -1,000,000 207 1,000,000
11/04/2017 512 Transfer from 207 to cater 7.5% increment 207 -3,200,000 512 3,200,000

15
Date
Dept
Particulars /Description
Section 4
Transfer Within Transfer Out Transfer In
Dept Amount Dept Amount Dept Amount
19/04/2017 241 Transfer utilities item to 207 Finance & 207 -19,567,558 241 19,567,558
20/04/2017 255 Correction to SA 2640 255 43,000
20/04/2017 244 Transfer of utilities 231 to 207 Finance 207 -12,337,358 244 12,337,358
20/04/2017 542 Transfer utilities item to Finance 207 -15,924,460 542 15,924,460
21/04/2017 509 utilities centralised 201 -21,811,488 509 21,811,488
24/04/2017 241 Transfer of utilities to 207 Finance 207 -777,000 241 777,000
27/04/2017 208 To cater for Treasury o/s & PM's l/bills 207 -6,405,300 208 6,405,300
27/04/2017 208 Contra entry (appro. fully released) 208 165,000
28/04/2017 213 Transfer to Transport Fuel & Rental item 213 394,200
28/04/2017 208 To cater for shortfall. 208 165,000
28/04/2017 207 Cover Australian PM's visit to PNG. 203 -3,000,000 207 3,000,000
1/05/2017 207 PM's commitment for Pacific Islands 203 -8,800,000 207 8,800,000
2/05/2017 574 To cater for UPNG Dormitories 207 -5,000,000 574 5,000,000
8/05/2017 225 Settle utilities with landlords. 207 -1,396,000 225 1,396,000
8/05/2017 234 Leave fares and operational activities 234 497,000
9/05/2017 207 Operational purposes directed by Chief S 203 -5,000,000 207 5,000,000
9/05/2017 207 To settle o/s transition expenditures 202 -869,000 207 869,000
16/05/2017 235 Transfer of TFF to 207 Finance & Treasury 207
-112,500,000 235 112,500,000
16/05/2017 236 Transfer for overtime 236 6,000
17/05/2017 228 Cater for red Sea Housing o/s invoices. 208 -10,000,000 228 10,000,000
18/05/2017 259 to purchase heavy duty printer 259 30,000
23/05/2017 235 Transfer to cater for Secretary official 235 386,300
24/05/2017 578 To cater for PM's commitment to Wabag 207 -2,000,000 578 2,000,000
24/05/2017 207 O/S Allowances & related costs for Hela 203 -5,200,000 207 5,200,000
26/05/2017 247 Payment for Koo Management-Contractual 207 -1,000,000 247 1,000,000
29/05/2017 228 Transfer to Treasury as agreed by Police 208 -5,000,000 228 5,000,000
5/06/2017 264 Trf within to cater for Copier bill Security 220 -99,300 264 99,300
6/06/2017 232 Transfer for Deputy Prime Minister commit 207 -2,800,000 232 2,800,000
15/06/2017 207 to facilitate GG's trip to London 202 -1,100,000 207 1,100,000
16/06/2017 207 To replenish PMs commitment 207 310,000
16/06/2017 577 To cater for Mendi Quarry Development 207 -1,500,000 577 1,500,000
19/06/2017 242 transfer to Comm. Dev for rollouts 229 -20,000,000 242 20,000,000
19/06/2017 207 settle Multi Dept Office Accom.'s rental 207 20,000,000
19/06/2017 206 To fund APC Secretariat 206 80,000
20/06/2017 203 Reversal of Section 3 Movement to PM&NEC
21/06/2017 264 To cater for OS Contractual Payment 208 -20,000,000 264 20,000,000
21/06/2017 228 To cater for outstanding OT payments. 228 200,000
21/06/2017 501 Transfer of KPPA funds to KPPA 207 -2,000,000 501 2,000,000
22/06/2017 207 To Parliament for Transitional arrangement 201 -6,000,000 207 6,000,000
26/06/2017 232 To cater for LLG allowances 207 -4,000,000 232 4,000,000
26/06/2017 208 Reversal of Section 3 Movnt # 2710
Total 98,549,292 -
864,678,127 864,678,127
Source: Department of Treasury.
Attachment F:

16
GOODS & SERVICES AND PERSONNEL EMOLUNMENTS EXPENDITURE MYEFO 2017 BY ACCOUNT TYPE (KINA,
MILLION)
Details 2017 Original Budget
2017 Revised Budget
Warrants as at 30th June
June Outturn
Personnel Emoluments 3,874.6 3,846.3 1,303.8 2,200.2
Operational 3,847.9 3,819.5 1,277.2 2,199.1
ABG Community A 1.5 1.5 0.3 0.0
ABG Electoral C 1.7 1.7 0.4 0.0
Ed Benefit 5.1 2.8 1.9 0.8
Gratuity 0.0 0.0 0.0 0.0
L/Fare-Cont 0.0 0.0 0.0 0.0
Land Mediators 0.0 0.0 0.0 0.0
Leave fares 55.1 63.1 41.7 23.2
MPs 52.2 52.2 26.9 23.7
Overtime 13.2 20.3 11.7 14.4
Parlimentary Se 9.0 9.0 2.0 0.0
Payroll Cost 0.0 0.0 0.0 1.3
PS Leave Fare 13.7 13.7 2.5 0.3
Retirement 358.4 382.1 108.7 221.4
Sal & Allow 1,738.4 1,672.6 772.9 1,857.4
Staffing Grants 353.6 353.6 43.4 1.8
Teach Leave 29.1 29.1 6.6 2.2
Teacher Sal Gr 1,108.6 1,108.6 198.0 1.4
Wages Allow 108.3 109.2 60.1 51.1
Capital Investment 26.7 26.7 26.6 1.1
L/Fare-Cont 0.0 0.0 0.0 0.0
Leave fares 0.0 0.0 0.0 0.0
Overtime 0.0 0.0 0.0 0.0
Payroll Cost 0.0 0.0 0.0 0.0
Sal & Allow 26.1 26.1 26.0 0.8
Wages Allow 0.6 0.6 0.6 0.3
Goods & Services 9,095.6 9,124.0 3,923.8 1,761.3
Operational 5,109.0 5,115.4 3,184.8 1,396.4
ABG Chief Tax C 2.5 2.5 0.6 0.0
Admin Grant 32.0 32.0 9.3 1.7
Admin-Con 30.5 33.0 20.0 11.8
Advertising etc 0.0 0.0 0.0 0.0
Audit/Actg 0.0 0.0 0.0 0.0
Bank Charges 0.0 0.0 0.0 0.0
Books etc. 0.0 0.0 0.0 0.0
C/Gr-SA & PA 640.2 642.7 351.7 296.3
Catering-Cont 0.0 0.0 0.0 0.0
Court Order Pay 0.0 0.0 0.0 0.0
CRI 6.8 5.3 3.9 2.2
Dom - Allow 0.0 0.0 0.0 0.1
Dom - Tuition 0.0 0.0 0.0 0.0
Dom Loan Exp 0.3 0.3 0.3 0.1
Dom Travel 18.6 18.6 10.7 4.7
Dom. Int 1,297.8 1,297.8 1,231.5 27.7
Dom-Accom 0.0 0.0 0.0 0.2
Dom-A'fare 0.0 0.0 0.0 0.0
Dom-Mat/Supply 0.0 0.0 0.0 0.0
Dom-Other 0.0 0.0 0.0 0.0
Dom-TA 0.0 0.0 0.0 0.6
Dom-Traing 0.0 0.0 0.0 0.0
Dom-Transport 0.0 0.0 0.0 0.1
Ed Function Gr 118.1 118.1 34.6 6.8
Feasibility 0.2 0.2 0.1 0.0
Fee/Ent. 0.0 0.0 0.0 20.6
Foreign Int. 167.9 167.9 167.9 64.3
Foreign Loan Ex 16.9 16.9 16.9 2.4
Fuel 0.0 0.0 0.0 0.0
Funct/Pwrs 0.4 0.4 0.1 0.0
G&S Gr-ABG 15.0 15.0 3.6 0.0
G/T-Ind/NGO 62.9 64.1 44.1 30.3
Health Funct Gr 112.2 112.2 32.8 5.9
ICT 1.4 1.4 0.9 0.7
Infrast. Grant 157.3 157.3 45.8 8.5
Insurance Prem 0.0 0.0 0.0 0.0
Int - T/Bills 0.0 0.0 0.0 78.4
Land & Buildg 12.8 11.7 3.8 1.1

17
Details 2017 Original Budget
2017 Revised Budget
Warrants as at 30th June
June Outturn
Land Mediation 1.4 1.4 0.4 0.1
LLG Vill Ser Gr 56.8 56.8 7.2 0.0
M Vehicle 4.1 3.1 0.6 0.6
Maint-ICT Inf 0.0 0.0 0.0 0.0
Maint-Rds/Bdg 0.0 0.0 0.0 1.2
Mileage 0.0 0.0 0.0 0.0
M'ship Fee 15.0 15.0 12.6 10.9
M'ship Fee-OS 0.0 0.0 0.0 0.0
MV Hire 0.0 0.0 0.0 0.0
MV Reg & Ins 0.0 0.0 0.0 0.0
O/Mat & Supp 20.6 20.2 11.4 6.4
O/Op Exp 0.0 0.0 0.0 0.1
Off Consume 0.0 0.0 0.0 0.0
Off Furn/Fitg 15.7 15.3 8.8 4.1
Op Exp (NP) 1,255.7 1,270.7 607.3 384.9
Op Exp/Mat 240.1 237.5 124.3 96.9
OS Training 0.0 0.0 0.0 0.0
O'seas travel 0.0 0.0 0.0 0.0
O'seas-Accom 0.0 0.0 0.0 0.4
O'seasA'fare 0.0 0.0 0.0 0.4
O'seas-Other 0.0 0.0 0.0 0.1
O'seas-TA 0.0 0.0 0.0 1.6
O'seas-TH 0.0 0.0 0.0 0.0
OSeas-Tuition 0.0 0.0 0.0 0.0
Overseas-Allow 0.0 0.0 0.0 0.0
P&S Gr-ABG 3.8 3.8 0.8 0.0
P/Euip/Mach 14.7 14.7 11.7 9.7
Prim Prod Gr 38.0 38.0 11.6 2.5
R/Maint 181.8 171.7 116.4 95.4
R/Maint-MV 0.0 0.0 0.0 0.0
R/Maint-Off Eq 0.0 0.0 0.0 0.0
R/Maint-Office 0.0 0.0 0.0 0.0
R/Maint-Resid 0.0 0.0 0.0 0.0
Rentals 126.4 139.5 109.3 19.4
Rent-Com 0.0 0.0 0.0 82.2
Serv Del Gr 43.3 43.3 12.3 2.2
Social Welf 0.0 0.0 0.0 0.0
SSM 11.8 8.3 4.6 3.0
Stat & Supply 0.0 0.0 0.0 0.0
Stationery 0.0 0.0 0.0 0.0
Tele/Tax 0.0 0.0 0.0 48.5
Town/Urban Serv 3.3 3.3 0.7 0.0
T'port & Fuel 0.0 0.0 0.0 0.0
T'port/Fuel-NP 51.4 45.8 28.7 19.9
Training 39.9 39.7 21.9 14.5
Travel & Sub 62.7 62.4 35.8 21.6
Utilities 221.8 220.6 77.7 4.4
Vill Courts Gr 7.3 7.3 2.0 0.3
Capital Investment 2,565.6 2,587.6 739.0 364.9
Admin-Con 9.1 9.1 4.4 1.9
Books etc. 0.0 0.0 0.0 0.0
C/Gr-SA & PA 287.3 287.3 40.5 22.5
CRI 711.4 693.4 402.0 195.6
Dom - Tuition 0.0 0.0 0.0 0.0
Dom Travel 1.9 1.9 1.6 1.1
Dom-Accom 0.0 0.0 0.0 0.0
Dom-A'fare 0.0 0.0 0.0 0.0
Dom-Mat/Supply 0.0 0.0 0.0 0.0
Dom-Other 0.0 0.0 0.0 0.0
Dom-TA 0.0 0.0 0.0 0.0
Dom-Transport 0.0 0.0 0.0 0.0
Feasibility 4.1 4.1 1.0 0.0
Fee/Ent. 0.0 0.0 0.0 17.7
G/T-Ind/NGO 15.4 15.4 9.7 5.7
ICT 2.8 2.8 1.4 0.2
Land & Buildg 1.0 1.0 0.5 0.0
M Vehicle 0.2 0.2 0.2 0.2
O/Mat & Supp 0.8 0.8 0.7 0.6
Off Consume 0.0 0.0 0.0 0.0
Off Furn/Fitg 0.6 0.6 0.6 0.6
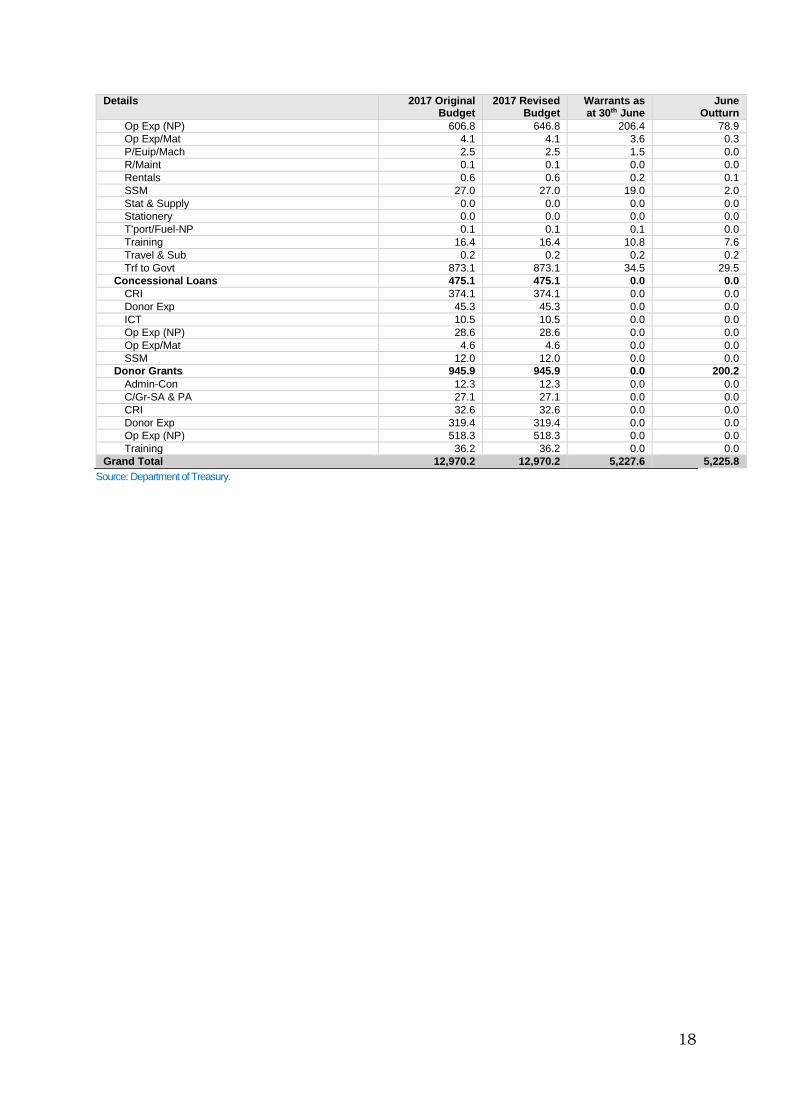
18
Details 2017 Original Budget
2017 Revised Budget
Warrants as at 30th June
June Outturn
Op Exp (NP) 606.8 646.8 206.4 78.9
Op Exp/Mat 4.1 4.1 3.6 0.3
P/Euip/Mach 2.5 2.5 1.5 0.0
R/Maint 0.1 0.1 0.0 0.0
Rentals 0.6 0.6 0.2 0.1
SSM 27.0 27.0 19.0 2.0
Stat & Supply 0.0 0.0 0.0 0.0
Stationery 0.0 0.0 0.0 0.0
T'port/Fuel-NP 0.1 0.1 0.1 0.0
Training 16.4 16.4 10.8 7.6
Travel & Sub 0.2 0.2 0.2 0.2
Trf to Govt 873.1 873.1 34.5 29.5
Concessional Loans 475.1 475.1 0.0 0.0
CRI 374.1 374.1 0.0 0.0
Donor Exp 45.3 45.3 0.0 0.0
ICT 10.5 10.5 0.0 0.0
Op Exp (NP) 28.6 28.6 0.0 0.0
Op Exp/Mat 4.6 4.6 0.0 0.0
SSM 12.0 12.0 0.0 0.0
Donor Grants 945.9 945.9 0.0 200.2
Admin-Con 12.3 12.3 0.0 0.0
C/Gr-SA & PA 27.1 27.1 0.0 0.0
CRI 32.6 32.6 0.0 0.0
Donor Exp 319.4 319.4 0.0 0.0
Op Exp (NP) 518.3 518.3 0.0 0.0
Training 36.2 36.2 0.0 0.0
Grand Total 12,970.2 12,970.2 5,227.6 5,225.8
Source: Department of Treasury.