mid-year economic and fiscal outlook 2007-08 · iii foreword the mid-year economic and fiscal...
TRANSCRIPT

MID-YEAR ECONOMIC AND FISCAL OUTLOOK
2007-08
STATEMENT BY THE HONOURABLE PETER COSTELLO MP
TREASURER OF THE COMMONWEALTH OF AUSTRALIA AND SENATOR THE HONOURABLE NICK MINCHIN
MINISTER FOR FINANCE AND ADMINISTRATION
October 2007

© Commonwealth of Australia 2007
ISBN 0 642 74422 X
This work is copyright. Apart from any use as permitted under the Copyright Act 1968, no part may be reproduced by any process without prior written permission from the Commonwealth. Requests and inquiries concerning reproduction and rights should be addressed to:
Commonwealth Copyright Administration Attorney-General’s Department Robert Garran Offices National Circuit BARTON ACT 2600
Or posted at: http://www.ag.gov.au/cca
Internet
The Australian Government budget papers and budget related information are available on the central Budget website at: www.budget.gov.au.
Printed by CanPrint Communications Pty Ltd
iii
FOREWORD The Mid-Year Economic and Fiscal Outlook 2007-08 (MYEFO) has been prepared in accordance with the Charter of Budget Honesty Act 1998. The Charter requires that the Government provide a mid-year budget report which provides updated information to allow the assessment of the Government’s fiscal performance against its fiscal strategy.
Consistent with these requirements:
• Part 1: Overview — contains summary information on the key fiscal and economic indicators.
• Part 2: Personal income tax reform — outlines the Government’s tax reform goal and plan for continuing reform of Australia’s personal tax system.
• Part 3: Economic outlook — discusses the domestic and international economic forecasts that underpin the budget estimates.
• Part 4: Fiscal outlook — provides a discussion of the budget outlook and a summary of the factors explaining variations in the operating statement, balance sheet and cash flow statement since the 2007-08 Budget. This part also discusses the sensitivity of the forward budget estimates to changes in major economic parameters.
• Appendix A: Policy decisions taken since the 2007-08 Budget — provides details of decisions taken since the 2007-08 Budget that affect revenue, expenses and capital estimates.
• Appendix B: Government Finance Statistics (GFS) statements — provides the general government and consolidated whole of government financial statements on a GFS basis, consistent with the Accrual Uniform Presentation Framework.
• Appendix C: Australian Accounting Standards (AAS) financial statements — provides AAS statements and notes to the financial statements.
• Appendix D: Statement of risks — provides details of general developments or specific events that may have an impact on the fiscal position, and contingent liabilities which are costs the government may possibly face, some of which are quantified.
• Appendix E: Financial reporting standards and budget concepts — provides a discussion of key budget concepts relevant to the MYEFO and the external reporting standards upon which the MYEFO is based.
• Appendix F: Historical Australian Government data — provides historical data for the Australian Government’s key fiscal aggregates.


v
Contents
FOREWORD ........................................................................................................iii
PART 1: OVERVIEW..............................................................................................1 Domestic and international economic outlook ................................................................2
PART 2: PERSONAL INCOME TAX REFORM ............................................................5
PART 3: ECONOMIC OUTLOOK............................................................................11 International economic outlook .....................................................................................12 Risks to the outlook.......................................................................................................15 Domestic economy forecasts ........................................................................................16
PART 4: FISCAL OUTLOOK .................................................................................21 Overview .......................................................................................................................21 Revenue ........................................................................................................................22 Expenses.......................................................................................................................27 Net capital investment...................................................................................................30 Cash flows.....................................................................................................................30 Net debt and net worth..................................................................................................34 Attachment A: Reporting standards ..............................................................................36 Attachment B: Budget financial statements ..................................................................38 Attachment C: Sensitivity of fiscal expenses and revenue to economic
developments........................................................................................43 Attachment D: Tax expenditures...................................................................................46 Attachment E: Supplementary expense and capital tables and the Contingency
Reserve.................................................................................................47 Attachment F: Federal financial relations......................................................................52
APPENDIX A: POLICY DECISIONS TAKEN SINCE THE 2007-08 BUDGET.................61
APPENDIX B: GOVERNMENT FINANCE STATISTICS STATEMENTS .......................205 Government Finance Statistics statements ................................................................207 Australian Loan Council Allocation..............................................................................218
APPENDIX C: AUSTRALIAN ACCOUNTING STANDARDS FINANCIAL STATEMENTS ...................................................................................................219 Notes to the AAS financial statements........................................................................225

vi
APPENDIX D: STATEMENT OF RISKS .................................................................235 Overview .....................................................................................................................235 Details of fiscal risks and contingent liabilities ............................................................235 Fiscal risks...................................................................................................................236 Contingent liabilities — quantifiable ............................................................................236 Contingent liabilities — unquantifiable ........................................................................238
APPENDIX E: FINANCIAL REPORTING STANDARDS AND BUDGET CONCEPTS.......................................................................................................241 Reporting standards....................................................................................................241 Accrual GFS framework ..............................................................................................241 Australian Accounting Standard reporting framework.................................................246 Reconciliation of GFS and AAS aggregates ...............................................................247
APPENDIX F: HISTORICAL AUSTRALIAN GOVERNMENT DATA ............................253
vii
NOTES (a) The following definitions are used in the MYEFO:
– ‘real’ means adjusted for the effect of inflation;
– real growth in expenses is measured by the non-farm Gross Domestic Product (GDP) deflator;
– one billion is equal to one thousand million; and
– the budget year refers to 2007-08, while the forward years refer to 2008-09, 2009-10 and 2010-11.
(b) Figures in tables and generally in the text have been rounded. Discrepancies in tables between totals and sums of components are due to rounding:
– estimates under $100,000 are rounded to the nearest thousand;
– estimates $100,000 and over are generally rounded to the nearest tenth of a million;
– estimates midway between rounding points are rounded up; and
– the percentage changes in statistical tables are calculated using unrounded data.
(c) For the budget balance, a negative sign indicates a deficit while no sign indicates a surplus.
(d) The following notations are used:
* The nature of this measure is such that a reliable estimate cannot be provided.
NEC/nec not elsewhere classified
- nil
0 nil
.. not zero, but rounded to zero
na not applicable (unless otherwise specified)
nfp not for publication
$m $ million
$b $ billion

viii
(e) The Australian Capital Territory and the Northern Territory are referred to as ‘the Territories’. References to the ‘States’ or ‘each State’ include the Territories. The following abbreviations are used for the names of the States, where appropriate:
NSW New South Wales
VIC Victoria
QLD Queensland
WA Western Australia
SA South Australia
TAS Tasmania
ACT Australian Capital Territory
NT Northern Territory

1
PART 1: OVERVIEW The economic and fiscal outlook for Australia remains sound and has strengthened since Budget. The Australian economy is expected to grow strongly in 2007-08, notwithstanding increased downside risks to the world economic outlook. Strong fiscal outcomes are forecast and projected across the forward estimates.
In light of this strong economic and fiscal outlook, the Government will provide personal income tax cuts of $34 billion over the forward estimates period, commencing from 1 July 2008.
An underlying cash surplus of $14.8 billion is forecast for 2007-08, $4.2 billion higher than the 2007-08 Budget forecast.
Estimated taxation receipts in 2007-08 have been revised up by $5.0 billion since the 2007-08 Budget. The higher taxation estimates are driven by stronger forecast growth in employment, higher wages, profits and realised capital gains.
Cash payments in 2007-08 are estimated to be $1.6 billion higher than the estimate at the 2007-08 Budget. This largely reflects new policy measures announced since Budget, including drought relief to support affected regions, the Northern Territory Emergency Response to assist remote communities and the new Disability Assistance Package to address unmet need in the provision of disability services. These increases are partially offset by lower than expected payments across a range of income support and welfare programmes and slippage in some defence acquisition projects.
Table 1 presents the fiscal and underlying cash balances for 2007-08 and the forward years.
Table 1: Summary of budget aggregates
Budget MYEFO Budget MYEFOUnderlying cash balance ($b)(a) 10.6 14.8 12.7 14.4Per cent of GDP 1.0 1.3 1.1 1.2
Fiscal balance ($b) 10.0 14.9 11.9 13.6Per cent of GDP 0.9 1.3 1.0 1.1
Budget MYEFO Budget MYEFOUnderlying cash balance ($b)(a) 13.8 17.7 12.4 15.1Per cent of GDP 1.2 1.4 1.0 1.2
Fiscal balance ($b) 14.1 18.4 13.7 17.1Per cent of GDP 1.2 1.5 1.1 1.3
Estimates
Projections2010-11
2008-09
2009-10
2007-08
(a) Excludes expected Future Fund earnings.
Part 1: Overview
2
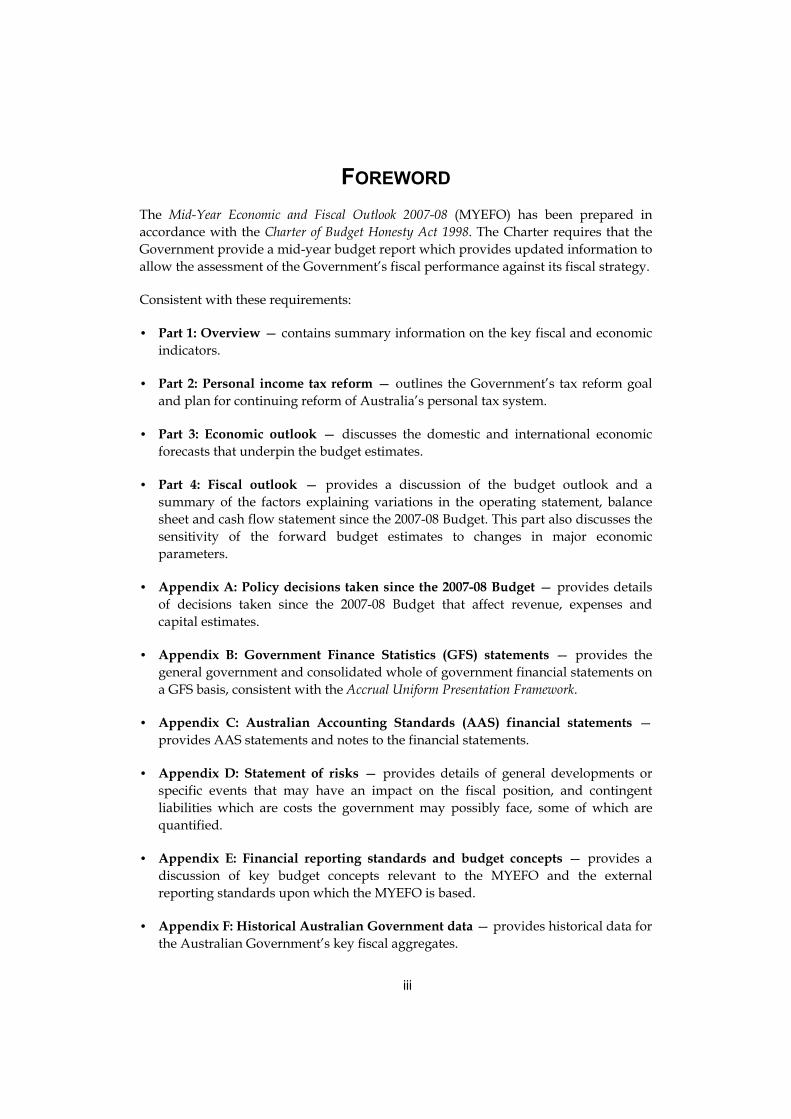
The underlying cash surpluses projected for the future years emphasise Australia’s sound fiscal outlook at a time when many of the major advanced economies are continuing to experience significant deficits.
Chart 1: International comparison of budget balances 2007 and 2008(a)
-6
-5
-4
-3
-2
-1
0
1
2
Euro area OECD UnitedKingdom
United States Japan Australia-6
-5
-4
-3
-2
-1
0
1
2
2007 2008
Per cent of GDP Per cent of GDP
(a) Source: International data is for the total general government sector, sourced from the latest OECD
Economic Outlook, No. 81, May 2007, which contains data up to 2008. Australian data is for the Australian Government general government sector.
In accrual terms, the fiscal balance is expected to record a $14.9 billion surplus in 2007-08, $4.9 billion higher than forecast at the 2007-08 Budget.
Further details on the accrual and cash budget estimates are provided in Part 4.
DOMESTIC AND INTERNATIONAL ECONOMIC OUTLOOK
The Australian economy is expected to grow by 4¼ per cent in 2007-08, compared with 3¾ per cent forecast at Budget. The upward revision reflects a broad-based strengthening in growth in the non-farm sector during the first half of 2007, which is expected to be sustained. Growth is forecast to ease to 3½ per cent in 2008-09. The farm sector is not expected to recover fully from drought over the forecast horizon. Farm GDP is forecast to grow by 14 per cent in 2007-08, which is a significantly weaker recovery than seen in previous droughts.
The forecasts have been prepared in an environment of significant turbulence in global financial markets, triggered by rising default rates on sub-prime mortgages in the United States and considerable uncertainty about where the resulting losses ultimately reside. The ongoing implications of this turbulence, while uncertain, clearly introduce

Part 1: Overview
3
downside risks to the outlook. These events have occurred at a time when there has been significant momentum in the domestic and global economies.
World GDP growth is forecast to be 5 per cent in 2007 and 4¾ per cent in 2008. In comparison with Budget, the downward revision to the outlook for 2008 reflects weaker growth in the United States. The US housing downturn is likely to continue to weigh on its economy during 2007 and 2008.
Australian economic growth is expected to be broadly based. Strong global demand for mineral and energy resources is continuing to support high terms of trade. Business investment is forecast to grow strongly, underpinned by strong ongoing profitability. Growth in export volumes is expected to accelerate as additional capacity comes on line.
Household consumption is forecast to be stronger than at Budget, supported by strong employment growth and solid wage growth. The forecast for employment growth has increased since Budget, in line with stronger economic conditions and rises in immigration and workforce participation. Dwelling investment growth is expected to pick-up significantly in 2008-09.
Despite some near-term strength, wage and inflation pressures are forecast to ease in 2008-09. This reflects an easing in demand pressures and increasing supply flowing from strong and sustained business investment. Moreover, stronger productivity growth is expected to put downward pressure on unit labour costs.
The risks surrounding the world economy are creating uncertainty for the domestic outlook. While strong world growth is expected to support the domestic economy over the forecast horizon, there is a risk that the slowing in US growth will be more pronounced than expected. This would have broader implications for world trade and financial markets. Tighter global credit conditions would be expected to dampen activity in the domestic economy. In addition, a significant slowdown in world growth could result in commodity price falls. Alternatively, stronger outcomes for the domestic economy are possible if turbulence in financial markets continues to unwind in a relatively benign fashion.
Dry weather conditions and low water storage levels continue to pose a downside risk to the outlook for the farm sector. The forecasts take into account the below-average rainfall over winter and the consequent deterioration in yields in cropping regions as reported in the September quarter 2007 Australian Commodities by the Australian Bureau of Agricultural and Resource Economics (ABARE). The impact of further dry conditions since the publication of the ABARE report, in particular on the New South Wales wheat crop, has also been taken into account. The usual Budget assumption of average seasonal conditions applies for the remainder of the forecast period. However, there is a significant risk to the farm sector if below-average rainfall persists in many parts of Australia.

Part 1: Overview
4
Table 2 presents the major economic parameters used in preparing the Mid-Year Economic and Fiscal Outlook 2007-08. The parameters for 2007-08 and 2008-09 are forecasts, while those for 2009-10 and 2010-11 are projections. The projections of economic growth are based on analysis of underlying trends in employment and productivity. As at Budget, iron ore and coal prices are assumed to return to their long-run average level over the two projection years. This is broadly consistent with aggregate non-rural commodity prices retracing almost 50 per cent of their recent gains by the end of the projection period. The projections of inflation are consistent with the medium-term inflation target band.
Table 2: Major economic parameters(a)
2007-08 2008-09 2009-10 2010-11Real GDP 4 1/4 3 1/2 3 3Employment 2 1/4 1 3/4 1 1/4 1 1/4Wage Price Index 4 1/4 4 1/4 4 4CPI 2 3/4 2 3/4 2 1/2 2 1/2
Forecasts Projections
(a) Year-average percentage change.

5
PART 2: PERSONAL INCOME TAX REFORM Since 2000, the Government has undertaken a range of far-reaching reforms to the tax system. These reforms have reshaped Australia’s personal, business, superannuation, indirect and international tax landscape and ensured that Australia remains a low tax country compared to the standards of the developed world. The reforms to the tax system have increased incentives to work, save and invest, reduced costs and complexity, and improved Australia’s international competitiveness.
The Government’s objective of keeping the Budget in surplus has been maintained whilst also maintaining its commitment not to increase the overall Commonwealth tax burden from 1996-97 levels. In fact the tax burden has fallen significantly from 1996-97 levels.
Tax reform goal The Government has now decided on an ambitious new goal to drive tax reform much further. This goal can be met if the expected strong economic and fiscal conditions continue. The goal is that in five years time (2012-13) the personal income tax system will have the following features:
• A rate scale of 15 per cent, 30 per cent, 35 per cent, and 40 per cent;
• Forty-five per cent of taxpayers1 facing a marginal tax rate of 15 per cent or less;
• Eighty-five per cent of taxpayers facing a marginal tax rate of 30 per cent or less;
• Ninety-eight per cent of taxpayers facing a marginal tax rate of 35 per cent or less; and
• An enhanced low income tax offset (LITO) that will mean that low income earners will have an effective tax free threshold of $20,000.
Tax reform plan The Government has decided to cut tax as part of a plan to commence on 1 July 2008. Across the forward estimates this will mean tax cuts of $34 billion.
This will result in a significant reduction in taxes for all individual taxpayers while maintaining the sustainability of the revenue base. In particular, the reforms provide added incentives for low income workers to participate in the workforce.
1 Defined as a resident adult who is not a full-rate pensioner or beneficiary and who has a taxable income greater than the tax free threshold of $6,000, but does not necessarily have a net tax liability.

Part 2: Personal income tax reform
6
From 1 July 2008, the 30 per cent threshold will increase from $30,001 to $34,001. In addition, from 1 July 2009, the 30 per cent threshold will be further increased to $35,001 and the 40 per cent and 45 per cent tax rates will be reduced to 38 per cent and 43 per cent. From 1 July 2010, the 30 per cent threshold will be increased again to $37,001 and the top marginal tax rates will be cut to 37 per cent and 42 per cent.
Table 3 outlines the new personal tax rates and thresholds for the forward estimates period.
Table 3: New personal tax rates and thresholds
Taxable income Rate Taxable income Rate Taxable income Rate Taxable income Rate ($) (%) ($) (%) ($) (%) ($) (%)
0 - 6,000 0 0 - 6,000 0 0 - 6,000 0 0 - 6,000 06,001 - 30,000 15 6,001 - 34,000 15 6,001 - 35,000 15 6,001 - 37,000 1530,001 - 75,000 30 34,001 - 80,000 30 35,001 - 80,000 30 37,001 - 80,000 3075,001 - 150,000 40 80,001 - 180,000 40 80,001 - 180,000 38 80,001 - 180,000 37150,001 + 45 180,001 + 45 180,001 + 43 180,001 + 42
Current From 1 July 2010From 1 July 2009From 1 July 2008
Low and middle income earners will be further assisted through an increase in the LITO. From 1 July 2008, the LITO will increase from $750 to $1,200. It will continue to be withdrawn from the income level of $30,000. Those eligible for the full LITO will not pay tax after assessment until their annual income exceeds at least $14,000 (up from the current level of $11,000). Further increases in the LITO, to $1,350 from 1 July 2009 and to $1,500 from 1 July 2010 will mean that the effective tax free threshold will increase further to at least $15,000 in 2009-10 and $16,000 in 2010-11, towards the goal of $20,000.
Given the large increase in the amount of the offset, new withholding schedules will be created so that low and average income earners will receive half of the benefits of the LITO through their regular pay, rather than receiving the total as a lump sum when their income tax returns are assessed. This will bolster participation incentives by allowing people to realise sooner the benefits of working more.
Senior Australians will also benefit from these changes and related increases. Senior Australians eligible for the senior Australians tax offset (SATO) and the LITO currently do not pay tax until they reach an annual income of at least $25,867 for singles and $21,680 for each member of a couple. As a result of the Government’s personal income tax plan, from 1 July 2008 these income levels will be lifted to $28,867 for singles and $24,680 for each member of a couple. By 2010-11, the income levels will be $30,685 for singles and $26,680 for each member of a couple.
The fringe benefits tax rate will also be reduced in line with reductions in the top marginal tax rate (including the Medicare levy), decreasing to 44.5 per cent from 1 April 2009 and to 43.5 per cent from 1 April 2010.
Part 2: Personal income tax reform
7
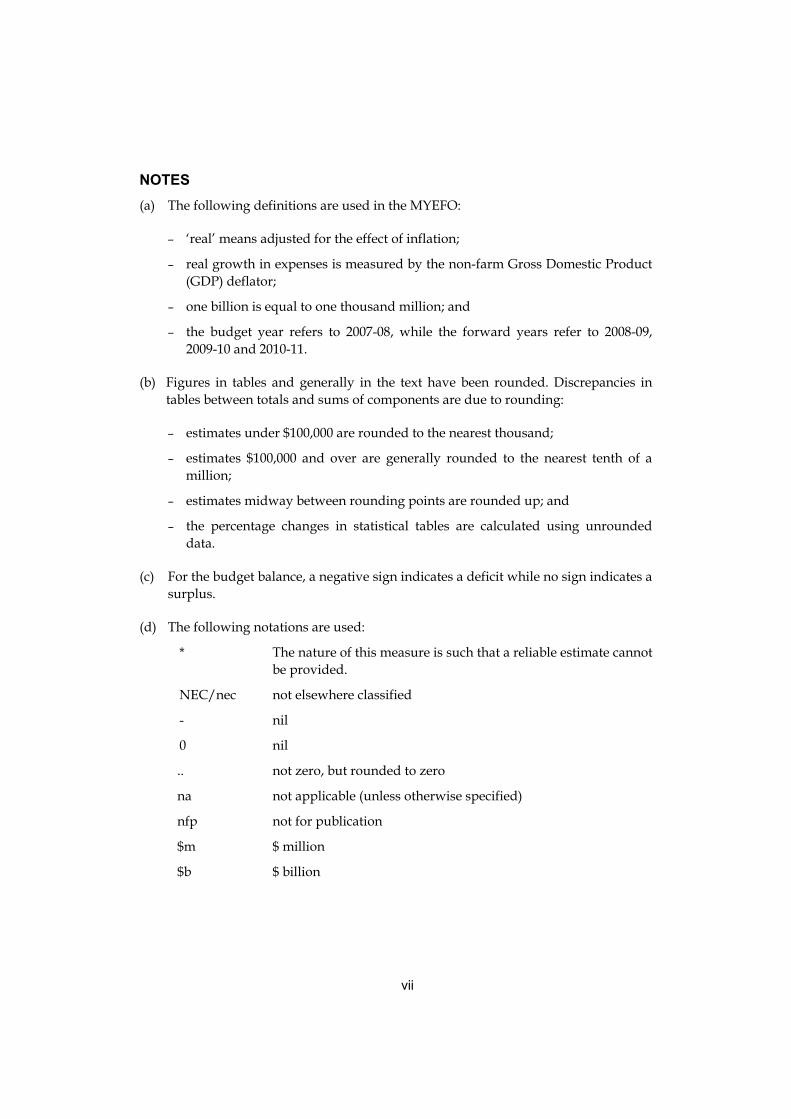
These tax cuts build on the significant reductions in personal income tax for low and average income earners that have resulted from tax cuts delivered in the last five budgets. Chart 2 shows the net reductions in tax that will result over the forward estimates period.
Chart 2: Reductions in net income tax paid by low and average income earners
1,3802,230
3,880
5,380
8,380
11,380
6001,350
2,1002,850
6,250
9,600
6001,350
2,100
4,450
7,850
0
2,000
4,000
6,000
8,000
10,000
12,000
15,000 20,000 25,000 30,000 40,000 50,000
Taxable income ($)
0
2,000
4,000
6,000
8,000
10,000
12,000
2002-03 2007-08 2010-11
Net tax ($) Net tax ($)
0
The 2007-08 MYEFO tax cuts build on the reforms delivered in The New Tax System introduced in 2000-01 and the 2003-04, 2004-05, 2005-06, 2006-07 and 2007-08 budgets. The overall effect has been to deliver significant reductions in tax for all Australian taxpayers.
• Adult taxpayers earning $30,000 paid $6,222 in income tax prior to The New Tax System (excluding the Medicare levy) whereas taxpayers on that income will, from 1 July 2010, pay $2,100; a reduction of 66 per cent.
• Taxpayers on $60,000 paid $18,802 in income tax prior to The New Tax System (excluding the Medicare levy) whereas taxpayers on that income will, from 1 July 2010, pay $11,250; a reduction of 40 per cent.
• Taxpayers on $100,000 paid $37,602 in income tax prior to The New Tax System (excluding the Medicare levy) whereas taxpayers on that income will, from 1 July 2010, pay $24,950; a reduction of 34 per cent.
• Taxpayers on $180,000 paid $75,202 in income tax prior to The New Tax System (excluding the Medicare levy) whereas taxpayers on that income will, from 1 July 2010, pay $54,550; a reduction of 27 per cent.

Part 2: Personal income tax reform
8
As shown in Chart 3 below, in percentage terms, the greatest tax cuts have been provided to low and average income earners.
Chart 3: Personal income tax savings since The New Tax System
0
10
20
30
40
50
60
70
80
90
100
10 20 30 40 50 60 70 80 90 100 110 120 130 140 150 160 170 180Income ($'000)
0
10
20
30
40
50
60
70
80
90
100
TNTS tax cuts 2003-04 tax cuts 2004-05 tax cuts2005-06 tax cuts 2006-07 tax cuts 2007-08 tax cuts2008-09 tax cuts 2009-10 tax cuts 2010-11 tax cuts
Per cent reduction Per cent reduction
The Government has already made significant progress towards achieving its plan for the personal tax system. For example, the effective tax free threshold for low income earners has been increased from $6,150 prior to 1 July 2000, to $11,000 in 2007-08, and will increase further to $16,000 from 1 July 2010.
The 2007-08 MYEFO tax cuts and the Government’s goal for the personal income tax system will continue the focus on encouraging workforce participation that has been a feature of the tax cuts delivered by the Government since the introduction of The New Tax System. The estimated impact of the 2007-08 MYEFO tax cuts is to encourage around 65,000 new entrants into the workforce. The cumulative effect of the tax cuts delivered by the Government since The New Tax System is estimated to encourage around 300,000 new entrants to the workforce (see Chart 4). To put this into perspective, this is roughly equivalent in size to a three percentage point fall in the unemployment rate.

Part 2: Personal income tax reform
9
Chart 4: Estimated cumulative workforce impacts from personal tax scale changes*
0
50
100
150
200
250
300
350
2000-01 2001-02 2002-03 2003-04 2004-05 2005-06 2006-07 2007-08 2008-09 2009-10 2010-110
50
100
150
200
250
300
350Individuals ('000) Individuals ('000)
Source: Treasury version of the Melbourne Institute Tax and Transfer Simulator (MITTS). *The actual workforce impacts are likely to be spread beyond the years of introduction of the tax scale changes. These tax reforms will also assist in improving Australia’s competitiveness with other OECD countries. Australia is a low tax country — the eighth lowest in the OECD. With the fall in the top marginal tax rate as part of the planned tax cuts, Australia’s attractiveness to highly skilled workers from overseas will be enhanced. The average (‘all in’) top marginal rate for OECD countries was 46.6 per cent in 2006. The Government’s plan will reduce Australia’s top marginal rate to 42 per cent from 1 July 2010, with the goal of further lowering it to 40 per cent over the next two years. When the Medicare levy is included, Australia’s top marginal rate will be significantly below the average for the OECD.


11
PART 3: ECONOMIC OUTLOOK The Australian economy is expected to grow by 4¼ per cent in 2007-08, stronger than the 3¾ per cent forecast at Budget. The economy’s supply potential is expected to expand at a faster-than-usual pace, reflecting strong and sustained business investment. Growth in export volumes is forecast to accelerate as increased capacity comes on line. The prospects for the household sector are favourable, buoyed by growth in incomes and wealth. The forecast for 2007-08 also reflects a partial recovery from the drought, which is expected to add ½ of a percentage point to GDP growth.
The economic forecasts have been framed against a backdrop of significant turbulence in global financial markets. Rising default rates on sub-prime mortgages in the United States have led to reduced liquidity and increased volatility in world financial markets. The ongoing implications of this turbulence for the domestic and world economies are uncertain, introducing greater risks to the outlook. These events have occurred at a time when there has been significant momentum in the domestic and global economies.
World GDP is forecast to grow by 5 per cent in 2007 and 4¾ per cent in 2008. The slight downward revision to the outlook for 2008 from the Budget forecast of 5 per cent reflects weaker growth in the United States. Growth is expected to be strong across emerging market economies, and demand from these regions is expected to continue to support export growth in major developed economies.
The Australian economy will continue to be influenced by strong global demand for mineral and energy resources. Business investment grew by 7.1 per cent in 2006-07, following double-digit growth in each of the preceding four years. The increase in commodity prices has boosted mining profits and investment. Investment is also strong in other sectors such as manufacturing, and property and business services. A continuation of strong business investment is forecast for 2007-08 and 2008-09. The strength of corporate balance sheets and profits will continue to support high levels of business investment, notwithstanding possible upward pressure on financing costs as a result of recent financial market developments.
Growth in mining production and export volumes is expected to accelerate from 2007-08 as projects come on line. The mining industry has invested $76 billion over the past six years and strong investment is expected to continue. Nominal business investment as a share of GDP is at its highest level in 33 years and is anticipated to remain around this level.
The terms of trade are forecast to rise modestly by 1¼ per cent in 2007-08, rather than fall slightly as expected at Budget. The upward revision largely reflects anticipated strength in the prices of Australia’s bulk commodity exports of iron ore and coal. World demand is expected to outpace supply in these markets. In contrast, falls in base metal prices are expected as global supply in these markets increases. The increased

Part 3: Economic outlook
12
downside risks to the world economy create more uncertainty around the outlook for commodity prices.
Ongoing growth in household incomes, wealth and employment is expected to result in strong household consumption growth, and a pick-up in dwelling investment growth in 2008-09. Household incomes are expected to be higher than forecast at Budget. Employment growth is forecast to be strong, supported by strong domestic demand, high participation and increased immigration.
Wage and inflation pressures are expected to ease over the forecast horizon. Current pressure on food prices reflects unfavourable weather conditions and low water allocations in the Murray-Darling Basin. An easing in underlying inflation is expected as demand pressures ease and growth in unit labour costs slows as productivity strengthens.
INTERNATIONAL ECONOMIC OUTLOOK
As reported at Budget, the world economy recorded its fastest growth rate in over 30 years in 2006. World growth remained strong in the first half of 2007, although recent disruptions in global financial markets have resulted in a more uncertain outlook. While continued robust growth in emerging market countries, particularly China and India, is expected to underpin global growth in the coming period, downside risks have increased and require careful monitoring.
Growth in China and India accelerated over the first half of 2007, continuing to exceed expectations. Growth has also been exceptionally strong across other emerging market economies in Latin America, Eastern Europe, the Commonwealth of Independent States and sub-Saharan Africa, with high commodity prices supporting economic activity in a number of these regions. Demand from these regions has fuelled export growth in major developed economies, in particular the euro area and Japan. Growth in the United States has remained constrained by weakness in its housing market and a recent tightening in corporate credit conditions. A return to trend growth for the US in 2008, as expected at Budget, now appears unlikely.
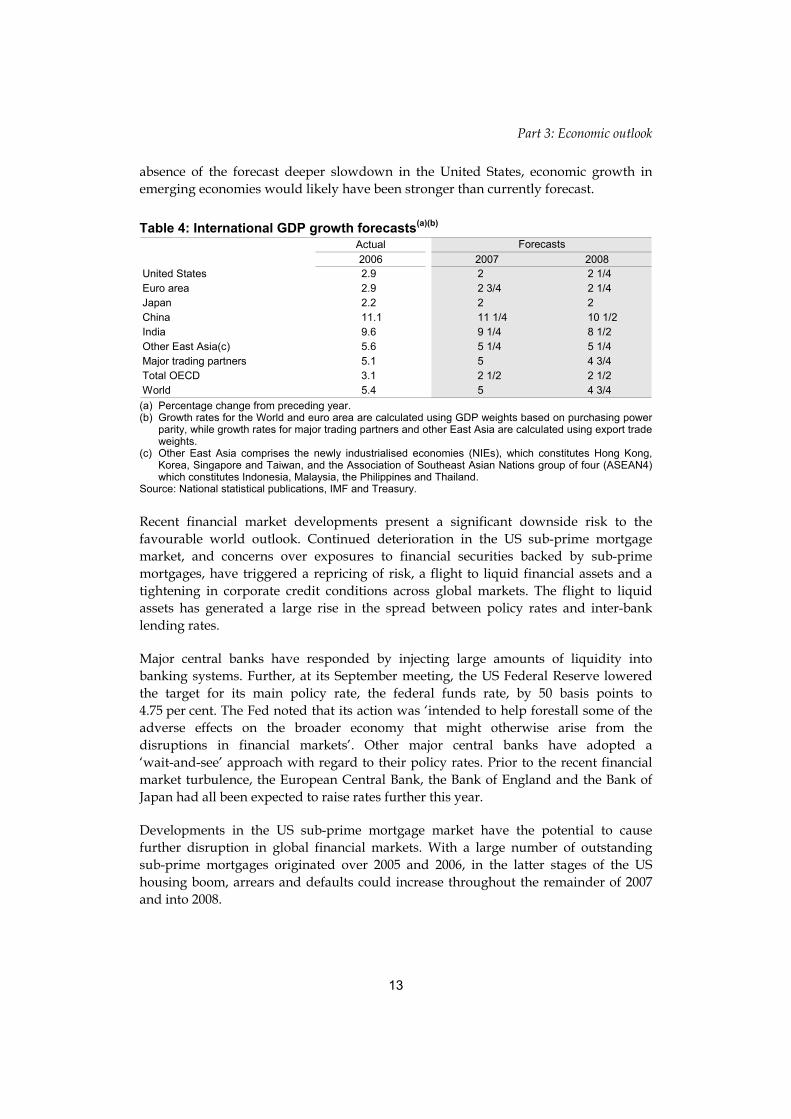
The world economic growth forecasts for 2007 remain unchanged at 5 per cent and have been revised down slightly to 4¾ per cent in 2008 (Table 4). The downward revision in 2008 reflects a weaker outlook for the United States.
In contrast, major trading partner growth has been revised up by ½ of a percentage point to 5 per cent in 2007 and by ¼ of a percentage point to 4¾ per cent in 2008. This upward revision is largely due to higher-than-expected growth in China and India, and the other East Asian economies in the first half of 2007, and an expectation of continued strong growth for China and India in 2008. The upward revisions more than offset a downward revision to the outlook for the US economy over both years. In the
Part 3: Economic outlook
13
absence of the forecast deeper slowdown in the United States, economic growth in emerging economies would likely have been stronger than currently forecast.
Table 4: International GDP growth forecasts(a)(b) Actual2006 2007 2008
United States 2.9 2 2 1/4Euro area 2.9 2 3/4 2 1/4Japan 2.2 2 2China 11.1 11 1/4 10 1/2India 9.6 9 1/4 8 1/2Other East Asia(c) 5.6 5 1/4 5 1/4Major trading partners 5.1 5 4 3/4Total OECD 3.1 2 1/2 2 1/2World 5.4 5 4 3/4
Forecasts
(a) Percentage change from preceding year. (b) Growth rates for the World and euro area are calculated using GDP weights based on purchasing power
parity, while growth rates for major trading partners and other East Asia are calculated using export trade weights.
(c) Other East Asia comprises the newly industrialised economies (NIEs), which constitutes Hong Kong, Korea, Singapore and Taiwan, and the Association of Southeast Asian Nations group of four (ASEAN4) which constitutes Indonesia, Malaysia, the Philippines and Thailand.
Source: National statistical publications, IMF and Treasury. Recent financial market developments present a significant downside risk to the favourable world outlook. Continued deterioration in the US sub-prime mortgage market, and concerns over exposures to financial securities backed by sub-prime mortgages, have triggered a repricing of risk, a flight to liquid financial assets and a tightening in corporate credit conditions across global markets. The flight to liquid assets has generated a large rise in the spread between policy rates and inter-bank lending rates.
Major central banks have responded by injecting large amounts of liquidity into banking systems. Further, at its September meeting, the US Federal Reserve lowered the target for its main policy rate, the federal funds rate, by 50 basis points to 4.75 per cent. The Fed noted that its action was ‘intended to help forestall some of the adverse effects on the broader economy that might otherwise arise from the disruptions in financial markets’. Other major central banks have adopted a ‘wait-and-see’ approach with regard to their policy rates. Prior to the recent financial market turbulence, the European Central Bank, the Bank of England and the Bank of Japan had all been expected to raise rates further this year.
Developments in the US sub-prime mortgage market have the potential to cause further disruption in global financial markets. With a large number of outstanding sub-prime mortgages originated over 2005 and 2006, in the latter stages of the US housing boom, arrears and defaults could increase throughout the remainder of 2007 and into 2008.
Part 3: Economic outlook
14
While there are some pressures to headline inflation around the world from sharp increases in food and fuel prices, core inflation generally remains contained. Crude oil prices (West Texas Intermediate) have trended upwards since May this year, underpinned by increasing demand from US refiners. Global oil markets remain tight, which could lead to further rises in oil prices and consequently add to global inflationary pressures.
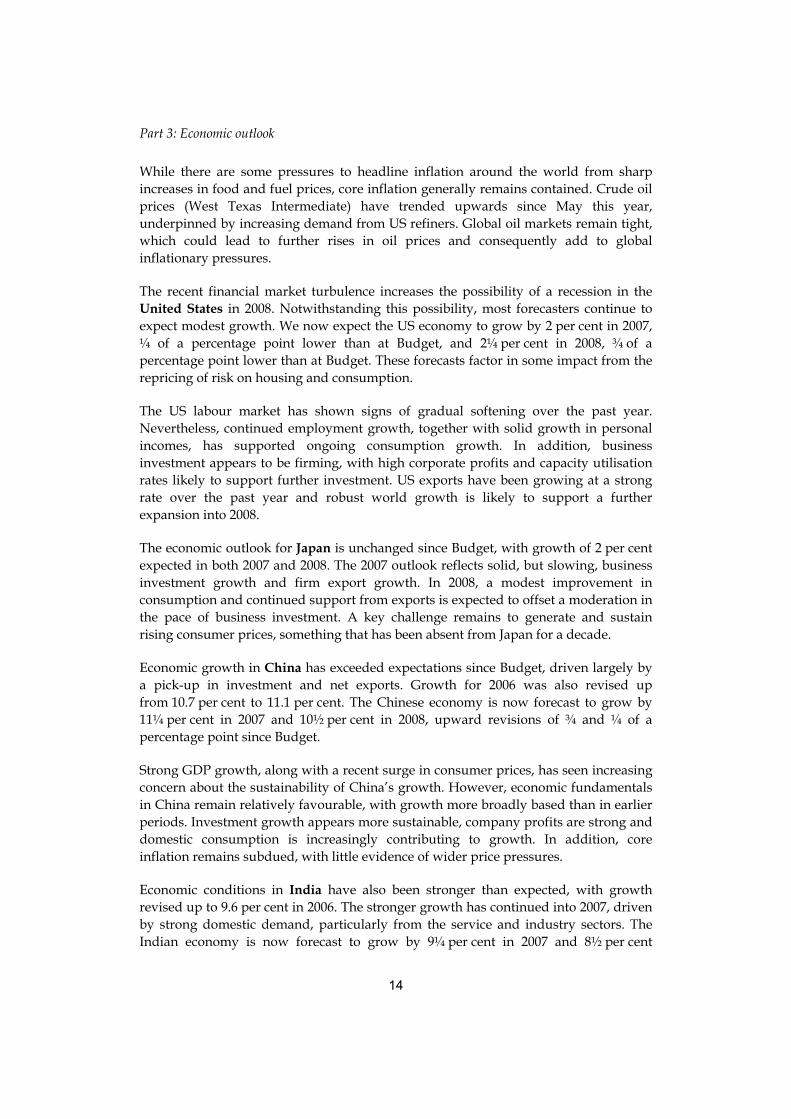
The recent financial market turbulence increases the possibility of a recession in the United States in 2008. Notwithstanding this possibility, most forecasters continue to expect modest growth. We now expect the US economy to grow by 2 per cent in 2007, ¼ of a percentage point lower than at Budget, and 2¼ per cent in 2008, ¾ of a percentage point lower than at Budget. These forecasts factor in some impact from the repricing of risk on housing and consumption.
The US labour market has shown signs of gradual softening over the past year. Nevertheless, continued employment growth, together with solid growth in personal incomes, has supported ongoing consumption growth. In addition, business investment appears to be firming, with high corporate profits and capacity utilisation rates likely to support further investment. US exports have been growing at a strong rate over the past year and robust world growth is likely to support a further expansion into 2008.
The economic outlook for Japan is unchanged since Budget, with growth of 2 per cent expected in both 2007 and 2008. The 2007 outlook reflects solid, but slowing, business investment growth and firm export growth. In 2008, a modest improvement in consumption and continued support from exports is expected to offset a moderation in the pace of business investment. A key challenge remains to generate and sustain rising consumer prices, something that has been absent from Japan for a decade.
Economic growth in China has exceeded expectations since Budget, driven largely by a pick-up in investment and net exports. Growth for 2006 was also revised up from 10.7 per cent to 11.1 per cent. The Chinese economy is now forecast to grow by 11¼ per cent in 2007 and 10½ per cent in 2008, upward revisions of ¾ and ¼ of a percentage point since Budget.
Strong GDP growth, along with a recent surge in consumer prices, has seen increasing concern about the sustainability of China’s growth. However, economic fundamentals in China remain relatively favourable, with growth more broadly based than in earlier periods. Investment growth appears more sustainable, company profits are strong and domestic consumption is increasingly contributing to growth. In addition, core inflation remains subdued, with little evidence of wider price pressures.
Economic conditions in India have also been stronger than expected, with growth revised up to 9.6 per cent in 2006. The stronger growth has continued into 2007, driven by strong domestic demand, particularly from the service and industry sectors. The Indian economy is now forecast to grow by 9¼ per cent in 2007 and 8½ per cent
Part 3: Economic outlook
15
in 2008, a little higher than expected at Budget. The expected mild slowing in 2008 reflects a moderation in domestic demand, partly due to a recent tightening of monetary conditions by the Reserve Bank of India.
Expectations for growth in the rest of East Asia have been revised up slightly since Budget, with the 2007 and 2008 forecasts both higher by ¼ of a percentage point to 5¼ per cent. Since Budget, growth has converged across the region due to stronger-than-expected consumption and investment in the NIEs. Growth in the rest of East Asia is now forecast to be supported by solid domestic demand in 2007 and a slight pick-up in exports in 2008.
Expectations for euro area growth in 2007 have improved modestly since Budget, with the 2007 forecast revised up by ¼ of a percentage point to 2¾ per cent. Although GDP growth fell below trend in the June quarter, it is expected to rebound over the remainder of 2007. In 2008, growth is expected to moderate to 2¼ per cent, reflecting the impact on domestic demand of previous monetary tightening and slightly slower export growth, reflecting the high euro exchange rate.
RISKS TO THE OUTLOOK
Recent financial market developments present a significant downside risk to the world and domestic economic outlooks. Further volatility in financial markets has the potential to result in slower growth in the United States and consequently dampen world growth more broadly through trade and financial market linkages.
In the Australian economy, higher borrowing costs would weigh on dwelling and business investment, as well as household consumption. A significant slowdown in world growth would also slow the demand for Australia’s exports and could result in falls in commodity prices. Significant commodity price falls would lower growth in national income and activity.
Alternatively, should the recent financial market turbulence continue to be resolved in a relatively benign fashion, stronger outcomes for the domestic economy are possible. This is especially the case given the magnitude of investment projects in the pipeline. In this event, stronger growth in an economy that is close to full employment could add to wage and price pressures, although these pressures may be offset somewhat by a higher exchange rate. The Australian dollar has appreciated significantly recently and, were this appreciation to be sustained, it would have some dampening effect on economic activity and prices.
Dry weather conditions and low water storage levels continue to pose a downside risk to farm production. While timely rains provided for a good start to the 2007 winter cropping season, a lack of follow-up rains has adversely affected the winter crop. The forecasts take this and the current low water allocations in the Murray-Darling Basin

Part 3: Economic outlook
16
into account, but rely on the usual Budget assumption of average seasonal conditions for the remainder of the forecast period.
DOMESTIC ECONOMY FORECASTS
The domestic economy forecasts are based on several technical assumptions. The exchange rate is assumed to remain around its average level of recent months — a trade weighted index of around 67.5 and a United States dollar exchange rate of around 85 US cents. Domestic interest rates are assumed to remain unchanged at current levels. World oil prices (West Texas Intermediate) are assumed to move in line with market expectations and remain around US$75 per barrel on average over the forecast period. The farm sector forecasts are based on an assumption of average seasonal conditions in the future, but take into account weather outcomes experienced in the early part of 2007-08 and the current very low water storage levels.
The Australian economy is forecast to grow by 4¼ per cent in 2007-08 and 3½ per cent in 2008-09. The key domestic economy forecasts are summarised in Table 5.

Part 3: Economic outlook
17
Table 5: Domestic economy forecasts(a)
2006-07Outcomes(b)
Budget MYEFOYear average Year average Year average
Panel A - Demand and output(c)Household consumption 3.7 3 1/2 4 1/4
Private investmentDwellings 3.6 2 1/2 3Total business investment(d) 7.1 7 1/2 9 1/2
Non-dwelling construction(d) 12.6 7 9Machinery and equipment(d) 3.1 6 1/2 8
Private final demand(d) 4.2 4 1/4 5 1/4Public final demand(d) 5.2 3 3/4 4 1/2Total final demand 4.5 4 5
Change in inventories(e)Private non-farm 0.3 0 0Farm and public authorities(f) -0.2 1/4 0
Gross national expenditure 4.5 4 1/4 5
Exports of goods and services 3.9 5 4 1/2Imports of goods and services 9.5 6 1/2 8 1/2
Net exports(e) -1.4 - 1/2 -1
Gross domestic product 3.3 3 3/4 4 1/4Non-farm product 3.9 3 1/2 4Farm product -19.2 18 14
Panel B - Other selected economic measures External accounts
Terms of trade 7.3 -1 1/2 1 1/4Current account balance
$billion -59.2 -65 3/4 -71 1/4Percentage of GDP -5.7 -6 -6 1/4
Labour marketEmployment (labour force survey basis) 2.7 1 1/2 2 1/4Unemployment rate (per cent) 4.5 5 4 1/2Participation rate (per cent) 64.8 65 65 1/4
Prices and wagesConsumer Price Index 2.9 2 1/2 2 3/4Gross non-farm product deflator 4.9 2 1/2 2 3/4Wage Price Index 4.0 4 1/4 4 1/4
2007-08Forecasts
(a) Percentage change on preceding year unless otherwise indicated. (b) Calculated using original data. (c) Chain volume measures. (d) Excluding second-hand asset sales from the public sector to the private sector and including the impact
of the privatisation of Telstra. (e) Percentage point contribution to growth in GDP. (f) For presentational purposes, inventories held by privatised marketing authorities are included with the
inventories of the farm sector and public marketing authorities. Source: Australian Bureau of Statistics (ABS) cat. no. 5206.0, 5302.0, 6202.0, 6345.0, 6401.0, unpublished ABS data and Treasury.

Part 3: Economic outlook
18
Household consumption is expected to grow by 4¼ per cent in 2007-08, stronger than forecast at Budget, before moderating in 2008-09. The upward revision reflects a more positive outlook for household incomes, largely as a result of stronger anticipated employment growth. Household income growth is expected to outpace consumption growth and hence the household saving ratio is anticipated to rise. The recent interest rate rise, combined with the possible impact of increased credit market spreads on household borrowing costs, will have a moderating effect on consumption.
Dwelling investment is expected to continue its modest recovery in 2007-08, with forecast growth of 3 per cent. Dwelling approvals and housing finance data indicate a modest near-term outlook for dwelling investment, with the recent interest rate rise and uncertainty around the flow-on effects from the US sub-prime housing market likely to be weighing on the market. Further, there are also ongoing supply constraints on dwelling investment. However, the indicators of underlying housing demand remain strong, supported by strong population growth. As such, dwelling investment growth is expected to pick-up in 2008-09.
Business investment is expected to grow by 9½ per cent in 2007-08, with the outlook for both machinery and equipment, and engineering construction investment improving since Budget. The Australian Bureau of Statistics’ Survey of Private New Capital Expenditure and Expected Expenditure suggests broad strength in plant and equipment investment in the period ahead. Strength in new engineering construction investment reflects planned new projects and a record amount of work under construction. Strong corporate balance sheets and profits will continue to support high levels of business investment. However, the recent global financial market volatility has put some upward pressure on financing costs. This is likely to result in slightly lower levels of investment than would have otherwise been the case.
Public final demand is expected to grow by 4½ per cent in 2007-08, stronger than expected at Budget. State and local government investment is expected to increase strongly, reflecting a large number of infrastructure projects. Public consumption growth is expected to remain solid.
Net exports are expected to subtract 1 percentage point from GDP growth in 2007-08, a larger subtraction than forecast at Budget. While a recovery in export volumes is expected, imports are forecast to grow more strongly, consistent with stronger consumption and higher investment. Significant growth in non-rural commodity exports is expected, while rural exports are anticipated to be constrained by the weakness in farm production. Elaborately transformed manufactures and services exports are expected to grow solidly, although the uncertainty around the world outlook poses some downside risk.
The terms of trade are expected to rise modestly by 1¼ per cent in 2007-08, rather than fall slightly as forecast at Budget. The upward revision largely reflects anticipated strength in Australia’s bulk commodity export prices, with world demand expected to outpace supply in iron ore and coal markets. Falls in base metal prices are expected, in

Part 3: Economic outlook
19
line with increasing global supply in these markets. While world growth is expected to support increases in commodity prices, there is a risk that weaker-than-expected world demand could have a significant negative impact on prices.
The current account deficit (CAD) is forecast to widen to 6¼ per cent of GDP in 2007-08, reflecting expected higher investment and relatively unchanged national saving as a share of GDP. The net income deficit component of the CAD is expected to widen, reflecting growth in corporate profits and rising net interest payments from a higher stock of net foreign debt.
Employment growth is expected to be 2¼ per cent in 2007-08, consistent with strong GDP growth. The participation rate is expected to rise to 65¼ per cent, while the unemployment rate is forecast to rise modestly from current levels to 4½ per cent. The rise in the participation and unemployment rates partly reflects the new eligibility and participation requirements for Disability Support Pension and Parenting Payment recipients. Employment growth is expected to moderate in 2008-09, in line with a moderation in economic growth and higher near-term growth in labour costs.
Wages are expected to grow by 4¼ per cent in 2007-08 and 2008-09. Strong wage growth is expected to continue in the States and industries most directly affected by robust mining and construction activity. Wage growth is expected to ease over the forecast horizon to 4 per cent through the year to the June quarter 2009.
Inflation is forecast to be 2¾ per cent in 2007-08 and 2008-09. In through-the-year terms, inflation is forecast to ease to 2½ per cent in the June quarter 2009. There are some inflationary pressures, with low water allocations in the Murray-Darling Basin and ongoing dry weather, combined with one-off weather events such as frost, contributing to higher food prices. Underlying inflationary pressures are expected to ease over the forecast horizon in line with moderating domestic demand, increases in the economy’s supply potential and lower growth in unit labour costs.


21
PART 4: FISCAL OUTLOOK
OVERVIEW
The Australian Government’s underlying cash surplus for 2007-08 is estimated to be $14.8 billion, $4.2 billion higher than the 2007-08 Budget forecast. In accrual terms, a fiscal surplus of $14.9 billion is estimated for 2007-08. The fiscal outlook is for continuing underlying cash and fiscal surpluses in the forward years.
Table 6: Australian Government general government sector budget aggregates(a)(b)
Budget MYEFO Budget MYEFORevenue ($b) 246.8 251.9 260.7 264.0Per cent of GDP 22.5 22.5 22.8 22.1
Expenses ($b) 235.6 235.4 247.5 248.6Per cent of GDP 21.5 21.0 21.6 20.8
Net operating balance ($b) 11.2 16.5 13.2 15.4Net capital investment ($b) 1.2 1.6 1.4 1.8
Fiscal balance ($b) 10.0 14.9 11.9 13.6Per cent of GDP 0.9 1.3 1.0 1.1
Underlying cash balance ($b)(d) 10.6 14.8 12.7 14.4Per cent of GDP 1.0 1.3 1.1 1.2
Memorandum item:Headline cash balance ($b) 18.3 22.8 15.5 18.4
Budget MYEFO Budget MYEFORevenue ($b) 274.6 278.7 287.3 287.5Per cent of GDP 23.1 22.4 22.9 22.1
Expenses ($b) 259.7 259.4 272.7 269.4Per cent of GDP 21.8 20.8 21.8 20.8
Net operating balance ($b) 15.0 19.4 14.6 18.1Net capital investment ($b) 0.9 1.0 0.9 1.0
Fiscal balance ($b) 14.1 18.4 13.7 17.1Per cent of GDP 1.2 1.5 1.1 1.3
Underlying cash balance ($b)(d) 13.8 17.7 12.4 15.1Per cent of GDP 1.2 1.4 1.0 1.2
Memorandum item:Headline cash balance ($b) 14.8 19.1 13.3 16.4
Estimates(c)
Projections
2007-08 2008-09
2009-10 2010-11
(a) All estimates are based on Government Finance Statistics (GFS) standards, but with goods and services
tax (GST) revenue collected on behalf of the States and Territories netted off revenue and expenses. (b) Budget estimates, including the per cent of GDP, are as published in Budget Paper No. 1, Budget
Strategy and Outlook 2007-08. (c) For the 2007-08 MYEFO, 2008-09 has moved from a projection to an estimates year. (d) Excludes expected Future Fund earnings.

Part 4: Fiscal outlook
22
Table 7 provides a reconciliation of the fiscal balance estimates between the 2007-08 Budget and the Mid-Year Economic and Fiscal Outlook 2007-08 (MYEFO).
Table 7: Reconciliation of general government fiscal balance estimates(a) Estimates Projections
2007-08 2008-09 2009-10 2010-11$m $m $m $m
2007-08 Budget fiscal balance 9,999 11,860 14,101 13,704Per cent of GDP 0.9 1.0 1.2 1.1
Changes between 2007-08 Budget and MYEFOEffect of policy decisions(b)
Revenue -225 -6,659 -9,963 -14,604Expenses 3,503 4,023 3,673 2,908Net capital investment 181 84 112 324
Total policy decisions impact on fiscal balance -3,909 -10,766 -13,748 -17,836
Effect of parameter and other variationsRevenue 5,349 9,975 14,088 14,801Expenses -3,683 -2,874 -3,964 -6,144Net capital investment 240 302 -10 -312
Total parameter and other variations impact on fiscal balance 8,792 12,548 18,062 21,256
2007-08 MYEFO fiscal balance 14,882 13,642 18,415 17,125Per cent of GDP 1.3 1.1 1.5 1.3
(a) A positive number for revenue indicates an increase in the fiscal balance, while a positive number for expenses and net capital investment indicates a decrease in the fiscal balance.
(b) Excludes the public debt net interest effect of policy measures.
REVENUE
Total accrual revenue in 2007-08 is expected to be $5.1 billion higher than forecast at the 2007-08 Budget, comprising an increase of $4.8 billion in tax revenue and additional non-tax revenue of $322 million.
Estimates for taxes from individuals and companies have been increased, reflecting stronger growth in employment, profits and realised capital gains. It is forecast that there will be 100,000 more people employed in 2007-08 than forecast at Budget. Superannuation funds taxation estimates have also been revised upwards owing to stronger than expected contributions and fund earnings, especially realised capital gains on equities. In addition, the 2007-08 revenue estimates have been increased owing to the flow on effects of the higher than expected revenue outcome in 2006-07, especially for company tax and superannuation funds tax. Box 1 provides information on the revisions to the parameters underpinning the revenue estimates since the 2007-08 Budget.

Part 4: Fiscal outlook
23
Box 1: Parameter revisions to revenue estimates since Budget
Since the 2007-08 Budget, substantial parameter and other variations have led to upward revisions to revenue. These revisions mainly reflect revised forecasts of national income and realised gains on assets. They primarily affect tax revenue from individuals, companies and superannuation funds.
Tax revenue estimates are sensitive to the economic forecasts, especially the amount of national income generated in the economy. Upward revisions to the level of national income, which includes labour income and company profits, increase the expected tax base and hence revenue collections. If the rise in the level of national income persists, revenue will remain higher on an ongoing basis. Changes in economic activity generally affect company and other tax revenue with some lag.
The Australian economy grew strongly in the first half of 2007, and surpassed the Budget GDP forecast for 2006-07. The momentum within the economy is expected to continue. Nominal GDP grew 1¼ percentage points faster in 2006-07 than anticipated at the 2007-08 Budget and is now expected to grow by an additional ¾ percentage points in 2007-08. This upward revision reflects stronger than expected demand in both the private and public sectors. Strong private demand has been driven by robust business investment, which is associated with higher than anticipated company profits. The strong demand arising from the private and public sectors has also led to stronger than anticipated employment growth and labour income. As a result, estimated income tax revenue in 2007-08 from individuals, companies and superannuation funds has been revised up.
In addition, the MYEFO revenue estimates for 2008-09 are based on forecasts of the economy rather than projections as used at Budget. At Budget, 2008-09 (then the first projection year) incorporated the first stage of a technical assumption that key commodity prices decline to their long-run average level over the first two projection years. Commodity prices are now forecast to rise modestly in 2008-09 reflecting an assessment of the continuing tight demand and supply conditions in global commodity markets. The higher than projected commodity prices, and the increased momentum in the economy, are expected to provide a substantial boost to company profits and other incomes in 2008-09. Overall, growth in nominal GDP in 2008-09 is forecast to be 2½ percentage points higher than the Budget projection.
The timing and extent of any adjustment to commodity prices, as well as its effect on the broader economy, remains uncertain. In response to this uncertainty, the MYEFO estimates retain the technical assumption that key commodity prices return to their long-run average level over the first two projection years (now updated to 2009-10 and 2010-11).

Part 4: Fiscal outlook
24
Box 1: Parameter revisions to revenue estimates since Budget (continued)
As well as upward revisions to GDP, and consistent with the stronger economic outcomes and outlook, asset prices have risen more strongly than estimated at Budget and are assumed to remain at higher levels. As a result, estimated capital gains tax revenue (collected from individuals, companies and superannuation funds) has been revised up across the estimates period, given higher expected growth in realised gains from shares and investment property.
Policy decisions taken since the 2007-08 Budget (up to and including 9 October 2007) have reduced revenue by $225 million in 2007-08. Major policy decisions affecting revenue over the four year forward estimates period 2007-08 to 2010-11 include:
• personal income tax cuts, with effect from 1 July 2008, reducing revenue by $34 billion over the forward estimates period;
• an increase in Australian Taxation Office funding to allow it to deploy additional staff and enhance compliance activity, increasing revenue by $2 billion over the forward estimates period; and
• the requirement for all future superannuation contributions and balances for temporary residents to be paid to the Australian Government, with effect from 1 July 2008, increasing revenue by $925 million over the forward estimates period.
A full list of revenue measures announced since the 2007-08 Budget is provided at Appendix A.
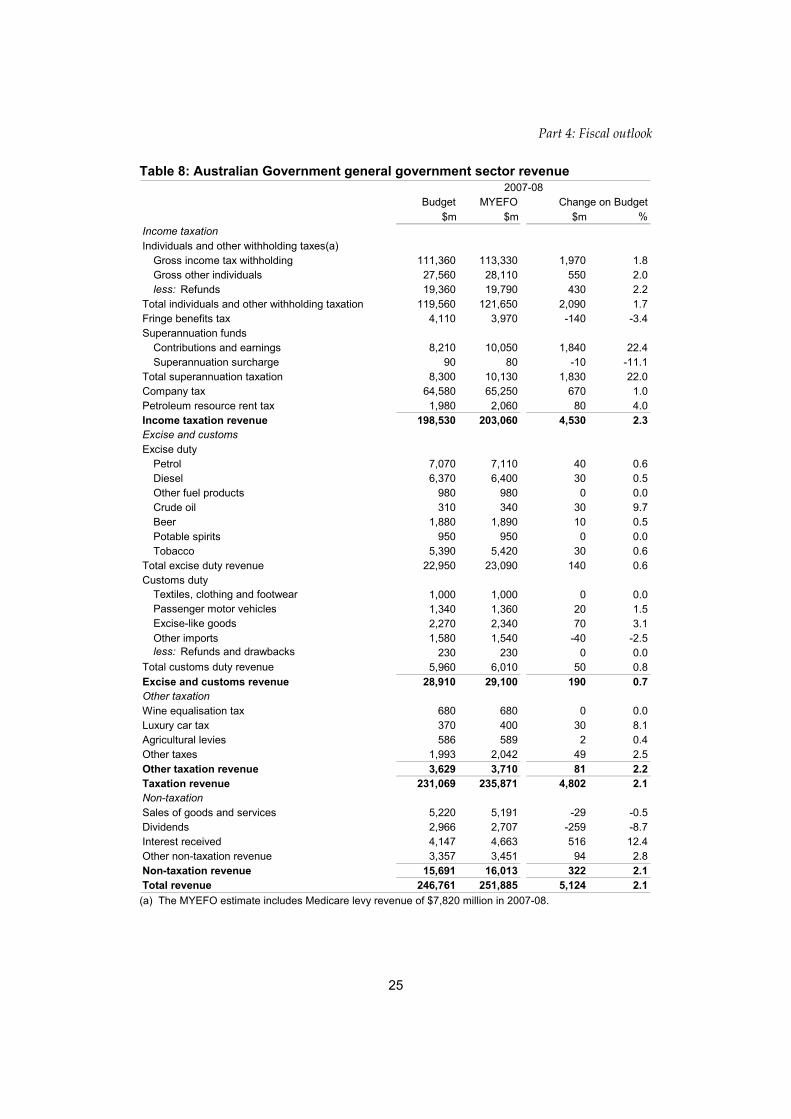
Detailed Australian Government general government sector revenue estimates for 2007-08, compared with the estimates published in the 2007-08 Budget, are provided in Table 8. Detailed cash estimates are in Table 13.
Part 4: Fiscal outlook
25
Table 8: Australian Government general government sector revenue 2007-08
Budget MYEFO$m $m $m %
Income taxationIndividuals and other withholding taxes(a)
Gross income tax withholding 111,360 113,330 1,970 1.8Gross other individuals 27,560 28,110 550 2.0less: Refunds 19,360 19,790 430 2.2
Total individuals and other withholding taxation 119,560 121,650 2,090 1.7Fringe benefits tax 4,110 3,970 -140 -3.4Superannuation funds
Contributions and earnings 8,210 10,050 1,840 22.4Superannuation surcharge 90 80 -10 -11.1
Total superannuation taxation 8,300 10,130 1,830 22.0Company tax 64,580 65,250 670 1.0Petroleum resource rent tax 1,980 2,060 80 4.0Income taxation revenue 198,530 203,060 4,530 2.3Excise and customsExcise duty
Petrol 7,070 7,110 40 0.6Diesel 6,370 6,400 30 0.5Other fuel products 980 980 0 0.0Crude oil 310 340 30 9.7Beer 1,880 1,890 10 0.5Potable spirits 950 950 0 0.0Tobacco 5,390 5,420 30 0.6
Total excise duty revenue 22,950 23,090 140 0.6Customs duty
Textiles, clothing and footwear 1,000 1,000 0 0.0Passenger motor vehicles 1,340 1,360 20 1.5Excise-like goods 2,270 2,340 70 3.1Other imports 1,580 1,540 -40 -2.5less: Refunds and drawbacks 230 230 0 0.0
Total customs duty revenue 5,960 6,010 50 0.8Excise and customs revenue 28,910 29,100 190 0.7Other taxationWine equalisation tax 680 680 0 0.0Luxury car tax 370 400 30 8.1Agricultural levies 586 589 2 0.4Other taxes 1,993 2,042 49 2.5Other taxation revenue 3,629 3,710 81 2.2Taxation revenue 231,069 235,871 4,802 2.1Non-taxation Sales of goods and services 5,220 5,191 -29 -0.5Dividends 2,966 2,707 -259 -8.7Interest received 4,147 4,663 516 12.4Other non-taxation revenue 3,357 3,451 94 2.8Non-taxation revenue 15,691 16,013 322 2.1Total revenue 246,761 251,885 5,124 2.1
Change on Budget
(a) The MYEFO estimate includes Medicare levy revenue of $7,820 million in 2007-08.
Part 4: Fiscal outlook
26
The revenue estimates for 2007-08 are constructed using the revenue outcomes for 2006-07, information on revenue collections in the year to date and revised economic forecasts for 2007-08. As explained in Box 1, the estimates for 2008-09 are now based mainly on economic forecasts for that year whereas they were based on projections at the 2007-08 Budget. Revenue estimates for the current projection years — 2009-10 and 2010-11 — are based mainly on the level of economic activity at the end of the forecast period and underlying trends in economic activity (including the assumption of key commodity prices returning to their long run average level, in two equal steps over the two projection years).
Total taxation revenue for 2007-08 is expected to be $4.8 billion higher than forecast at the 2007-08 Budget. The upward revision primarily stems from stronger growth in individuals’ incomes, particularly from stronger employment, as well as higher company profits and earnings from superannuation funds.
Estimated total individuals and other withholding tax revenue has been increased by $2.1 billion since the 2007-08 Budget.
Estimated gross income tax withholding revenue for 2007-08 has increased by $2.0 billion since the 2007-08 Budget, in line with higher forecasts of labour income, particularly as a result of stronger employment growth. Estimated gross other individuals’ tax has been revised up by $550 million in 2007-08, primarily from upward revisions to forecast growth in property (rental and interest) income and higher realised capital gains. Individual refunds have been revised up by $430 million, slightly offsetting the increase in tax paid by individuals. The increase in refunds reflects higher tax deductions (such as for personal superannuation contributions made by the self-employed) and the flow on effects of the stronger labour market outcomes in 2006-07 (which increase gross income tax withholding in 2006-07 and refunds in 2007-08).
Estimated superannuation tax revenue has been revised up by $1.8 billion in 2007-08. This revision stems from the stronger than expected outcome in 2006-07, stronger growth in earnings expected by superannuation funds (especially realised capital gains) and higher contributions (including from the increased strength in the labour market and in response to the Better Super package).
Company tax revenue in 2007-08 is expected to be $670 million higher than the 2007-08 Budget estimate, in line with higher company profit forecasts, higher expected realised capital gains from equities and the stronger than anticipated 2006-07 outcome.
The combined revenue from excise and customs duty in 2007-08 has been revised up by $190 million in 2007-08, reflecting stronger expected consumption, including of imports, as well as higher CPI outcomes, which increase excise rates for alcohol and tobacco products.

Part 4: Fiscal outlook
27
Fringe benefits tax (FBT) revenue has been revised down by $140 million in 2007-08 owing to lower than anticipated levels of salary packaging of items subject to FBT.
Expected revenue from other taxation in 2007-08 is estimated to be slightly higher than at the 2007-08 Budget.
Non-taxation revenue variations have increased revenue by $322 million in 2007-08. This largely reflects an increase in interest received by the Australian Office of Financial Management on term deposits.
EXPENSES
Estimated accrual expenses in 2007-08 have decreased by $180 million since the 2007-08 Budget. This reflects a net decrease of $3.7 billion due to parameter and other variations, partially offset by new policy measures of $3.5 billion in 2007-08.
Table 9: Reconciliation of general government sector expense estimates
2007-08 2008-09 2009-10 2010-11$m $m $m $m
2007-08 Budget expenses 235,590 247,489 259,652 272,669Changes between 2007-08 Budget and MYEFOEffect of policy decisions(a) 3,503 4,023 3,673 2,908Effect of economic parameter variations
Unemployment benefits -407 -281 -326 -265Prices and wages 412 1,136 1,294 1,044Interest and exchange rates 0 0 0 0
Total economic parameter variations 5 856 968 779Public debt interest 32 36 35 27Programme specific parameter variations -1,667 -1,821 -2,055 -2,077Slippage in 2007-08 Budget decisions 0 0 0 0Other variations(b) -2,053 -1,946 -2,912 -4,874Total variations -180 1,149 -291 -3,2362007-08 MYEFO expenses 235,410 248,638 259,361 269,433
Estimates Projections
(a) Excludes the public debt net interest effect of policy measures. (b) The contingency reserve includes an allowance for the established tendency of existing government
policy (particularly demand driven programmes) to be higher than estimated in the forward years. This allowance, known as the conservative bias allowance, is progressively reduced so that the budget year conservative bias is zero by the budget. As is standard practice, the conservative bias has been reduced at this MYEFO in the forward years from 2008-09 onwards. Following a review by Treasury and the Department of Finance and Administration, the allowance in the contingency reserve at this MYEFO is 0.5 per cent in 2008-09, 1.25 per cent in 2009-10 and 2 per cent in 2010-11.
Policy decisions taken since the 2007-08 Budget (up to and including 9 October 2007) have increased estimated expenses by $3.5 billion in 2007-08 and include:
• $794 million in 2007-08 ($1.5 billion over four years from 2006-07) in funding for drought relief, including income support and interest rate subsidies to assist farmers and small businesses most affected by the drought;

Part 4: Fiscal outlook
28
• $499 million in 2007-08 ($688 million over four years) for the Northern Territory Emergency Response to strengthen child protection services, increase the provision of family and children’s services, enhance indigenous employment opportunities and improve educational opportunities for children in remote communities;
• $223 million in 2007-08 ($1.8 billion over five years to 2011-12) for the Government’s new Disability Assistance Package to address unmet need in the provision of services for people with disabilities, their families and carers;
• $142 million in 2007-08 ($393 million over five years from 2006-07) for workplace relations reforms, including the establishment of the Office of the Workplace Ombudsman and the Workplace Authority;
• $112 million in 2007-08 ($711 million over four years) for the listing of Lucentis® and Visudyne® on the Pharmaceutical Benefits Scheme for the treatment of age-related macular degeneration;
• $110 million in 2007-08 ($393 million over four years) to increase the number of Work Skills Vouchers that provide Australians aged 25 years and over who do not have a Year 12 or equivalent qualification with a voucher up to the value of $3,000 to help improve their qualifications; and
• $101 million in 2007-08 ($336 million over four years) for the Green Vouchers for Schools programme, which encourages improved energy and water efficiency through rebates for the installation of solar hot water systems and/or specified rainwater tanks.
A full list of expense measures announced since the 2007-08 Budget is provided at Appendix A.
Since the 2007-08 Budget, parameter and other variations have reduced estimated expenses by $3.7 billion in 2007-08. This includes:
• a $945 million reduction in estimated Newstart Allowance expenses as a result of lower average rates of payments to recipients due to higher reported incomes, and a larger than previously anticipated fall in the forecast number of unemployment benefit recipients, reflecting improved labour market conditions and the greater than expected impact of the Welfare to Work measures;
• a $554 million reduction in estimated expenses due to a change in accounting that recognises education expenses when grants are due to be paid, rather than at the beginning of the calendar year. This accounting change has no impact on actual cash payments to schools (see Box 2 in Attachment E for further information);
Part 4: Fiscal outlook
29
• a $486 million reduction in estimated Family Tax Benefit (FTB) expenses due to lower than expected numbers of customers receiving FTB and decreases in average rates of payments resulting from higher family incomes;
• a $440 million reduction in estimated expenses due to reprogramming into future years of spending on a number of Defence acquisition projects;
• a $268 million reduction in forecast Parenting Payment expenses due to lower than previously anticipated customer numbers resulting from stronger than expected labour market conditions and lower average rates received by recipients due to higher reported incomes;
• a $197 million reduction in estimated expenses for the Age Pension as a result of lower than expected customer numbers and average payment rates;
• a $105 million reduction in estimated expenses arising from a revised implementation timetable for the Access Card;
• an $88 million reduction in estimated expenses for the Pharmaceutical Benefits Scheme, primarily due to a price reduction for the drug Simvastatin and the delisting of Prexige®;
• a $48 million reduction in estimated expenses for the Community Development and Employment Programme due to lower than expected take-up of programme places; and
• a reduction in expense estimates following the inclusion of a provision for underspends in 2007-08. A provision is included each year at the MYEFO update to provide for the established tendency of agencies to underspend their budgets in the current financial year.
These reductions in expenses have been partially offset by:
• a $106 million increase in estimated Medicare Services expenses primarily due to a higher than anticipated level of patient access to psychiatrists, psychologists and General Practitioners for mental health care services under the Medicare Benefits Schedule;
• a $50 million increase in estimated Disability Support Pension expenses primarily due to higher than expected customer numbers; and
• a $46 million increase in estimated Community Pharmacy and Pharmacy Awareness expenses as a result of a higher than forecast take-up by pharmacies of the Pharmaceutical Benefits Scheme Online claiming facility.

Part 4: Fiscal outlook
30
NET CAPITAL INVESTMENT
Estimated net capital investment in 2007-08 has increased by $421 million since the 2007-08 Budget. This partially reflects new policy decisions of $181 million, including:
• $57 million in 2007-08 for the Northern Territory Emergency Response for short-term accommodation, computer and communications infrastructure and other capital investment;
• $28 million in 2007-08 ($86 million over four years) for the Standard Business Reporting programme, to cut the red tape confronting business when reporting to government; and
• $27 million in 2007-08 to upgrade information technology systems to improve border security arrangements for travellers entering Australia.
Other variations have increased forecast net capital investment by $240 million, primarily due to the implementation of a substantial capital programme by Defence Housing Australia to replace expiring leases ($211 million).
Table 10: Reconciliation of general government sector net capital investment estimates(a)
2007-08 2008-09 2009-10 2010-11$m $m $m $m
2007-08 Budget net capital investment 1,171 1,377 861 939Changes between 2007-08 Budget and MYEFOEffect of policy decisions(b) 181 84 112 324Effect of parameter and other variations 240 302 -10 -312Total variations 421 386 102 122007-08 MYEFO net capital investment 1,592 1,763 963 951
Estimates Projections
(a) Net capital investment is defined as net acquisition of non-financial assets. (b) Excludes the public debt net interest effect of policy measures.
CASH FLOWS
In 2007-08, the underlying cash balance is expected to be a surplus of $14.8 billion, compared to an estimate of $10.6 billion at the 2007-08 Budget.

Part 4: Fiscal outlook
31
Table 11: Summary of Australian Government general government sector cash flows ($b)(a)
Budget MYEFO Budget MYEFOCash receipts
Operating cash receiptsexcluding Future Fund earnings 242.4 248.2 256.2 260.3Future Fund earnings 3.0 3.4 2.8 3.1Total operating receipts 245.4 251.5 259.0 263.3Capital cash receipts(b) 0.3 0.3 0.2 0.3
Total cash receipts 245.6 251.8 259.2 263.6Cash payments
Operating cash payments 228.3 229.7 239.8 241.9Capital cash payments(c) 3.7 3.9 3.4 3.7
Total cash payments 232.0 233.6 243.2 245.6Finance leases and similar arrangements(d) 0.0 0.0 -0.5 -0.5GFS cash surplus(+)/deficit(-) 13.6 18.2 15.5 17.5Per cent of GDP 1.2 1.6 1.4 1.5less Future Fund earnings 3.0 3.4 2.8 3.1Underlying cash balance(e) 10.6 14.8 12.7 14.4Per cent of GDP 1.0 1.3 1.1 1.2Memorandum items:Net cash flows from investments in financial
assets for policy purposes(f) 4.7 4.6 0.0 0.9plus Future Fund earnings(g) 3.0 3.4 2.8 3.1Headline cash balance 18.3 22.8 15.5 18.4
Budget MYEFO Budget MYEFOCash receipts
Operating cash receiptsexcluding Future Fund earnings 269.9 274.6 282.7 283.2Future Fund earnings 2.9 3.2 3.0 3.3Total operating receipts 272.8 277.8 285.7 286.6Capital cash receipts(b) 0.1 0.3 0.1 0.1
Total cash receipts 272.9 278.1 285.8 286.6Cash payments
Operating cash payments 252.9 253.6 267.2 264.9Capital cash payments(c) 3.3 3.6 3.2 3.4
Total cash payments 256.2 257.1 270.4 268.2Finance leases and similar arrangements(d) 0.0 0.0 0.0 0.0GFS cash surplus(+)/deficit(-) 16.7 20.9 15.4 18.4Per cent of GDP 1.4 1.7 1.2 1.4less Future Fund earnings 2.9 3.2 3.0 3.3Underlying cash balance(e) 13.8 17.7 12.4 15.1Per cent of GDP 1.2 1.4 1.0 1.2Memorandum items:Net cash flows from investments in financial
assets for policy purposes(f) -1.9 -1.8 -2.1 -2.0plus Future Fund earnings (g) 2.9 3.2 3.0 3.3Headline cash balance 14.8 19.1 13.3 16.4
Estimates
Projections
2008-09
2009-10 2010-11
2007-08
(a) Cash flows are derived from the accrual GFS framework excluding GST. (b) Equivalent to cash receipts from the sale of non-finance assets in the GFS cash flow statement. (c) Equivalent to cash payments for purchases of new and second-hand non-financial assets in the GFS cash flow
statement. (d) The acquisition of assets under finance leases decreases the underlying cash balance. The disposal of assets
previously held under finance leases increases the underlying cash balance. (e) Excludes Future Fund earnings. (f) Under the cash budgeting framework, these cash flows were referred to as net advances. (g) The earnings assume the second instalment of proceeds from Telstra 3 are transferred to the Future Fund. The Fund is
assumed to earn a rate of return that exceeds the yield on term deposits held by the Government but reflects an incremental transition to the long term benchmark return specified in the Government’s Future Fund investment mandate. The earnings exclude capital gains which are reflected in the statement of other economic flows.

Part 4: Fiscal outlook
32
The difference between the higher underlying cash balance of $4.2 billion and the higher fiscal balance of $4.9 billion is primarily due to the change in accounting for education expenses ($554 million) which reduces accrual expenses but not cash, and an increase in earnings of the Future Fund due to the transfer of an additional $7.0 billion from the 2006-07 surplus which are excluded from the underlying cash balance.
Table 12 provides a reconciliation of the variations in the underlying cash balance estimates.
Table 12: Reconciliation of Australian Government general government sector underlying cash balance estimates
Estimates Projections2007-08 2008-09 2009-10 2010-11
$m $m $m $m2007-08 Budget underlying cash balance(a) 10,637 12,712 13,812 12,447Changes from 2007-08 Budget to MYEFOEffect of policy decisions(b) -3,886 -10,840 -13,859 -17,996Effect of parameter and other variations 8,083 12,525 17,776 20,638Total variations 4,197 1,685 3,917 2,6422007-08 MYEFO underlying cash balance(a) 14,834 14,396 17,729 15,089
(a) Excludes expected Future Fund earnings. (b) Excludes the public debt net interest effect of policy measures.
Total receipts in 2007-08 are expected to be $5.8 billion (excluding Future Fund earnings) higher than forecast at the 2007-08 Budget, comprising $5.0 billion in tax receipts and $877 million in non-tax receipts. Similar to the revision to the revenue estimates, the revisions to tax receipts are driven by upward revisions to the forecasts of labour market outcomes and company profits, combined with expected stronger growth in realised capital gains and the flow on effects of the higher than expected outcome in 2006-07.

Part 4: Fiscal outlook
33
Table 13: Australian Government general government sector receipts
Budget MYEFO$m $m $m %
Income taxationIndividuals and other withholding taxes(a)
Gross income tax withholding 110,690 112,730 2,040 1.8Gross other individuals 26,620 27,140 520 2.0less: Refunds 19,360 19,790 430 2.2
Total individuals and other withholding taxation 117,950 120,080 2,130 1.8Fringe benefits tax 4,050 3,880 -170 -4.2Superannuation funds
Contributions and earnings 8,160 10,000 1,840 22.5Superannuation surcharge 120 120 0 0.0
Total superannuation taxation 8,280 10,120 1,840 22.2Company tax 62,964 63,830 866 1.4Petroleum resource rent tax 1,890 1,950 60 3.2Income taxation receipts 195,134 199,860 4,726 2.4Excise and customsExcise duty
Petrol 7,060 7,070 10 0.1Diesel 6,370 6,400 30 0.5Other fuel products 980 980 0 0.0Crude oil 310 340 30 9.7Beer 1,880 1,890 10 0.5Potable spirits 950 950 0 0.0Tobacco 5,390 5,420 30 0.6
Total excise duty receipts 22,940 23,050 110 0.5Customs duty
Textiles, clothing and footwear 1,000 1,000 0 0.0Passenger motor vehicles 940 960 20 2.1Excise-like goods 2,270 2,340 70 3.1Other imports 1,570 1,530 -40 -2.5less: Refunds and drawbacks 370 370 0 0.0
Total customs duty receipts 5,410 5,460 50 0.9Excise and customs receipts 28,350 28,510 160 0.6Other taxationWine equalisation tax 670 670 0 0.0Luxury car tax 360 390 30 8.3Agricultural levies 586 589 2 0.4Other taxes 1,757 1,800 43 2.4Other taxation receipts 3,373 3,448 75 2.2Taxation receipts 226,857 231,818 4,961 2.2Non-taxation Sales of goods and services 5,437 5,445 8 0.2Dividends(b) 2,926 2,692 -234 -8.0Interest received(b) 3,992 4,482 490 12.3Other non-taxation receipts 6,399 7,402 1,004 15.7Non-taxation receipts 18,754 20,022 1,268 6.8Total receipts 245,611 251,840 6,229 2.5
Change on Budget2007-08
(a) The MYEFO estimate includes Medicare levy receipts of $7,820 million in 2007-08. (b) Includes earnings of the Future Fund.

Part 4: Fiscal outlook
34
NET DEBT AND NET WORTH
Net debt was eliminated in 2005-06, falling from a peak of 18.5 per cent of GDP in 1995-96. Since Budget, the forecast level of net debt for 2007-08 has improved from -$12.0 billion to -$16.1 billion (-1.4 per cent of GDP). The improvement largely reflects the higher underlying cash surplus.
As a result of the elimination of net debt, the Government is expected to earn net interest receipts of $0.8 billion in 2007-08. Prior to 2007-08 the Government made annual net interest payments, which peaked at $8.4 billion in 1996-97.
Net worth measures the value of all government assets less liabilities. It therefore represents the government’s contribution to national wealth. Net worth includes many items not included in net debt, such as the superannuation liability currently valued at around $107 billion. As the broadest measure of the government’s financial position, net worth is a key indicator of fiscal sustainability. A strong net worth position improves the government’s ability to meet the fiscal consequences of an ageing population.
Net worth is expected to be $17.2 billion (1.5 per cent of GDP) in 2007-08, compared with the Budget estimate of -$0.6 billion. Over the forward estimates net worth is projected to improve further.
The improvement in net worth for 2007-08 since Budget reflects a stronger than anticipated improvement in the net operating surplus of $5.3 billion. The net worth position for 2007-08 also includes an opening balance adjustment of $8.3 billion due to a change in accounting for education expenses (see Box 2 in Attachment E for additional information). Historical net worth has also been revised, showing that net worth has been positive since 2006-07. Previously, net worth was projected to become positive in 2008-09.
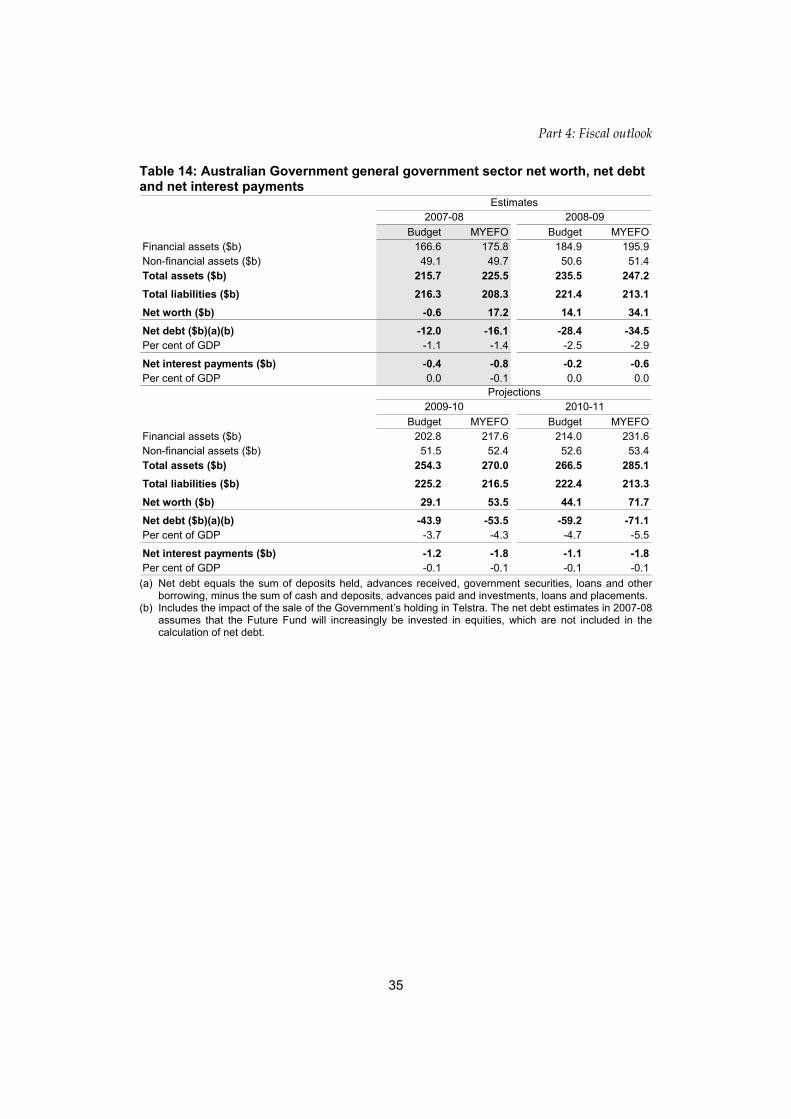
Part 4: Fiscal outlook
35
Table 14: Australian Government general government sector net worth, net debt and net interest payments
Budget MYEFO Budget MYEFOFinancial assets ($b) 166.6 175.8 184.9 195.9Non-financial assets ($b) 49.1 49.7 50.6 51.4Total assets ($b) 215.7 225.5 235.5 247.2Total liabilities ($b) 216.3 208.3 221.4 213.1Net worth ($b) -0.6 17.2 14.1 34.1Net debt ($b)(a)(b) -12.0 -16.1 -28.4 -34.5Per cent of GDP -1.1 -1.4 -2.5 -2.9
Net interest payments ($b) -0.4 -0.8 -0.2 -0.6Per cent of GDP 0.0 -0.1 0.0 0.0
Budget MYEFO Budget MYEFOFinancial assets ($b) 202.8 217.6 214.0 231.6Non-financial assets ($b) 51.5 52.4 52.6 53.4Total assets ($b) 254.3 270.0 266.5 285.1Total liabilities ($b) 225.2 216.5 222.4 213.3Net worth ($b) 29.1 53.5 44.1 71.7Net debt ($b)(a)(b) -43.9 -53.5 -59.2 -71.1Per cent of GDP -3.7 -4.3 -4.7 -5.5
Net interest payments ($b) -1.2 -1.8 -1.1 -1.8Per cent of GDP -0.1 -0.1 -0.1 -0.1
Estimates
Projections
2007-08 2008-09
2009-10 2010-11
(a) Net debt equals the sum of deposits held, advances received, government securities, loans and other
borrowing, minus the sum of cash and deposits, advances paid and investments, loans and placements. (b) Includes the impact of the sale of the Government’s holding in Telstra. The net debt estimates in 2007-08
assumes that the Future Fund will increasingly be invested in equities, which are not included in the calculation of net debt.

36
Attachment A
REPORTING STANDARDS
The Charter of Budget Honesty Act 1998 requires that the Mid-Year Economic and Fiscal Outlook (MYEFO) be based on external reporting standards, and that departures from applicable external reporting standards be identified.
The major external standards used for MYEFO reporting purposes are:
• the Australian Bureau of Statistics’ (ABS) accrual Government Finance Statistics (GFS) publication, Australian System of Government Finance Statistics: Concepts, Sources and Methods cat. no. 5514.0, which in turn is based on the International Monetary Fund (IMF) accrual GFS framework; and
• Australian Accounting Standards (AAS), being the Australian Equivalents to International Financial Reporting Standards (AEIFRS) and AAS 31 Financial Reporting by Governments.
The MYEFO tables, with the exception of tables in Appendix B, do not include goods and services tax (GST) collections and equivalent payments to the States and Territories (the States). Under the Intergovernmental Agreement on the Reform of Commonwealth-State Financial Relations, all GST receipts are appropriated to the States and thus are not available for expenditure by the Australian Government. Because the Australian Taxation Office collects GST as an agent for the States, GST receipts are not shown as Australian Government revenue. Estimates of GST receipts are provided in Table E2 of Appendix E.
ABS GFS requires that provisions for bad and doubtful debts be excluded from the balance sheet. This treatment has not been adopted because excluding such provisions would overstate the value of Australian Government assets in the balance sheet (and would, therefore, be inconsistent with the market valuation principle).
The AAS financial statements currently record IMF Special Drawing Rights (SDRs) as a liability. This is consistent with AAS. The GFS statements also record SDRs as a liability. However, in accordance with the IMF’s GFS manual, IMF SDRs are not treated as a liability in ABS GFS although IMF treats them this way in some of its other documentation. The statistical standard underpinning the GFS manual (the System of National Accounts 1993) is currently being updated and includes a proposal to treat SDRs as a liability.
The GFS financial statements currently adopt the AAS treatment for circulating coins. Under this treatment revenue is recognised upon the issue of coins and no liability is recorded, as there is no legal obligation requiring coins on issue to be repurchased by the Australian Government. However, in ABS GFS, coins on issue are treated as a

Part 4: Fiscal outlook
37
liability and no revenue is recognised. The treatment of coins on issue is listed for clarification as part of the update of the statistical standard referred to above.
ABS GFS also requires defence weapons be treated as expenses. This treatment is currently adopted in the GFS financial statements; however the update of the statistical standard is expected to change the treatment of defence weapons to assets. The AAS financial statements record defence weapons as assets, which is consistent with AAS.
Defence weapons inventories acquired and disposed of during the estimates periods are recorded as capital investment rather than expenses until such inventories can be reliably identified and measured. Consistent with the Final Budget Outcome 2006-07, defence weapons inventories at 2006-07 have been removed from the balance sheet for budget reporting purposes.
Additional information on the reporting standards and budget concepts is provided in Appendix E.

38
Attachment B
BUDGET FINANCIAL STATEMENTS
The budget financial statements consist of an operating statement, balance sheet, cash flow statement and statement of other economic flows (reconciliation of net worth) for the Australian Government general government sector. The budget financial statements are based on GFS standards with the exception of the departures discussed in Attachment A.

Part 4: Fiscal outlook
39
Table 15: Australian Government general government sector operating statement
2007-08 2008-09 2009-10 2010-11$m $m $m $m
RevenueTaxation revenue 235,871 246,766 260,071 267,266Current grants and subsidies 0 0 0 0Sales of goods and services 5,191 5,322 5,452 5,567Interest income 4,663 4,467 5,601 6,537Dividend income 2,707 4,017 4,003 4,384Other 3,451 3,471 3,613 3,755Total revenue 251,885 264,042 278,739 287,509ExpensesGross operating expenses
Depreciation 2,483 2,650 2,761 2,765Superannuation 2,675 2,724 2,805 2,945Salaries and wages 15,093 15,001 15,426 15,826Payment for supply of goods and services 58,056 61,725 64,888 66,834Other operating expenses 3,314 3,537 3,678 3,882
Total gross operating expenses 81,620 85,638 89,558 92,253
Nominal superannuation interest expense 6,276 6,319 6,470 6,723Other interest expenses 3,992 3,911 3,886 3,737Other property expenses 0 0 0 0
Current transfersGrant expenses 44,889 47,866 49,400 50,543Subsidy expenses 7,314 7,542 7,826 8,137Personal benefit payments in cash 84,487 89,783 94,954 100,930Other current transfers 0 0 0 0
Total current transfers 136,690 145,191 152,180 159,611
Capital transfers 6,831 7,578 7,267 7,110Total expenses 235,410 248,638 259,361 269,433Net operating balance 16,474 15,405 19,378 18,076Net acquisition of non-financial assetsPurchases of non-financial assets 3,715 4,329 3,670 3,449less Sales of non-financial assets 256 252 250 92less Depreciation 2,483 2,650 2,761 2,765plus Change in inventories 238 221 188 212plus Other movements in non-financial
assets 378 116 115 148Total net acquisition of non-financial
assets 1,592 1,763 963 951Net lending/fiscal balance(a) 14,882 13,642 18,415 17,125
Estimates Projections
(a) The term fiscal balance is not used by the ABS.

Part 4: Fiscal outlook
40
Table 16: Australian Government general government sector balance sheet
2007-08 2008-09 2009-10 2010-11$m $m $m $m
AssetsFinancial assets
Cash and deposits 1,043 1,135 1,018 1,420Advances paid 25,013 26,132 27,062 28,197Investments, loans and placements 57,039 74,542 91,902 100,089Other non-equity assets 20,541 19,824 20,065 20,768Equity(a) 72,191 74,229 77,567 81,154
Total financial assets 175,828 195,861 217,614 231,627
Non-financial assetsLand 6,940 6,972 6,900 7,016Buildings 16,981 18,258 19,122 20,062Plant, equipment and infrastructure 10,931 11,084 11,049 10,784Inventories 3,486 3,610 3,788 3,971Heritage and cultural assets 8,245 8,258 8,280 8,294Other non-financial assets 3,090 3,206 3,251 3,307
Total non-financial assets 49,673 51,387 52,389 53,433Total assets 225,501 247,249 270,003 285,061LiabilitiesDeposits held 263 263 263 263Advances received 0 0 0 0Government securities 59,288 59,469 58,917 50,947Loans 7,085 6,801 6,556 6,610Other borrowing 365 824 784 741Superannuation liability 106,879 110,654 114,379 118,158Other employee entitlements and provisions 8,479 8,829 9,204 9,645Other non-equity liabilities 25,926 26,268 26,406 26,947Total liabilities 208,284 213,108 216,508 213,311Net worth(b) 17,217 34,141 53,494 71,750Net debt(c)(d) -16,094 -34,452 -53,463 -71,145
Estimates Projections
(a) Equity includes share holdings of the Future Fund. (b) Net worth is calculated as total assets minus total liabilities. (c) Net debt equals the sum of deposits held, advances received, government securities, loans and other
borrowing, minus the sum of cash and deposits, advances paid and investments, loans and placements. (d) Includes the impact of the sale of the Government’s holding in Telstra. The net debt estimate in 2007-08
assumes that the Future Fund will increasingly be invested in equities, which are not included in the calculation of net debt.
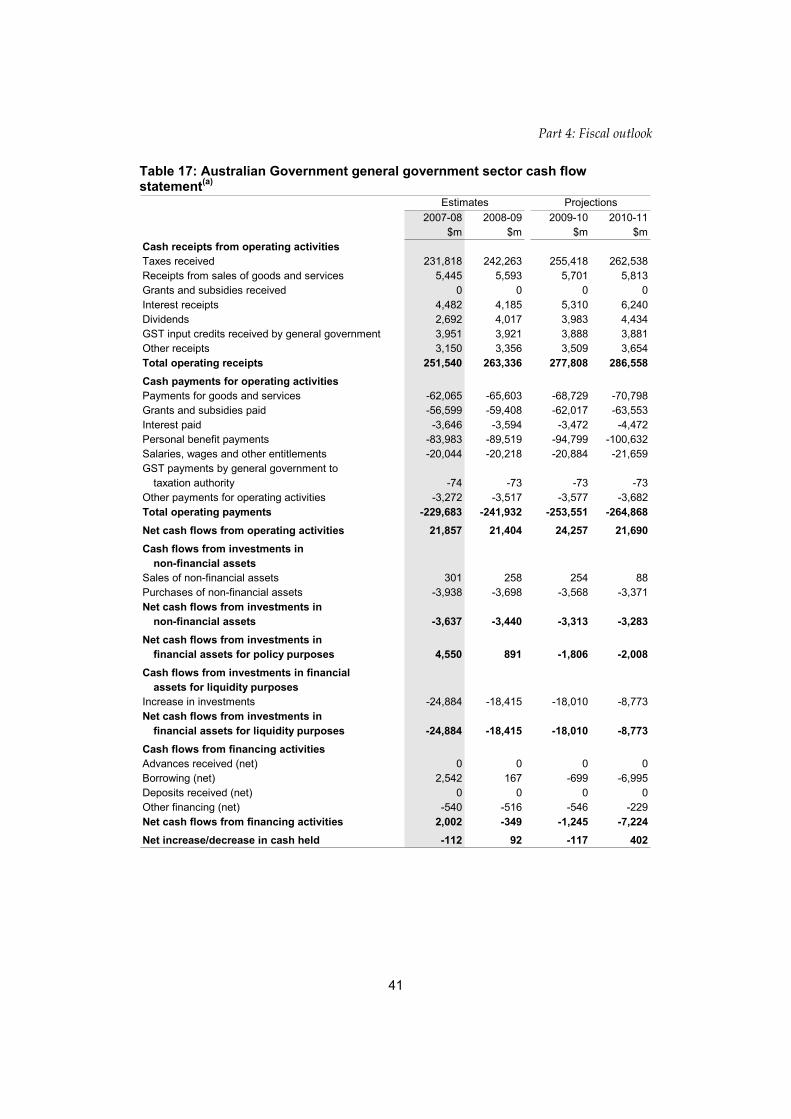
Part 4: Fiscal outlook
41
Table 17: Australian Government general government sector cash flow statement(a)
2007-08 2008-09 2009-10 2010-11$m $m $m $m
Cash receipts from operating activitiesTaxes received 231,818 242,263 255,418 262,538Receipts from sales of goods and services 5,445 5,593 5,701 5,813Grants and subsidies received 0 0 0 0Interest receipts 4,482 4,185 5,310 6,240Dividends 2,692 4,017 3,983 4,434GST input credits received by general government 3,951 3,921 3,888 3,881Other receipts 3,150 3,356 3,509 3,654Total operating receipts 251,540 263,336 277,808 286,558Cash payments for operating activitiesPayments for goods and services -62,065 -65,603 -68,729 -70,798Grants and subsidies paid -56,599 -59,408 -62,017 -63,553Interest paid -3,646 -3,594 -3,472 -4,472Personal benefit payments -83,983 -89,519 -94,799 -100,632Salaries, wages and other entitlements -20,044 -20,218 -20,884 -21,659GST payments by general government to
taxation authority -74 -73 -73 -73Other payments for operating activities -3,272 -3,517 -3,577 -3,682Total operating payments -229,683 -241,932 -253,551 -264,868Net cash flows from operating activities 21,857 21,404 24,257 21,690Cash flows from investments in
non-financial assetsSales of non-financial assets 301 258 254 88Purchases of non-financial assets -3,938 -3,698 -3,568 -3,371Net cash flows from investments in
non-financial assets -3,637 -3,440 -3,313 -3,283Net cash flows from investments in
financial assets for policy purposes 4,550 891 -1,806 -2,008Cash flows from investments in financial
assets for liquidity purposesIncrease in investments -24,884 -18,415 -18,010 -8,773Net cash flows from investments in
financial assets for liquidity purposes -24,884 -18,415 -18,010 -8,773Cash flows from financing activitiesAdvances received (net) 0 0 0 0Borrowing (net) 2,542 167 -699 -6,995Deposits received (net) 0 0 0 0Other financing (net) -540 -516 -546 -229Net cash flows from financing activities 2,002 -349 -1,245 -7,224Net increase/decrease in cash held -112 92 -117 402
Estimates Projections

Part 4: Fiscal outlook
42
Table 17: Australian Government general government sector cash flow statement(a) (continued)
Estimates Projections2007-08 2008-09 2009-10 2010-11
$m $m $m $mNet cash from operating activities and
investments in non-financial assets 18,220 17,964 20,944 18,407Finance leases and similar arrangements(b) -4 -502 -6 0GFS cash surplus(+)/deficit(-) 18,216 17,463 20,938 18,406less Future Fund earnings 3,382 3,066 3,210 3,317Equals underlying cash balance(c) 14,834 14,396 17,729 15,089plus net cash flows from investments in
financial assets for policy purposes 4,550 891 -1,806 -2,008plus Future Fund earnings 3,382 3,066 3,210 3,317Equals headline cash balance 22,766 18,354 19,132 16,399
(a) A positive number denotes a cash inflow; a negative sign denotes a cash outflow. (b) The acquisition of assets under finance leases decreases the underlying cash balance. The disposal of
assets previously held under finance leases increases the underlying cash balance. (c) The term underlying cash balance is not used by the ABS.
Table 18: Australian Government general government sector statement of other economic flows (reconciliation of net worth)
2007-08 2008-09 2009-10 2010-11$m $m $m $m
Opening net worth -6,068 17,217 34,141 53,494Opening net worth adjustments(a) 8,291 0 0 0
Adjusted opening net worth 2,223 17,217 34,141 53,494Change in net worth from operating
transactions 16,474 15,405 19,378 18,076Change in net worth from other
economic flowsRevaluation of equity(b) 608 3,866 2,627 2,917Net writedowns of assets
(including bad and doubtful debts) -2,020 -1,833 -2,060 -2,144Assets recognised for the first time 7 4 19 12Liabilities recognised for the first time 0 0 0 0Actuarial revaluations 0 0 0 0Net foreign exchange gains 0 0 0 0Net swap interest received -113 -127 -109 -99Market valuation of debt -381 152 117 125Other economic revaluations(c) 419 -543 -619 -632
Total other economic flows -1,480 1,519 -24 179Closing net worth 17,217 34,141 53,494 71,750
Estimates Projections
(a) Adjustment to net worth arising mainly from a change in accounting policy for education grants. (b) Revaluations of equity reflects changes in the market valuation of investments. This line also reflects any
equity revaluations at the point of disposal or sale. (c) Largely reflects revaluation of assets and liabilities.

43
Attachment C
SENSITIVITY OF FISCAL EXPENSES AND REVENUE TO ECONOMIC DEVELOPMENTS
A guide to the sensitivity of the forward estimates of expenses and revenue due to variations in economic parameters in 2007-08 is provided in Table 19. It is important to note that the sensitivity analysis gives only a ‘rule of thumb’ indication of the impact on the budget of changes in prices, wages and other parameters. In each case, the analysis presents the estimated effects of a change in one economic variable only, and does not attempt to capture the linkages between economic variables that characterise changes in the economy more broadly.
Table 19: Sensitivity of fiscal expenses and revenue to changes in economic parameters
2007-08 2008-09 2009-10 2010-11$m $m $m $m
ExpensesPrices 500 720 920 940Wages 0 340 550 570Federal Minimum Wage decision 0 100 170 270Unemployment benefit recipients 120 250 270 270
RevenuePrices 20 150 160 170Wages 1,010 2,080 2,100 2,240Employment 970 1,980 2,000 2,130Private final demand 130 300 310 320Profits 180 780 870 880
EXPENSES
On the expenses side, the sensitivity analysis of the estimates provides for the following assumptions about changes to four broad groups of parameters. An increase in any of the parameters considered will lead to an increase in expenses, and a decrease in any of the parameters will lead to a reduction in expenses.
Prices All price growth rates are assumed to change by one percentage point in the March quarter 2008 and to remain unchanged subsequently, with all wage and salary growth rates left unchanged through the budget and forward years.
• The effect of a change in prices is due to the indexation of Australian Government expenses (which impacts more in the forward years than the budget year) and a
Part 4: Fiscal outlook
44
one-off impact on military superannuation liabilities in 2007-08 (which in turn impacts on the defence superannuation interest expense).
Wages All wage and salary growth rates are assumed to change by one percentage point in the March quarter 2008 and to remain unchanged subsequently, with all price growth rates left unchanged through the budget and forward years.
• The effect of a change in wage and salary growth rates is largely due to the Government’s commitment to maintain selected pensions at a minimum of 25 per cent of Male Total Average Weekly Earnings. This effect on pensions is smaller in the budget year than in each of the forward years due to the timing of adjustments to pension rates. The wages effect in Table 19 above does not include changes to wage and salary payments in Australian Government departmental expenses.
The Federal Minimum Wage decision The Federal Minimum Wage increase determined by the Australian Fair Pay Commission (AFPC) in July each year remains unchanged in the budget year and is assumed to be $2 per week higher in all forward years.
• Around $65 billion of expenses in 2007-08, comprising agency departmental expenses, other Australian Government Own Purpose Expenses and Specific Purpose Payments to the States of a departmental expense nature, are indexed to weighted averages of movements in the Consumer Price Index and the Federal Minimum Wage decision.
Unemployment Benefit Recipients (Newstart Allowance and Unemployed Youth Allowance recipients) The total number of recipients is assumed to change by 2.5 per cent in the budget year and by 5 per cent in all the forward years.
REVENUE
On the revenue side, the sensitivity analysis of the estimates provides for the following assumptions about changes to five broad groups of parameters. An increase in any of the parameters considered will lead to an increase in revenue and a decrease in any of the parameters will lead to a reduction in revenue.
Part 4: Fiscal outlook
45
Prices All price deflators and world oil prices are assumed to change by one percentage point at the start of the March quarter 2008, with no change in wage deflators.
• A change in prices affects revenue primarily through changes in excise revenue and petroleum resource rent tax.
Wages All wage and salary growth rates are assumed to change by one percentage point from the beginning of the March quarter 2008, with no change in the price deflators.
• A change in wage and salary growth affects revenue through changes in gross income tax withholding, individuals’ refunds, superannuation funds and fringe benefits tax revenue.
Employment The level of employment is assumed to change by one percentage point from the beginning of the March quarter 2008, with no change in the composition of employment.
• A change in employment affects revenue primarily through changes in gross income tax withholding and superannuation fund revenue, and individuals’ refunds.
Private final demand The level of private final demand (consumption plus investment) is assumed to change by one percentage point from the beginning of the March quarter 2008, with no change in the composition of private final demand.
• A change in private final demand affects revenue primarily through changes in excise and customs duty.
Profits The level of profits is assumed to change by one percentage point from the beginning of the March quarter 2008.
• A change in the level of profits affects revenue through changes in taxes on companies and other individuals.
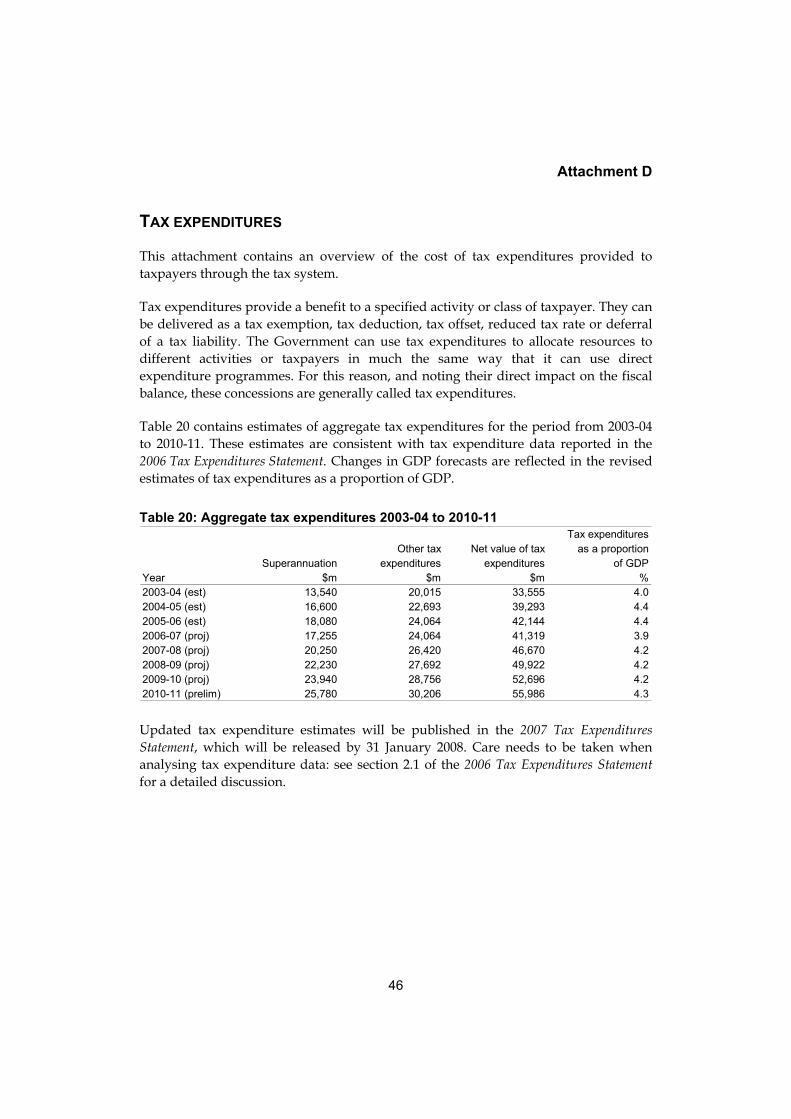
46
Attachment D
TAX EXPENDITURES
This attachment contains an overview of the cost of tax expenditures provided to taxpayers through the tax system.
Tax expenditures provide a benefit to a specified activity or class of taxpayer. They can be delivered as a tax exemption, tax deduction, tax offset, reduced tax rate or deferral of a tax liability. The Government can use tax expenditures to allocate resources to different activities or taxpayers in much the same way that it can use direct expenditure programmes. For this reason, and noting their direct impact on the fiscal balance, these concessions are generally called tax expenditures.
Table 20 contains estimates of aggregate tax expenditures for the period from 2003-04 to 2010-11. These estimates are consistent with tax expenditure data reported in the 2006 Tax Expenditures Statement. Changes in GDP forecasts are reflected in the revised estimates of tax expenditures as a proportion of GDP.
Table 20: Aggregate tax expenditures 2003-04 to 2010-11
Tax expendituresOther tax Net value of tax as a proportion
Superannuation expenditures expenditures of GDPYear $m $m $m %2003-04 (est) 13,540 20,015 33,555 4.02004-05 (est) 16,600 22,693 39,293 4.42005-06 (est) 18,080 24,064 42,144 4.42006-07 (proj) 17,255 24,064 41,319 3.92007-08 (proj) 20,250 26,420 46,670 4.22008-09 (proj) 22,230 27,692 49,922 4.22009-10 (proj) 23,940 28,756 52,696 4.22010-11 (prelim) 25,780 30,206 55,986 4.3 Updated tax expenditure estimates will be published in the 2007 Tax Expenditures Statement, which will be released by 31 January 2008. Care needs to be taken when analysing tax expenditure data: see section 2.1 of the 2006 Tax Expenditures Statement for a detailed discussion.

47
Attachment E
SUPPLEMENTARY EXPENSE AND CAPITAL TABLES AND THE CONTINGENCY RESERVE
Expenses Table 21 shows estimates of Australian Government general government expenses by function and sub-function for 2007-08 and the forward years.
Box 2: Revised accounting treatment of education grants
The accounting treatment of education grants primarily to State and Territory governments has been changed in this MYEFO relative to the treatment applied at the 2007-08 Budget. This accounting change means that in accrual terms the expense is recorded to have occurred at a later time.
This is purely a change in accounting treatment. There is no effect on actual education payments.
The accounting change is a one-off adjustment which is required to meet the requirements of the Australian Bureau of Statistics (ABS). It also follows a recent view of the Australian National Audit Office (ANAO) to require a revised treatment under Australian Accounting Standards, compared to that adopted in previous years.
The accounting change relates to the time at which education grants are recognised as accrual expenses.
Previously, these expenses were recognised when a Ministerial determination was signed setting out the payments to be made by the Commonwealth to the States in the following year. However, the ANAO has recently advised that it considers that the grants should now be recognised when payments are due to be made to the States, usually each month. This is also consistent with the requirements of the GFS system applied by the ABS.
Because education grants grow each year, the Ministerial determination for the forthcoming year is always higher than the payments in the current year. This explains why delaying the time at which expenses are recognised in accounting terms (that is, until the payments are actually made) can have a negative impact on reported education expenses, even though there is no change in the amounts actually paid.
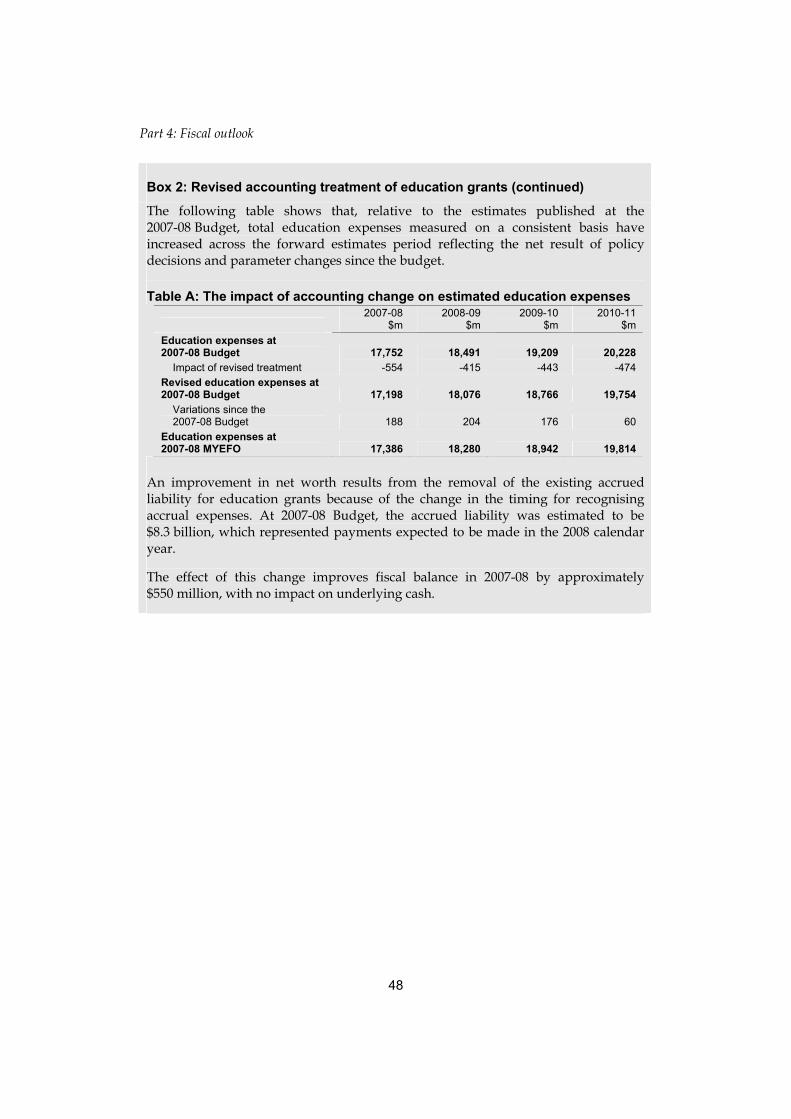
Part 4: Fiscal outlook
48
Box 2: Revised accounting treatment of education grants (continued)
The following table shows that, relative to the estimates published at the 2007-08 Budget, total education expenses measured on a consistent basis have increased across the forward estimates period reflecting the net result of policy decisions and parameter changes since the budget.
Table A: The impact of accounting change on estimated education expenses
2007-08
$m 2008-09
$m 2009-10
$m 2010-11
$m Education expenses at 2007-08 Budget 17,752 18,491 19,209 20,228
Impact of revised treatment -554 -415 -443 -474 Revised education expenses at 2007-08 Budget 17,198 18,076 18,766 19,754
Variations since the 2007-08 Budget 188 204 176 60
Education expenses at 2007-08 MYEFO 17,386 18,280 18,942 19,814
An improvement in net worth results from the removal of the existing accrued liability for education grants because of the change in the timing for recognising accrual expenses. At 2007-08 Budget, the accrued liability was estimated to be $8.3 billion, which represented payments expected to be made in the 2008 calendar year.
The effect of this change improves fiscal balance in 2007-08 by approximately $550 million, with no impact on underlying cash.

Part 4: Fiscal outlook
49
Tabl
e 21
: Est
imat
es o
f Aus
tral
ian
Gov
ernm
ent g
ener
al g
over
nmen
t exp
ense
s by
func
tion
and
sub-
func
tion
Cha
nge
Cha
nge
Cha
nge
Cha
nge
on
onon
on
B
udge
tM
YE
FOB
udge
tB
udge
tM
YE
FOB
udge
tB
udge
tM
YE
FOB
udge
tB
udge
tM
YE
FOB
udge
t$m
$m%
$m$m
%$m
$m%
$m$m
%G
ener
al p
ublic
ser
vice
sLe
gisl
ativ
e an
d ex
ecut
ive
affa
irs1,
039
1,02
0-2
854
823
-487
584
8-3
1,03
11,
015
-2Fi
nanc
ial a
nd fi
scal
affa
irs5,
244
5,21
90
5,52
75,
585
15,
621
5,77
83
5,87
25,
724
-3Fo
reig
n af
fairs
and
eco
nom
ic a
id3,
693
3,64
7-1
4,27
54,
197
-24,
528
4,48
2-1
5,19
75,
009
-4G
ener
al re
sear
ch2,
599
2,51
2-3
2,59
32,
530
-22,
647
2,59
0-2
2,59
52,
627
1G
ener
al s
ervi
ces
706
756
764
968
25
642
671
566
967
41
Gov
ernm
ent s
uper
annu
atio
nbe
nefit
s(a)
2,48
72,
620
52,
536
2,67
55
2,59
32,
769
72,
672
2,91
99
Def
ence
19,8
8019
,243
-321
,133
20,7
24-2
22,0
5421
,831
-123
,018
22,5
05-2
Publ
ic o
rder
and
saf
ety
3,67
03,
772
33,
741
3,79
92
3,78
03,
808
13,
762
3,82
32
Educ
atio
n17
,752
17,3
86-2
18,4
9118
,280
-119
,209
18,9
42-1
20,2
2819
,814
-2H
ealth
42,9
6443
,357
144
,520
45,0
451
46,2
4046
,788
148
,120
48,5
001
Soci
al s
ecur
ity a
nd w
elfa
re96
,450
95,1
32-1
100,
733
99,2
89-1
104,
751
103,
219
-110
8,93
610
7,17
3-2
Hou
sing
and
com
mun
ity a
men
ities
(b)
3,01
13,
345
112,
962
3,28
411
2,91
93,
293
132,
460
3,00
722
Rec
reat
ion
and
cultu
re(b
)2,
979
2,86
1-4
2,93
22,
799
-52,
884
2,75
8-4
2,93
32,
700
-8Fu
el a
nd e
nerg
y(b)
5,36
05,
310
-15,
495
5,47
40
5,63
65,
631
05,
873
5,89
40
Agr
icul
ture
, fis
herie
s an
d fo
rest
ry(b
)2,
799
3,68
532
2,08
52,
767
332,
612
2,76
76
2,99
02,
589
-13
Min
ing,
man
ufac
turin
gan
d co
nstr
uctio
n2,
029
2,04
61
2,01
82,
037
11,
949
2,01
53
1,84
31,
911
4Tr
ansp
ort a
nd c
omm
unic
atio
n4,
516
4,48
4-1
4,82
35,
344
114,
818
4,95
43
4,58
44,
525
-1O
ther
eco
nom
ic a
ffairs
Tour
ism
and
are
a pr
omot
ion
197
193
-219
719
4-2
196
197
119
820
01
Labo
ur a
nd e
mpl
oym
ent a
ffairs
4,35
04,
748
94,
364
4,68
27
4,46
34,
739
64,
586
4,80
45
Oth
er e
cono
mic
affa
irs n
ec1,
069
1,18
211
1,07
31,
155
81,
059
1,13
47
1,11
01,
142
3
Est
imat
esP
roje
ctio
ns20
10-1
120
09-1
020
07-0
820
08-0
9
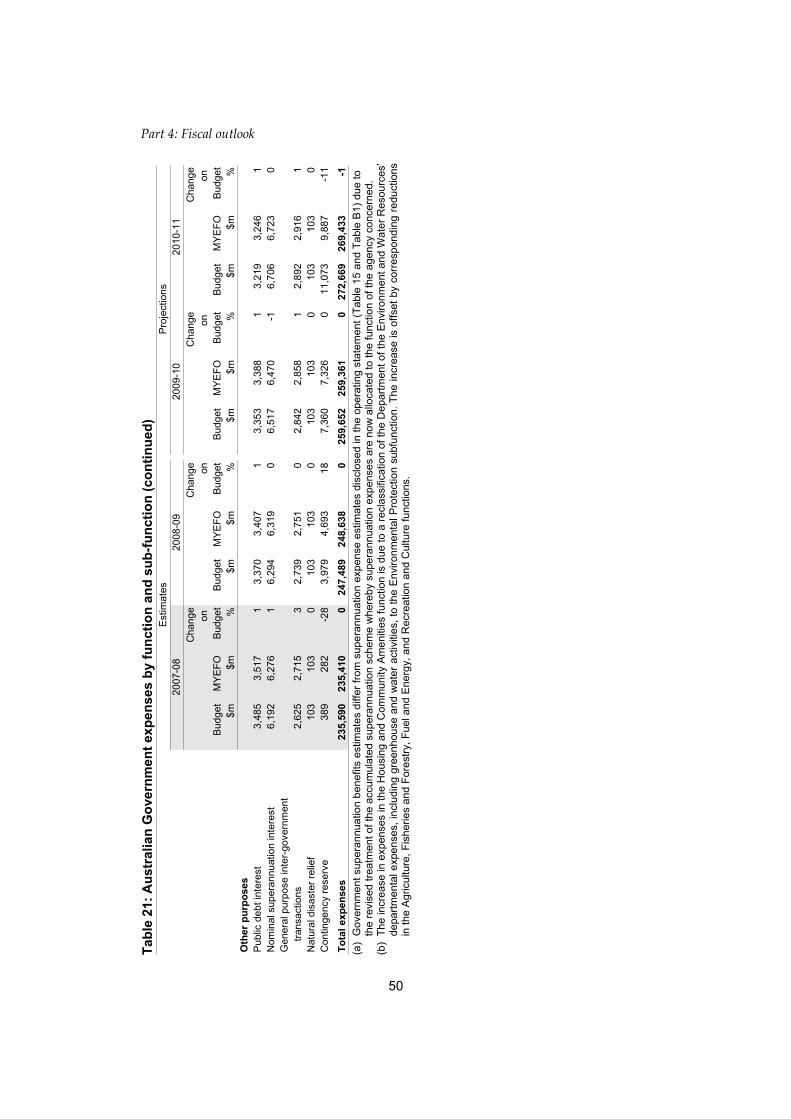
Part 4: Fiscal outlook
50
Tabl
e 21
: Aus
tral
ian
Gov
ernm
ent e
xpen
ses
by fu
nctio
n an
d su
b-fu
nctio
n (c
ontin
ued)
Cha
nge
Cha
nge
Cha
nge
Cha
nge
on
onon
on
B
udge
tM
YE
FOB
udge
tB
udge
tM
YE
FOB
udge
tB
udge
tM
YE
FOB
udge
tB
udge
tM
YE
FOB
udge
t$m
$m%
$m$m
%$m
$m%
$m$m
%O
ther
pur
pose
sP
ublic
deb
t int
eres
t 3,
485
3,51
71
3,37
03,
407
13,
353
3,38
81
3,21
93,
246
1N
omin
al s
uper
annu
atio
n in
tere
st6,
192
6,27
61
6,29
46,
319
06,
517
6,47
0-1
6,70
66,
723
0G
ener
al p
urpo
se in
ter-g
over
nmen
ttra
nsac
tions
2,62
52,
715
32,
739
2,75
10
2,84
22,
858
12,
892
2,91
61
Nat
ural
dis
aste
r rel
ief
103
103
010
310
30
103
103
010
310
30
Con
tinge
ncy
rese
rve
389
282
-28
3,97
94,
693
187,
360
7,32
60
11,0
739,
887
-11
Tota
l exp
ense
s23
5,59
023
5,41
00
247,
489
248,
638
025
9,65
225
9,36
10
272,
669
269,
433
-1
Est
imat
esP
roje
ctio
ns20
07-0
820
08-0
920
09-1
020
10-1
1
(a
) G
over
nmen
t sup
eran
nuat
ion
bene
fits
estim
ates
diff
er fr
om s
uper
annu
atio
n ex
pens
e es
timat
es d
iscl
osed
in th
e op
erat
ing
stat
emen
t (Ta
ble
15 a
nd T
able
B1)
due
to
the
revi
sed
treat
men
t of t
he a
ccum
ulat
ed s
uper
annu
atio
n sc
hem
e w
here
by s
uper
annu
atio
n ex
pens
es a
re n
ow a
lloca
ted
to th
e fu
nctio
n of
the
agen
cy c
once
rned
. (b
) Th
e in
crea
se in
exp
ense
s in
the
Hou
sing
and
Com
mun
ity A
men
ities
func
tion
is d
ue to
a re
clas
sific
atio
n of
the
Dep
artm
ent o
f the
Env
ironm
ent a
nd W
ater
Res
ourc
es’
depa
rtmen
tal e
xpen
ses,
incl
udin
g gr
eenh
ouse
and
wat
er a
ctiv
ities
, to
the
Env
ironm
enta
l Pro
tect
ion
subf
unct
ion.
The
incr
ease
is o
ffset
by
corr
espo
ndin
g re
duct
ions
in
the
Agr
icul
ture
, Fis
herie
s an
d Fo
rest
ry, F
uel a
nd E
nerg
y, a
nd R
ecre
atio
n an
d C
ultu
re fu
nctio
ns.

Part 4: Fiscal outlook
51
Contingency reserve The contingency reserve (other purposes function) is an allowance, included in aggregate expenses figuring, to reflect anticipated events that cannot be assigned to individual programmes in the preparation of the Australian Government budget estimates. The reserve is an estimating device used to ensure that the budget estimates are based on the best information available at the time of the MYEFO. It is not a general policy reserve.
While the reserve ensures that aggregate estimates are as close as possible to expected outcomes, it is not appropriated. Allowances that are included in the reserve can only be drawn upon once they have been appropriated by Parliament. These allowances are removed from the reserve and allocated to specific agencies for appropriation and for outcome reporting closer to the time when they eventuate.
The contingency reserve makes allowance in 2007-08 and the forward years for anticipated events, including the following:
• an allowance for the tendency for estimates of expenses for existing Government policy to be revised upwards in the forward years;
• an allowance for the tendency for the estimates of expenses for some specific agencies or functions to be overstated in the budget year;
• commercial-in-confidence and national security-in-confidence items that cannot be disclosed separately and programmes that are yet to be renegotiated with the States and Territories;
• decisions made too late for inclusion against individual agency estimates;
• the effect on the budget and forward estimates of economic parameter revisions received late in the process and hence not able to be allocated to individual agencies or functions; and
• provision for events and pressures that are reasonably expected to affect the budget estimates.
The contingency reserve may also include any expenses associated with the Government’s major asset sales and associated administration costs.

52
Attachment F
FEDERAL FINANCIAL RELATIONS
In 2007-08, the States and Territories (the States) will receive GST revenue of $42.2 billion and other payments from the Australian Government of $30.9 billion, totalling $73.1 billion, as shown in Table 22. This is a 7.4 per cent increase in total payments, compared with the $68.1 billion the States received in 2006-07.1
Table 22: GST and Australian Government payments to the States, 2007-08 $million NSW VIC QLD WA SA TAS ACT NT Total(1) GST revenue to the States 11,928 9,245 8,517 3,963 3,904 1,655 843 2,174 42,230(2) General revenue assistance 26 10 - 4 3 - - - 43(3) Specific purpose payments 9,899 6,981 6,078 3,740 2,398 773 476 496 30,851
Payments to the States(a) 7,274 4,948 4,469 2,878 1,761 555 321 402 22,619Payments through the States 1,894 1,494 1,136 573 476 134 117 54 5,879Grants for local governments 558 415 345 205 122 58 37 25 1,766Payments direct to local govt 173 123 129 84 39 26 .. 14 588
(4) Australian Government payments 9,925 6,991 6,078 3,744 2,401 773 476 496 30,894 to the States and local govt (2) + (3)
(5) GST and total payments (1) + (4) 21,853 16,236 14,596 7,707 6,306 2,428 1,318 2,670 73,124 (a) The total estimate for specific purpose payments to the States includes $10 million that has not yet been
allocated between the States.
GST revenue In accordance with the Intergovernmental Agreement on the Reform of Commonwealth-State Financial Relations, the Australian Government administers the GST on behalf of the States and all GST revenue is paid to the States. This provides the States with a robust, secure and growing source of revenue to spend according to their own budget priorities.
Variations in GST revenue since the 2007-08 Budget
Table 23 is a reconciliation of the GST revenue estimates between the 2007-08 Budget and the Mid-Year Economic and Fiscal Outlook 2007-08 (MYEFO). The reconciliation accounts for policy decisions and parameter and other variations.
1 Payments made to the state government sector include payments made to the local government sector unless otherwise specified.

Part 4: Fiscal outlook
53
Table 23: Reconciliation of GST revenue estimates
$million 2007-08 2008-09 2009-10 2010-11
2007-08 Budget 43,090 45,500 47,810 50,300Changes between 2007-08 Budget and MYEFO
Effect of policy decisions -2 -3 -3 -3Effect of parameter and other variations 442 1,153 1,183 1,323
Total variations 440 1,150 1,180 1,320
2007-08 MYEFO 43,530 46,650 48,990 51,620
Estimates Projections
GST revenue in 2007-08 is expected to be $43.5 billion — $440 million higher than forecast at the 2007-08 Budget, reflecting continued strength in consumption. Household consumption is expected to grow strongly in 2007-08, driven by strong growth in real after-tax incomes and supported by continued growth in household net wealth.
Policy decisions will have a small negative impact on GST revenue in 2007-08 and the forward years. The estimated revenue effect of each GST policy decision since the 2007-08 Budget is shown in Table 24.
Table 24: GST revenue policy decisions since 2007-08 Budget $million 2007-08 2008-09 2009-10 2010-11Provision of GST free status to non-alcohol based wipes - .. .. ..Determination of business vehicle use fraction for decreasing
adjustment of GST for compulsory third party scheme -1.5 -1.6 -1.6 -1.7Verification measures to support new arrangements
concerning liquids, aerosols and gels and the sealed bag scheme - GST component - -1.0 -1.0 -1.0
Total GST revenue policy decisions -1.5 -2.6 -2.6 -2.7 GST revenue to the States
Under the Intergovernmental Agreement, all GST revenue collected by the Australian Taxation Office is provided to the States. The Commissioner of Taxation estimates the level of GST receipts in June, prior to the end of each financial year, which forms the basis of GST revenue paid to the States for that financial year. A balancing adjustment is usually made in the following financial year to ensure that the States receive the full amount of GST receipts for a financial year. The calculation of GST revenue provided to the States is shown in Table 25.

Part 4: Fiscal outlook
54
Table 25: GST revenue to the States Outcome
$million 2006-07 2007-08 2008-09 2009-10 2010-11
GST revenue 41,006 43,530 46,650 48,990 51,620less change in GST receivables 1,446 1,280 1,380 1,320 1,490GST receipts 39,560 42,250 45,270 47,670 50,130plus variation from the estimate of receipts in
the Commissioner's determination(a) 20plus prior year balancing adjustment -28 -20GST revenue to the States 39,552 42,230 45,270 47,670 50,130
Estimates Projections
(a) The Commissioner’s estimate of receipts for 2006-07 was $20 million higher than the final outcome. In 2007-08, the States will receive GST revenue totalling an estimated $42.2 billion — $380 million higher than estimated at the 2007-08 Budget. The upward revision reflects an increase of $400 million in the estimate of GST receipts for 2007-08, offset by the recovery of a $20 million overpayment in respect of 2006-07.
GST revenue to the States has grown strongly since its introduction, as shown in Table 26. The average annual increase since 2001-022 has been 8.0 per cent.
Table 26: GST revenue to the States, 2000-01 to 2007-08 $million NSW VIC QLD WA SA TAS ACT NT Total2000-01 7,258 5,099 4,658 2,375 2,279 988 473 1,226 24,3552001-02 8,132 5,593 5,019 2,518 2,477 1,060 544 1,290 26,6322002-03 9,080 6,365 5,888 2,910 2,859 1,247 616 1,515 30,4792003-04 9,667 6,961 6,553 3,158 3,146 1,394 658 1,681 33,2192004-05 9,884 7,346 7,329 3,624 3,293 1,435 680 1,730 35,3232005-06 10,362 7,833 7,689 3,804 3,442 1,496 723 1,834 37,1822006-07 10,938 8,588 8,092 3,968 3,605 1,568 778 2,015 39,5522007-08(a) 11,928 9,245 8,517 3,963 3,904 1,655 843 2,174 42,230 (a) Estimates.
Distribution of GST revenue among the States As agreed by all States in the Intergovernmental Agreement, GST revenue is distributed among the States in accordance with the principle of horizontal fiscal equalisation and having regard to the recommendations of the Commonwealth Grants Commission.
The state shares of GST revenue for 2007-08 (totalling $42.2 billion) are shown in Chart 5.
2 As only 11 monthly activity statements, 3 quarterly activity statements, and no annual activity statements were payable in 2000-01, the calculated annual increase uses 2001-02 as the base year.
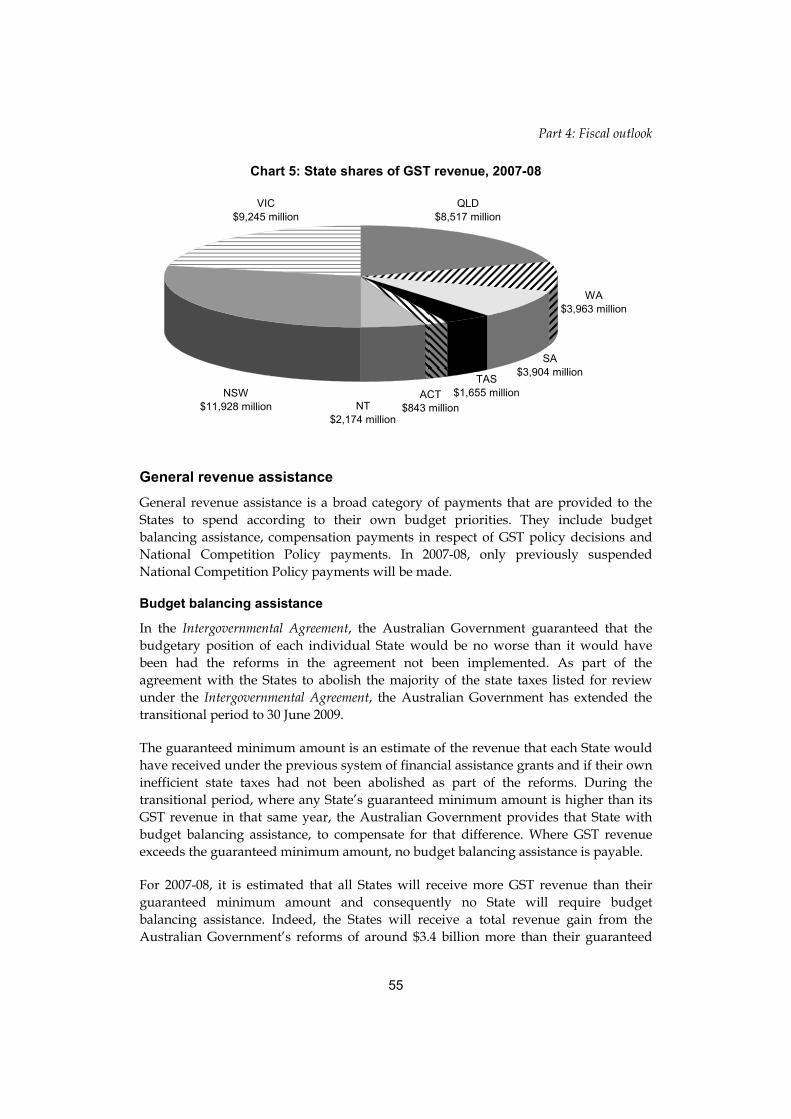
Part 4: Fiscal outlook
55
Chart 5: State shares of GST revenue, 2007-08
NSW $11,928 million
VIC $9,245 million
WA $3,963 million
QLD $8,517 million
SA $3,904 million
NT $2,174 million
TAS $1,655 millionACT
$843 million
General revenue assistance General revenue assistance is a broad category of payments that are provided to the States to spend according to their own budget priorities. They include budget balancing assistance, compensation payments in respect of GST policy decisions and National Competition Policy payments. In 2007-08, only previously suspended National Competition Policy payments will be made.
Budget balancing assistance
In the Intergovernmental Agreement, the Australian Government guaranteed that the budgetary position of each individual State would be no worse than it would have been had the reforms in the agreement not been implemented. As part of the agreement with the States to abolish the majority of the state taxes listed for review under the Intergovernmental Agreement, the Australian Government has extended the transitional period to 30 June 2009.
The guaranteed minimum amount is an estimate of the revenue that each State would have received under the previous system of financial assistance grants and if their own inefficient state taxes had not been abolished as part of the reforms. During the transitional period, where any State’s guaranteed minimum amount is higher than its GST revenue in that same year, the Australian Government provides that State with budget balancing assistance, to compensate for that difference. Where GST revenue exceeds the guaranteed minimum amount, no budget balancing assistance is payable.
For 2007-08, it is estimated that all States will receive more GST revenue than their guaranteed minimum amount and consequently no State will require budget balancing assistance. Indeed, the States will receive a total revenue gain from the Australian Government’s reforms of around $3.4 billion more than their guaranteed

Part 4: Fiscal outlook
56
minimum amount. These revenue gains are estimated to increase to around $4.6 billion by 2010-11, as shown in Table 27.
Table 27: Revenue gains to the States as a result of reform(a) $million NSW VIC QLD WA SA TAS ACT NT Total2007-08(1) GMA 11,282 8,449 7,628 3,508 3,610 1,531 752 2,036 38,796(2) GST revenue 11,928 9,245 8,517 3,963 3,904 1,655 843 2,174 42,230(3) BBA (1) - (2) 0 0 0 0 0 0 0 0 0(4) States' revenue gain (2) - (1) 646 796 890 455 294 124 91 139 3,434
2008-09(1) GMA 11,942 8,906 7,752 3,371 3,790 1,589 780 2,168 40,297(2) GST revenue 13,125 10,122 8,904 3,971 4,199 1,740 896 2,313 45,270(3) BBA (1) - (2) 0 0 0 0 0 0 0 0 0(4) States' revenue gain (2) - (1) 1,183 1,216 1,153 600 409 151 116 145 4,973
2009-10(1) GMA(b) 13,268 9,591 8,330 3,480 4,074 1,659 824 2,302 43,528(2) GST revenue 14,213 10,708 9,157 3,925 4,446 1,807 949 2,464 47,670(3) States' revenue gain (2) - (1) 945 1,117 827 445 372 148 125 162 4,142
2010-11(1) GMA(c) 14,179 10,079 8,640 3,346 4,272 1,721 864 2,422 45,523(2) GST revenue 15,250 11,354 9,521 3,809 4,693 1,885 1,001 2,618 50,130(3) States' revenue gain (2) - (1) 1,071 1,274 881 462 421 164 138 195 4,607 (a) Estimates from 2007-08 will be affected by variations in GMA components and GST revenue. Estimates
from 2008-09 will also be affected by recommendations by the Commonwealth Grants Commission on the distribution of GST provided to each of the States.
(b) As part of the agreement with the States to abolish the majority of the state taxes listed for review under the Intergovernmental Agreement, all States will have abolished stamp duties on credit arrangements, instalment purchase arrangements, rental arrangements, leases and mortgages by 1 July 2009. The revenue foregone is included in the GMA from 2009-10.
(c) As part of the agreement with the States to abolish the majority of the state taxes listed for review under the Intergovernmental Agreement, all States will have abolished stamp duties on unlisted marketable securities by 1 July 2010. The revenue foregone is included in the GMA from 2010-11.
Compensation payments for GST policy decisions
The Australian Government provides compensation to the States for the deferral of GST revenue resulting from its 2004 decision to allow small businesses and non-profit organisations which voluntarily registered for the GST, to report and pay GST on an annual, rather than monthly or quarterly, basis.
Due to an overpayment of this compensation to the States in previous years, the Australian Government agreed with the States to suspend future compensation payments until final tax return data for 2005-06, 2006-07 and 2007-08 is available, to ascertain the total compensation required.
National Competition Policy payments
Between 1997-98 and 2005-06, the Australian Government provided National Competition Policy payments to the States for implementing National Competition Policy and related reforms. Each State’s payments were conditional on that State achieving satisfactory progress with the implementation of the reforms, including a

Part 4: Fiscal outlook
57
commitment to review legislation that restricts competition, applying competitive neutrality principles to government business activities and introducing specific reforms in the electricity, gas, water and road transport sectors.
The Australian Government suspended $43.2 million in 2005-06 National Competition Policy payments, following recommendations provided by the National Water Commission. This included water reform suspensions for outstanding obligations relating to interstate trading in the southern Murray-Darling Basin, and for lack of progress and outstanding reforms with respect to water planning.
On 13 September 2007, the Australian Government lifted the suspensions following a recommendation by the National Water Commission that there has now been satisfactory progress by the States in implementing their water reform commitments.
Consequently, suspended payments of $43.2 million were paid in 2007-08, as shown in Table 28. These payments are the final payments under the previous National Competition Policy arrangements.
Table 28: National Competition Policy payments $million NSW VIC QLD WA SA TAS ACT NT Total2007-08 26 10 - 4 3 - - - 43
Specific purpose payments Specific purpose payments constitute a significant amount of Australian Government expenditure. In 2007-08, they are estimated to total $30.9 billion, an increase of $2.3 billion (8.1 per cent) over 2006-07. For the 2007-08 Budget year, total specific purpose payments will represent 13.1 per cent of total Australian Government expenditure.
The Australian Government provides specific purpose payments to pursue important national policy objectives in areas that are administered by the States. Typically the States need to fulfil specified conditions in order to receive these payments, which cover most functional areas of state and local government activity, including education, health, social security, housing and transport.
The broad categories of specific purpose payments, as shown in Chart 6 and Table 29, are:
• payments made to the States to help fund state government functions;
• payments made through the States, where state governments distribute the payments to other organisations, such as private schools;
– this includes financial assistance grants to be distributed to local governments; and
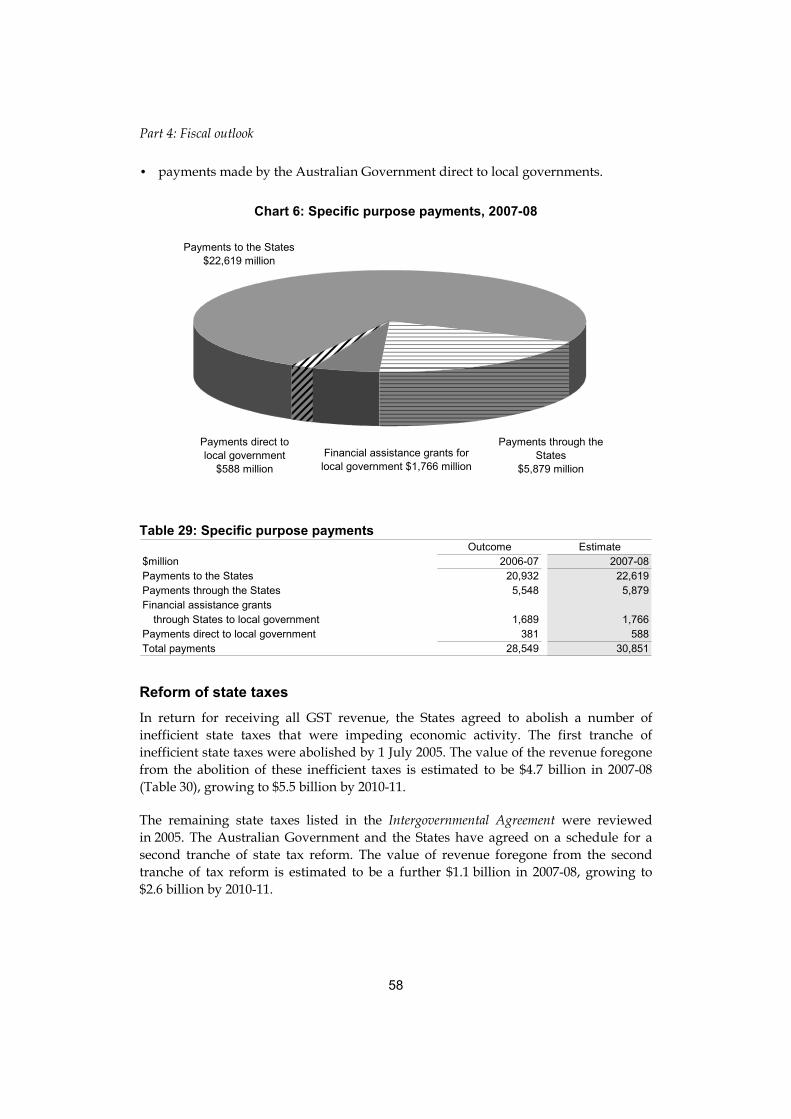
Part 4: Fiscal outlook
58
• payments made by the Australian Government direct to local governments.
Chart 6: Specific purpose payments, 2007-08
Payments to the States$22,619 million
Payments through the States
$5,879 millionFinancial assistance grants forlocal government $1,766 million
Payments direct to local government
$588 million
Table 29: Specific purpose payments Outcome Estimate
$million 2006-07 2007-08Payments to the States 20,932 22,619Payments through the States 5,548 5,879Financial assistance grants
through States to local government 1,689 1,766Payments direct to local government 381 588Total payments 28,549 30,851
Reform of state taxes In return for receiving all GST revenue, the States agreed to abolish a number of inefficient state taxes that were impeding economic activity. The first tranche of inefficient state taxes were abolished by 1 July 2005. The value of the revenue foregone from the abolition of these inefficient taxes is estimated to be $4.7 billion in 2007-08 (Table 30), growing to $5.5 billion by 2010-11.
The remaining state taxes listed in the Intergovernmental Agreement were reviewed in 2005. The Australian Government and the States have agreed on a schedule for a second tranche of state tax reform. The value of revenue foregone from the second tranche of tax reform is estimated to be a further $1.1 billion in 2007-08, growing to $2.6 billion by 2010-11.
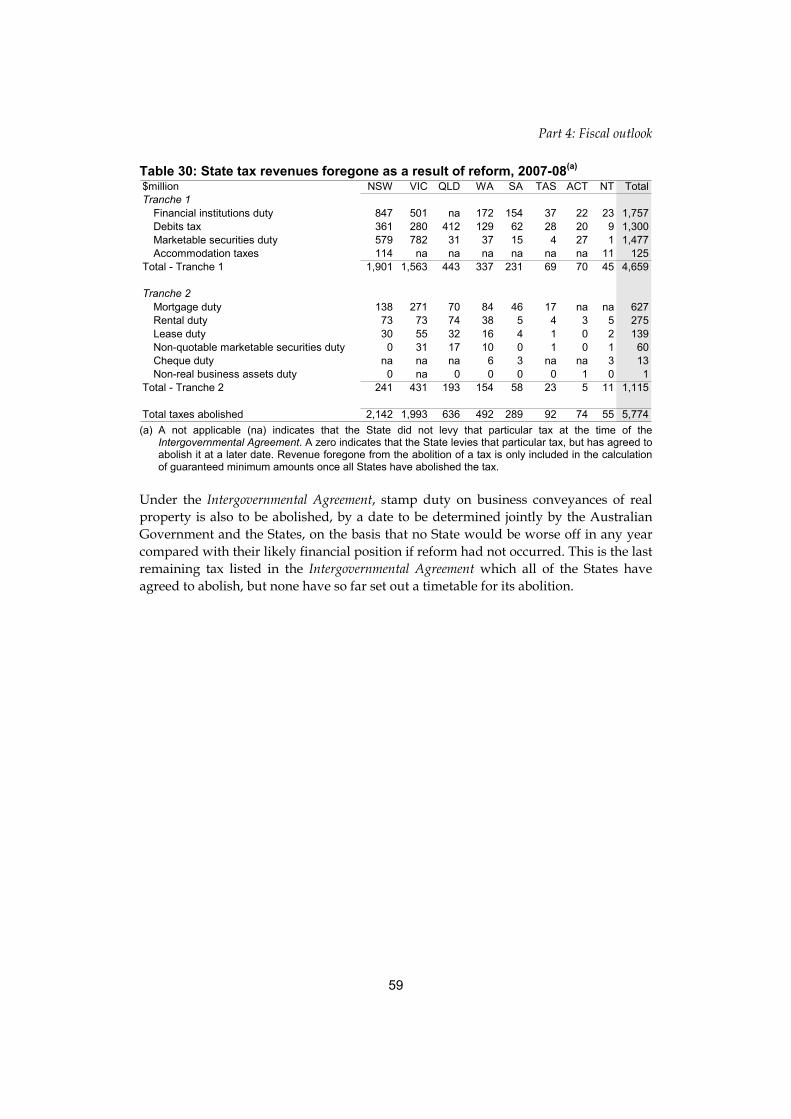
Part 4: Fiscal outlook
59
Table 30: State tax revenues foregone as a result of reform, 2007-08(a) $million NSW VIC QLD WA SA TAS ACT NT TotalTranche 1
Financial institutions duty 847 501 na 172 154 37 22 23 1,757Debits tax 361 280 412 129 62 28 20 9 1,300Marketable securities duty 579 782 31 37 15 4 27 1 1,477Accommodation taxes 114 na na na na na na 11 125
Total - Tranche 1 1,901 1,563 443 337 231 69 70 45 4,659
Tranche 2Mortgage duty 138 271 70 84 46 17 na na 627Rental duty 73 73 74 38 5 4 3 5 275Lease duty 30 55 32 16 4 1 0 2 139Non-quotable marketable securities duty 0 31 17 10 0 1 0 1 60Cheque duty na na na 6 3 na na 3 13Non-real business assets duty 0 na 0 0 0 0 1 0 1
Total - Tranche 2 241 431 193 154 58 23 5 11 1,115
Total taxes abolished 2,142 1,993 636 492 289 92 74 55 5,774 (a) A not applicable (na) indicates that the State did not levy that particular tax at the time of the
Intergovernmental Agreement. A zero indicates that the State levies that particular tax, but has agreed to abolish it at a later date. Revenue foregone from the abolition of a tax is only included in the calculation of guaranteed minimum amounts once all States have abolished the tax.
Under the Intergovernmental Agreement, stamp duty on business conveyances of real property is also to be abolished, by a date to be determined jointly by the Australian Government and the States, on the basis that no State would be worse off in any year compared with their likely financial position if reform had not occurred. This is the last remaining tax listed in the Intergovernmental Agreement which all of the States have agreed to abolish, but none have so far set out a timetable for its abolition.


61
APPENDIX A: POLICY DECISIONS TAKEN SINCE THE 2007-08 BUDGET
SUMMARY OF POLICY DECISIONS TAKEN SINCE THE 2007-08 BUDGET
Table A1: Revenue measures since the 2007-08 Budget(a) Page 2007-08 2008-09 2009-10 2010-11
$m $m $m $m
ATTORNEY-GENERAL'S Administrative Appeals Tribunal 176 Health and Social Services Access Card – review
mechanism(b) - .. .. .. Australian Customs Service
96 Verification measures to support new arrangements concerning liquids, aerosols and gels and the sealed bag scheme -0.1 -0.3 -0.4 -0.4
Portfolio total -0.1 -0.3 -0.4 -0.4
EDUCATION, SCIENCE AND TRAINING Department of Education, Science and Training
79 VET FEE-HELP – extension to Vocational Graduate Certificates and Diploma courses 0.4 1.3 2.8 4.5
Portfolio total 0.4 1.3 2.8 4.5
EMPLOYMENT AND WORKPLACE RELATIONS Department of Employment and Workplace Relations
80 Vocational Rehabilitation Services – recovery of costs 1.8 2.5 3.1 4.0 Indigenous Business Australia 130 Northern Territory Emergency Response – employment
and welfare reform(b) 0.2 0.1 0.1 0.1 154 Welfare reform – Cape York trial(b) 0.1 0.1 0.1 0.1
Portfolio total 2.0 2.7 3.3 4.1
HEALTH AND AGEING Department of Health and Ageing Pharmaceutical Benefits Scheme 170 – extension to the listing of Taxotere® (docetaxel)(b) nfp nfp nfp nfp 172 – listing of Lucentis® (ranibizumab) and Visudyne®
(verteporfin)(b) nfp nfp nfp nfp 173 – minor new listings(b) nfp nfp nfp nfp
Portfolio total - - - -
IMMIGRATION AND CITIZENSHIP Department of Immigration and Citizenship Visas 182 – cessation of the Trade Skills Training Visa(b) .. .. .. .. 183 – new work and holiday arrangements with the United
States(b) 0.2 2.0 4.0 4.1 Portfolio total 0.2 1.9 3.9 4.0

Appendix A: Policy decisions taken since the 2007-08 Budget
62
Table A1: Revenue measures since the 2007-08 Budget(a) (continued) Page 2007-08 2008-09 2009-10 2010-11
$m $m $m $m
INDUSTRY, TOURISM AND RESOURCES Department of Industry, Tourism and Resources
81 Reform of the Tradex Scheme and termination of the Manufacturing in Bond Scheme .. .. .. ..
Portfolio total - - - -
TREASURY Australian Taxation Office
82 Australian Taxation Office – enhanced compliance activity - 300.0 605.0 1,045.0
Capital gains tax 82 – changes to roll-over arrangements for
replacement of statutory licences * * * * 83 – further improvements to the superannuation fund
roll-over on marriage breakdown .. .. .. .. 83 Carbon sink forests – establishment costs deductible - 1.3 -0.6 -1.4 84 Changes to the extension of the premium 175 per
cent research and development tax concession to subsidiaries of multinational enterprises .. .. .. ..
162 Clinical training for enrolled nurses(b) - - - - 84 Consolidation – modification to the tax cost setting
rules * * * * 145 Disability assistance – support for people with
disabilities, their families and carers(b) - - - - 85 Effective life depreciation of buildings and structures - 15.0 40.0 70.0
105 Equine influenza – assistance(b) - - - - 85 Farm Management Deposits – early withdrawal - - - - 86 Fringe benefits tax – depreciation rate for cars - 4.0 8.0 9.0 86 Interest withholding tax – clarification of exemption - - - - 87 New international taxation arrangements – new
foreign income tax offset rules - - -15.0 -15.0 130 Northern Territory Emergency Response –
employment and welfare reform(b) 0.5 3.0 4.6 5.0 Personal income tax
87 – tax exemption for scholarships under the Endeavour Awards -0.8 -1.3 -1.4 -1.4
87 – tax exemption for the Prime Minister's Prize for Australian History and the Prime Minister's Prize for Science .. .. .. ..
88 – tax exemption of crisis, bereavement and related payments under the ABSTUDY scheme - - - -
88 Personal income tax cuts - -7,110.0 -10,940.0 -15,930.0 Philanthropy
89 – changes to prescribed private funds -196.6 -35.5 -34.7 -36.1 90 – updating the list of deductible gift recipients -0.5 -13.0 -11.2 -9.8
194 Screen media support package – further policy amendments(b) - -6.0 - -

Appendix A: Policy decisions taken since the 2007-08 Budget
63
Table A1: Revenue measures since the 2007-08 Budget(a) (continued) Page 2007-08 2008-09 2009-10 2010-11
$m $m $m $m TREASURY (continued)
Superannuation 91 – additional exempt public sector superannuation
scheme .. .. .. .. 91 – amendments to the definition of segregated
current pension assets 4.0 5.0 5.0 6.0 92 – changes to the definition of a superannuation
interest -12.0 -12.0 -12.0 -12.0 92 – changes to the proportioning rule for members of
the Military Superannuation and Benefits Scheme -6.0 -6.0 -6.0 -6.0 93 – payment of tax free benefits to the terminally ill -15.0 -25.0 -25.0 -25.0 93 – payment of temporary residents' superannuation
to the Australian Government - 220.0 415.0 290.0 94 – reducing the incidence of employers having to pay
superannuation contributions twice for the same quarter - -0.1 0.1 0.3
95 Taxation of Financial Arrangements – implementation of tax timing and tax hedging rules * * * *
95 Taxation of option rights – deferral of taxing point - - - - 96 Thin capitalisation – application of accounting
standards - * * * 96 Verification measures to support new arrangements
concerning liquids, aerosols and gels and the sealed bag scheme -0.9 -3.7 -4.6 -4.6
Portfolio total -227.3 -6,664.3 -9,972.8 -14,616.0 Decisions taken but not yet announced - - - - Total impact of revenue measures(c) -224.8 -6,658.7 -9,963.2 -14,603.7 * The nature of the measure is such that a reliable estimate cannot be provided. .. Not zero, but rounded to zero. - Nil. nfp not for publication.
(a) A minus sign before an estimate indicates a reduction in revenue, no sign before an estimate indicates a gain to revenue.
(b) Details of these measures can be found in Appendix A under Expense Measures. (c) Measures may not add due to rounding.
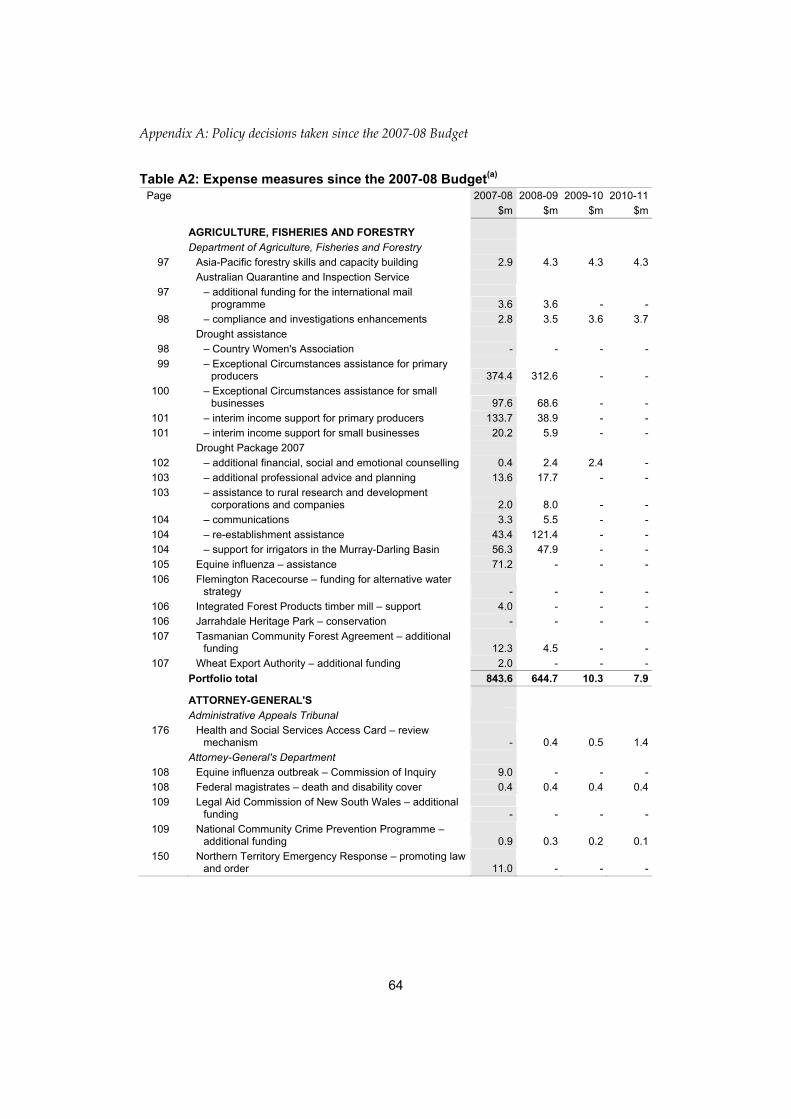
Appendix A: Policy decisions taken since the 2007-08 Budget
64
Table A2: Expense measures since the 2007-08 Budget(a) Page 2007-08 2008-09 2009-10 2010-11
$m $m $m $m
AGRICULTURE, FISHERIES AND FORESTRY Department of Agriculture, Fisheries and Forestry
97 Asia-Pacific forestry skills and capacity building 2.9 4.3 4.3 4.3 Australian Quarantine and Inspection Service
97 – additional funding for the international mail programme 3.6 3.6 - -
98 – compliance and investigations enhancements 2.8 3.5 3.6 3.7 Drought assistance
98 – Country Women's Association - - - - 99 – Exceptional Circumstances assistance for primary
producers 374.4 312.6 - - 100 – Exceptional Circumstances assistance for small
businesses 97.6 68.6 - - 101 – interim income support for primary producers 133.7 38.9 - - 101 – interim income support for small businesses 20.2 5.9 - -
Drought Package 2007 102 – additional financial, social and emotional counselling 0.4 2.4 2.4 - 103 – additional professional advice and planning 13.6 17.7 - - 103 – assistance to rural research and development
corporations and companies 2.0 8.0 - - 104 – communications 3.3 5.5 - - 104 – re-establishment assistance 43.4 121.4 - - 104 – support for irrigators in the Murray-Darling Basin 56.3 47.9 - - 105 Equine influenza – assistance 71.2 - - - 106 Flemington Racecourse – funding for alternative water
strategy - - - - 106 Integrated Forest Products timber mill – support 4.0 - - - 106 Jarrahdale Heritage Park – conservation - - - - 107 Tasmanian Community Forest Agreement – additional
funding 12.3 4.5 - - 107 Wheat Export Authority – additional funding 2.0 - - -
Portfolio total 843.6 644.7 10.3 7.9
ATTORNEY-GENERAL'S Administrative Appeals Tribunal 176 Health and Social Services Access Card – review
mechanism - 0.4 0.5 1.4 Attorney-General's Department 108 Equine influenza outbreak – Commission of Inquiry 9.0 - - - 108 Federal magistrates – death and disability cover 0.4 0.4 0.4 0.4 109 Legal Aid Commission of New South Wales – additional
funding - - - - 109 National Community Crime Prevention Programme –
additional funding 0.9 0.3 0.2 0.1 150 Northern Territory Emergency Response – promoting law
and order 11.0 - - -

Appendix A: Policy decisions taken since the 2007-08 Budget
65
Table A2: Expense measures since the 2007-08 Budget(a) (continued) Page 2007-08 2008-09 2009-10 2010-11
$m $m $m $m ATTORNEY-GENERAL'S (continued)
Australian Crime Commission 150 Northern Territory Emergency Response – promoting law
and order 4.0 - - - Australian Customs Service 196 Standard Business Reporting 1.6 - - -
Australian Federal Police 116 NetAlert – Protecting Australian Families Online –
additional resourcing 4.3 9.4 13.6 13.7 150 Northern Territory Emergency Response – promoting law
and order 7.4 9.2 9.3 - Australian Security Intelligence Organisation 179 Border Control System – upgrade 3.8 4.7 4.8 4.9
Family Court of Australia 108 Federal Magistrates Court of Australia – providing
additional magistrates for family law -1.1 -1.1 -1.1 -1.1 Federal Magistrates Court of Australia 108 Federal Magistrates Court of Australia – providing
additional magistrates for family law 1.1 1.1 1.1 1.1 Office of the Director of Public Prosecutions 116 NetAlert – Protecting Australian Families Online –
additional resourcing 1.4 2.8 2.8 2.8 Portfolio total 43.8 27.1 31.5 23.3
COMMUNICATIONS, INFORMATION TECHNOLOGY AND THE ARTS
Australia Council 113 Darwin Symphony Orchestra – additional funding 0.1 0.1 0.1 0.1
Australian Communications and Media Authority NetAlert 116 – Protecting Australian Families Online – additional
resourcing 2.2 - - - 117 – Protecting Australian Families Online – Outreach
Programme 2.3 3.1 3.1 3.2 Australian Sports Anti-Doping Authority 114 Illicit drugs in sport 0.4 0.7 0.6 0.6
Australian Sports Commission 114 Football Federation Australia – contribution 4.0 4.0 4.0 4.0 118 Rugby League World Cup 2008 and celebration of the
Centenary of Rugby League – contribution 2.0 0.6 - - Department of Communications, Information Technology
and the Arts
110 Adelaide Crows and Port Adelaide Football Club – contribution to training and community facility redevelopment 5.0 - - -
Australia Connected 110 – additional funding for OPEL - 132.0 226.0 - 111 – establishment of an Expert Taskforce - - - - 111 – establishment of BroadbandNow - - - -

Appendix A: Policy decisions taken since the 2007-08 Budget
66
Table A2: Expense measures since the 2007-08 Budget(a) (continued) Page 2007-08 2008-09 2009-10 2010-11
$m $m $m $m COMMUNICATIONS, INFORMATION TECHNOLOGY
AND THE ARTS (continued)
112 Australian National Rugby Academy – contribution 5.0 10.0 10.0 - 112 Camden Aquatic Sports Centre – contribution 5.0 - - - 112 Campbelltown City Soccer Club – contribution 0.5 0.5 - - 113 Community sporting facilities - - - - 113 Community Street Soccer Programme – contribution 1.2 1.1 0.7 - 114 Illicit drugs in sport 0.3 13.8 13.1 12.2 115 Macarthur Disability Service – contribution - - - - 115 National ICT Australia – additional funding 2.4 2.4 - -
NetAlert 115 – Protecting Australian Families Online – additional
funding for consumer information campaign - - - - 116 – Protecting Australian Families Online – additional
resourcing - - - - 117 North Melbourne Football Club development –
contribution 2.0 - - - 118 Rugby League Hall of Fame – contribution 3.0 7.0 - - 118 Skilled Stadium redevelopment – contribution 4.0 10.0 - - 119 South Pine Sports Complex upgrade – contribution 0.2 - - - 120 Townsville International Sports Centre 3.0 - - -
Special Broadcasting Service Corporation 119 Special Broadcasting Service – broadcasting of World
Youth Day 2008 2.5 - - - Portfolio total 45.1 185.4 257.6 20.1
CROSS PORTFOLIO Various Agencies 121 Efficiency dividend – increase in the rate from 1 per cent
to 1.25 per cent - -61.0 -123.0 -187.0 Portfolio total - -61.0 -123.0 -187.0
DEFENCE Department of Defence 122 Amberley State School - - - - 122 Australian Army – additional infantry battalions – Stage 2 34.7 132.9 254.4 368.3 123 HMAS Sydney II – search operation - - - - 150 Northern Territory Emergency Response – promoting law
and order 15.5 - - - 123 Operation CATALYST – enhanced surveillance capability 12.4 - - - 123 Operations CATALYST and SLIPPER – enhanced
protective capability 69.7 - - - 123 Solomon Islands – continued presence by the Australian
Defence Force 6.7 13.0 - - Portfolio total 139.0 145.9 254.4 368.3

Appendix A: Policy decisions taken since the 2007-08 Budget
67
Table A2: Expense measures since the 2007-08 Budget(a) (continued) Page 2007-08 2008-09 2009-10 2010-11
$m $m $m $m
EDUCATION, SCIENCE AND TRAINING Australian Nuclear Science and Technology Organisation Australian Nuclear Science and Technology Organisation 124 – decommissioning costs for the High Flux Australian
Research Reactor - - - - 125 – nuclear collaborative research in universities 1.4 1.7 1.8 1.5
Commonwealth Scientific and Industrial Research Organisation
129 Research vessel Southern Surveyor – additional funding - 3.0 - - Department of Education, Science and Training 124 Apprenticeship incentives for agriculture and horticulture 7.6 12.7 13.5 13.9 143 Centrelink – further call centre supplementation 0.5 - - - 144 Children with autism spectrum disorders – support for
families and carers 3.5 5.7 5.5 5.6 162 Clinical training for enrolled nurses 0.9 4.3 4.9 5.4
Drought assistance 99 – Exceptional Circumstances assistance for primary
producers 8.5 8.6 - - 100 – Exceptional Circumstances assistance for small
businesses 2.4 2.7 - - Drought Package 2007 125 – assistance for isolated children 6.3 9.1 - - 126 – assistance for rural schools 23.5 23.5 - - 126 Higher Education Endowment Fund – additional
contributions and maintenance of real capital value - - - - 127 National School Chaplaincy Programme – additional
funding 11.5 24.3 34.3 5.0 127 National Skills Needs List – establishment 8.0 14.3 17.0 18.2
Northern Territory Emergency Response 130 – employment and welfare reform 8.9 -0.6 -0.6 - 128 – enhancing education 24.4 - - - 129 Veterinary Science Programme at the University of
Adelaide 15.0 - - - 182 Visas – cessation of the Trade Skills Training Visa -2.2 -2.2 -2.3 -2.3 154 Welfare reform – Cape York trial 2.0 4.0 3.2 3.3 129 Work Skills Vouchers – extension 110.0 94.3 94.3 94.3
Portfolio total 232.3 205.1 171.6 145.0
EMPLOYMENT AND WORKPLACE RELATIONS Comcare 133 Workers' compensation – increasing death benefits - - - -
Department of Employment and Workplace Relations 143 Centrelink – further call centre supplementation 1.3 - - -
Northern Territory Emergency Response 148 – coordination 0.7 - - - 130 – employment and welfare reform 35.2 -40.2 -39.6 - 132 School attendance – enrolment data collection 27.8 - - -

Appendix A: Policy decisions taken since the 2007-08 Budget
68
Table A2: Expense measures since the 2007-08 Budget(a) (continued) Page 2007-08 2008-09 2009-10 2010-11
$m $m $m $m EMPLOYMENT AND WORKPLACE RELATIONS
(continued)
197 Veterans' Disability Pension – changes to indexation and increases to the General and Extreme Disablement Adjustment Rates -0.1 -0.3 -0.3 -0.4
80 Vocational Rehabilitation Services – recovery of costs(b) 1.0 0.7 0.7 0.7 154 Welfare reform – Cape York trial 2.3 2.1 - - 132 Work for the Dole – increased access to full-time Work
for the Dole 2.2 2.2 2.2 2.2 133 Workforce participation requirements – exemptions for
carers who are relatives 0.2 0.4 0.4 0.4 Workplace Relations Reform 134 – communication campaign 61.0 - - - 135 – establishment of the Workplace Authority 1.7 1.0 - -
Indigenous Business Australia 130 Northern Territory Emergency Response – employment
and welfare reform 24.2 - - - 154 Welfare reform – Cape York trial 0.3 - - -
Office of the Workplace Ombudsman Workplace Relations Reform 134 – communication campaign -7.2 -3.0 -3.0 - 135 – establishment of the Office of the Workplace
Ombudsman 14.5 14.9 15.0 15.3 Workplace Authority 135 Workplace Relations Reform – establishment of the
Workplace Authority 72.3 67.6 71.9 72.8 Portfolio total 237.4 45.4 47.2 91.0
ENVIRONMENT AND WATER RESOURCES Department of the Environment and Water Resources Climate change 137 – Green Vouchers for schools 101.5 149.1 51.3 34.3 138 – solar hot water systems – rebates for households 31.8 40.3 50.0 65.0 139 Glenelg to Adelaide Parklands Reuse Scheme –
contribution - - - - 139 Murray Irrigation Limited – support 18.0 - - - 140 National greenhouse gas emissions and energy reporting
system – establishment - - - - National Plan for Water Security 193 – Australian Competition and Consumer Commission
regulatory arrangements -7.0 -6.8 -6.1 -6.1 140 – modernising irrigation in Australia - - 200.0 -300.0 141 Point Nepean – University of Melbourne rental guarantee - 0.3 0.3 0.3
Office of the Renewable Energy Regulator 138 Climate change – national clean energy target 0.5 1.3 1.7 2.2
Portfolio total 144.8 184.1 297.2 -204.2

Appendix A: Policy decisions taken since the 2007-08 Budget
69
Table A2: Expense measures since the 2007-08 Budget(a) (continued) Page 2007-08 2008-09 2009-10 2010-11
$m $m $m $m
FAMILIES, COMMUNITY SERVICES AND INDIGENOUS AFFAIRS
Department of Families, Community Services and Indigenous Affairs
142 Aboriginal Employment Strategy – reconciliation and youth activities - - - -
143 Centrelink – further call centre supplementation 3.3 - - - 143 Channel 7 Telethon Trust – contribution 0.5 - - - 144 Children with autism spectrum disorders – support for
families and carers 5.7 29.4 37.0 36.4 145 Daughters of Charity – funding 2.5 - - - 145 Disability assistance – support for people with disabilities,
their families and carers 222.8 281.5 345.1 425.5 146 Disaster relief funding – Hunter, Central Coast and
Gippsland regions 24.7 0.2 - - Drought Package 2007 102 – additional financial, social and emotional counselling 3.2 7.4 - - 147 – additional funding for the Emergency Relief Program 1.5 3.0 - - 105 Equine influenza – assistance 21.3 - - - 147 Foodbank SA – financial assistance 0.1 0.1 - -
Northern Territory Emergency Response 148 – coordination 71.5 - - - 130 – employment and welfare reform 85.8 75.9 75.9 - 149 – housing and land reform 49.2 - - - 150 – promoting law and order 25.6 - - - 151 – supporting families 32.8 - - - 132 School attendance – enrolment data collection nfp nfp nfp nfp 152 Scouting Australia – communications campaign 1.5 - - - 152 Seniors and eligible veterans – extended travel
concessions - - - - 153 Social security agreement between Australia and Greece - - - - 153 Sydney Christmas Parade – contribution - - - - 154 Tuggeranong Office Park – transitional accommodation
costs - - - - 197 Veterans' Disability Pension – changes to indexation and
increases to the General and Extreme Disablement Adjustment Rates -0.4 -1.6 -2.0 -2.5
154 Welfare reform – Cape York trial 3.9 6.5 6.1 5.2 155 Yamatji – native title representative body – additional
funding for resolution of native title claim issues 5.5 - - - Portfolio total 560.9 402.5 462.1 464.6
FINANCE AND ADMINISTRATION Commonwealth Superannuation Administration 156 Cornwell superannuation case – interim response 0.8 - - -
Department of Finance and Administration 156 Cornwell superannuation case – interim response 1.9 - - - 196 Standard Business Reporting 0.3 1.0 0.3 - 156 Sydney Airports Corporation Limited stamp duty dispute
– funding nfp nfp nfp nfp Portfolio total 3.1 1.0 0.3 -
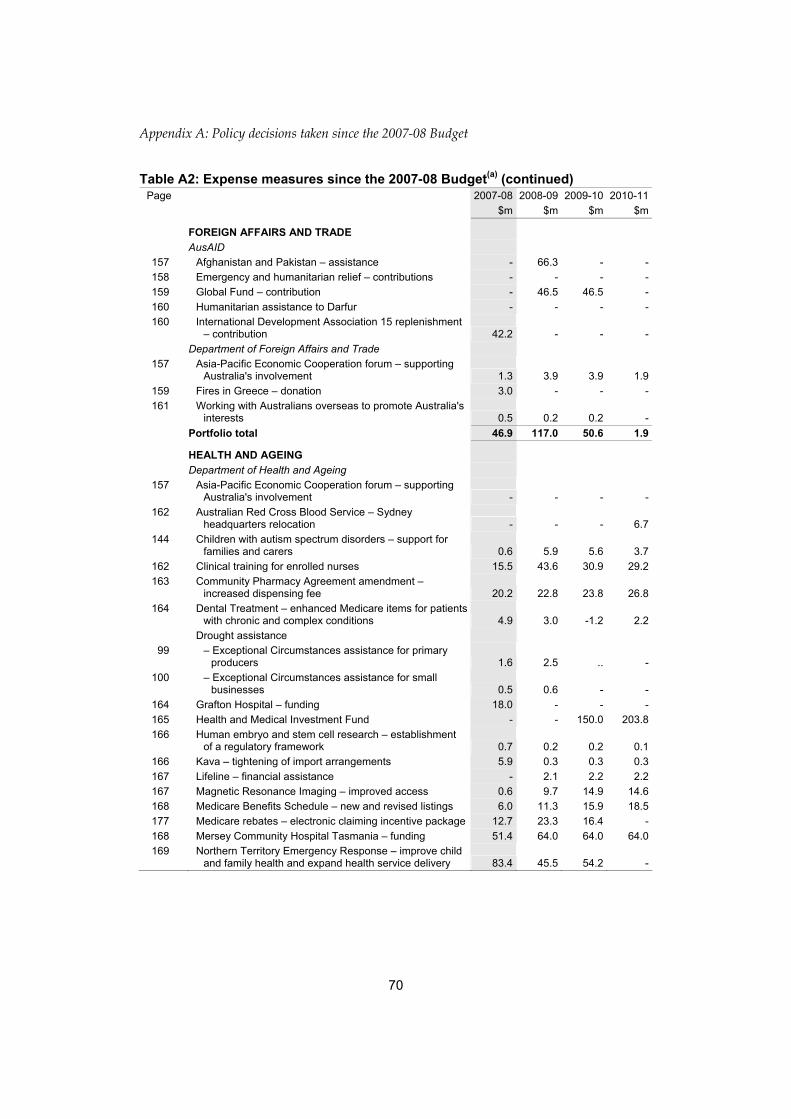
Appendix A: Policy decisions taken since the 2007-08 Budget
70
Table A2: Expense measures since the 2007-08 Budget(a) (continued) Page 2007-08 2008-09 2009-10 2010-11
$m $m $m $m
FOREIGN AFFAIRS AND TRADE AusAID 157 Afghanistan and Pakistan – assistance - 66.3 - - 158 Emergency and humanitarian relief – contributions - - - - 159 Global Fund – contribution - 46.5 46.5 - 160 Humanitarian assistance to Darfur - - - - 160 International Development Association 15 replenishment
– contribution 42.2 - - - Department of Foreign Affairs and Trade 157 Asia-Pacific Economic Cooperation forum – supporting
Australia's involvement 1.3 3.9 3.9 1.9 159 Fires in Greece – donation 3.0 - - - 161 Working with Australians overseas to promote Australia's
interests 0.5 0.2 0.2 - Portfolio total 46.9 117.0 50.6 1.9
HEALTH AND AGEING Department of Health and Ageing 157 Asia-Pacific Economic Cooperation forum – supporting
Australia's involvement - - - - 162 Australian Red Cross Blood Service – Sydney
headquarters relocation - - - 6.7 144 Children with autism spectrum disorders – support for
families and carers 0.6 5.9 5.6 3.7 162 Clinical training for enrolled nurses 15.5 43.6 30.9 29.2 163 Community Pharmacy Agreement amendment –
increased dispensing fee 20.2 22.8 23.8 26.8 164 Dental Treatment – enhanced Medicare items for patients
with chronic and complex conditions 4.9 3.0 -1.2 2.2 Drought assistance
99 – Exceptional Circumstances assistance for primary producers 1.6 2.5 .. -
100 – Exceptional Circumstances assistance for small businesses 0.5 0.6 - -
164 Grafton Hospital – funding 18.0 - - - 165 Health and Medical Investment Fund - - 150.0 203.8 166 Human embryo and stem cell research – establishment
of a regulatory framework 0.7 0.2 0.2 0.1 166 Kava – tightening of import arrangements 5.9 0.3 0.3 0.3 167 Lifeline – financial assistance - 2.1 2.2 2.2 167 Magnetic Resonance Imaging – improved access 0.6 9.7 14.9 14.6 168 Medicare Benefits Schedule – new and revised listings 6.0 11.3 15.9 18.5 177 Medicare rebates – electronic claiming incentive package 12.7 23.3 16.4 - 168 Mersey Community Hospital Tasmania – funding 51.4 64.0 64.0 64.0 169 Northern Territory Emergency Response – improve child
and family health and expand health service delivery 83.4 45.5 54.2 -

Appendix A: Policy decisions taken since the 2007-08 Budget
71
Table A2: Expense measures since the 2007-08 Budget(a) (continued) Page 2007-08 2008-09 2009-10 2010-11
$m $m $m $m HEALTH AND AGEING (continued)
Pharmaceutical Benefits Scheme 170 – extension to the listing of Taxotere® (docetaxel) 11.4 20.4 24.2 28.1 171 – extensions to the listing of Remicade® (infliximab) 15.3 17.7 12.0 8.5 172 – listing of Lucentis® (ranibizumab) and Visudyne®
(verteporfin) 87.9 138.7 167.2 183.8 173 – minor new listings -10.5 -28.6 -46.3 -64.8
Pharmaceutical Benefits Scheme Reform 174 – extension to the phasing of price reductions for F2T
single brand drugs - 17.9 46.2 39.5 174 – support for prescribing software vendors - - - - 175 Positron Emission Tomography – new and upgraded
facilities 2.9 - - - 175 Tasmanian health services infrastructure 6.0 19.3 7.5 2.3 197 Veterans' Disability Pension – changes to indexation and
increases to the General and Extreme Disablement Adjustment Rates .. .. -0.1 -0.1
198 War Widows' Pension – increased payment and changes to indexation -0.2 -0.7 -0.6 -0.5
National Health and Medical Research Council 166 Human embryo and stem cell research – establishment
of a regulatory framework 0.9 0.5 0.4 0.3 Portfolio total 335.8 419.9 587.5 569.4
HUMAN SERVICES Centrelink 102 Drought Package 2007 – additional financial, social and
emotional counselling 1.5 2.0 - - 130 Northern Territory Emergency Response – employment
and welfare reform 10.1 - - - 133 Workforce participation requirements – exemptions for
carers who are relatives - - - - Department of Human Services 176 Health and Social Services Access Card – review
mechanism - 0.9 1.1 4.0 Northern Territory Emergency Response 148 – coordination 0.4 - - - 130 – employment and welfare reform 8.2 - - - 154 Welfare reform – Cape York trial 0.1 .. - -
Medicare Australia 144 Children with autism spectrum disorders – support for
families and carers 0.2 0.2 0.3 0.2 180 Citizenship Test – administration 0.9 0.4 - - 164 Dental Treatment – enhanced Medicare items for patients
with chronic and complex conditions 2.6 2.4 2.1 2.1 167 Magnetic Resonance Imaging – improved access .. .. .. .. 168 Medicare Benefits Schedule – new and revised listings 0.2 0.1 0.2 0.2 177 Medicare rebates – electronic claiming incentive package 7.6 7.9 3.9 1.1 169 Northern Territory Emergency Response – improve child
and family health and expand health service delivery 0.2 - - -

Appendix A: Policy decisions taken since the 2007-08 Budget
72
Table A2: Expense measures since the 2007-08 Budget(a) (continued) Page 2007-08 2008-09 2009-10 2010-11
$m $m $m $m HUMAN SERVICES (continued)
Pharmaceutical Benefits Scheme 170 – extension to the listing of Taxotere® (docetaxel) .. .. .. .. 171 – extensions to the listing of Remicade® (infliximab) 0.2 0.3 0.3 0.3 172 – listing of Lucentis® (ranibizumab) and Visudyne®
(verteporfin) 1.0 1.1 1.2 1.3 Portfolio total 33.1 15.3 9.1 9.2
IMMIGRATION AND CITIZENSHIP Department of Immigration and Citizenship 178 Adult Migrant English Programme – 12 month contract
extension - 3.3 - - 178 Baxter Immigration Detention Centre – closure -10.9 -3.1 -3.1 -3.2 179 Border Control System – upgrade 16.2 9.1 9.0 9.2
Citizenship Test 180 – administration 4.1 11.0 - - 181 – initiatives to support implementation 1.4 5.8 4.9 4.5 181 Migration and Humanitarian Programmes – integration
criterion 1.6 1.4 1.1 1.2 93 Superannuation – payment of temporary residents'
superannuation to the Australian Government(b) 2.0 2.0 2.0 2.0 182 Unaccompanied Humanitarian Minors – additional
funding nfp nfp nfp nfp Visas 182 – cessation of the Trade Skills Training Visa -1.2 -1.1 -1.2 -1.2 183 – new work and holiday arrangements with the United
States 1.2 1.5 1.9 1.9 Portfolio total 14.3 29.9 14.7 14.4
INDUSTRY, TOURISM AND RESOURCES Department of Industry, Tourism and Resources 157 Asia-Pacific Economic Cooperation forum – supporting
Australia's involvement - - - - 184 Australian Energy Market Council – additional funding 1.5 - - -
Climate change 184 – Asia-Pacific Network for Energy Technology –
establishment 1.9 3.1 - - 185 – Asia-Pacific Partnership on Clean Development and
Climate – extension 2.5 16.9 22.9 7.3 185 Ford Australia – assistance - - 10.0 - 186 FutureGen Alliance – membership 15.0 - - - 186 Geelong Investment and Innovation Fund 3.6 6.9 4.0 0.2 187 Innovation Ambassador Programme - - - - 196 Standard Business Reporting 0.6 2.0 2.0 0.5 187 World Youth Day – additional contribution 15.0 - - -
Portfolio total 40.1 28.8 38.9 7.9
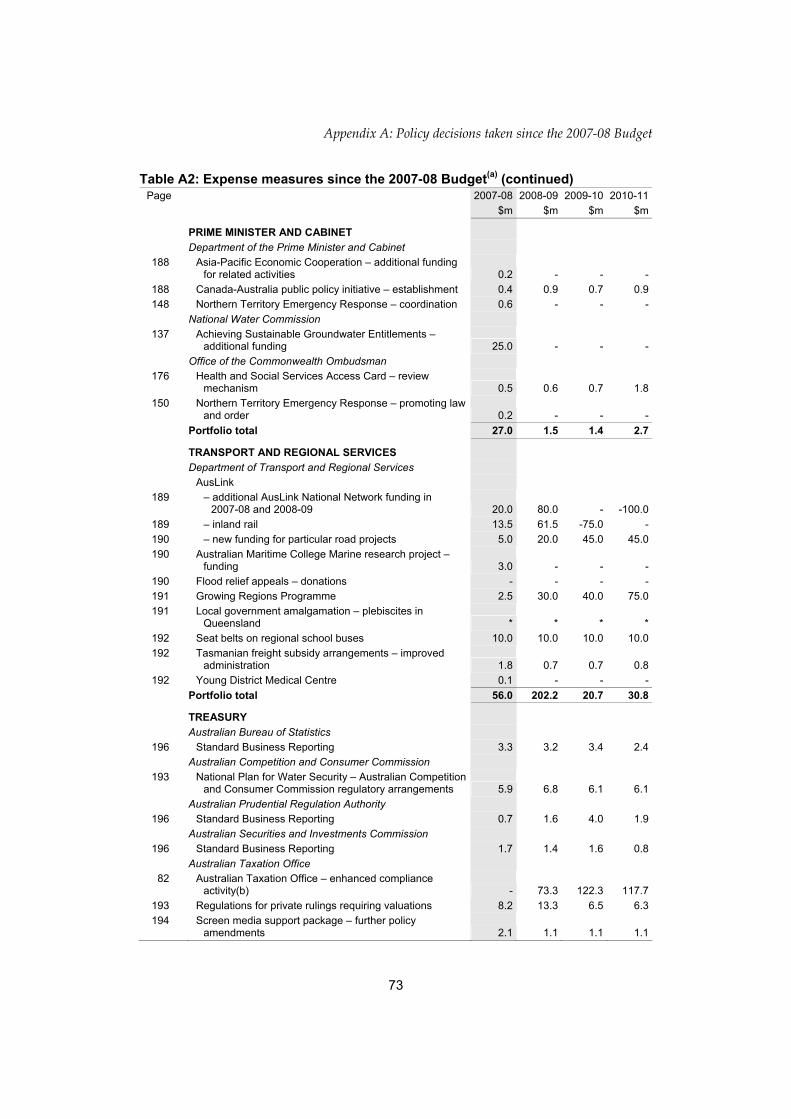
Appendix A: Policy decisions taken since the 2007-08 Budget
73
Table A2: Expense measures since the 2007-08 Budget(a) (continued) Page 2007-08 2008-09 2009-10 2010-11
$m $m $m $m
PRIME MINISTER AND CABINET Department of the Prime Minister and Cabinet 188 Asia-Pacific Economic Cooperation – additional funding
for related activities 0.2 - - - 188 Canada-Australia public policy initiative – establishment 0.4 0.9 0.7 0.9 148 Northern Territory Emergency Response – coordination 0.6 - - -
National Water Commission 137 Achieving Sustainable Groundwater Entitlements –
additional funding 25.0 - - - Office of the Commonwealth Ombudsman 176 Health and Social Services Access Card – review
mechanism 0.5 0.6 0.7 1.8 150 Northern Territory Emergency Response – promoting law
and order 0.2 - - - Portfolio total 27.0 1.5 1.4 2.7
TRANSPORT AND REGIONAL SERVICES Department of Transport and Regional Services AusLink 189 – additional AusLink National Network funding in
2007-08 and 2008-09 20.0 80.0 - -100.0 189 – inland rail 13.5 61.5 -75.0 - 190 – new funding for particular road projects 5.0 20.0 45.0 45.0 190 Australian Maritime College Marine research project –
funding 3.0 - - - 190 Flood relief appeals – donations - - - - 191 Growing Regions Programme 2.5 30.0 40.0 75.0 191 Local government amalgamation – plebiscites in
Queensland * * * * 192 Seat belts on regional school buses 10.0 10.0 10.0 10.0 192 Tasmanian freight subsidy arrangements – improved
administration 1.8 0.7 0.7 0.8 192 Young District Medical Centre 0.1 - - -
Portfolio total 56.0 202.2 20.7 30.8
TREASURY Australian Bureau of Statistics 196 Standard Business Reporting 3.3 3.2 3.4 2.4
Australian Competition and Consumer Commission 193 National Plan for Water Security – Australian Competition
and Consumer Commission regulatory arrangements 5.9 6.8 6.1 6.1 Australian Prudential Regulation Authority 196 Standard Business Reporting 0.7 1.6 4.0 1.9
Australian Securities and Investments Commission 196 Standard Business Reporting 1.7 1.4 1.6 0.8
Australian Taxation Office 82 Australian Taxation Office – enhanced compliance
activity(b) - 73.3 122.3 117.7 193 Regulations for private rulings requiring valuations 8.2 13.3 6.5 6.3 194 Screen media support package – further policy
amendments 2.1 1.1 1.1 1.1

Appendix A: Policy decisions taken since the 2007-08 Budget
74
Table A2: Expense measures since the 2007-08 Budget(a) (continued) Page 2007-08 2008-09 2009-10 2010-11
$m $m $m $m TREASURY (continued)
195 Simplified Superannuation – additional funding for media coverage 17.6 - - -
196 Standard Business Reporting 14.2 15.8 12.8 7.8 93 Superannuation – payment of temporary residents'
superannuation to the Australian Government(b) 10.0 10.0 10.0 10.0 Department of the Treasury 157 Asia-Pacific Economic Cooperation forum – supporting
Australia's involvement 2.3 3.7 - - 196 Standard Business Reporting 9.9 9.9 14.6 4.7
Royal Australian Mint Royal Australian Mint 194 – information management system upgrade – Phase 2 2.7 2.2 1.0 1.0 204 – refurbishment(c) - 0.1 0.2 0.2
Portfolio total 78.6 142.4 183.6 159.9
VETERANS' AFFAIRS Department of Veterans' Affairs 163 Community Pharmacy Agreement amendment –
increased dispensing fee 1.7 1.7 1.7 1.6 197 Compensation – ex-gratia payment - - - - 168 Medicare Benefits Schedule – new and revised listings 0.9 1.5 1.6 1.8
Pharmaceutical Benefits Scheme 170 – extension to the listing of Taxotere® (docetaxel) 0.3 0.5 0.6 0.7 171 – extensions to the listing of Remicade® (infliximab) 0.3 0.3 0.1 0.1 172 – listing of Lucentis® (ranibizumab) and Visudyne®
(verteporfin) 23.3 33.8 36.3 35.6 173 – minor new listings 0.1 -0.4 -0.8 -1.1 174 Pharmaceutical Benefits Scheme Reform – extension to
the phasing of price reductions for F2T single brand drugs - 1.2 3.1 2.6
132 School attendance – enrolment data collection - - - - 197 Veterans' Disability Pension – changes to indexation and
increases to the General and Extreme Disablement Adjustment Rates 16.5 61.3 72.7 85.3
198 Vietnam Veteran Family Study 0.7 2.7 4.5 1.7 198 War Widows' Pension – increased payment and changes
to indexation 8.5 31.8 34.7 37.4 Portfolio total 52.2 134.4 154.6 165.6 Decisions taken but not yet announced 549.6 1,131.8 1,175.9 1,186.2 Depreciation expense 19.4 20.2 27.1 31.3 Total impact of expense measures(d) 3,503.0 4,023.4 3,673.2 2,908.4 * The nature of the measure is such that a reliable estimate cannot be provided. .. Not zero, but rounded to zero. - Nil. nfp not for publication.
(a) A minus sign before an estimate indicates a reduction in expenses, no sign before an estimate indicates increased expenses.
(b) Details of these measures can be found in Appendix A under Revenue Measures. (c) Details of these measures can be found in Appendix A under Capital Measures. (d) Measures may not add due to rounding.
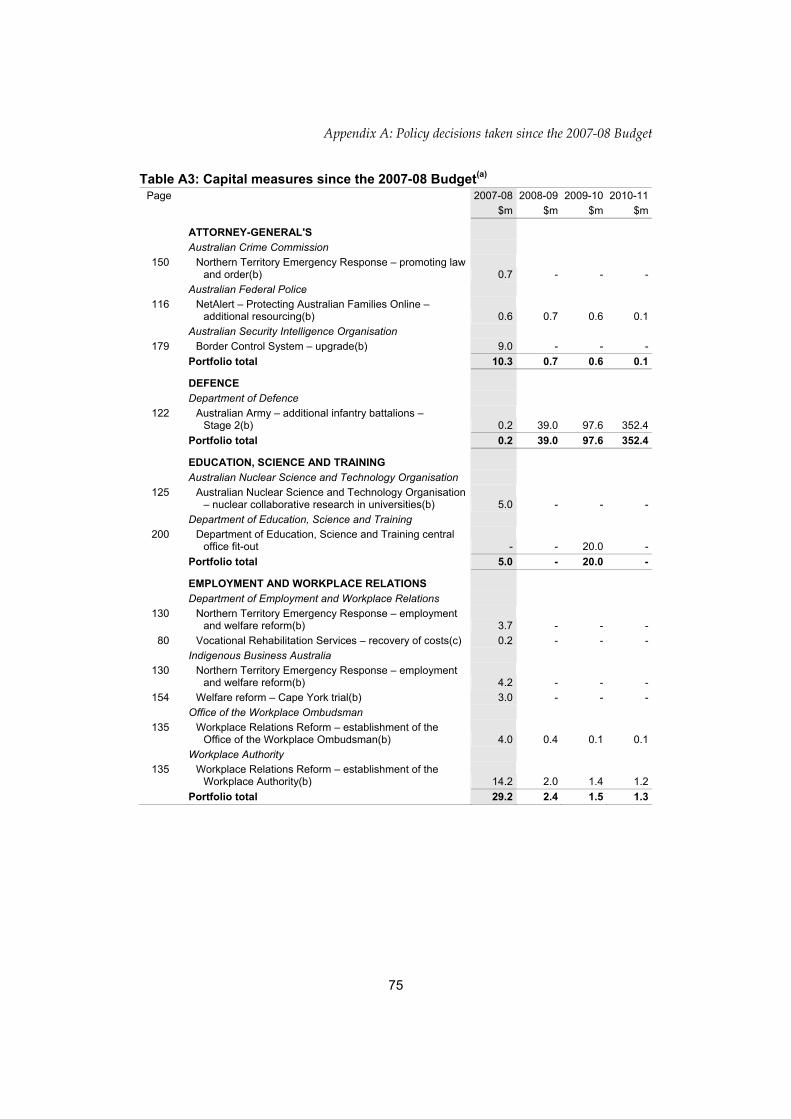
Appendix A: Policy decisions taken since the 2007-08 Budget
75
Table A3: Capital measures since the 2007-08 Budget(a) Page 2007-08 2008-09 2009-10 2010-11
$m $m $m $m
ATTORNEY-GENERAL'S Australian Crime Commission 150 Northern Territory Emergency Response – promoting law
and order(b) 0.7 - - - Australian Federal Police 116 NetAlert – Protecting Australian Families Online –
additional resourcing(b) 0.6 0.7 0.6 0.1 Australian Security Intelligence Organisation 179 Border Control System – upgrade(b) 9.0 - - -
Portfolio total 10.3 0.7 0.6 0.1
DEFENCE Department of Defence 122 Australian Army – additional infantry battalions –
Stage 2(b) 0.2 39.0 97.6 352.4 Portfolio total 0.2 39.0 97.6 352.4
EDUCATION, SCIENCE AND TRAINING Australian Nuclear Science and Technology Organisation 125 Australian Nuclear Science and Technology Organisation
– nuclear collaborative research in universities(b) 5.0 - - - Department of Education, Science and Training 200 Department of Education, Science and Training central
office fit-out - - 20.0 - Portfolio total 5.0 - 20.0 -
EMPLOYMENT AND WORKPLACE RELATIONS Department of Employment and Workplace Relations 130 Northern Territory Emergency Response – employment
and welfare reform(b) 3.7 - - - 80 Vocational Rehabilitation Services – recovery of costs(c) 0.2 - - -
Indigenous Business Australia 130 Northern Territory Emergency Response – employment
and welfare reform(b) 4.2 - - - 154 Welfare reform – Cape York trial(b) 3.0 - - -
Office of the Workplace Ombudsman 135 Workplace Relations Reform – establishment of the
Office of the Workplace Ombudsman(b) 4.0 0.4 0.1 0.1 Workplace Authority 135 Workplace Relations Reform – establishment of the
Workplace Authority(b) 14.2 2.0 1.4 1.2 Portfolio total 29.2 2.4 1.5 1.3

Appendix A: Policy decisions taken since the 2007-08 Budget
76
Table A3: Capital measures since the 2007-08 Budget(a) (continued) Page 2007-08 2008-09 2009-10 2010-11
$m $m $m $m
ENVIRONMENT AND WATER RESOURCES Department of the Environment and Water Resources 140 National greenhouse gas emissions and energy reporting
system – establishment(b) - - - - Office of the Renewable Energy Regulator 138 Climate change – national clean energy target(b) - 3.3 1.1 -
Portfolio total - 3.3 1.1 -
FAMILIES, COMMUNITY SERVICES AND INDIGENOUS AFFAIRS
Department of Families, Community Services and Indigenous Affairs
145 Disability assistance – support for people with disabilities, their families and carers(b) 2.5 - - 0.4
Northern Territory Emergency Response 148 – coordination(b) 4.5 - - - 149 – housing and land reform(b) 29.9 - - -
Portfolio total 36.9 - - 0.4
FINANCE AND ADMINISTRATION Department of Finance and Administration 201 Intra-government Communications Network – capital
funding - - - - 204 Royal Australian Mint – refurbishment 8.2 0.5 - -
Portfolio total 8.2 0.5 - -
HEALTH AND AGEING Department of Health and Ageing 166 Kava – tightening of import arrangements(b) 0.2 - - - 202 National Medical Stockpile – replenishment - - - -
National Health and Medical Research Council 166 Human embryo and stem cell research – establishment
of a regulatory framework(b) 0.1 - - - Portfolio total 0.3 - - -
HUMAN SERVICES Centrelink 180 Citizenship Test – administration(b) 0.1 - - - 145 Disability assistance – support for people with disabilities,
their families and carers(b) 0.1 - - - 130 Northern Territory Emergency Response – employment
and welfare reform(b) 14.3 - - - 132 School attendance – enrolment data collection(b) 14.4 - - -
Medicare Australia 164 Dental Treatment – enhanced Medicare items for patients
with chronic and complex conditions(b) .. - - - 177 Medicare rebates – electronic claiming incentive
package(b) 0.6 - - - Portfolio total 29.6 - - -

Appendix A: Policy decisions taken since the 2007-08 Budget
77
Table A3: Capital measures since the 2007-08 Budget(a) (continued) Page 2007-08 2008-09 2009-10 2010-11
$m $m $m $m
IMMIGRATION AND CITIZENSHIP Department of Immigration and Citizenship 179 Border Control System – upgrade(b) 17.7 - - -
Citizenship Test 180 – administration(b) 10.6 0.2 - - 181 – initiatives to support implementation(b) 0.4 - - - 181 Migration and Humanitarian Programmes – integration
criterion(b) 0.5 0.2 - - 183 Visas – new work and holiday arrangements with the
United States(b) 1.1 - - - Portfolio total 30.2 0.3 - -
INDUSTRY, TOURISM AND RESOURCES Department of Industry, Tourism and Resources 185 Climate change – Asia-Pacific Partnership on Clean
Development and Climate – extension(b) 0.2 - - - 196 Standard Business Reporting(b) 2.1 1.3 1.1 -
Portfolio total 2.3 1.3 1.1 -
PRIME MINISTER AND CABINET Office of the Commonwealth Ombudsman 176 Health and Social Services Access Card – review
mechanism(b) 0.1 - - - 150 Northern Territory Emergency Response – promoting law
and order(b) 0.1 - - - Portfolio total 0.2 - - -
TRANSPORT AND REGIONAL SERVICES Department of Transport and Regional Services 203 Christmas Island Immigration Reception and Processing
Centre – replacement of power cables 5.0 - - - National Capital Authority 203 Acquisition of land for a future embassy site 3.0 - - -
Portfolio total 8.0 - - -
TREASURY Australian Bureau of Statistics 196 Standard Business Reporting(b) 5.9 4.8 3.8 0.9
Australian Competition and Consumer Commission 193 National Plan for Water Security – Australian Competition
and Consumer Commission regulatory arrangements(b) 1.1 - - - Australian Prudential Regulation Authority 196 Standard Business Reporting(b) - 1.9 1.0 -
Australian Securities and Investments Commission 196 Standard Business Reporting(b) 1.5 3.2 1.0 -
Australian Taxation Office 82 Australian Taxation Office – enhanced compliance
activity(c) - 8.6 - - 196 Standard Business Reporting(b) 9.6 19.4 3.5 -

Appendix A: Policy decisions taken since the 2007-08 Budget
78
Table A3: Capital measures since the 2007-08 Budget(a) (continued) Page 2007-08 2008-09 2009-10 2010-11
$m $m $m $m TREASURY (continued)
Department of the Treasury 196 Standard Business Reporting(b) 8.8 9.3 7.2 -
Royal Australian Mint Royal Australian Mint 194 – information management system upgrade –
Phase 2(b) 4.2 1.8 0.2 - 204 – refurbishment 8.5 8.0 - -
Portfolio total 39.6 56.9 16.8 0.9
VETERANS' AFFAIRS Department of Veterans' Affairs 132 School attendance – enrolment data collection(b) - - - - 197 Veterans' Disability Pension – changes to indexation and
increases to the General and Extreme Disablement Adjustment Rates(b) 0.1 - - -
198 Vietnam Veteran Family Study(b) 0.3 - - - Portfolio total 0.4 - - - Decisions taken but not yet announced - - - - Depreciation expense -19.4 -20.2 -27.1 -31.3 Total capital measures(d) 181.0 84.3 111.5 323.7 * The nature of the measure is such that a reliable estimate cannot be provided. .. Not zero, but rounded to zero. - Nil. nfp not for publication.
(a) A minus sign before an estimate indicates a reduction in capital, no sign before an estimate indicates increased capital.
(b) Details of these measures can be found in Appendix A under Expense Measures. (c) Details of these measures can be found in Appendix A under Revenue Measures. (d) Measures may not add due to rounding.
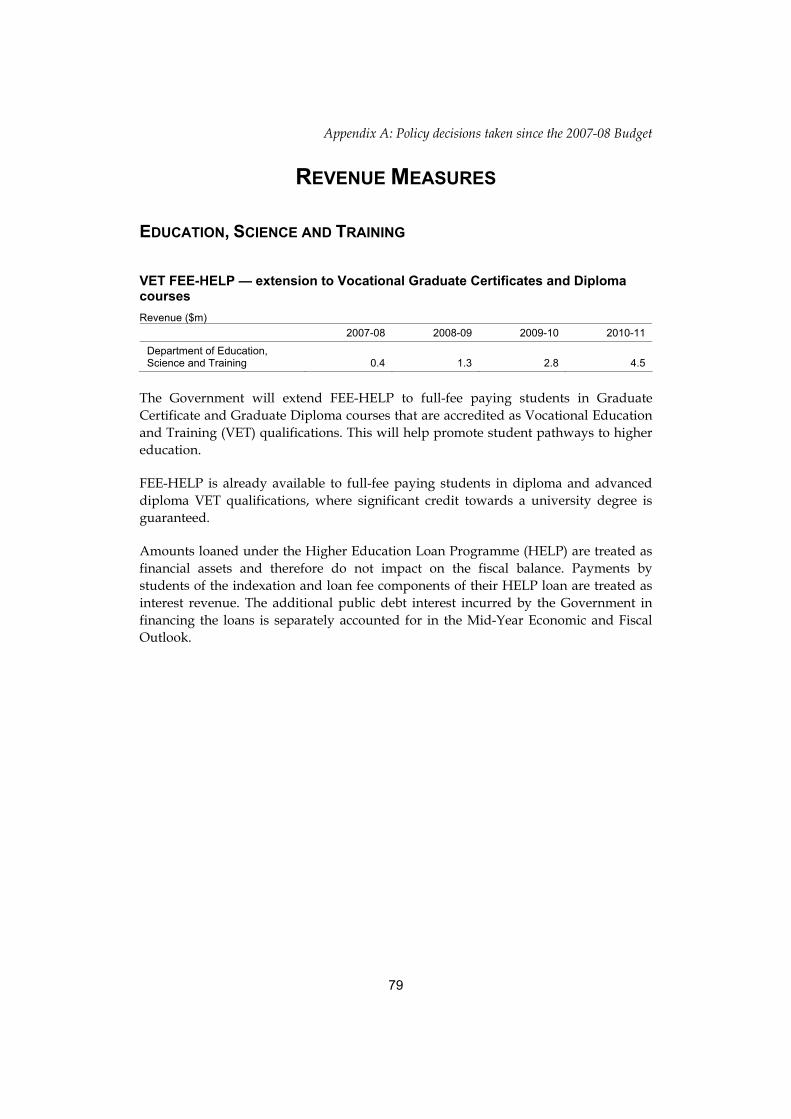
Appendix A: Policy decisions taken since the 2007-08 Budget
79
REVENUE MEASURES
EDUCATION, SCIENCE AND TRAINING
VET FEE-HELP — extension to Vocational Graduate Certificates and Diploma courses Revenue ($m)
2007-08 2008-09 2009-10 2010-11
Department of Education, Science and Training 0.4 1.3 2.8 4.5
The Government will extend FEE-HELP to full-fee paying students in Graduate Certificate and Graduate Diploma courses that are accredited as Vocational Education and Training (VET) qualifications. This will help promote student pathways to higher education.
FEE-HELP is already available to full-fee paying students in diploma and advanced diploma VET qualifications, where significant credit towards a university degree is guaranteed.
Amounts loaned under the Higher Education Loan Programme (HELP) are treated as financial assets and therefore do not impact on the fiscal balance. Payments by students of the indexation and loan fee components of their HELP loan are treated as interest revenue. The additional public debt interest incurred by the Government in financing the loans is separately accounted for in the Mid-Year Economic and Fiscal Outlook.

Appendix A: Policy decisions taken since the 2007-08 Budget
80
EMPLOYMENT AND WORKPLACE RELATIONS
Vocational Rehabilitation Services — recovery of costs Revenue ($m)
2007-08 2008-09 2009-10 2010-11
Department of Employment and Workplace Relations 1.8 2.5 3.1 4.0
Related expense ($m)
Department of Employment and Workplace Relations 1.0 0.7 0.7 0.7
Related capital ($m)
Department of Employment and Workplace Relations 0.2 - - -
The Government will provide $3.4 million over four years to put in place new arrangements to manage repayments from clients who have received government-funded vocational rehabilitation services pending finalisation of their compensation actions. This measure is expected to lead to revenue of $11.3 million over four years.
Recent changes that have broadened the range of vocational rehabilitation providers required revised arrangements to recover the costs of rehabilitation from those who are successful in obtaining a settlement or compensation payment for the disability requiring the rehabilitation.
This measure includes $0.2 million in capital funding in 2007-08 for computer system enhancements.

Appendix A: Policy decisions taken since the 2007-08 Budget
81
INDUSTRY, TOURISM AND RESOURCES
Reform of the Tradex Scheme and termination of the Manufacturing in Bond Scheme Revenue ($m)
2007-08 2008-09 2009-10 2010-11
Department of Industry, Tourism and Resources .. .. .. ..
The Government will make changes to its up-front Customs duty exemption programmes to:
• decouple the Tradex Scheme from the customs duty drawback regulations;
• improve the administration of the Tradex Scheme; and
• terminate the Manufacturing in Bond (MiB) scheme.
The changes to the Tradex Scheme will have effect from the date of proclamation of the enabling legislation (or six months after the date of Royal Assent of the enabling legislation). MiB will be terminated from the date of registration of the amending regulation.

Appendix A: Policy decisions taken since the 2007-08 Budget
82
TREASURY
Australian Taxation Office — enhanced compliance activity Revenue ($m)
2007-08 2008-09 2009-10 2010-11
Australian Taxation Office - 300.0 605.0 1,045.0
Related expense ($m)
Australian Taxation Office - 73.3 122.3 117.7
Related capital ($m)
Australian Taxation Office - 8.6 - -
The Government will provide $446 million over four years from 2008-09 to the Australian Taxation Office (ATO) to allow it to deploy additional staff and enhance compliance activities across all segments of the taxation system. This increased investment in ATO activities is expected to increase revenue by $3.7 billion over four years (including $1.8 billion in 2011-12).
The increased resources will allow the ATO to provide taxpayers with better and more targeted help and education products to assist with more accurate self assessment, allow a greater focus on prevention of non-compliance by early detection and advice on obligations, improve intelligence and early risk detection (including through data mining and strategic risk research) and allow for increased and more targeted enforcement activity.
Capital gains tax — changes to roll-over arrangements for replacement of statutory licences Revenue ($m)
2007-08 2008-09 2009-10 2010-11
Australian Taxation Office * * * *
The Government has provided a partial capital gains tax (CGT) roll-over where one or more statutory licences end and the licensee receives non-licence capital proceeds, such as money, in addition to the replacement licence(s). This measure applies to CGT events that occur in the 2006-07 income year or later income years.
The impact of this measure was reported in the 2007-08 Budget as a decision taken but not yet announced with an impact of $20 million in 2006-07 and $90 million in 2007-08.
The Government has also extended the existing statutory licence CGT roll-over so that it applies where one or more statutory licences end and the licensee is issued one or more new licences that authorise substantially similar activity to the original statutory licence(s). The Government has also made minor changes to the partial statutory licence CGT roll-over so that it applies more effectively.

Appendix A: Policy decisions taken since the 2007-08 Budget
83
These changes increase the flexibility of the existing roll-over and ensure that CGT need not be an impediment to adjustment programmes where part of the entitlement of a statutory licence is removed.
Further information can be found in the press release of 8 June 2007 issued by the Minister for Revenue and Assistant Treasurer.
Capital gains tax — further improvements to the superannuation fund roll-over on marriage breakdown Revenue ($m)
2007-08 2008-09 2009-10 2010-11
Australian Taxation Office .. .. .. ..
The Government has clarified and improved the capital gains tax (CGT) marriage breakdown roll-over for small superannuation funds, with effect from 1 July 2007.
This measure enables one spouse, including a de facto spouse, to transfer their personal superannuation interest to another complying superannuation fund regardless of whether there has been a payment split. This change enhances the CGT roll-over on marriage breakdown for small superannuation funds announced in the 2007-08 Budget. It extends the availability of the roll-over and further facilitates the complete separation of superannuation assets for spouses following a marriage breakdown.
Carbon sink forests — establishment costs deductible Revenue ($m)
2007-08 2008-09 2009-10 2010-11
Australian Taxation Office - 1.3 -0.6 -1.4
The Government will make a number of changes to the arrangements allowing taxpayers to claim a tax deduction for the cost of establishing trees in a carbon sink forest, with effect from 1 July 2007.
These changes include:
• removing the requirement that taxpayers must be a member of the Australian Government’s Greenhouse Challenge programme;
• bringing forward the time when a deduction can be claimed; and
• allowing the costs of regenerating a forest as establishment costs.
This measure builds on the 2007-08 Budget measure Carbon sink forests — establishment costs deductible.

Appendix A: Policy decisions taken since the 2007-08 Budget
84
Further information can be found in the Treasurer’s press release of 13 September 2007.
Changes to the extension of the premium 175 per cent research and development tax concession to subsidiaries of multinational enterprises Revenue ($m)
2007-08 2008-09 2009-10 2010-11
Australian Taxation Office .. .. .. ..
The Government has removed the requirement for companies to have a three-year history of research and development (R&D) expenditure in order to claim the 175 per cent premium R&D tax concession in certain circumstances, with effect from 1 July 2007.
This builds on the measure announced in the 2007-08 Budget which allowed Australian subsidiaries of multinational enterprises to claim deductions under the 175 per cent premium R&D tax concession.
As a transitional arrangement, eligibility for the extended 175 per cent premium R&D tax concession for companies with a presence in Australia will be determined by reference to a deemed three-year history based on expenditure in the 2007-08 year. Under the ongoing arrangements, companies establishing a presence in Australia for the first time will be given immediate access to the concession.
The Government has also decided to allow multinational enterprises to claim this concession where the parent company is based in Australia.
Consolidation — modification to the tax cost setting rules Revenue ($m)
2007-08 2008-09 2009-10 2010-11
Australian Taxation Office * * * *
The Government will not allow an uplift in the costs of assets for tax purposes for an entity that joins a consolidated group following a capital gains tax (CGT) roll-over affecting the membership interests of the joining entity, with effect from 13 October 2007.
When an entity joins a consolidated group, the cost setting rules apply to reset the tax cost of the entity’s assets. This ensures that the costs of the entity’s assets reflect the cost to the group of acquiring the entity. This measure will prevent a significant deferral of tax by ensuring that the cost setting rules do not apply to uplift the costs of a joining entity’s assets following a scrip-for-scrip roll-over, or another CGT roll-over affecting the membership interests of the joining entity.

Appendix A: Policy decisions taken since the 2007-08 Budget
85
Further information can be found in the press release of 12 October 2007 issued by the Minister for Revenue and Assistant Treasurer.
Effective life depreciation of buildings and structures Revenue ($m)
2007-08 2008-09 2009-10 2010-11
Australian Taxation Office - 15.0 40.0 70.0
The Government has decided that it will not proceed with bringing the write-off for capital expenditure on buildings and structures into the Uniform Capital Allowance regime.
The Government previously indicated that it accepted in principle a recommendation of the Review of Business Taxation that new buildings and structures should be included in the Uniform Capital Allowance regime.
The income tax law currently provides a separate write-off regime for buildings and structures where taxpayers can claim an annual 2.5 per cent or 4.0 per cent deduction for the value of construction of their buildings and structural improvements (not land) where the property is used for income producing purposes.
Implementing the recommendation would raise a number of complex issues, including separating land value from that of buildings and structures, and defining the asset unit. Furthermore, implementing the recommendation may create uncertainty in the housing sector.
Farm Management Deposits — early withdrawal Revenue ($m)
2007-08 2008-09 2009-10 2010-11
Australian Taxation Office - - - -
The Government will align the early withdrawal requirements for the Farm Management Deposits scheme with the exceptional circumstances guidelines, with effect from 1 July 2002.
Generally, a farm management deposit must be held for 12 months in order to retain the tax deduction. Early withdrawal of a farm management deposit is allowed for primary producers who conduct their primary production business wholly or partly in exceptional circumstance areas and the deposit was made prior to the exceptional circumstance declaration.

Appendix A: Policy decisions taken since the 2007-08 Budget
86
The measure will remove an inconsistency where an eligible primary producer is denied the tax benefits as a consequence of withdrawing their farm management deposit early when they are in an area that has previously been declared in exceptional circumstances, even though the exceptional circumstances declaration did not apply to them because of their producer class.
Fringe benefits tax — depreciation rate for cars Revenue ($m)
2007-08 2008-09 2009-10 2010-11
Australian Taxation Office - 4.0 8.0 9.0
The Government has changed the formula for calculating the fringe benefits tax (FBT) depreciation rate for cars, with effect from the 2008-09 FBT year.
This measure updates the formula for cars acquired on or after 10 May 2006 to reflect the increase in the diminishing value rate for determining depreciation deductions under the operating cost method of calculating the FBT for cars. The change increases the diminishing value rate used in the calculation from 150 per cent to 200 per cent, to align it with the diminishing value rate under the Uniform Capital Allowance regime announced in the 2006-07 Budget.
Interest withholding tax — clarification of exemption Revenue ($m)
2007-08 2008-09 2009-10 2010-11
Australian Taxation Office - - - -
The Government has more closely specified which debt interests are eligible for exemption from interest withholding tax (IWT), with effect from 7 December 2006.
This measure confirms that the exemption applies to non-debenture debt interests that are non-equity shares, syndicated loans and other financial instruments prescribed by regulation.
This measure corrects an unintentional widening of the scope of the IWT exemption which resulted from IWT amendments in 2005. This restores the Government’s original policy intent.
Further information can be found in the press release of 7 December 2006 issued by the Minister for Revenue and Assistant Treasurer.

Appendix A: Policy decisions taken since the 2007-08 Budget
87
New international taxation arrangements — new foreign income tax offset rules Revenue ($m)
2007-08 2008-09 2009-10 2010-11
Australian Taxation Office - - -15.0 -15.0
The Government has enacted new foreign income tax offset rules to alleviate international double taxation, with effect to income years beginning on or after 1 July 2008.
The new foreign income tax offset rules provide an offset for foreign income tax paid by taxpayers on their assessable income up to the Australian tax payable on that income. These rules build on the 2005-06 Budget measure abolishing foreign loss and foreign tax credit quarantining, and streamlining the remaining foreign tax credit rules. The additional cost of this measure is largely owing to the new foreign tax offset cap (which includes a $1,000 threshold for taxpayers with small offset claims) and the transitional rules (for the treatment of existing quarantined foreign losses and credits) developed in consultation with the business community.
These rules will reduce compliance costs for taxpayers that conduct foreign business or earn foreign income.
Personal income tax — tax exemption for scholarships under the Endeavour Awards Revenue ($m)
2007-08 2008-09 2009-10 2010-11
Australian Taxation Office -0.8 -1.3 -1.4 -1.4
The Government has exempted the Endeavour Research Fellowships and the Endeavour Executive Awards from income tax, with effect from 1 July 2007.
Personal income tax — tax exemption for the Prime Minister’s Prize for Australian History and the Prime Minister’s Prize for Science Revenue ($m)
2007-08 2008-09 2009-10 2010-11
Australian Taxation Office .. .. .. ..
The Government has exempted the Prime Minister’s Prize for Australian History and the Prime Minister’s Prize for Science from income tax to the extent that the prizes would otherwise be assessable income, with effect from 1 July 2006.
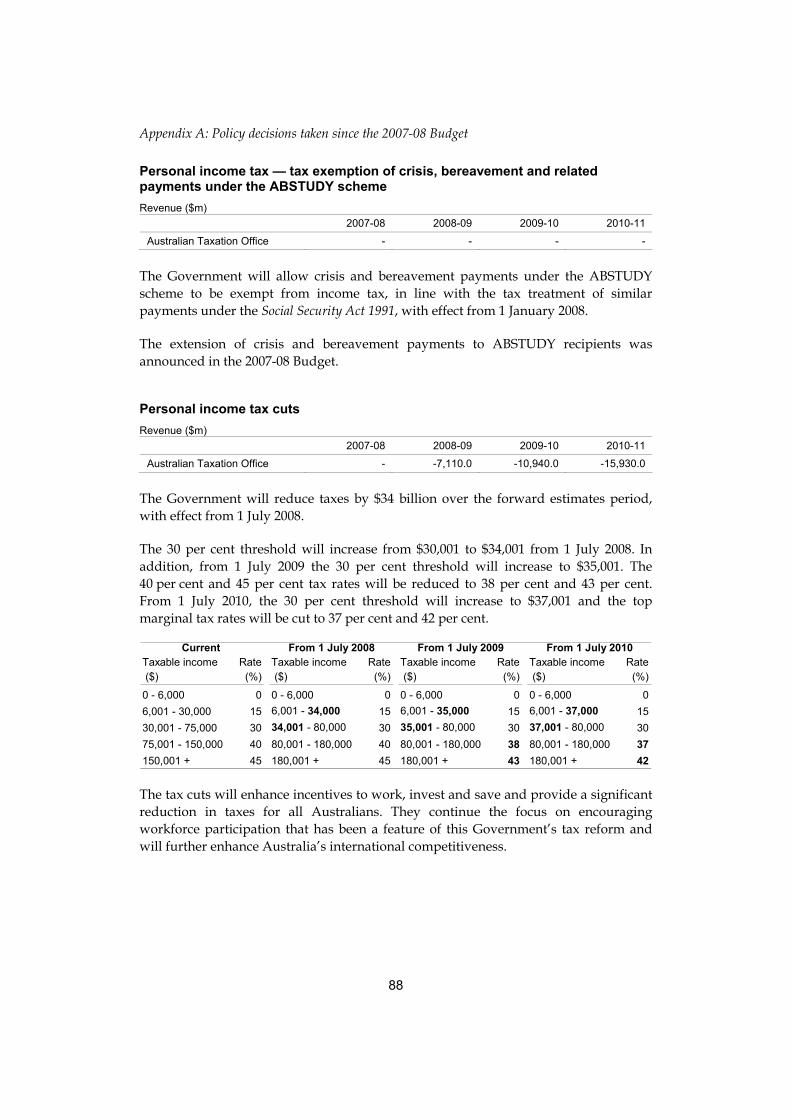
Appendix A: Policy decisions taken since the 2007-08 Budget
88
Personal income tax — tax exemption of crisis, bereavement and related payments under the ABSTUDY scheme Revenue ($m)
2007-08 2008-09 2009-10 2010-11
Australian Taxation Office - - - -
The Government will allow crisis and bereavement payments under the ABSTUDY scheme to be exempt from income tax, in line with the tax treatment of similar payments under the Social Security Act 1991, with effect from 1 January 2008.
The extension of crisis and bereavement payments to ABSTUDY recipients was announced in the 2007-08 Budget.
Personal income tax cuts Revenue ($m)
2007-08 2008-09 2009-10 2010-11
Australian Taxation Office - -7,110.0 -10,940.0 -15,930.0
The Government will reduce taxes by $34 billion over the forward estimates period, with effect from 1 July 2008.
The 30 per cent threshold will increase from $30,001 to $34,001 from 1 July 2008. In addition, from 1 July 2009 the 30 per cent threshold will increase to $35,001. The 40 per cent and 45 per cent tax rates will be reduced to 38 per cent and 43 per cent. From 1 July 2010, the 30 per cent threshold will increase to $37,001 and the top marginal tax rates will be cut to 37 per cent and 42 per cent.
Taxable income Rate Taxable income Rate Taxable income Rate Taxable income Rate ($) (%) ($) (%) ($) (%) ($) (%)
0 - 6,000 0 0 - 6,000 0 0 - 6,000 0 0 - 6,000 06,001 - 30,000 15 6,001 - 34,000 15 6,001 - 35,000 15 6,001 - 37,000 1530,001 - 75,000 30 34,001 - 80,000 30 35,001 - 80,000 30 37,001 - 80,000 3075,001 - 150,000 40 80,001 - 180,000 40 80,001 - 180,000 38 80,001 - 180,000 37150,001 + 45 180,001 + 45 180,001 + 43 180,001 + 42
Current From 1 July 2010From 1 July 2009From 1 July 2008
The tax cuts will enhance incentives to work, invest and save and provide a significant reduction in taxes for all Australians. They continue the focus on encouraging workforce participation that has been a feature of this Government’s tax reform and will further enhance Australia’s international competitiveness.
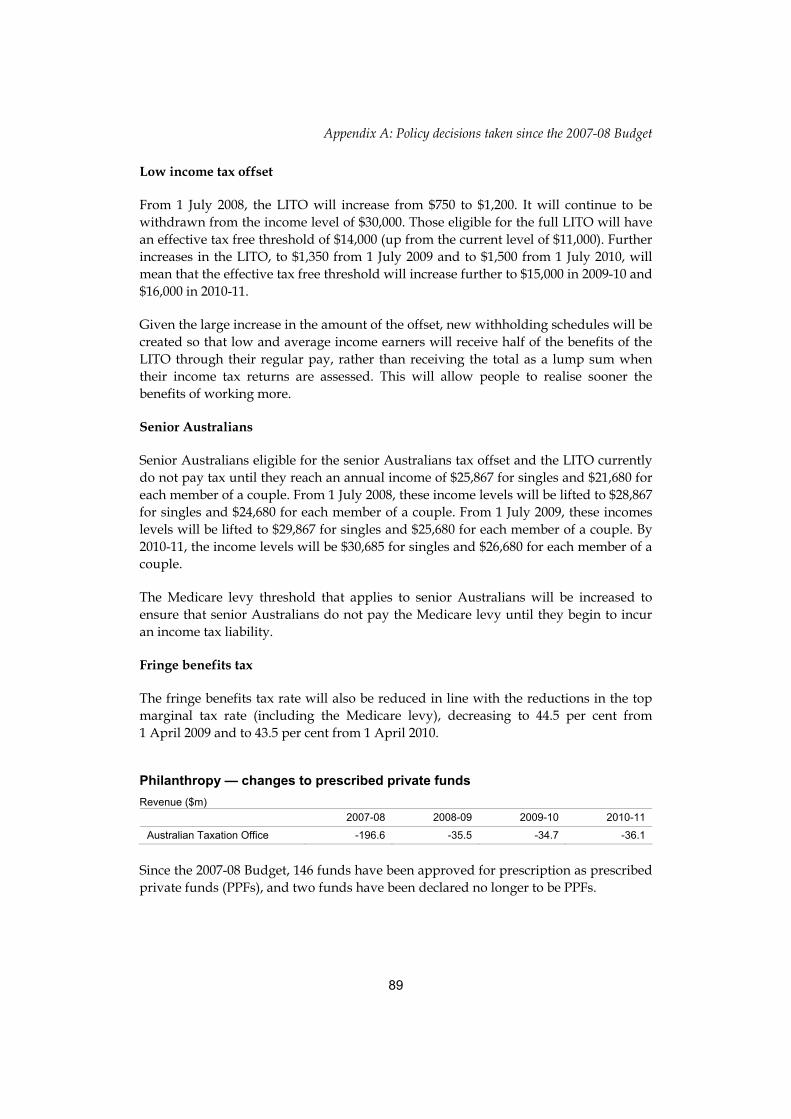
Appendix A: Policy decisions taken since the 2007-08 Budget
89
Low income tax offset
From 1 July 2008, the LITO will increase from $750 to $1,200. It will continue to be withdrawn from the income level of $30,000. Those eligible for the full LITO will have an effective tax free threshold of $14,000 (up from the current level of $11,000). Further increases in the LITO, to $1,350 from 1 July 2009 and to $1,500 from 1 July 2010, will mean that the effective tax free threshold will increase further to $15,000 in 2009-10 and $16,000 in 2010-11.
Given the large increase in the amount of the offset, new withholding schedules will be created so that low and average income earners will receive half of the benefits of the LITO through their regular pay, rather than receiving the total as a lump sum when their income tax returns are assessed. This will allow people to realise sooner the benefits of working more.
Senior Australians
Senior Australians eligible for the senior Australians tax offset and the LITO currently do not pay tax until they reach an annual income of $25,867 for singles and $21,680 for each member of a couple. From 1 July 2008, these income levels will be lifted to $28,867 for singles and $24,680 for each member of a couple. From 1 July 2009, these incomes levels will be lifted to $29,867 for singles and $25,680 for each member of a couple. By 2010-11, the income levels will be $30,685 for singles and $26,680 for each member of a couple.
The Medicare levy threshold that applies to senior Australians will be increased to ensure that senior Australians do not pay the Medicare levy until they begin to incur an income tax liability.
Fringe benefits tax
The fringe benefits tax rate will also be reduced in line with the reductions in the top marginal tax rate (including the Medicare levy), decreasing to 44.5 per cent from 1 April 2009 and to 43.5 per cent from 1 April 2010.
Philanthropy — changes to prescribed private funds Revenue ($m)
2007-08 2008-09 2009-10 2010-11
Australian Taxation Office -196.6 -35.5 -34.7 -36.1
Since the 2007-08 Budget, 146 funds have been approved for prescription as prescribed private funds (PPFs), and two funds have been declared no longer to be PPFs.

Appendix A: Policy decisions taken since the 2007-08 Budget
90
PPFs allow businesses, families and individuals to establish and donate to a philanthropic trust of their own, for the purposes of disbursing funds to a range of deductible gift recipients.
Philanthropy — updating the list of deductible gift recipients Revenue ($m)
2007-08 2008-09 2009-10 2010-11
Australian Taxation Office -0.5 -13.0 -11.2 -9.8
Since the 2007-08 Budget, the Government has announced that qualifying gifts of $2 or more to the following organisations have been made tax deductible:
• Amy Gillett Foundation;
• The Council for Jewish Community Security;
• All state and territory bodies of Kidsafe;
• Social Ventures Australia Limited;
• Spirit of Australia Foundation;
• The Bathurst War Memorial Carillon Public Fund Trust, granting gift deductibility status until 2 August 2009;
• Memorial(s) Development Committee Limited, granting gift deductibility status until 30 June 2010;
• World Youth Day 2008 Trust, granting gift deductibility status until 30 June 2009;
• Wheelchairs For Kids Inc, granting gift deductibility status for a period of two years;
• Australia for UNHCR, extending gift deductibility status until 27 June 2012;
• Shrine of Remembrance Restoration and Development Trust, extending gift deductibility status until 30 June 2009; and
• Xanana Vocational Education Trust, extending gift deductibility status until 20 July 2009.
In addition, since the 2007-08 Budget there have been:
• 18 admissions to, and one removal from, the Register of Environmental Organisations;

Appendix A: Policy decisions taken since the 2007-08 Budget
91
• 24 admissions to, and 7 removals from, the Register of Cultural Organisations;
• 3 admissions to the Register of Harm Prevention Charitable Institutions; and
• 1 admission to the Overseas Aid Gift Deduction Scheme.
The Register of Environmental Organisations can be found on the Department of the Environment and Water Resources website at www.environment.gov.au. The Register for Cultural Organisations can be found on the Department of Communications, Information Technology and the Arts website at www.dcita.gov.au. The Register of Harm Prevention Charitable Institutions can be found on the Department of Families, Community Services and Indigenous Affairs website at www.facsia.gov.au. The list of overseas aid relief funds can be found on the AusAid website at www.ausaid.gov.au.
Superannuation — additional exempt public sector superannuation scheme Revenue ($m)
2007-08 2008-09 2009-10 2010-11
Australian Taxation Office .. .. .. ..
The Government has allowed former members of the Australian Capital Territory (ACT) judiciary, aged 60 and over who are recipients of superannuation income streams paid in accordance with the Supreme Court Act 1933 (ACT), to access the 10 per cent tax offset introduced under Better Super. This measure had effect from 29 September 2007.
Superannuation — amendments to the definition of segregated current pension assets Revenue ($m)
2007-08 2008-09 2009-10 2010-11
Australian Taxation Office 4.0 5.0 5.0 6.0
The Government has clarified that for account-based pensions, only assets included in the income stream account balance are eligible for the tax concessions available to segregated current pension assets, with effect from 1 July 2007.
Income derived from the assets supporting a pension is exempt from tax. In return for this concessional tax treatment, pensions are subject to rules designed to ensure that the capital in the pension is drawn down over time. In the case of account-based pensions the rules require that a payment of at least a minimum proportion of the pension account balance be made each year.
This measure ensures that the payment rules for account-based pensions operate in a manner consistent with the Government’s policy intent.

Appendix A: Policy decisions taken since the 2007-08 Budget
92
Superannuation — changes to the definition of a superannuation interest Revenue ($m)
2007-08 2008-09 2009-10 2010-11
Australian Taxation Office -12.0 -12.0 -12.0 -12.0
The Government has amended the definition of a superannuation interest so that every amount, benefit or entitlement of a member within a single superannuation fund (other than a self-managed superannuation fund) is no longer explicitly aggregated to form a single interest, with effect from 1 July 2007.
Previously, all amounts, benefits or entitlements held by a superannuation provider on behalf of a member comprised one superannuation interest for the purposes of determining the tax free and taxable components.
This measure removes the need for large superannuation providers to identify all member accounts within a fund and aggregate these accounts for taxation purposes. This will provide flexibility in circumstances where it would have been difficult and costly for a superannuation provider to comply with the original requirements.
Superannuation — changes to the proportioning rule for members of the Military Superannuation and Benefits Scheme Revenue ($m)
2007-08 2008-09 2009-10 2010-11
Australian Taxation Office -6.0 -6.0 -6.0 -6.0
The Government has changed the superannuation proportioning rule to allow members of the Military Superannuation and Benefits Scheme (MSBS) to choose the taxable and tax free components of their benefit if they take non-preserved amounts before reaching preservation age. This applies to all benefits taken on or after 1 July 2007.
The proportioning rule requires that superannuation benefit payments made to members comprise a tax free component and a taxable component in the same proportion as in the member’s underlying superannuation interest.
This measure ensures MSBS members can continue to choose the components of pre-1 July 1999 non-preserved benefits they receive prior to preservation age, as they were able to do before 1 July 2007, without being forced by the proportioning rule to pay tax.

Appendix A: Policy decisions taken since the 2007-08 Budget
93
Superannuation — payment of tax free benefits to the terminally ill Revenue ($m)
2007-08 2008-09 2009-10 2010-11
Australian Taxation Office -15.0 -25.0 -25.0 -25.0
The Government will make lump sum superannuation benefits paid to individuals with a terminal illness tax free, with effect from 12 September 2007. The Government will also create a new condition of release for superannuation so that individuals in this situation have full access to their benefits, irrespective of their age.
Currently, individuals under the age of 55 who access a lump sum superannuation benefit from a taxed superannuation fund are subject to a maximum tax rate of 21.5 per cent (inclusive of the Medicare levy). This tax is generally withheld by the superannuation fund when it makes the lump sum payment. The Commissioner of Taxation has varied the withholding rate for people in this situation so that no withholding is required when these payments are made.
Further details of this measure will be determined in consultation with the superannuation industry, the medical profession and support groups.
Further information is contained in the Minister for Revenue and Assistant Treasurer’s press release of 11 September 2007.
Superannuation — payment of temporary residents’ superannuation to the Australian Government Revenue ($m)
2007-08 2008-09 2009-10 2010-11
Australian Taxation Office - 220.0 415.0 290.0
Related expense ($m)
Australian Taxation Office 10.0 10.0 10.0 10.0
Department of Immigration and Citizenship 2.0 2.0 2.0 2.0
Total 12.0 12.0 12.0 12.0
The Government will require all future superannuation contributions and balances for temporary residents to be paid to the Australian Government, with effect from 1 July 2008.
Under this measure, employers will still be required to pay Superannuation Guarantee contributions for temporary residents but will have the choice of continuing to make payments into a superannuation fund or paying contributions directly to the Australian Government. Superannuation providers will be required to transfer annually the balances (including existing balances) of superannuation accounts held by temporary residents to the Australian Taxation Office (ATO). The measure will not apply to superannuation contributions or balances of New Zealand citizens.

Appendix A: Policy decisions taken since the 2007-08 Budget
94
Temporary residents who permanently depart Australia will be able to claim back their superannuation within five years of permanent departure (subject to existing withholding tax arrangements). Temporary residents who become permanent residents will be able to have their superannuation transferred back from the Government into a superannuation fund (with interest).
Currently, the superannuation balances of temporary residents remain in their superannuation fund unless they request payment after permanently departing.
The measure will enable the Government to establish a register of temporary residents’ superannuation, making it easier for those people to locate and claim their superannuation. It will also ameliorate the problem of small balances becoming lost in the superannuation system and potentially being eroded by fees and charges.
The costs for the ATO and the Department of Immigration and Citizenship to administer this measure have not yet been finalised, however, a provision for these costs has been made.
Superannuation — reducing the incidence of employers having to pay superannuation contributions twice for the same quarter Revenue ($m)
2007-08 2008-09 2009-10 2010-11
Australian Taxation Office - -0.1 0.1 0.3
The Government will allow late superannuation guarantee (SG) contributions made for an employee by an employer to be used to offset any part of an SG charge liability that relates to that employee.
Currently, these contributions cannot be used to reduce an SG charge liability for a previous quarter unless the contributions were made on or after 1 January 2006 and within a period of 30 days after the due date. Consequently, where the contribution is made more than 30 days after the due date, the employer may effectively pay twice for an employee in respect of the same period.
This measure will reduce the incidence of disproportionately harsh penalties being incurred by some employers who attempt to do the right thing by their employees and incorrectly pay contributions to a superannuation provider rather than paying the SG charge to the Australian Taxation Office.
The measure will apply in respect of employers who elect to use the offset after the date of Royal Assent. Employers who have been assessed with the SG charge before this date can use the offset, provided the SG charge has not already been paid.
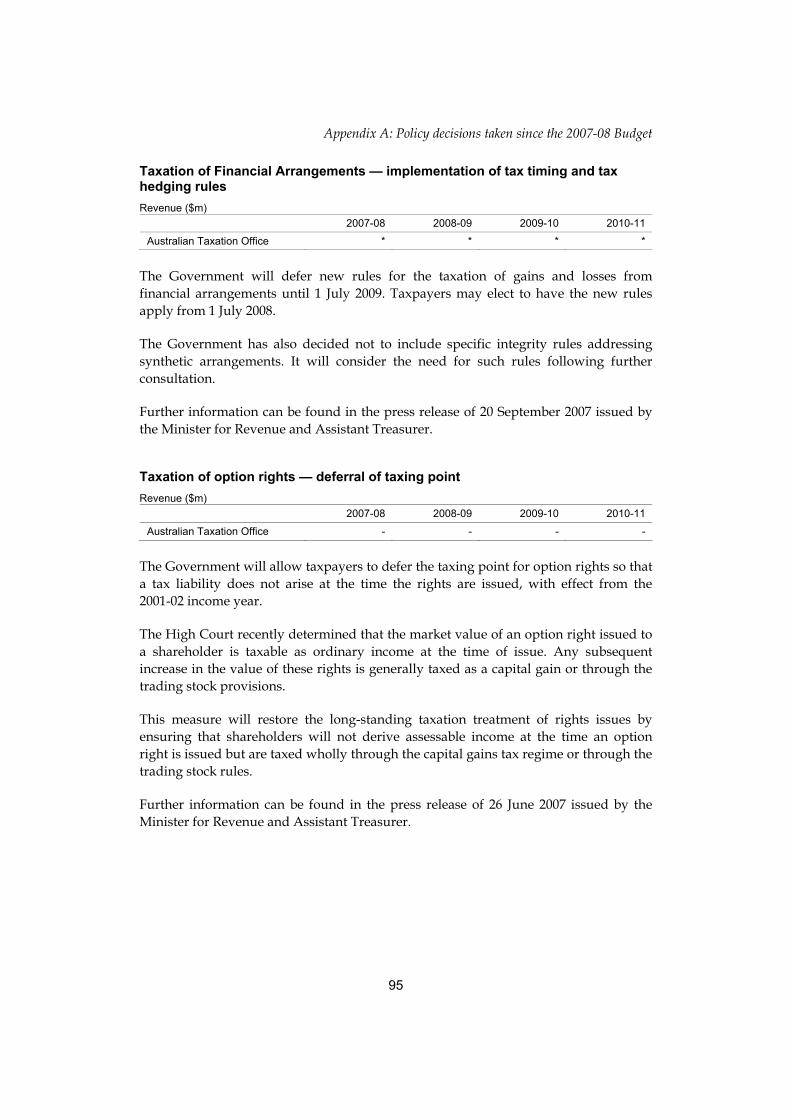
Appendix A: Policy decisions taken since the 2007-08 Budget
95
Taxation of Financial Arrangements — implementation of tax timing and tax hedging rules Revenue ($m)
2007-08 2008-09 2009-10 2010-11
Australian Taxation Office * * * *
The Government will defer new rules for the taxation of gains and losses from financial arrangements until 1 July 2009. Taxpayers may elect to have the new rules apply from 1 July 2008.
The Government has also decided not to include specific integrity rules addressing synthetic arrangements. It will consider the need for such rules following further consultation.
Further information can be found in the press release of 20 September 2007 issued by the Minister for Revenue and Assistant Treasurer.
Taxation of option rights — deferral of taxing point Revenue ($m)
2007-08 2008-09 2009-10 2010-11
Australian Taxation Office - - - -
The Government will allow taxpayers to defer the taxing point for option rights so that a tax liability does not arise at the time the rights are issued, with effect from the 2001-02 income year.
The High Court recently determined that the market value of an option right issued to a shareholder is taxable as ordinary income at the time of issue. Any subsequent increase in the value of these rights is generally taxed as a capital gain or through the trading stock provisions.
This measure will restore the long-standing taxation treatment of rights issues by ensuring that shareholders will not derive assessable income at the time an option right is issued but are taxed wholly through the capital gains tax regime or through the trading stock rules.
Further information can be found in the press release of 26 June 2007 issued by the Minister for Revenue and Assistant Treasurer.

Appendix A: Policy decisions taken since the 2007-08 Budget
96
Thin capitalisation — application of accounting standards Revenue ($m)
2007-08 2008-09 2009-10 2010-11
Australian Taxation Office - * * *
The Government will allow taxpayers to elect to use a valuation methodology other than the current accounting standard for certain intangible assets and to exclude certain other assets and liabilities for thin capitalisation reporting purposes. This measure will have effect from the first income year after the date of Royal Assent of the enabling legislation.
Under the thin capitalisation rules, entities are required to use accounting standards to value assets, liabilities and equity capital. Differences between the Australian equivalents to International Financial Reporting Standards adopted in 2005 and the previous accounting standards have produced substantially different thin capitalisation positions for some entities.
This measure will enable recognition of the economic value of certain assets and provide greater certainty for thin capitalisation reporting entities in relation to future investment activity.
Further information can be found in the press release of 12 September 2007 issued by the Minister for Revenue and Assistant Treasurer.
Verification measures to support new arrangements concerning liquids, aerosols and gels and the sealed bag scheme Revenue ($m)
2007-08 2008-09 2009-10 2010-11
Australian Customs Service -0.1 -0.3 -0.4 -0.4
Australian Taxation Office -0.9 -3.7 -4.6 -4.6
Total -1.0 -4.0 -5.0 -5.0
The Government will introduce new regulatory arrangements to allow for the verification of export of liquids, aerosols and gels (LAGs) sold through the sealed bag scheme, to take account of changes in airport security arrangements.
Since 31 March 2007, travellers have been unable to carry LAGs items greater than 100 millilitres in carry-on luggage. As a result, it is no longer possible to verify that LAGs items have been exported by a physical check of items at the Customs barrier.
This measure will confirm the interim arrangements for export verification by allowing travellers to pack LAGs items in their checked luggage. Travellers will provide proof of export by way of a declaration on the goods dockets that will be handed to collection agents after the Customs barrier.
As this measure also affects goods and services tax revenue, it is subject to the unanimous agreement of the States and Territories.

Appendix A: Policy decisions taken since the 2007-08 Budget
97
EXPENSE MEASURES
AGRICULTURE, FISHERIES AND FORESTRY
Asia-Pacific forestry skills and capacity building Expense ($m)
2007-08 2008-09 2009-10 2010-11
Department of Agriculture, Fisheries and Forestry 2.9 4.3 4.3 4.3
The Government will provide $15.7 million over four years to improve sustainable forest management and the carbon sequestration performance of forests in the Asia-Pacific region.
This measure will fund a combination of training, technology transfer and research activities to improve the skills of forest managers and the capacity of countries in the Asia-Pacific to monitor forestry activity. These activities will be implemented in cooperation with governments, tertiary institutions, forest agencies and research centres within Australia and the region.
Further information can be found in the press release of 2 September 2007 issued by the Prime Minister.
Australian Quarantine and Inspection Service — additional funding for the international mail programme Expense ($m)
2007-08 2008-09 2009-10 2010-11
Department of Agriculture, Fisheries and Forestry 3.6 3.6 - -
The Government will provide $7.2 million over two years to enable the Australian Quarantine and Inspection Service to respond to an increase in the volume of high quarantine risk mail entering Australia.
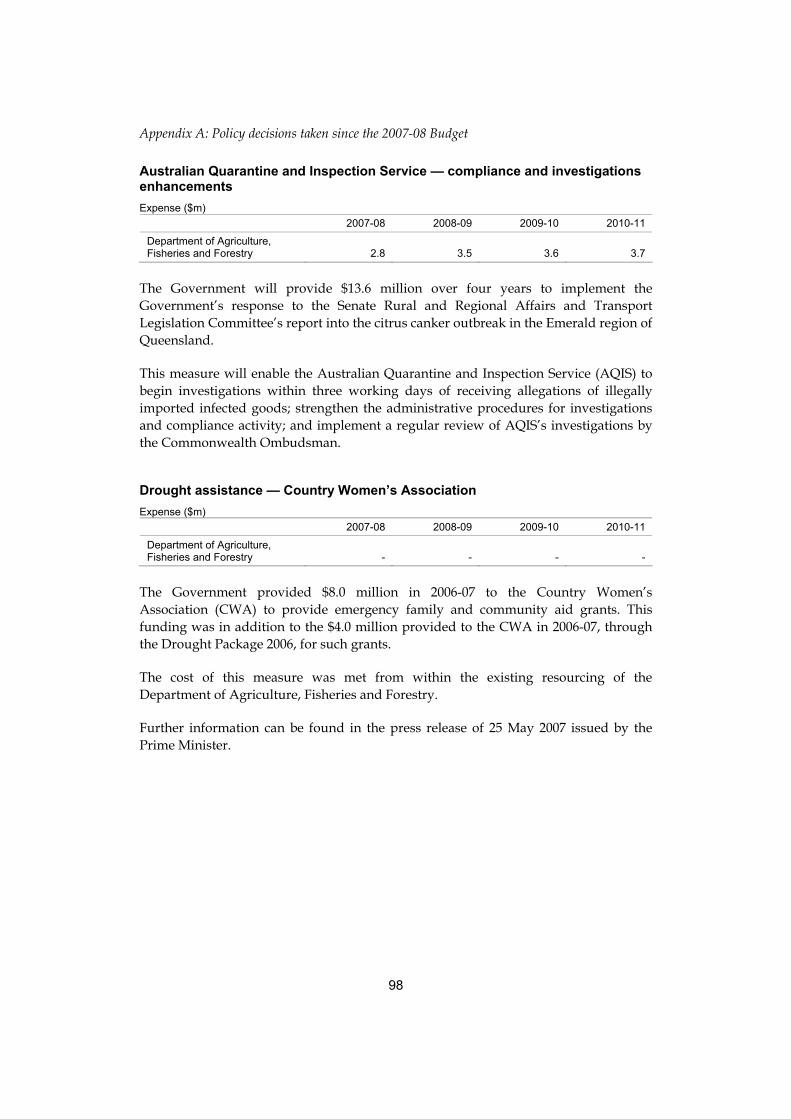
Appendix A: Policy decisions taken since the 2007-08 Budget
98
Australian Quarantine and Inspection Service — compliance and investigations enhancements Expense ($m)
2007-08 2008-09 2009-10 2010-11
Department of Agriculture, Fisheries and Forestry 2.8 3.5 3.6 3.7
The Government will provide $13.6 million over four years to implement the Government’s response to the Senate Rural and Regional Affairs and Transport Legislation Committee’s report into the citrus canker outbreak in the Emerald region of Queensland.
This measure will enable the Australian Quarantine and Inspection Service (AQIS) to begin investigations within three working days of receiving allegations of illegally imported infected goods; strengthen the administrative procedures for investigations and compliance activity; and implement a regular review of AQIS’s investigations by the Commonwealth Ombudsman.
Drought assistance — Country Women’s Association Expense ($m)
2007-08 2008-09 2009-10 2010-11
Department of Agriculture, Fisheries and Forestry - - - -
The Government provided $8.0 million in 2006-07 to the Country Women’s Association (CWA) to provide emergency family and community aid grants. This funding was in addition to the $4.0 million provided to the CWA in 2006-07, through the Drought Package 2006, for such grants.
The cost of this measure was met from within the existing resourcing of the Department of Agriculture, Fisheries and Forestry.
Further information can be found in the press release of 25 May 2007 issued by the Prime Minister.
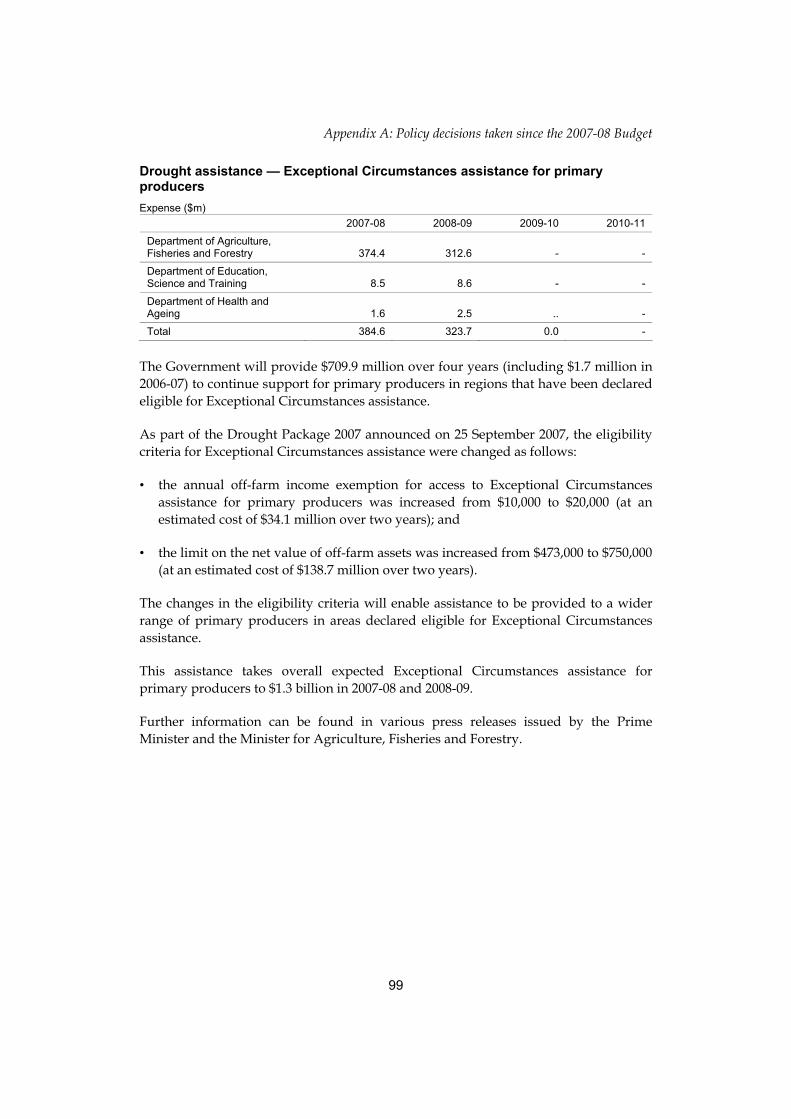
Appendix A: Policy decisions taken since the 2007-08 Budget
99
Drought assistance — Exceptional Circumstances assistance for primary producers Expense ($m)
2007-08 2008-09 2009-10 2010-11
Department of Agriculture, Fisheries and Forestry 374.4 312.6 - -
Department of Education, Science and Training 8.5 8.6 - -
Department of Health and Ageing 1.6 2.5 .. -
Total 384.6 323.7 0.0 -
The Government will provide $709.9 million over four years (including $1.7 million in 2006-07) to continue support for primary producers in regions that have been declared eligible for Exceptional Circumstances assistance.
As part of the Drought Package 2007 announced on 25 September 2007, the eligibility criteria for Exceptional Circumstances assistance were changed as follows:
• the annual off-farm income exemption for access to Exceptional Circumstances assistance for primary producers was increased from $10,000 to $20,000 (at an estimated cost of $34.1 million over two years); and
• the limit on the net value of off-farm assets was increased from $473,000 to $750,000 (at an estimated cost of $138.7 million over two years).
The changes in the eligibility criteria will enable assistance to be provided to a wider range of primary producers in areas declared eligible for Exceptional Circumstances assistance.
This assistance takes overall expected Exceptional Circumstances assistance for primary producers to $1.3 billion in 2007-08 and 2008-09.
Further information can be found in various press releases issued by the Prime Minister and the Minister for Agriculture, Fisheries and Forestry.

Appendix A: Policy decisions taken since the 2007-08 Budget
100
Drought assistance — Exceptional Circumstances assistance for small businesses Expense ($m)
2007-08 2008-09 2009-10 2010-11
Department of Agriculture, Fisheries and Forestry 97.6 68.6 - -
Department of Education, Science and Training 2.4 2.7 - -
Department of Health and Ageing 0.5 0.6 - -
Total 100.5 71.9 - -
The Government will provide $172.6 million over three years (including $0.2 million in 2006-07) to continue support for small businesses with up to 100 employees that are dependent on business from farmers in regions declared eligible for Exceptional Circumstances assistance.
As part of the Drought Package 2007 announced on 25 September 2007, the eligibility criteria for Exceptional Circumstances assistance were changed as follows:
• the limit on the net value of non-business assets was increased from $473,000 to $750,000 (at an estimated cost of $7.6 million over two years for small businesses); and
• assistance was extended to all small businesses in towns with a population of 10,000 or less, located in Exceptional Circumstances declared areas, that can demonstrate a significant downturn in income as a result of their dependence on farmers as clients ($99.5 million over two years). In larger towns and cities the assistance continues to be available to farm-dependent small businesses deriving at least 70 per cent of their income from farmers in Exceptional Circumstances declared regions.
This assistance takes overall expected Exceptional Circumstances assistance for small businesses to $319.9 million in 2007-08 and 2008-09.
Further information can be found in various press releases issued by the Prime Minister and the Minister for Agriculture, Fisheries and Forestry.

Appendix A: Policy decisions taken since the 2007-08 Budget
101
Drought assistance — interim income support for primary producers Expense ($m)
2007-08 2008-09 2009-10 2010-11
Department of Agriculture, Fisheries and Forestry 133.7 38.9 - -
The Government will provide $172.6 million over three years (including $20,000 in 2006-07) to support primary producers in drought-affected regions that have been declared eligible for interim income support.
Once a fully completed application for a region has been received by the Australian Government and has been deemed to show a prima facie case for an Exceptional Circumstances declaration, interim income support is made available to eligible primary producers on conditions equivalent to the Exceptional Circumstances Relief Payment.
As part of the Drought Package 2007 announced on 25 September 2007, the eligibility criteria for Exceptional Circumstances assistance were changed as follows:
• the annual off-farm income exemption for access to interim income support was increased from $10,000 to $20,000; and
• the limit on the net value of off-farm assets was increased from $473,000 to $750,000.
Access to interim income support is available for up to six months while the Exceptional Circumstances application is assessed by the National Rural Advisory Council. Should the Government declare Exceptional Circumstances in that region, interim income support ceases and standard Exceptional Circumstances assistance arrangements commence.
Further information can be found in various press releases issued by the Prime Minister and the Minister for Agriculture, Fisheries and Forestry.
Drought assistance — interim income support for small businesses Expense ($m)
2007-08 2008-09 2009-10 2010-11
Department of Agriculture, Fisheries and Forestry 20.2 5.9 - -
The Government will provide $26.1 million over two years to continue support for small businesses with up to 100 employees that are dependent on business from farmers in regions declared eligible for interim income support.
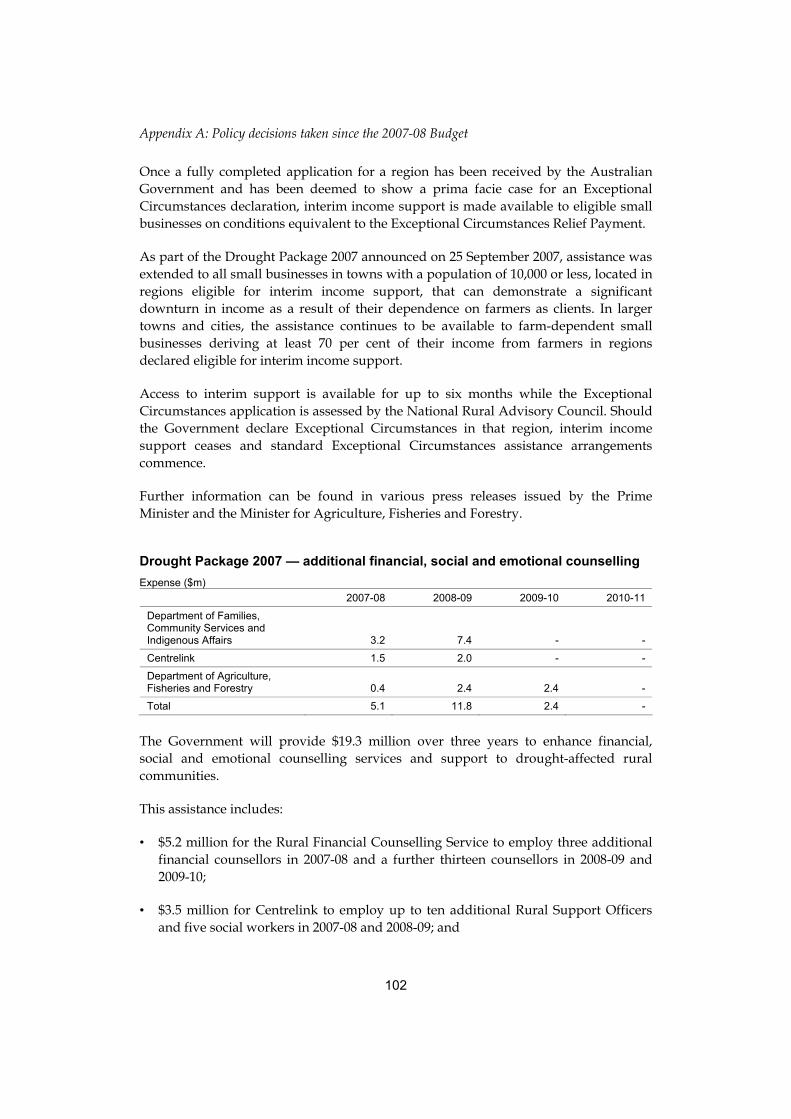
Appendix A: Policy decisions taken since the 2007-08 Budget
102
Once a fully completed application for a region has been received by the Australian Government and has been deemed to show a prima facie case for an Exceptional Circumstances declaration, interim income support is made available to eligible small businesses on conditions equivalent to the Exceptional Circumstances Relief Payment.
As part of the Drought Package 2007 announced on 25 September 2007, assistance was extended to all small businesses in towns with a population of 10,000 or less, located in regions eligible for interim income support, that can demonstrate a significant downturn in income as a result of their dependence on farmers as clients. In larger towns and cities, the assistance continues to be available to farm-dependent small businesses deriving at least 70 per cent of their income from farmers in regions declared eligible for interim income support.
Access to interim support is available for up to six months while the Exceptional Circumstances application is assessed by the National Rural Advisory Council. Should the Government declare Exceptional Circumstances in that region, interim income support ceases and standard Exceptional Circumstances assistance arrangements commence.
Further information can be found in various press releases issued by the Prime Minister and the Minister for Agriculture, Fisheries and Forestry.
Drought Package 2007 — additional financial, social and emotional counselling Expense ($m)
2007-08 2008-09 2009-10 2010-11
Department of Families, Community Services and Indigenous Affairs 3.2 7.4 - -
Centrelink 1.5 2.0 - -
Department of Agriculture, Fisheries and Forestry 0.4 2.4 2.4 -
Total 5.1 11.8 2.4 -
The Government will provide $19.3 million over three years to enhance financial, social and emotional counselling services and support to drought-affected rural communities.
This assistance includes:
• $5.2 million for the Rural Financial Counselling Service to employ three additional financial counsellors in 2007-08 and a further thirteen counsellors in 2008-09 and 2009-10;
• $3.5 million for Centrelink to employ up to ten additional Rural Support Officers and five social workers in 2007-08 and 2008-09; and
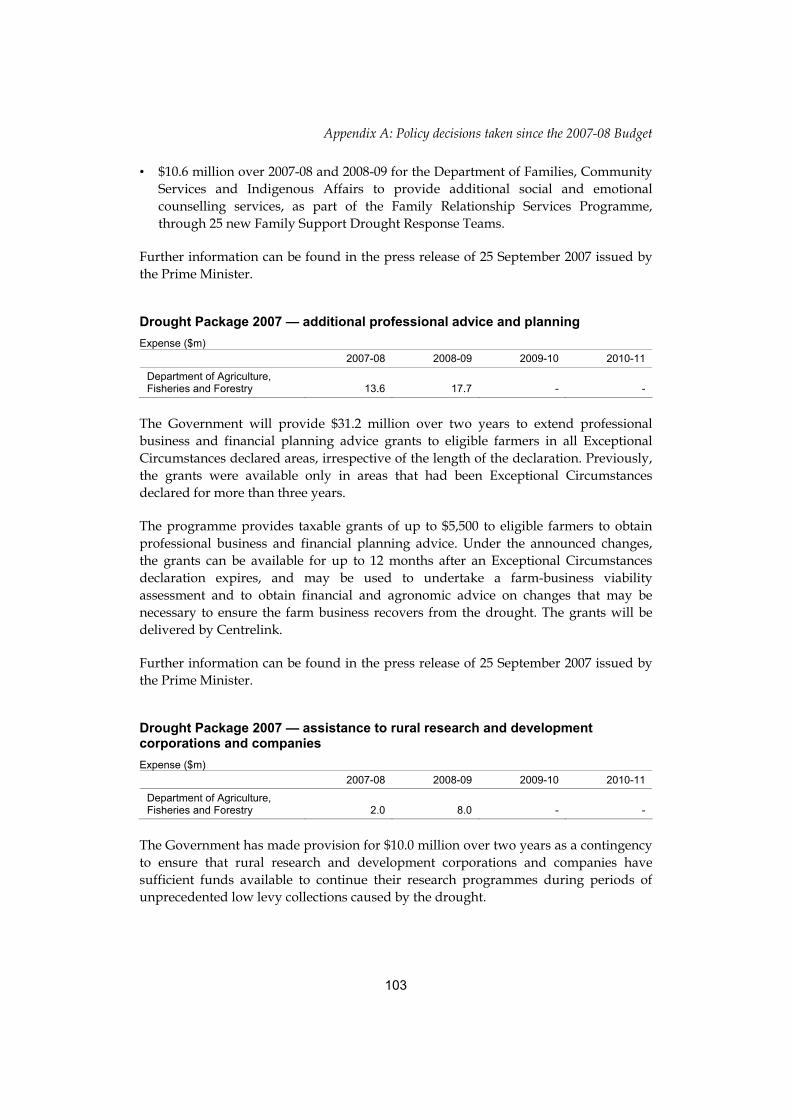
Appendix A: Policy decisions taken since the 2007-08 Budget
103
• $10.6 million over 2007-08 and 2008-09 for the Department of Families, Community Services and Indigenous Affairs to provide additional social and emotional counselling services, as part of the Family Relationship Services Programme, through 25 new Family Support Drought Response Teams.
Further information can be found in the press release of 25 September 2007 issued by the Prime Minister.
Drought Package 2007 — additional professional advice and planning Expense ($m)
2007-08 2008-09 2009-10 2010-11
Department of Agriculture, Fisheries and Forestry 13.6 17.7 - -
The Government will provide $31.2 million over two years to extend professional business and financial planning advice grants to eligible farmers in all Exceptional Circumstances declared areas, irrespective of the length of the declaration. Previously, the grants were available only in areas that had been Exceptional Circumstances declared for more than three years.
The programme provides taxable grants of up to $5,500 to eligible farmers to obtain professional business and financial planning advice. Under the announced changes, the grants can be available for up to 12 months after an Exceptional Circumstances declaration expires, and may be used to undertake a farm-business viability assessment and to obtain financial and agronomic advice on changes that may be necessary to ensure the farm business recovers from the drought. The grants will be delivered by Centrelink.
Further information can be found in the press release of 25 September 2007 issued by the Prime Minister.
Drought Package 2007 — assistance to rural research and development corporations and companies Expense ($m)
2007-08 2008-09 2009-10 2010-11
Department of Agriculture, Fisheries and Forestry 2.0 8.0 - -
The Government has made provision for $10.0 million over two years as a contingency to ensure that rural research and development corporations and companies have sufficient funds available to continue their research programmes during periods of unprecedented low levy collections caused by the drought.
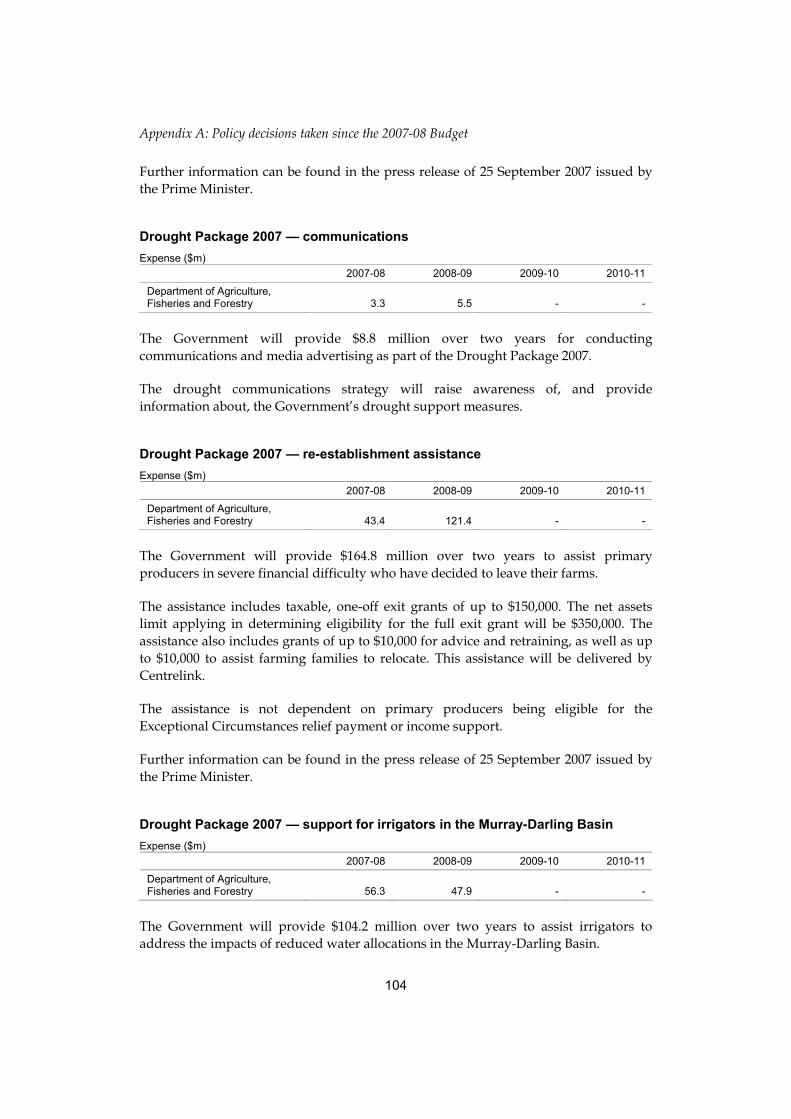
Appendix A: Policy decisions taken since the 2007-08 Budget
104
Further information can be found in the press release of 25 September 2007 issued by the Prime Minister.
Drought Package 2007 — communications Expense ($m)
2007-08 2008-09 2009-10 2010-11
Department of Agriculture, Fisheries and Forestry 3.3 5.5 - -
The Government will provide $8.8 million over two years for conducting communications and media advertising as part of the Drought Package 2007.
The drought communications strategy will raise awareness of, and provide information about, the Government’s drought support measures.
Drought Package 2007 — re-establishment assistance Expense ($m)
2007-08 2008-09 2009-10 2010-11
Department of Agriculture, Fisheries and Forestry 43.4 121.4 - -
The Government will provide $164.8 million over two years to assist primary producers in severe financial difficulty who have decided to leave their farms.
The assistance includes taxable, one-off exit grants of up to $150,000. The net assets limit applying in determining eligibility for the full exit grant will be $350,000. The assistance also includes grants of up to $10,000 for advice and retraining, as well as up to $10,000 to assist farming families to relocate. This assistance will be delivered by Centrelink.
The assistance is not dependent on primary producers being eligible for the Exceptional Circumstances relief payment or income support.
Further information can be found in the press release of 25 September 2007 issued by the Prime Minister.
Drought Package 2007 — support for irrigators in the Murray-Darling Basin Expense ($m)
2007-08 2008-09 2009-10 2010-11
Department of Agriculture, Fisheries and Forestry 56.3 47.9 - -
The Government will provide $104.2 million over two years to assist irrigators to address the impacts of reduced water allocations in the Murray-Darling Basin.
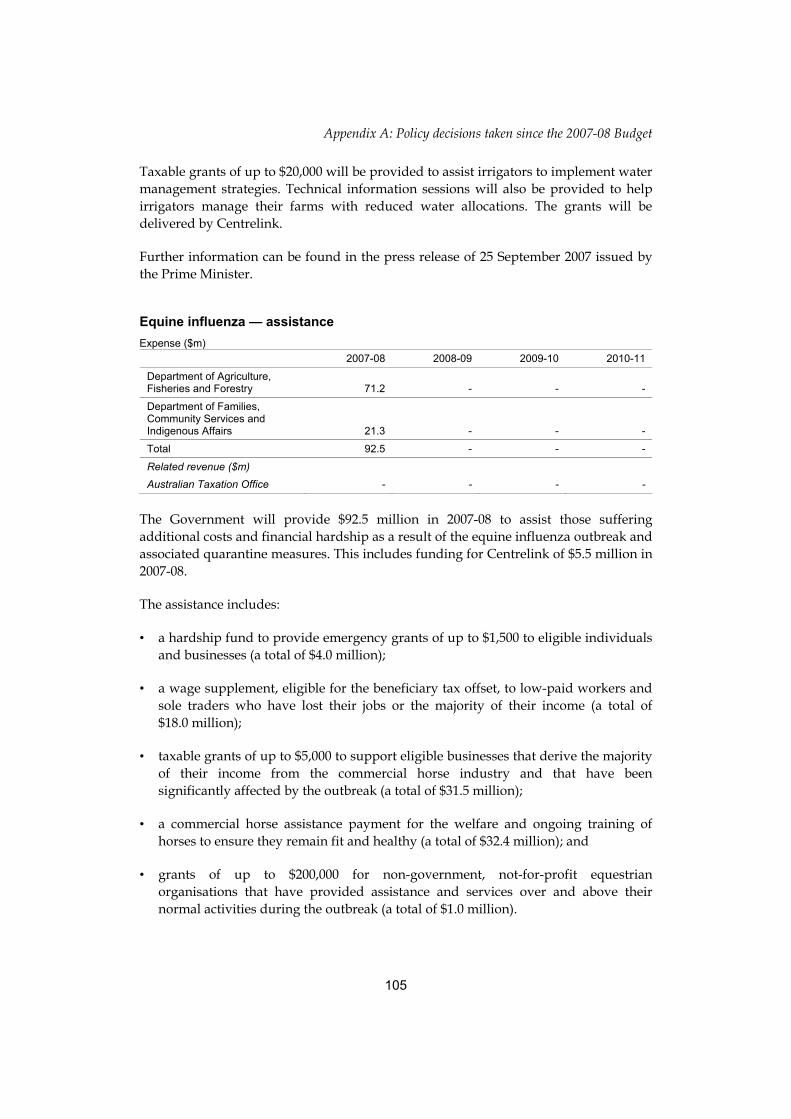
Appendix A: Policy decisions taken since the 2007-08 Budget
105
Taxable grants of up to $20,000 will be provided to assist irrigators to implement water management strategies. Technical information sessions will also be provided to help irrigators manage their farms with reduced water allocations. The grants will be delivered by Centrelink.
Further information can be found in the press release of 25 September 2007 issued by the Prime Minister.
Equine influenza — assistance Expense ($m)
2007-08 2008-09 2009-10 2010-11
Department of Agriculture, Fisheries and Forestry 71.2 - - -
Department of Families, Community Services and Indigenous Affairs 21.3 - - -
Total 92.5 - - -
Related revenue ($m)
Australian Taxation Office - - - -
The Government will provide $92.5 million in 2007-08 to assist those suffering additional costs and financial hardship as a result of the equine influenza outbreak and associated quarantine measures. This includes funding for Centrelink of $5.5 million in 2007-08.
The assistance includes:
• a hardship fund to provide emergency grants of up to $1,500 to eligible individuals and businesses (a total of $4.0 million);
• a wage supplement, eligible for the beneficiary tax offset, to low-paid workers and sole traders who have lost their jobs or the majority of their income (a total of $18.0 million);
• taxable grants of up to $5,000 to support eligible businesses that derive the majority of their income from the commercial horse industry and that have been significantly affected by the outbreak (a total of $31.5 million);
• a commercial horse assistance payment for the welfare and ongoing training of horses to ensure they remain fit and healthy (a total of $32.4 million); and
• grants of up to $200,000 for non-government, not-for-profit equestrian organisations that have provided assistance and services over and above their normal activities during the outbreak (a total of $1.0 million).

Appendix A: Policy decisions taken since the 2007-08 Budget
106
Further information can be found in the press releases of 30 August 2007 and 9 September 2007 issued by the Minister for Agriculture, Fisheries and Forestry.
Flemington Racecourse — funding for alternative water strategy Expense ($m)
2007-08 2008-09 2009-10 2010-11
Department of Agriculture, Fisheries and Forestry - - - -
The Government will provide $5.0 million in 2007-08 as a one-off grant to assist the Victorian Racing Club to implement a plan to use non-potable water at Flemington Racecourse.
The cost of this measure will be met from within the existing resourcing of the Department of Agriculture, Fisheries and Forestry.
Integrated Forest Products timber mill — support Expense ($m)
2007-08 2008-09 2009-10 2010-11
Department of Agriculture, Fisheries and Forestry 4.0 - - -
The Government will provide $4.0 million in 2007-08 to the Integrated Forest Products timber mill at Hume, in the Australian Capital Territory. The funding will assist the mill to continue to operate, with the objective of enabling the receiver to sell the business as a going concern. The funding is conditional on the New South Wales Government granting a wood supply agreement to the mill over the three financial years from 2007-08.
Jarrahdale Heritage Park — conservation Expense ($m)
2007-08 2008-09 2009-10 2010-11
Department of Agriculture, Fisheries and Forestry - - - -
The Government provided $380,000 in 2006-07 to the National Trust of Australia (Western Australia) to assist with the restoration of the Jarrahdale Heritage Park historic sawmill.
The cost of this measure was met from within the existing resourcing of the Department of Agriculture, Fisheries and Forestry.

Appendix A: Policy decisions taken since the 2007-08 Budget
107
The Jarrahdale Heritage Park is an important part of the history of the timber industry in the south-west region of Western Australia. This funding will assist the historic sawmill to remain operational and protect the heritage values of the site against further deterioration.
Tasmanian Community Forest Agreement — additional funding Expense ($m)
2007-08 2008-09 2009-10 2010-11
Department of Agriculture, Fisheries and Forestry 12.3 4.5 - -
The Government will provide $16.8 million over two years to increase grant payments under the Tasmanian Community Forest Agreement by 30 per cent in order to assist recipients to meet their taxation liabilities on the grant payments.
The Agreement is a joint commitment of the Australian and Tasmanian Governments for enhanced protection of Tasmania’s forest environment and growth in the Tasmanian forest industry and forestry jobs.
Wheat Export Authority — additional funding Expense ($m)
2007-08 2008-09 2009-10 2010-11
Department of Agriculture, Fisheries and Forestry 2.0 - - -
The Government will provide a grant of $2.0 million in 2007-08 to the Wheat Export Authority to meet operational expenses. The grant will partly offset a reduction in levy collections associated with lower wheat exports due to the drought.

Appendix A: Policy decisions taken since the 2007-08 Budget
108
ATTORNEY-GENERAL’S
Equine influenza outbreak — Commission of Inquiry Expense ($m)
2007-08 2008-09 2009-10 2010-11
Attorney-General’s Department 9.0 - - -
The Government will provide up to $9.0 million in 2007-08 to establish a Commission of Inquiry into the circumstances surrounding the entry of equine influenza into Australia.
See also the related expense measure titled Equine influenza — assistance in the Agriculture, Fisheries and Forestry portfolio.
Further information can be found in the press release of 2 September 2007 issued by the Minister for Agriculture, Fisheries and Forestry.
Federal magistrates — death and disability cover Expense ($m)
2007-08 2008-09 2009-10 2010-11
Attorney-General’s Department 0.4 0.4 0.4 0.4
The Government will provide $1.4 million over four years to meet any liability arising from the provision of statutory disability cover and death benefits for federal magistrates. Previous arrangements for federal magistrates provided no specific entitlements in the event of retirement on the grounds of disability, or death.
Federal Magistrates Court of Australia — providing additional magistrates for family law Expense ($m)
2007-08 2008-09 2009-10 2010-11
Federal Magistrates Court of Australia 1.1 1.1 1.1 1.1
Family Court of Australia -1.1 -1.1 -1.1 -1.1
Total - - - -
The Government will provide $4.4 million over four years to appoint two additional federal magistrates to deal with increased family law workloads in the Federal Magistrates Court of Australia (FMCA).

Appendix A: Policy decisions taken since the 2007-08 Budget
109
The cost of this measure will be met from within the existing resourcing of the Family Court of Australia, as new judges will not be appointed to fill recent vacancies as less complex family law matters can be more efficiently considered by the FMCA.
Further information can be found in the press releases of 30 March 2007 and 8 June 2007 issued by the Attorney-General.
Legal Aid Commission of New South Wales — additional funding Expense ($m)
2007-08 2008-09 2009-10 2010-11
Attorney-General’s Department - - - -
The Government provided $3.0 million in 2006-07 to the Legal Aid Commission of New South Wales (NSW) in order to address demand pressures being experienced by the Commission. The additional funding will ensure that disadvantaged groups in NSW have access to services that are equivalent to their counterparts in other jurisdictions.
The cost of this measure was met from within the existing resourcing of the Attorney-General’s Department.
National Community Crime Prevention Programme — additional funding Expense ($m)
2007-08 2008-09 2009-10 2010-11
Attorney-General’s Department 0.9 0.3 0.2 0.1
The Government will provide $1.5 million over four years to fund additional projects involving local crime prevention and safety initiatives under the National Community Crime Prevention Programme.
The National Community Crime Prevention Programme provides funding for grass roots projects designed to enhance community safety and prevention by: preventing or reducing crime and anti-social behaviour; improving community safety and security; and reducing the fear of crime.

Appendix A: Policy decisions taken since the 2007-08 Budget
110
COMMUNICATIONS, INFORMATION TECHNOLOGY AND THE ARTS
Adelaide Crows and Port Adelaide Football Club — contribution to training and community facility redevelopment Expense ($m)
2007-08 2008-09 2009-10 2010-11
Department of Communications, Information Technology and the Arts 5.0 - - -
The Government will provide $2.5 million each to the Adelaide Crows and the Port Adelaide Football Club in 2007-08 to improve access to their training and community facilities at Alberton Oval and AAMI Stadium.
Further information can be found in the press release of 27 September 2007 issued by the Minister for Finance and Administration.
Australia Connected — additional funding for OPEL Expense ($m)
2007-08 2008-09 2009-10 2010-11
Department of Communications, Information Technology and the Arts - 132.0 226.0 -
The Government will provide $958.0 million over three years from 2007-08 to OPEL, a joint venture between Optus and Elders, to build a high speed wholesale broadband network and expand broadband access to 99 per cent of the population by June 2009. OPEL has agreed to make its own commercial contribution of over $900 million to this new network.
This measure includes funding of $600.0 million over two years from 2007-08 under the Broadband Connect Infrastructure Programme, which forms part of the Connect Australia package, announced in the Mid-Year Economic and Fiscal Outlook 2005-06. Provision for this funding has already been included in the forward estimates.
See also the related expense measures titled Australia Connected in the Communications, Information Technology and the Arts portfolio.
Further information can be found in the press release of 18 June 2007 and 9 September 2007 issued by the Minister for Communications, Information Technology and the Arts.
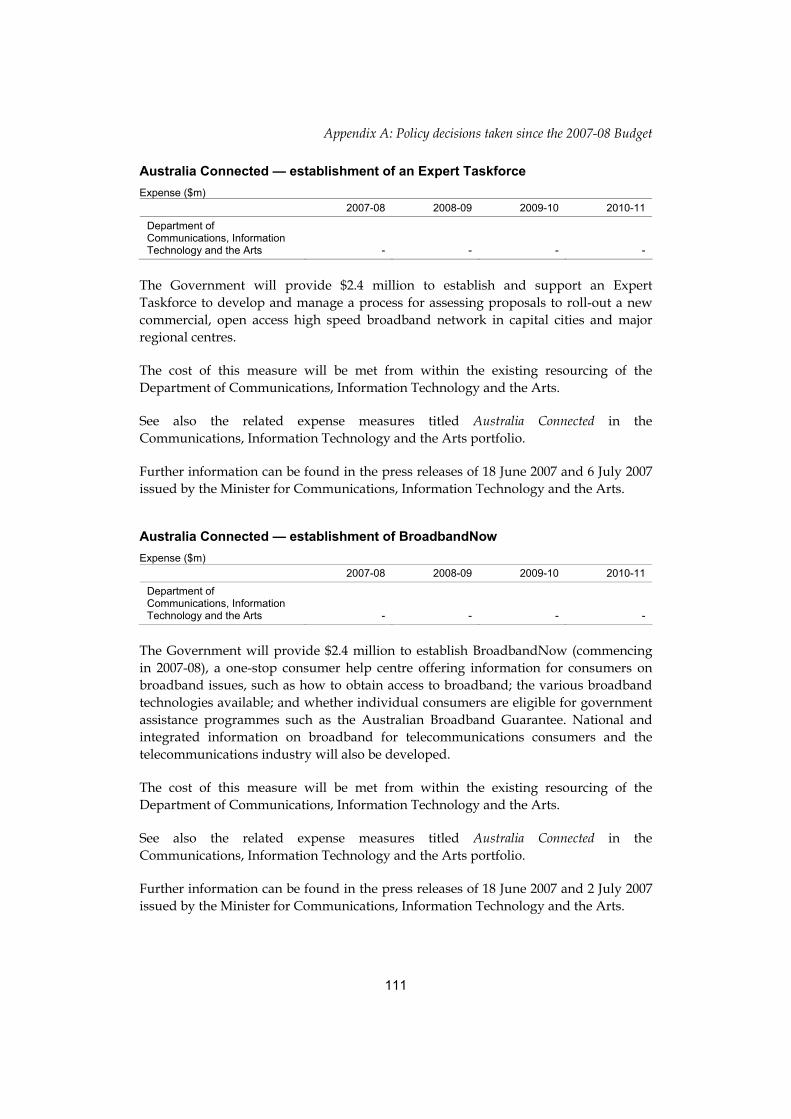
Appendix A: Policy decisions taken since the 2007-08 Budget
111
Australia Connected — establishment of an Expert Taskforce Expense ($m)
2007-08 2008-09 2009-10 2010-11
Department of Communications, Information Technology and the Arts - - - -
The Government will provide $2.4 million to establish and support an Expert Taskforce to develop and manage a process for assessing proposals to roll-out a new commercial, open access high speed broadband network in capital cities and major regional centres.
The cost of this measure will be met from within the existing resourcing of the Department of Communications, Information Technology and the Arts.
See also the related expense measures titled Australia Connected in the Communications, Information Technology and the Arts portfolio.
Further information can be found in the press releases of 18 June 2007 and 6 July 2007 issued by the Minister for Communications, Information Technology and the Arts.
Australia Connected — establishment of BroadbandNow Expense ($m)
2007-08 2008-09 2009-10 2010-11
Department of Communications, Information Technology and the Arts - - - -
The Government will provide $2.4 million to establish BroadbandNow (commencing in 2007-08), a one-stop consumer help centre offering information for consumers on broadband issues, such as how to obtain access to broadband; the various broadband technologies available; and whether individual consumers are eligible for government assistance programmes such as the Australian Broadband Guarantee. National and integrated information on broadband for telecommunications consumers and the telecommunications industry will also be developed.
The cost of this measure will be met from within the existing resourcing of the Department of Communications, Information Technology and the Arts.
See also the related expense measures titled Australia Connected in the Communications, Information Technology and the Arts portfolio.
Further information can be found in the press releases of 18 June 2007 and 2 July 2007 issued by the Minister for Communications, Information Technology and the Arts.

Appendix A: Policy decisions taken since the 2007-08 Budget
112
Australian National Rugby Academy — contribution Expense ($m)
2007-08 2008-09 2009-10 2010-11
Department of Communications, Information Technology and the Arts 5.0 10.0 10.0 -
The Government will provide $25.0 million in 2007-08 to the Australian Rugby Union as a contribution towards the establishment of the Australian National Rugby Academy at Ballymore in Queensland. The fiscal impact over three years from 2007-08 reflects the funds being fully expensed as project milestones are completed.
The Academy will centralise training facilities for up–and-coming future stars of Australian rugby through on-field skills training, gymnasiums, pools and supporting infrastructure such as medical and conference facilities.
Further information can be found in the press release of 30 June 2007 issued by the Prime Minister.
Camden Aquatic Sports Centre — contribution Expense ($m)
2007-08 2008-09 2009-10 2010-11
Department of Communications, Information Technology and the Arts 5.0 - - -
The Government will provide $5.0 million in 2007-08 to the Camden Council in New South Wales to assist in the development of the new Camden Aquatic Sports Centre, which will replace the Camden Memorial Pool.
Campbelltown City Soccer Club — contribution Expense ($m)
2007-08 2008-09 2009-10 2010-11
Department of Communications, Information Technology and the Arts 0.5 0.5 - -
The Government will provide $1.0 million in 2007-08 as a contribution towards the construction of a new multi-purpose facility for junior clubrooms at the Campbelltown City Soccer Club’s home ground at the Newton Village Sports Complex. The fiscal impact over two years reflects the funds being fully expensed as project milestones are completed.

Appendix A: Policy decisions taken since the 2007-08 Budget
113
Community sporting facilities Expense ($m)
2007-08 2008-09 2009-10 2010-11
Department of Communications, Information Technology and the Arts - - - -
The Government provided $0.9 million in 2006-07 to contribute to community sporting and recreation facilities in New South Wales. The funding comprises:
• $0.7 million to assist in the development of an indoor heated pool facility in Lithgow;
• $0.2 million to fund lighting for the Bathurst rugby fields; and
• $5,000 for the redevelopment of Tom Hunter Park at Faulconbridge.
Provision for this funding has already been included in the forward estimates.
Further information can be found in the announcement of 25 May 2007 made by the Prime Minister and the Member for Macquarie and the press release of 16 May 2007 issued by the Member for Macquarie.
Community Street Soccer Programme — contribution Expense ($m)
2007-08 2008-09 2009-10 2010-11
Department of Communications, Information Technology and the Arts 1.2 1.1 0.7 -
The Government will provide $3.0 million over three years from 2007-08 as a contribution to the Community Street Soccer Programme, which aims to assist homeless, recently homeless and unemployed people to reconnect with the community and regain self-esteem and independence through participating in sports. This funding comprises $1.2 million to build 30 Community Street Soccer sites and $1.8 million for the operation of the sites.
Darwin Symphony Orchestra — additional funding Expense ($m)
2007-08 2008-09 2009-10 2010-11
Australia Council 0.1 0.1 0.1 0.1
The Government will provide additional ongoing funding of $0.1 million per annum from 2007-08 to the Darwin Symphony Orchestra to enhance its artistic programme.

Appendix A: Policy decisions taken since the 2007-08 Budget
114
Football Federation Australia — contribution Expense ($m)
2007-08 2008-09 2009-10 2010-11
Australian Sports Commission 4.0 4.0 4.0 4.0
The Government will provide $16.0 million over four years to Football Federation Australia to contribute to the costs of the women’s (national under-17 years and under-20 years), men’s (Olympic under-17 years and under-20 years), futsal and paralympic (cerebral palsy) Australian teams.
Further information can be found in the press release of 11 September 2007 issued by the Minister for the Arts and Sport.
Illicit drugs in sport Expense ($m)
2007-08 2008-09 2009-10 2010-11
Australian Sports Anti-Doping Authority 0.4 0.7 0.6 0.6
Department of Communications, Information Technology and the Arts 0.3 13.8 13.1 12.2
Total 0.7 14.5 13.7 12.8
The Government will provide $41.8 million over four years to implement a national illicit drugs in sport policy, comprising minimum standards for testing, management of positive results and education for high-profile, high-risk and professional sports people.
Relevant national sporting organisations, which adopt the national illicit drugs policy, will be provided with funding for these activities.
The future funding requirements for this programme will be determined after consultation with the relevant National Sporting Organisations. The programme is expected to begin development in October 2007 and be fully implemented from July 2008.
Further information can be found in the press release of 6 October 2007 issued by the Minister for the Arts and Sport and the Minister for Health and Ageing.
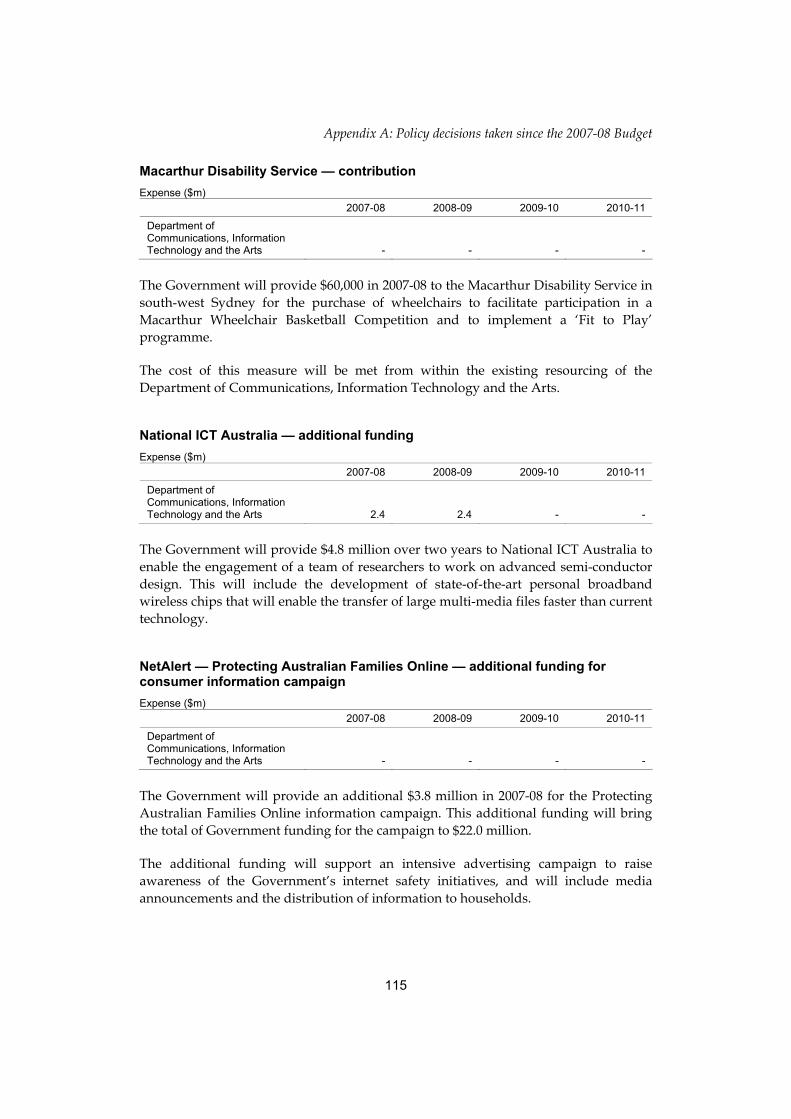
Appendix A: Policy decisions taken since the 2007-08 Budget
115
Macarthur Disability Service — contribution Expense ($m)
2007-08 2008-09 2009-10 2010-11
Department of Communications, Information Technology and the Arts - - - -
The Government will provide $60,000 in 2007-08 to the Macarthur Disability Service in south-west Sydney for the purchase of wheelchairs to facilitate participation in a Macarthur Wheelchair Basketball Competition and to implement a ‘Fit to Play’ programme.
The cost of this measure will be met from within the existing resourcing of the Department of Communications, Information Technology and the Arts.
National ICT Australia — additional funding Expense ($m)
2007-08 2008-09 2009-10 2010-11
Department of Communications, Information Technology and the Arts 2.4 2.4 - -
The Government will provide $4.8 million over two years to National ICT Australia to enable the engagement of a team of researchers to work on advanced semi-conductor design. This will include the development of state-of-the-art personal broadband wireless chips that will enable the transfer of large multi-media files faster than current technology.
NetAlert — Protecting Australian Families Online — additional funding for consumer information campaign Expense ($m)
2007-08 2008-09 2009-10 2010-11
Department of Communications, Information Technology and the Arts - - - -
The Government will provide an additional $3.8 million in 2007‐08 for the Protecting Australian Families Online information campaign. This additional funding will bring the total of Government funding for the campaign to $22.0 million.
The additional funding will support an intensive advertising campaign to raise awareness of the Government’s internet safety initiatives, and will include media announcements and the distribution of information to households.
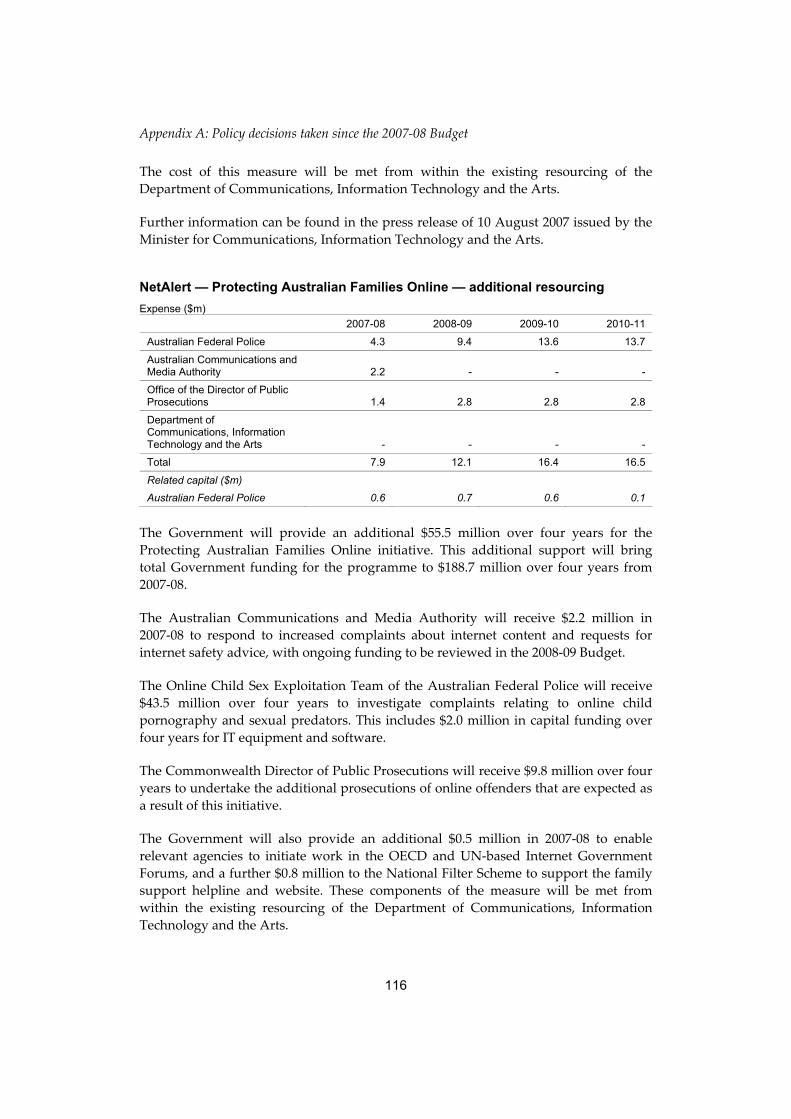
Appendix A: Policy decisions taken since the 2007-08 Budget
116
The cost of this measure will be met from within the existing resourcing of the Department of Communications, Information Technology and the Arts.
Further information can be found in the press release of 10 August 2007 issued by the Minister for Communications, Information Technology and the Arts.
NetAlert — Protecting Australian Families Online — additional resourcing Expense ($m)
2007-08 2008-09 2009-10 2010-11
Australian Federal Police 4.3 9.4 13.6 13.7
Australian Communications and Media Authority 2.2 - - -
Office of the Director of Public Prosecutions 1.4 2.8 2.8 2.8
Department of Communications, Information Technology and the Arts - - - -
Total 7.9 12.1 16.4 16.5
Related capital ($m)
Australian Federal Police 0.6 0.7 0.6 0.1
The Government will provide an additional $55.5 million over four years for the Protecting Australian Families Online initiative. This additional support will bring total Government funding for the programme to $188.7 million over four years from 2007‐08.
The Australian Communications and Media Authority will receive $2.2 million in 2007‐08 to respond to increased complaints about internet content and requests for internet safety advice, with ongoing funding to be reviewed in the 2008‐09 Budget.
The Online Child Sex Exploitation Team of the Australian Federal Police will receive $43.5 million over four years to investigate complaints relating to online child pornography and sexual predators. This includes $2.0 million in capital funding over four years for IT equipment and software.
The Commonwealth Director of Public Prosecutions will receive $9.8 million over four years to undertake the additional prosecutions of online offenders that are expected as a result of this initiative.
The Government will also provide an additional $0.5 million in 2007‐08 to enable relevant agencies to initiate work in the OECD and UN‐based Internet Government Forums, and a further $0.8 million to the National Filter Scheme to support the family support helpline and website. These components of the measure will be met from within the existing resourcing of the Department of Communications, Information Technology and the Arts.
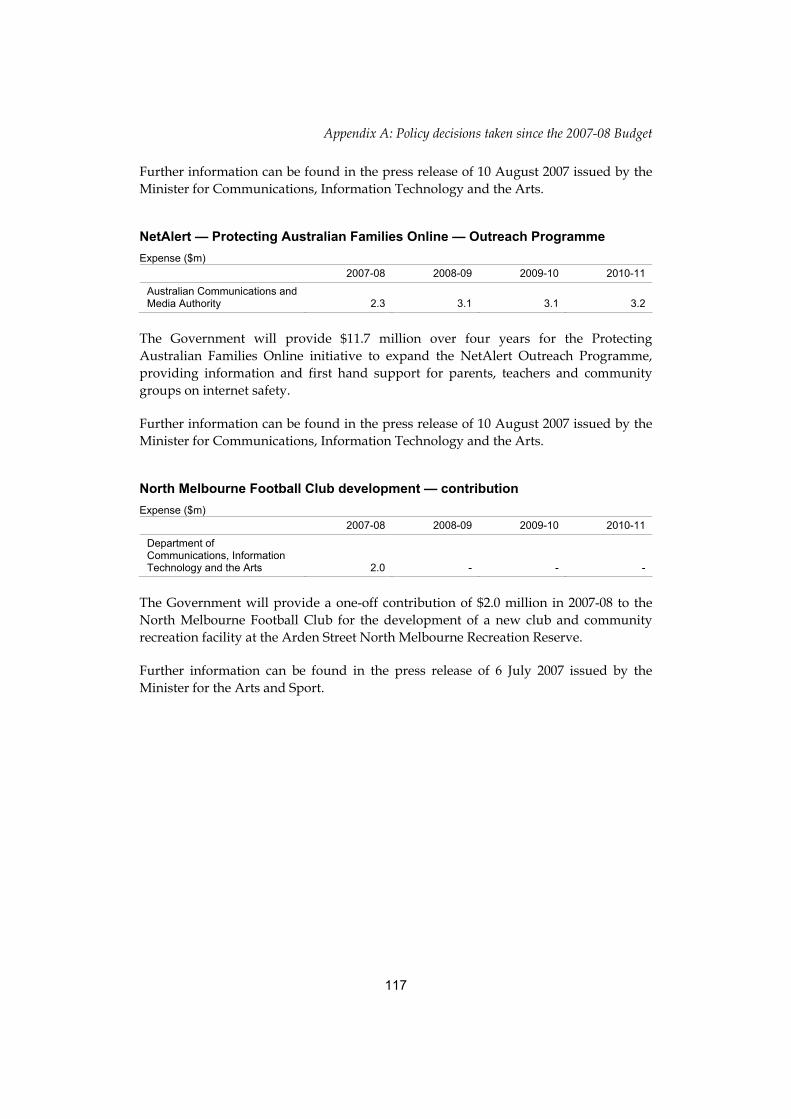
Appendix A: Policy decisions taken since the 2007-08 Budget
117
Further information can be found in the press release of 10 August 2007 issued by the Minister for Communications, Information Technology and the Arts.
NetAlert — Protecting Australian Families Online — Outreach Programme Expense ($m)
2007-08 2008-09 2009-10 2010-11
Australian Communications and Media Authority 2.3 3.1 3.1 3.2
The Government will provide $11.7 million over four years for the Protecting Australian Families Online initiative to expand the NetAlert Outreach Programme, providing information and first hand support for parents, teachers and community groups on internet safety.
Further information can be found in the press release of 10 August 2007 issued by the Minister for Communications, Information Technology and the Arts.
North Melbourne Football Club development — contribution Expense ($m)
2007-08 2008-09 2009-10 2010-11
Department of Communications, Information Technology and the Arts 2.0 - - -
The Government will provide a one-off contribution of $2.0 million in 2007-08 to the North Melbourne Football Club for the development of a new club and community recreation facility at the Arden Street North Melbourne Recreation Reserve.
Further information can be found in the press release of 6 July 2007 issued by the Minister for the Arts and Sport.

Appendix A: Policy decisions taken since the 2007-08 Budget
118
Rugby League Hall of Fame — contribution Expense ($m)
2007-08 2008-09 2009-10 2010-11
Department of Communications, Information Technology and the Arts 3.0 7.0 - -
The Government will provide $10.0 million in 2007-08 to the Australian Rugby League to establish the Rugby League Hall of Fame, which will have a major facility in Sydney and a satellite facility in Brisbane. These multifunction facilities will establish a permanent home for Rugby League’s historic memorabilia and include interactive displays tailored to school curricula and fitness education. The facilities will also cater for media conferences, seminars, and receptions. The fiscal impact over two years reflects the funds being fully expensed as project milestones are completed.
Further information can be found in the press release of 30 September 2007 issued by the Prime Minister.
Rugby League World Cup 2008 and celebration of the Centenary of Rugby League — contribution Expense ($m)
2007-08 2008-09 2009-10 2010-11
Australian Sports Commission 2.0 0.6 - -
The Government will provide $2.6 million over two years to the Australian Rugby League as a contribution towards the staging of the 2008 World Cup in Australia and the celebration of the 2008 Centenary of Rugby League.
Further information can be found in the press release of 30 September 2007 issued by the Prime Minister.
Skilled Stadium redevelopment — contribution Expense ($m)
2007-08 2008-09 2009-10 2010-11
Department of Communications, Information Technology and the Arts 4.0 10.0 - -
The Government will provide a one-off contribution of $14.0 million in 2007-08 to the Geelong Football Club to contribute towards the redevelopment of Skilled Stadium (Kardinia Park) to: increase ground capacity with a new Ross Drew stand; expand the high performance gymnasium; provide additional facilities for spectators with a disability; and develop new and expanded corporate entertaining and administrative facilities. The fiscal impact over two years reflects the funds being fully expensed as project milestones are completed.

Appendix A: Policy decisions taken since the 2007-08 Budget
119
Further information can be found in the press release of 21 September 2007 issued by the Treasurer.
South Pine Sports Complex upgrade — contribution Expense ($m)
2007-08 2008-09 2009-10 2010-11
Department of Communications, Information Technology and the Arts 0.2 - - -
The Government will provide $0.2 million in 2007-08 as a contribution to the upgrade and redevelopment of the South Pine Sports Complex, in Albany Creek, Queensland, including the replacement of goalposts at two of its sports fields (Brendale and Wolter Park).
Special Broadcasting Service — broadcasting of World Youth Day 2008 Expense ($m)
2007-08 2008-09 2009-10 2010-11
Special Broadcasting Service Corporation 2.5 - - -
The Government will provide $2.5 million to the Special Broadcasting Service Corporation (SBS) in 2007-08 to contribute to SBS’s coverage of the World Youth Day 2008.
This measure will provide financial support to SBS’s broadcasting and online services for the World Youth Day 2008, including live programming across television and radio, a comprehensive online focus and ΄live΄ sites in all the capital cities in Australia.
Further information can be found in the press release of 15 September 2007 issued by the Minister for Communications, Information Technology and the Arts.

Appendix A: Policy decisions taken since the 2007-08 Budget
120
Townsville International Sports Centre Expense ($m)
2007-08 2008-09 2009-10 2010-11
Department of Communications, Information Technology and the Arts 3.0 - - -
The Government will provide $6.4 million over two years for the Townsville International Sports Centre, also known as the Murray Sports Complex. This will provide the Townsville region with a high standard sport and recreational facility which will be capable of attracting international and national sporting events to the region. Funding of $3.4 million for the first stage of the project was provided through a Regional Partnerships Programme grant in 2006-07.
Further information can be found in the press release of 18 May 2007 issued by the Prime Minister.

Appendix A: Policy decisions taken since the 2007-08 Budget
121
CROSS PORTFOLIO
Efficiency dividend — increase in the rate from 1 per cent to 1.25 per cent Expense ($m)
2007-08 2008-09 2009-10 2010-11
Various Agencies - -61.0 -123.0 -187.0
The Government will increase the rate of the efficiency dividend from 1 per cent per annum to 1.25 per cent per annum from 2008-09 to 2010-11. This is consistent with the rate applied over the three years from 2005-06 to 2007-08. This will result in savings of $371.0 million over three years.
The efficiency dividend applies to the operational costs of most Australian Government agencies and certain programmes, and reduces the level of funding provided each year to ensure efficiencies are returned to the Budget.

Appendix A: Policy decisions taken since the 2007-08 Budget
122
DEFENCE
Amberley State School Expense ($m)
2007-08 2008-09 2009-10 2010-11
Department of Defence - - - -
The Government will provide up to $26.8 million in 2007-08 for a new school to replace the current Amberley State School in Queensland. The new school will accommodate 330 students and provide out-of-school care for 60 students. The expansion of the RAAF Base Amberley into the land area occupied by the existing school has led to the need for the new school in a new location.
The cost of this measure will be met from within the existing resourcing of the Department of Defence.
Further information can be found in the press release of 27 June 2007 issued by the Prime Minister.
Australian Army — additional infantry battalions — Stage 2 Expense ($m)
2007-08 2008-09 2009-10 2010-11
Department of Defence 34.7 132.9 254.4 368.3
Related capital ($m)
Department of Defence 0.2 39.0 97.6 352.4
The Government will provide $4.4 billion over 10 years (including $3.1 billion over six years from 2011-12) to implement Stage 2 of the Enhanced Land Force initiative. This will increase the size of the Army by a second additional infantry battalion, following on from the announcement in August 2006 of Stage 1, the first additional battalion. The second battalion will be raised in 2008, achieve an operational capability by 2010 and be fully deployable by 2011.
This measure builds on the Mid-Year Economic and Fiscal Outlook 2006-07 measure, Australian Army — additional infantry battalion.
Provision of $1.3 billion over four years was included in the Contingency Reserve in the Mid-Year Economic and Fiscal Outlook 2006-07.
Further information can be found in the press release of 2 October 2007 issued by the Prime Minister.

Appendix A: Policy decisions taken since the 2007-08 Budget
123
HMAS Sydney II — search operation Expense ($m)
2007-08 2008-09 2009-10 2010-11
Department of Defence - - - -
The Government will provide $2.9 million to the Sydney Search Group in 2007-08 to assist in the search for the HMAS Sydney II. This is in addition to an earlier commitment by the Government of $1.3 million, bringing the total contribution to $4.2 million.
The cost of this measure will be met from within the existing resourcing of the Department of Defence.
Further information can be found in the press release of 24 August 2007 issued by the Minister Assisting the Minister for Defence.
Operation CATALYST — enhanced surveillance capability Expense ($m)
2007-08 2008-09 2009-10 2010-11
Department of Defence 12.4 - - -
The Government will provide $12.4 million in 2007-08 to enhance the surveillance capability of the Australian Defence Force in support of operations in Iraq.
Operations CATALYST and SLIPPER — enhanced protective capability Expense ($m)
2007-08 2008-09 2009-10 2010-11
Department of Defence 69.7 - - -
The Government will provide $69.7 million in 2007-08 to enhance the protective capability of Infantry Mobility Vehicles used in support of operations in Iraq and Afghanistan.
Solomon Islands — continued presence by the Australian Defence Force Expense ($m)
2007-08 2008-09 2009-10 2010-11
Department of Defence 6.7 13.0 - -
The Government will provide $19.7 million over two years to extend Operation Anode, the Australian Defence Force’s support to the Regional Assistance Mission to the Solomon Islands, from March 2008 to December 2008.

Appendix A: Policy decisions taken since the 2007-08 Budget
124
EDUCATION, SCIENCE AND TRAINING
Apprenticeship incentives for agriculture and horticulture Expense ($m)
2007-08 2008-09 2009-10 2010-11
Department of Education, Science and Training 7.6 12.7 13.5 13.9
The Government will provide $47.7 million over four years to extend the eligibility for the $500 Fee Assistance Training Voucher and the Tools For Your Trade initiative. All first and second year Australian Apprentices undertaking a Certificate level II, III or IV qualification in agriculture, and those in rural and regional areas who are undertaking a Certificate level II, III or IV qualification in horticulture, will now be eligible for the assistance.
Australian Nuclear Science and Technology Organisation — decommissioning costs for the High Flux Australian Research Reactor Expense ($m)
2007-08 2008-09 2009-10 2010-11
Australian Nuclear Science and Technology Organisation - - - -
The Government will provide $13.2 million over two years from 2007-08 to fund the estimated expenses associated with decommissioning and site restoration of the High Flux Australian Research Reactor and associated assets. This measure involves funding of $1.1 million in 2007-08 and $12.1 million in 2008-09. Provision for this funding has already been included in the forward estimates.
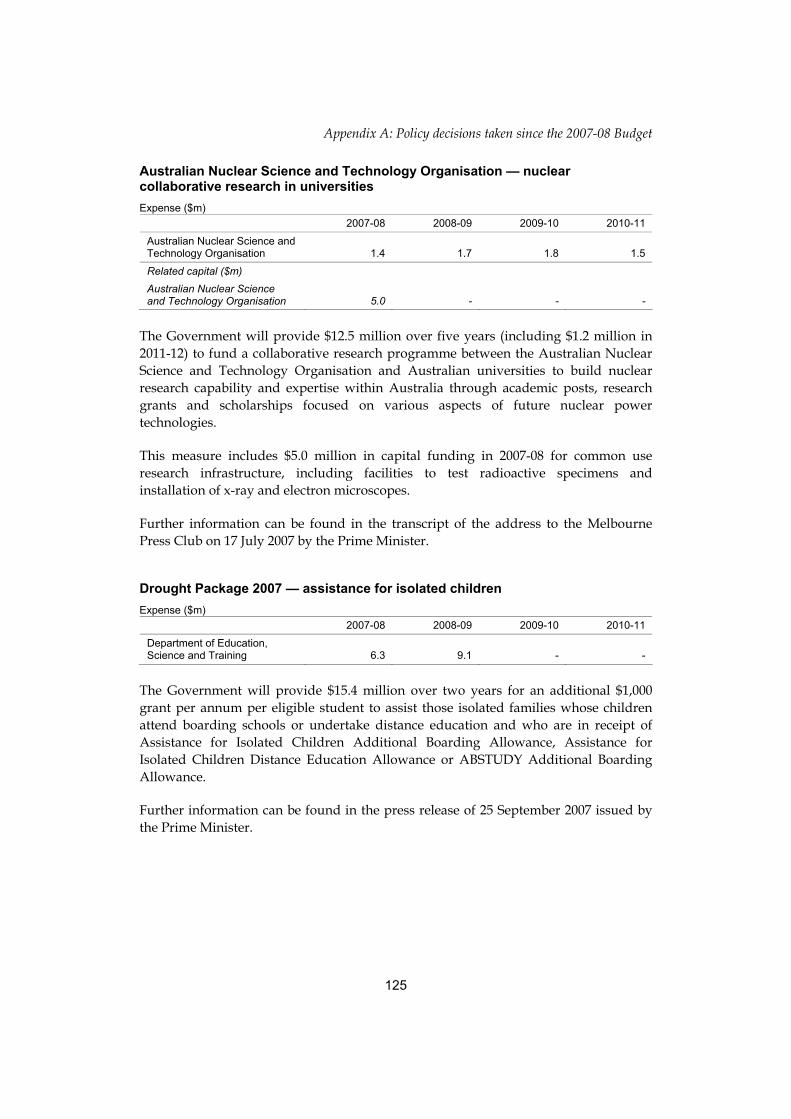
Appendix A: Policy decisions taken since the 2007-08 Budget
125
Australian Nuclear Science and Technology Organisation — nuclear collaborative research in universities Expense ($m)
2007-08 2008-09 2009-10 2010-11
Australian Nuclear Science and Technology Organisation 1.4 1.7 1.8 1.5
Related capital ($m)
Australian Nuclear Science and Technology Organisation 5.0 - - -
The Government will provide $12.5 million over five years (including $1.2 million in 2011-12) to fund a collaborative research programme between the Australian Nuclear Science and Technology Organisation and Australian universities to build nuclear research capability and expertise within Australia through academic posts, research grants and scholarships focused on various aspects of future nuclear power technologies.
This measure includes $5.0 million in capital funding in 2007-08 for common use research infrastructure, including facilities to test radioactive specimens and installation of x-ray and electron microscopes.
Further information can be found in the transcript of the address to the Melbourne Press Club on 17 July 2007 by the Prime Minister.
Drought Package 2007 — assistance for isolated children Expense ($m)
2007-08 2008-09 2009-10 2010-11
Department of Education, Science and Training 6.3 9.1 - -
The Government will provide $15.4 million over two years for an additional $1,000 grant per annum per eligible student to assist those isolated families whose children attend boarding schools or undertake distance education and who are in receipt of Assistance for Isolated Children Additional Boarding Allowance, Assistance for Isolated Children Distance Education Allowance or ABSTUDY Additional Boarding Allowance.
Further information can be found in the press release of 25 September 2007 issued by the Prime Minister.
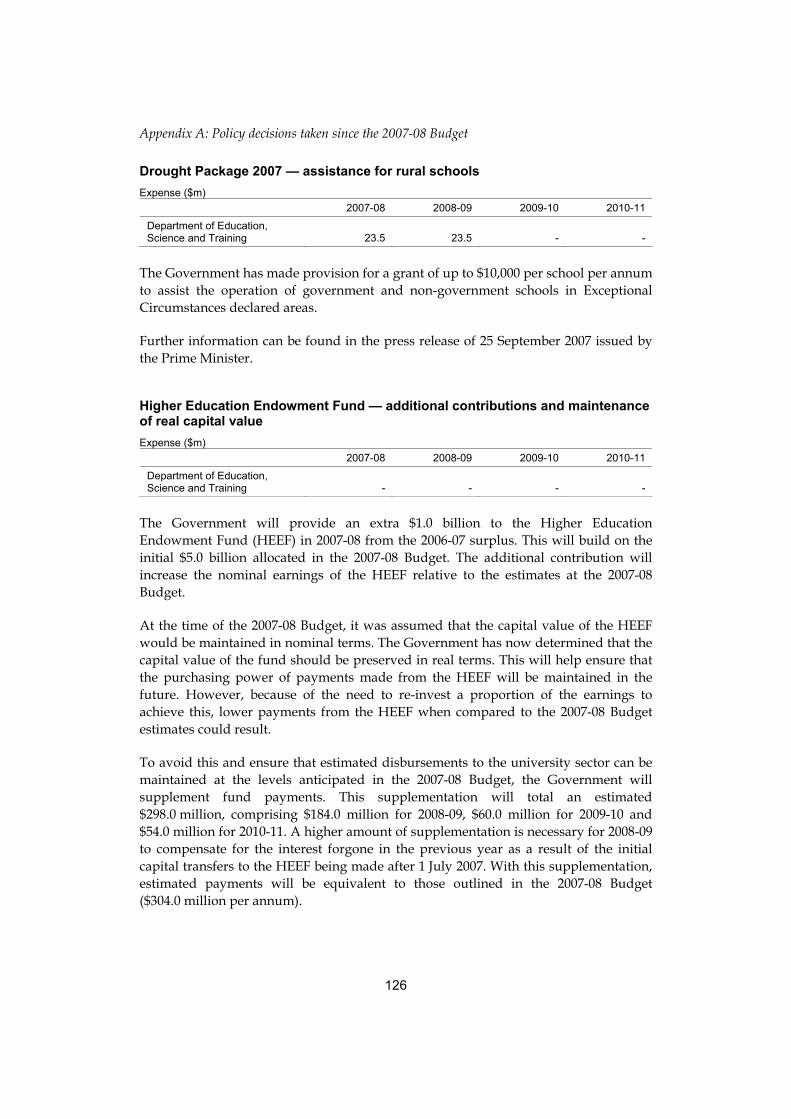
Appendix A: Policy decisions taken since the 2007-08 Budget
126
Drought Package 2007 — assistance for rural schools Expense ($m)
2007-08 2008-09 2009-10 2010-11
Department of Education, Science and Training 23.5 23.5 - -
The Government has made provision for a grant of up to $10,000 per school per annum to assist the operation of government and non-government schools in Exceptional Circumstances declared areas.
Further information can be found in the press release of 25 September 2007 issued by the Prime Minister.
Higher Education Endowment Fund — additional contributions and maintenance of real capital value Expense ($m)
2007-08 2008-09 2009-10 2010-11
Department of Education, Science and Training - - - -
The Government will provide an extra $1.0 billion to the Higher Education Endowment Fund (HEEF) in 2007-08 from the 2006-07 surplus. This will build on the initial $5.0 billion allocated in the 2007-08 Budget. The additional contribution will increase the nominal earnings of the HEEF relative to the estimates at the 2007-08 Budget.
At the time of the 2007-08 Budget, it was assumed that the capital value of the HEEF would be maintained in nominal terms. The Government has now determined that the capital value of the fund should be preserved in real terms. This will help ensure that the purchasing power of payments made from the HEEF will be maintained in the future. However, because of the need to re-invest a proportion of the earnings to achieve this, lower payments from the HEEF when compared to the 2007-08 Budget estimates could result.
To avoid this and ensure that estimated disbursements to the university sector can be maintained at the levels anticipated in the 2007-08 Budget, the Government will supplement fund payments. This supplementation will total an estimated $298.0 million, comprising $184.0 million for 2008-09, $60.0 million for 2009-10 and $54.0 million for 2010-11. A higher amount of supplementation is necessary for 2008-09 to compensate for the interest forgone in the previous year as a result of the initial capital transfers to the HEEF being made after 1 July 2007. With this supplementation, estimated payments will be equivalent to those outlined in the 2007-08 Budget ($304.0 million per annum).

Appendix A: Policy decisions taken since the 2007-08 Budget
127
Apart from this initial supplementation for the reason explained, actual payments to the university sector from the HEEF will depend on the fund’s realised investment earnings.
Further information can be found in the press release of 21 August 2007 issued by the Treasurer.
National School Chaplaincy Programme — additional funding Expense ($m)
2007-08 2008-09 2009-10 2010-11
Department of Education, Science and Training 11.5 24.3 34.3 5.0
The Government will provide $75.0 million over four years under the National School Chaplaincy Programme to meet the higher-than-expected demand for chaplaincy services in schools, and to provide additional support for chaplaincy service providers.
The National School Chaplaincy Programme aims to support schools and their communities that wish to establish school chaplaincy services, or to enhance existing chaplaincy services, by providing up to $20,000 per annum, or up to a maximum of $60,000 over the life of the programme.
This funding is in addition to $107.5 million over four years announced in the Mid-Year Economic and Fiscal Outlook 2006-07 measure National School Chaplaincy Programme.
Further information can be found in the press releases of 27 June 2007 and 11 October 2007 issued by the Prime Minister.
National Skills Needs List — establishment Expense ($m)
2007-08 2008-09 2009-10 2010-11
Department of Education, Science and Training 8.0 14.3 17.0 18.2
The Government will provide $57.5 million over four years for the establishment of a new National Skills Needs List (NSNL) to determine the eligibility of employers and their apprentices for Australian Government incentives targeted at trade occupations which are in skills shortage. The NSNL replaced the Migration Occupations in Demand List effective 1 July 2007. The NSNL has been developed to take into consideration cyclical fluctuations and will better reflect the long-term needs of the Australian labour market.
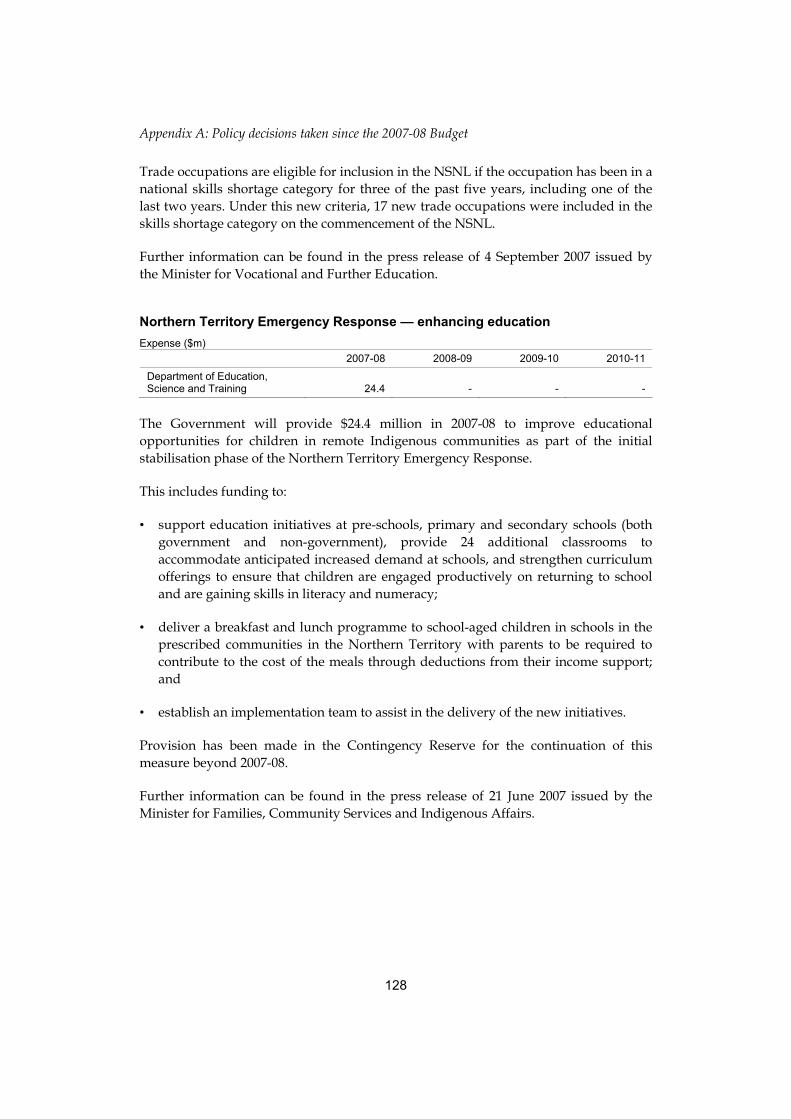
Appendix A: Policy decisions taken since the 2007-08 Budget
128
Trade occupations are eligible for inclusion in the NSNL if the occupation has been in a national skills shortage category for three of the past five years, including one of the last two years. Under this new criteria, 17 new trade occupations were included in the skills shortage category on the commencement of the NSNL.
Further information can be found in the press release of 4 September 2007 issued by the Minister for Vocational and Further Education.
Northern Territory Emergency Response — enhancing education Expense ($m)
2007-08 2008-09 2009-10 2010-11
Department of Education, Science and Training 24.4 - - -
The Government will provide $24.4 million in 2007-08 to improve educational opportunities for children in remote Indigenous communities as part of the initial stabilisation phase of the Northern Territory Emergency Response.
This includes funding to:
• support education initiatives at pre-schools, primary and secondary schools (both government and non-government), provide 24 additional classrooms to accommodate anticipated increased demand at schools, and strengthen curriculum offerings to ensure that children are engaged productively on returning to school and are gaining skills in literacy and numeracy;
• deliver a breakfast and lunch programme to school-aged children in schools in the prescribed communities in the Northern Territory with parents to be required to contribute to the cost of the meals through deductions from their income support; and
• establish an implementation team to assist in the delivery of the new initiatives.
Provision has been made in the Contingency Reserve for the continuation of this measure beyond 2007-08.
Further information can be found in the press release of 21 June 2007 issued by the Minister for Families, Community Services and Indigenous Affairs.

Appendix A: Policy decisions taken since the 2007-08 Budget
129
Research vessel Southern Surveyor — additional funding Expense ($m)
2007-08 2008-09 2009-10 2010-11
Commonwealth Scientific and Industrial Research Organisation - 3.0 - -
The Government will provide $3.0 million in 2008-09 to support the operations of the research vessel Southern Surveyor, a Marine National Facility.
The additional funding will allow scientists to spend around 180 research days at sea and maintain the current level of research beyond Australian coastal waters. The Southern Surveyor focuses on deep sea research, gathering data for use in areas such as climate change, oil and gas exploration, and sustainable use of fisheries.
Veterinary Science Programme at the University of Adelaide Expense ($m)
2007-08 2008-09 2009-10 2010-11
Department of Education, Science and Training 15.0 - - -
The Government will provide a one-off contribution of $15.0 million in 2007-08 towards the capital costs of a new Veterinary Science Programme at the University of Adelaide. This measure will support 40 new places for the pre-veterinary undergraduate course commencing in 2008 and 50 new places for the Masters of Veterinary Science course commencing in 2011.
Further information can be found in the press release of 11 September 2007 issued by the Minister for Education, Science and Training.
Work Skills Vouchers — extension Expense ($m)
2007-08 2008-09 2009-10 2010-11
Department of Education, Science and Training 110.0 94.3 94.3 94.3
The Government will provide $393.0 million over four years to increase the number of Work Skills Vouchers that are available to eligible Australians. The programme was previously capped at 30,000 vouchers per annum, but will now be uncapped.
The Work Skills Vouchers programme provides to Australians, aged 25 years and over who do not have a Year 12 or equivalent qualification, a voucher up to the value of $3,000 to help improve their qualifications.
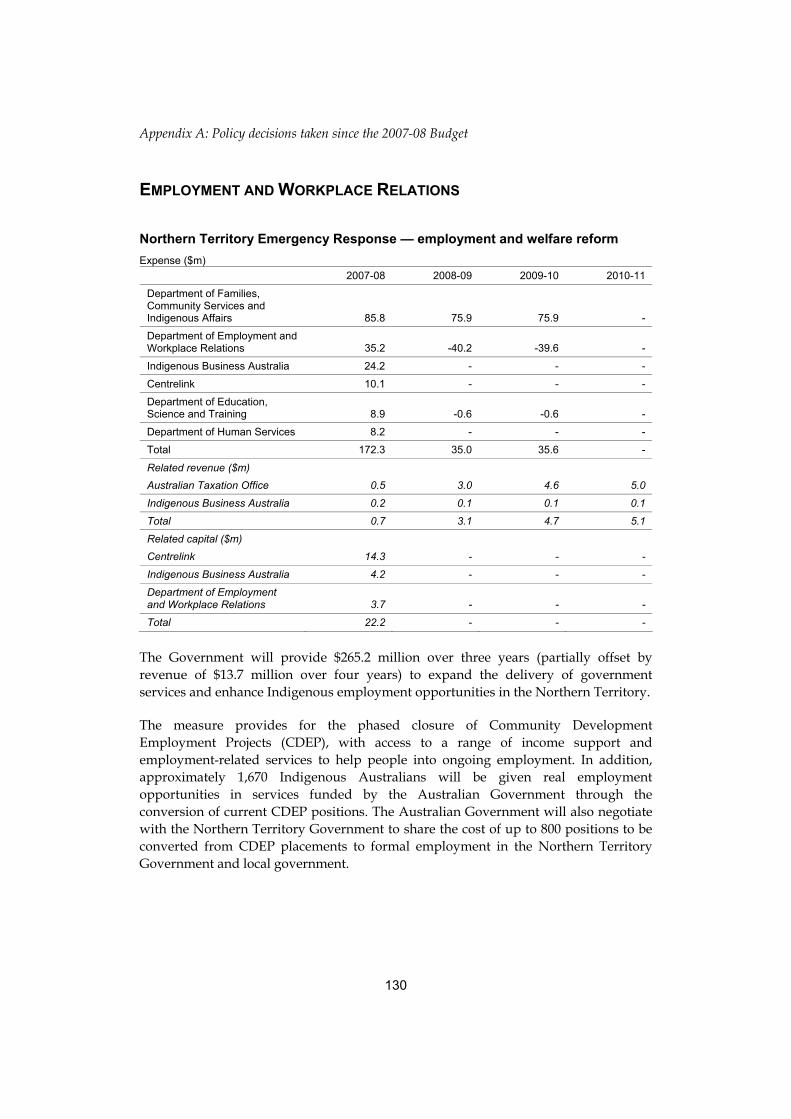
Appendix A: Policy decisions taken since the 2007-08 Budget
130
EMPLOYMENT AND WORKPLACE RELATIONS
Northern Territory Emergency Response — employment and welfare reform Expense ($m)
2007-08 2008-09 2009-10 2010-11
Department of Families, Community Services and Indigenous Affairs 85.8 75.9 75.9 -
Department of Employment and Workplace Relations 35.2 -40.2 -39.6 -
Indigenous Business Australia 24.2 - - -
Centrelink 10.1 - - -
Department of Education, Science and Training 8.9 -0.6 -0.6 -
Department of Human Services 8.2 - - -
Total 172.3 35.0 35.6 -
Related revenue ($m)
Australian Taxation Office 0.5 3.0 4.6 5.0
Indigenous Business Australia 0.2 0.1 0.1 0.1
Total 0.7 3.1 4.7 5.1
Related capital ($m)
Centrelink 14.3 - - -
Indigenous Business Australia 4.2 - - -
Department of Employment and Workplace Relations 3.7 - - -
Total 22.2 - - -
The Government will provide $265.2 million over three years (partially offset by revenue of $13.7 million over four years) to expand the delivery of government services and enhance Indigenous employment opportunities in the Northern Territory.
The measure provides for the phased closure of Community Development Employment Projects (CDEP), with access to a range of income support and employment-related services to help people into ongoing employment. In addition, approximately 1,670 Indigenous Australians will be given real employment opportunities in services funded by the Australian Government through the conversion of current CDEP positions. The Australian Government will also negotiate with the Northern Territory Government to share the cost of up to 800 positions to be converted from CDEP placements to formal employment in the Northern Territory Government and local government.

Appendix A: Policy decisions taken since the 2007-08 Budget
131
The measure also provides for transition payments to former CDEP participants, with those payments eligible for the beneficiary tax offset. The conversion of some CDEP positions and transition to mainstream income support of other CDEP participants will mean that the overall amount of beneficiary tax offset claimed will be reduced. The combined impact of these changes will be a saving to revenue of $13.1 million over four years for the Australian Taxation Office.
Further, the measure provides for the accelerated removal of exemptions from participation requirements for income support recipients in remote areas in the Northern Territory. This will ensure job seekers participate in employment programmes, such as Structured Training and Employment Projects and Work for the Dole.
The Australian Government is also changing the way welfare is administered to ensure money meant for children’s welfare is used for that purpose. The measure will affect all people in prescribed communities who receive income support payments. For an initial period of twelve months, half of all income support and family assistance payments will be managed by Centrelink, so that money is spent on priority items such as food and rent in those communities.
Community stores in prescribed communities will be subject to a licensing system to ensure the stocking of affordable nutritious food, allow income-managed funds to be used to make purchases, ensure an appropriate level of service and to help prevent price exploitation.
This measure will provide funding for Centrelink of $66.0 million (including $14.3 million in capital funding) in 2007-08 to help implement these arrangements.
The measure includes $22.2 million in capital, primarily for office fit outs and enhancement of information and communication technology infrastructure. Separately, $13.5 million in capital will be provided to Indigenous Business Australia for new business loans, asset leases for small Indigenous businesses and interest-free loans to outback community stores. Business loans for small businesses totalling $2.5 million will generate $0.6 million over four years in interest revenue. The additional interest revenue is offset by the public debt interest costs incurred by the Australian Government in financing loans, which are accounted for separately. The provision of loans affects only the composition of the Australian Government’s financial assets and as such, the loan capital component of the measure has no impact on the fiscal balance.
Provision has been made in the Contingency Reserve for the continuation of various elements of this measure beyond 2007-08.
Further information can be found in the press release of 18 September 2007 issued by the Minister for Families, Community Services and Indigenous Affairs.

Appendix A: Policy decisions taken since the 2007-08 Budget
132
School attendance — enrolment data collection Expense ($m)
2007-08 2008-09 2009-10 2010-11
Department of Employment and Workplace Relations 27.8 - - -
Department of Veterans’ Affairs - - - -
Department of Families, Community Services and Indigenous Affairs nfp nfp nfp nfp
Total 27.8 - - -
Related capital ($m)
Centrelink 14.4 - - -
Department of Veterans’ Affairs - - - -
Total 14.4 - - -
The Government has made provision for $42.2 million in 2007-08 to implement the initial stage of welfare reforms which place an obligation on parents receiving welfare to provide appropriate care for their children and to ensure that they attend school.
This measure involves funding for the collection of comprehensive data from Australian schools on their student enrolments. The data collected will be used to ensure all school-aged children of welfare recipients are enrolled, and will be used to facilitate regular school attendance.
This measure is expected to include capital funding for Centrelink and the Department of Veterans’ Affairs for computer system enhancements.
Further information can be found in the press release of 14 July 2007 issued by the Minister for Families, Community Services and Indigenous Affairs.
Work for the Dole — increased access to full-time Work for the Dole Expense ($m)
2007-08 2008-09 2009-10 2010-11
Department of Employment and Workplace Relations 2.2 2.2 2.2 2.2
The Government will expand the eligibility criteria for full-time Work for the Dole at an estimated cost of $8.7 million over four years.
This measure builds on the 2005-06 Budget measure, Welfare to Work – increasing participation of the very long term unemployed, by expanding access to all job seekers who remain unemployed after completing a second round of Intensive Support customised assistance and who would benefit from a referral to full-time Work for the Dole.
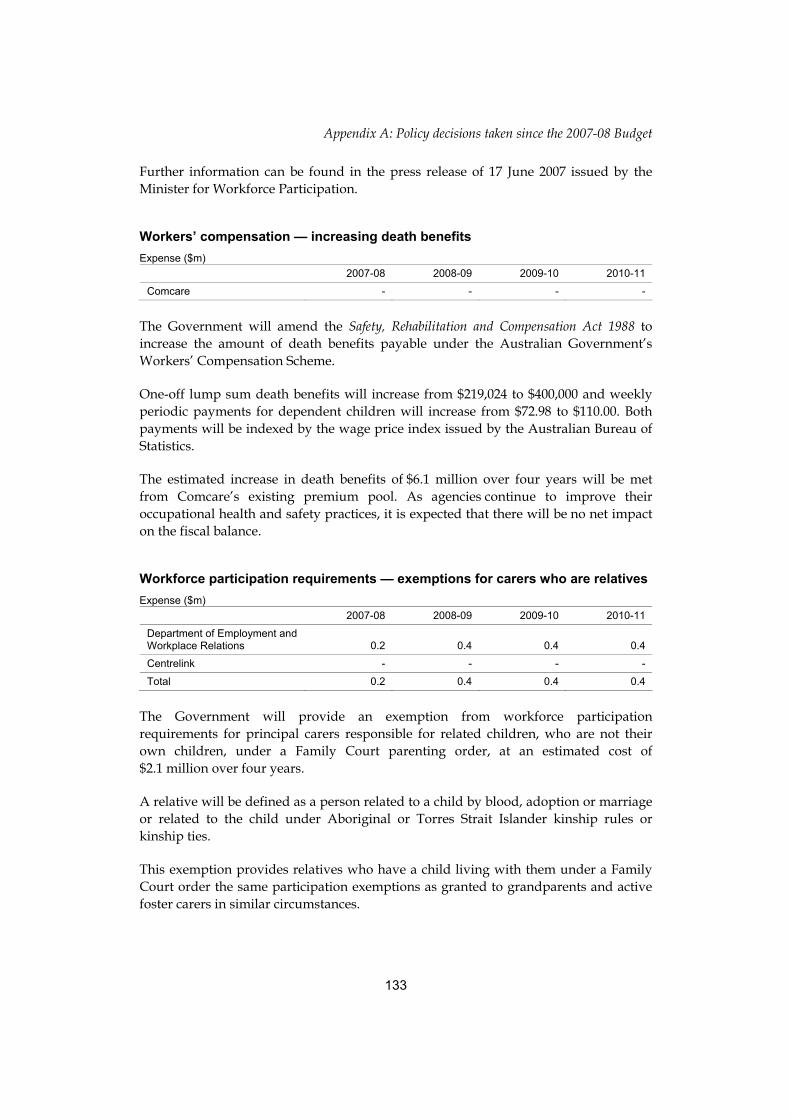
Appendix A: Policy decisions taken since the 2007-08 Budget
133
Further information can be found in the press release of 17 June 2007 issued by the Minister for Workforce Participation.
Workers’ compensation — increasing death benefits Expense ($m)
2007-08 2008-09 2009-10 2010-11
Comcare - - - -
The Government will amend the Safety, Rehabilitation and Compensation Act 1988 to increase the amount of death benefits payable under the Australian Government’s Workers’ Compensation Scheme.
One-off lump sum death benefits will increase from $219,024 to $400,000 and weekly periodic payments for dependent children will increase from $72.98 to $110.00. Both payments will be indexed by the wage price index issued by the Australian Bureau of Statistics.
The estimated increase in death benefits of $6.1 million over four years will be met from Comcare’s existing premium pool. As agencies continue to improve their occupational health and safety practices, it is expected that there will be no net impact on the fiscal balance.
Workforce participation requirements — exemptions for carers who are relatives Expense ($m)
2007-08 2008-09 2009-10 2010-11
Department of Employment and Workplace Relations 0.2 0.4 0.4 0.4
Centrelink - - - -
Total 0.2 0.4 0.4 0.4
The Government will provide an exemption from workforce participation requirements for principal carers responsible for related children, who are not their own children, under a Family Court parenting order, at an estimated cost of $2.1 million over four years.
A relative will be defined as a person related to a child by blood, adoption or marriage or related to the child under Aboriginal or Torres Strait Islander kinship rules or kinship ties.
This exemption provides relatives who have a child living with them under a Family Court order the same participation exemptions as granted to grandparents and active foster carers in similar circumstances.

Appendix A: Policy decisions taken since the 2007-08 Budget
134
Part of the cost of this measure ($0.5 million in 2007-08 and $0.1 million per annum over the following three years) will be met from within the existing resourcing of Centrelink.
Workplace Relations Reform — communication campaign Expense ($m)
2007-08 2008-09 2009-10 2010-11
Department of Employment and Workplace Relations 61.0 - - -
Office of the Workplace Ombudsman -7.2 -3.0 -3.0 -
Total 53.8 -3.0 -3.0 -
The Government will provide $66.0 million (including $5.0 million in 2006-07) to raise public awareness of the Fairness Test and the services provided by the Workplace Authority and the Office of the Workplace Ombudsman.
The communication campaign will educate the public about the Fairness Test and will outline the workplace relations protections available to employees and how to access additional information and assistance.
The cost of this measure is partially offset by savings of $20.4 million over four years (including $7.2 million in 2006-07) from funding previously allocated to raise public awareness of the services of the former Office of Workplace Services and the former Office of the Employment Advocate, which were abolished on 1 July 2007.
See also the related expense measures titled Workplace Relations Reform in the Employment and Workplace Relations portfolio.
Further information can be found in the press releases of 19 May 2007 and 24 September 2007 issued by the Minister for Employment and Workplace Relations.
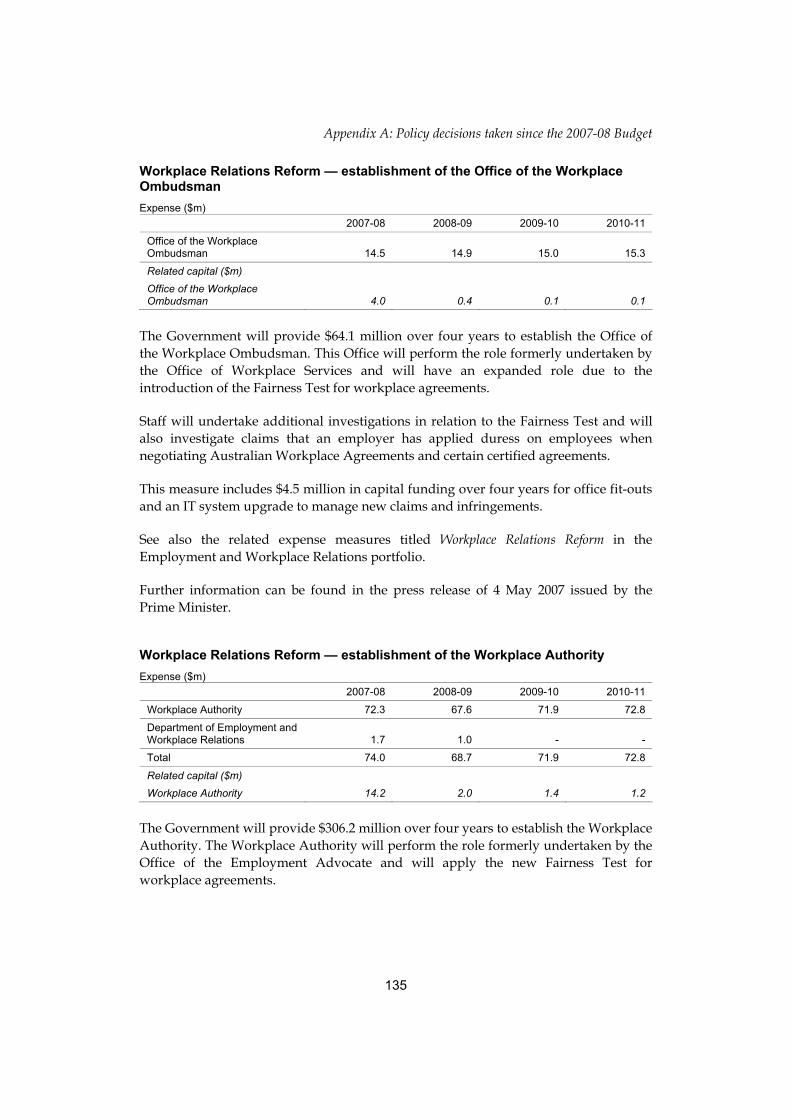
Appendix A: Policy decisions taken since the 2007-08 Budget
135
Workplace Relations Reform — establishment of the Office of the Workplace Ombudsman Expense ($m)
2007-08 2008-09 2009-10 2010-11
Office of the Workplace Ombudsman 14.5 14.9 15.0 15.3
Related capital ($m)
Office of the Workplace Ombudsman 4.0 0.4 0.1 0.1
The Government will provide $64.1 million over four years to establish the Office of the Workplace Ombudsman. This Office will perform the role formerly undertaken by the Office of Workplace Services and will have an expanded role due to the introduction of the Fairness Test for workplace agreements.
Staff will undertake additional investigations in relation to the Fairness Test and will also investigate claims that an employer has applied duress on employees when negotiating Australian Workplace Agreements and certain certified agreements.
This measure includes $4.5 million in capital funding over four years for office fit-outs and an IT system upgrade to manage new claims and infringements.
See also the related expense measures titled Workplace Relations Reform in the Employment and Workplace Relations portfolio.
Further information can be found in the press release of 4 May 2007 issued by the Prime Minister.
Workplace Relations Reform — establishment of the Workplace Authority Expense ($m)
2007-08 2008-09 2009-10 2010-11
Workplace Authority 72.3 67.6 71.9 72.8
Department of Employment and Workplace Relations 1.7 1.0 - -
Total 74.0 68.7 71.9 72.8
Related capital ($m)
Workplace Authority 14.2 2.0 1.4 1.2
The Government will provide $306.2 million over four years to establish the Workplace Authority. The Workplace Authority will perform the role formerly undertaken by the Office of the Employment Advocate and will apply the new Fairness Test for workplace agreements.

Appendix A: Policy decisions taken since the 2007-08 Budget
136
In addition to administering the Fairness Test, the Workplace Authority will undertake pre-lodgement assessments of both Australian Workplace Agreements and Collective Agreements and provide a comprehensive information and education service about pay and conditions to help employers and employees better understand the workplace relations system.
This measure includes $18.9 million in capital funding over four years for office fit-outs and IT system upgrades to manage the administration of the Fairness Test. The funding also includes $2.7 million over two years for the Department of Employment and Workplace Relations to provide implementation support in relation to the Fairness Test.
See also the related expense measures titled Workplace Relations Reform in the Employment and Workplace Relations Portfolio.
Further information can be found in the press release of 4 May 2007 issued by the Prime Minister.

Appendix A: Policy decisions taken since the 2007-08 Budget
137
ENVIRONMENT AND WATER RESOURCES
Achieving Sustainable Groundwater Entitlements — additional funding Expense ($m)
2007-08 2008-09 2009-10 2010-11
National Water Commission 25.0 - - -
The Government will provide an additional $25.0 million in 2007-08 to assist groundwater licence holders in New South Wales to adjust to reductions in their water access entitlements.
This measure builds on the Government’s initial $55 million contribution to the Achieving Sustainable Groundwater Entitlements package, which was announced by the Prime Minister on 9 June 2005.
Further information can be found in the joint press release of 8 June 2007 issued by the Deputy Prime Minister and the Minister for the Environment and Water Resources.
Climate change — Green Vouchers for schools Expense ($m)
2007-08 2008-09 2009-10 2010-11
Department of the Environment and Water Resources 101.5 149.1 51.3 34.3
The Government will provide $336.1 million over four years for rebates to encourage improved energy and water efficiency in schools.
All Australian primary and secondary schools will be eligible to receive funding of up to $50,000 to install a solar hot water system and/or a rainwater tank of greater than 10,000 litres capacity.
Schools that have previously received Australian Government funding to install a rainwater tank will have that amount deducted from the $50,000 grant.
Further information can be found in the press release of 17 July 2007 issued by the Minister for the Environment and Water Resources.

Appendix A: Policy decisions taken since the 2007-08 Budget
138
Climate change — national clean energy target Expense ($m)
2007-08 2008-09 2009-10 2010-11
Office of the Renewable Energy Regulator 0.5 1.3 1.7 2.2
Related capital ($m)
Office of the Renewable Energy Regulator - 3.3 1.1 -
The Government has made provision for $12.3 million over five years (including $2.2 million in 2011-12) for the Office of the Renewable Energy Regulator to administer the national clean energy target of 30,000 gigawatt hours of electricity each year to be generated from low emissions sources by 2020. The target is in addition to a baseline level of renewable energy generation estimated to be around 16,000 gigawatt hours annually.
The provision includes $4.4 million in capital funding to modify and expand the capacity of the renewable energy certificate online register.
The final costs of administering the target will be determined once the details of the scheme are settled, in consultation with state and territory governments and industry.
The clean energy target is expected to come into effect no later than 1 January 2010.
Further information can be found in the press release of 23 September 2007 issued by the Prime Minister.
Climate change — solar hot water systems — rebates for households Expense ($m)
2007-08 2008-09 2009-10 2010-11
Department of the Environment and Water Resources 31.8 40.3 50.0 65.0
The Government will provide $252.2 million over five years (including $65.1 million in 2011-12) to provide rebates to households to encourage improved energy efficiency in homes.
Up to 225,000 eligible households will be able to access rebates of $1,000 for solar and heat pump hot water systems installed on or after 18 July 2007 that replace electric storage hot water systems in established homes.
To be eligible for a rebate, the applicant’s taxable income must be less than $100,000, and the solar hot water system must be installed in the principal place of residence.
Further information can be found in the press release of 17 July 2007 issued by the Minister for the Environment and Water Resources.
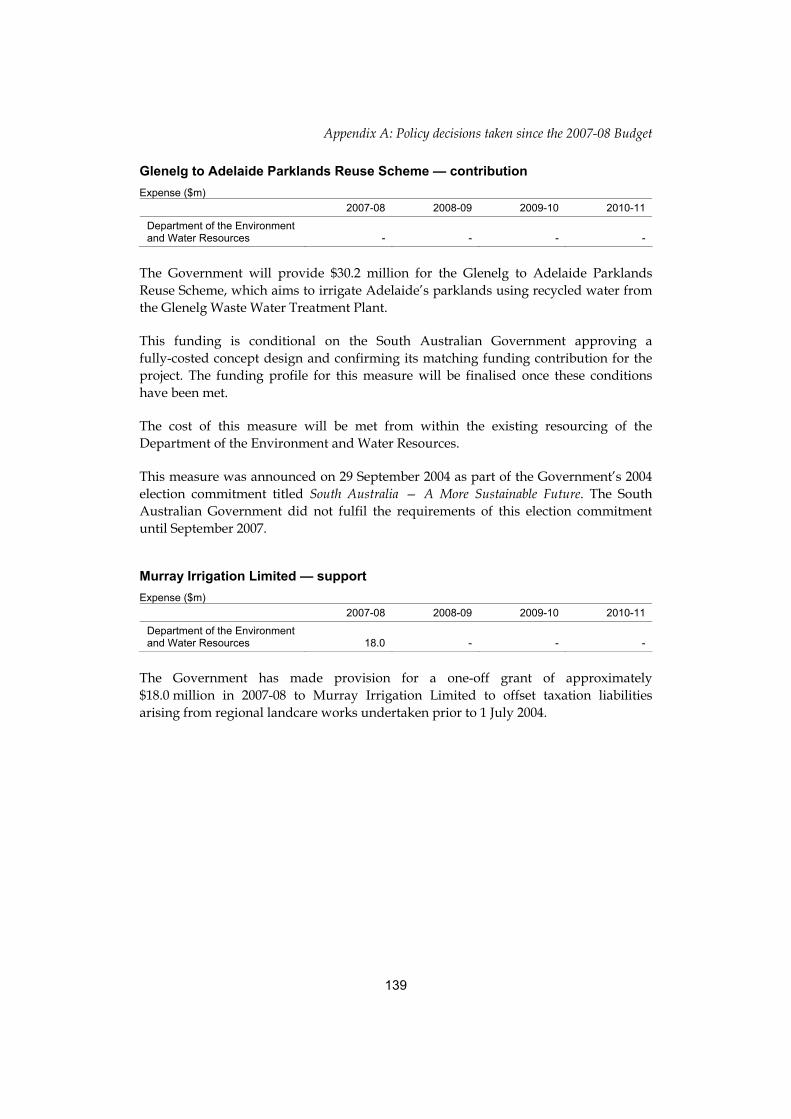
Appendix A: Policy decisions taken since the 2007-08 Budget
139
Glenelg to Adelaide Parklands Reuse Scheme — contribution Expense ($m)
2007-08 2008-09 2009-10 2010-11
Department of the Environment and Water Resources - - - -
The Government will provide $30.2 million for the Glenelg to Adelaide Parklands Reuse Scheme, which aims to irrigate Adelaide’s parklands using recycled water from the Glenelg Waste Water Treatment Plant.
This funding is conditional on the South Australian Government approving a fully-costed concept design and confirming its matching funding contribution for the project. The funding profile for this measure will be finalised once these conditions have been met.
The cost of this measure will be met from within the existing resourcing of the Department of the Environment and Water Resources.
This measure was announced on 29 September 2004 as part of the Government’s 2004 election commitment titled South Australia — A More Sustainable Future. The South Australian Government did not fulfil the requirements of this election commitment until September 2007.
Murray Irrigation Limited — support Expense ($m)
2007-08 2008-09 2009-10 2010-11
Department of the Environment and Water Resources 18.0 - - -
The Government has made provision for a one-off grant of approximately $18.0 million in 2007-08 to Murray Irrigation Limited to offset taxation liabilities arising from regional landcare works undertaken prior to 1 July 2004.

Appendix A: Policy decisions taken since the 2007-08 Budget
140
National greenhouse gas emissions and energy reporting system — establishment Expense ($m)
2007-08 2008-09 2009-10 2010-11
Department of the Environment and Water Resources - - - -
Related capital ($m)
Department of the Environment and Water Resources - - - -
The Government will provide $24.4 million over five years to establish a single, streamlined system to report easily accessible, nationally consistent data at the company level to investors and the general public on greenhouse gas emissions and energy use by Australia’s major companies. The system is expected to be in place by July 2008.
This measure includes expense funding of $2.7 million in 2007-08, $3.7 million in 2008-09, $4.5 million in 2009-10, $5.2 million in 2010-11 and $5.1 million in 2011-12. It also includes capital funding of $2.0 million in 2007-08, $1.0 million in 2008-09, $0.1 million in 2009-10 and $0.1 million in 2010-11 for the development of an online reporting tool.
Provision for this funding has already been included in the forward estimates.
Further information can be found in the press release of 17 July 2007 issued by the Minister for the Environment and Water Resources.
National Plan for Water Security — modernising irrigation in Australia Expense ($m)
2007-08 2008-09 2009-10 2010-11
Department of the Environment and Water Resources - - 200.0 -300.0
The Government has decided to bring forward $200.0 million of funding from 2010-11 to 2009-10, under the $5.9 billion Modernising Irrigation in Australia component of the $10 billion National Plan for Water Security, to accelerate expenditure on works to improve water use efficiency.
In addition, the Government has decided to defer funding of $100.0 million from 2010-11 to beyond 2010-11 to provide for contingencies expected later in the programme.
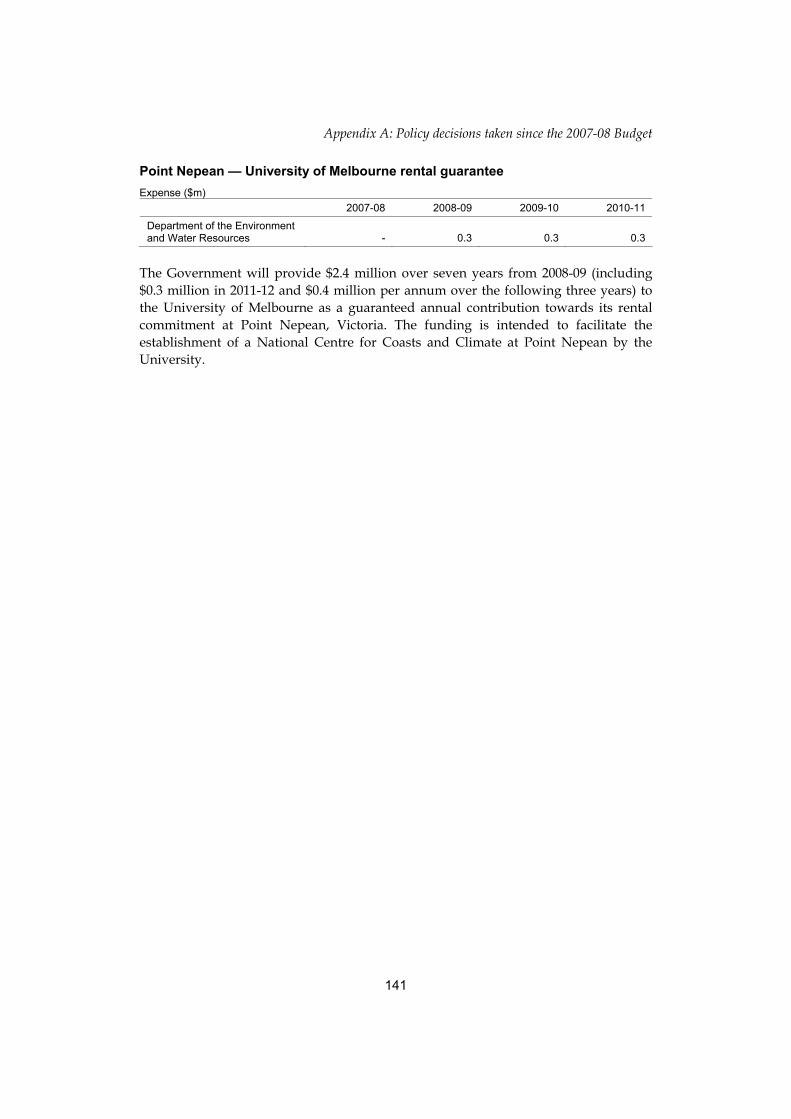
Appendix A: Policy decisions taken since the 2007-08 Budget
141
Point Nepean — University of Melbourne rental guarantee Expense ($m)
2007-08 2008-09 2009-10 2010-11
Department of the Environment and Water Resources - 0.3 0.3 0.3
The Government will provide $2.4 million over seven years from 2008-09 (including $0.3 million in 2011-12 and $0.4 million per annum over the following three years) to the University of Melbourne as a guaranteed annual contribution towards its rental commitment at Point Nepean, Victoria. The funding is intended to facilitate the establishment of a National Centre for Coasts and Climate at Point Nepean by the University.

Appendix A: Policy decisions taken since the 2007-08 Budget
142
FAMILIES, COMMUNITY SERVICES AND INDIGENOUS AFFAIRS
Aboriginal Employment Strategy — reconciliation and youth activities Expense ($m)
2007-08 2008-09 2009-10 2010-11
Department of Families, Community Services and Indigenous Affairs - - - -
The Government will provide $5.5 million over three years to fund additional activities to be undertaken by Aboriginal Employment Strategy Ltd. Aboriginal Employment Strategy Ltd is a not-for-profit organisation that works to encourage the private sector to engage with Aboriginal people. The funding will support three main elements:
• Practical Reconciliation — fostering engagement between Aboriginal and non-Aboriginal people in partnership with the private sector, including through cultural education for employees, Aboriginal volunteering placements and practical reconciliation events;
• The Aboriginal Youth Entrepreneurial Programme — encouraging Aboriginal youth to be introduced to the working economy through work placements and traineeships; and
• The Ambassador Programme — addressing anti-social behaviour and alcohol-related crime and violence including through the employment of respected individuals to work with children and youth in the streets to minimise anti-social behaviour after school hours and at night.
The cost of this measure will be met from within the existing resourcing of the Department of Families, Community Services and Indigenous Affairs.

Appendix A: Policy decisions taken since the 2007-08 Budget
143
Centrelink — further call centre supplementation Expense ($m)
2007-08 2008-09 2009-10 2010-11
Department of Families, Community Services and Indigenous Affairs 3.3 - - -
Department of Employment and Workplace Relations 1.3 - - -
Department of Education, Science and Training 0.5 - - -
Total 5.0 - - -
The Government will provide an additional $5.0 million in 2007-08 to ensure Centrelink is able to better meet peaks in demand arising from clients making increased use of call centres and a trend towards longer and more complex calls.
Funding under this measure will be provided through policy departments for call centre services to be delivered by Centrelink, with the majority of funding provided to the Department of Families, Community Services and Indigenous Affairs to improve the Government’s capacity to efficiently and effectively offer telephone-based services to families.
The measure continues the 2004-05 Budget measure Centrelink – call centre supplementation, which provided funding of $67.4 million over three years and was expanded in the 2006-07 Budget with an additional $115.0 million over two years.
Channel 7 Telethon Trust — contribution Expense ($m)
2007-08 2008-09 2009-10 2010-11
Department of Families, Community Services and Indigenous Affairs 0.5 - - -
The Government will provide $0.5 million in 2007-08 to the Channel 7 Telethon Trust in Western Australia to contribute to capital works projects of the Telethon Speech and Hearing Centre and the Teen Challenge Charity. The funding will assist children with speech, language or hearing impairments and people aged 16 years and over with drug and alcohol dependence problems.

Appendix A: Policy decisions taken since the 2007-08 Budget
144
Children with autism spectrum disorders — support for families and carers Expense ($m)
2007-08 2008-09 2009-10 2010-11
Department of Families, Community Services and Indigenous Affairs 5.7 29.4 37.0 36.4
Department of Education, Science and Training 3.5 5.7 5.5 5.6
Department of Health and Ageing 0.6 5.9 5.6 3.7
Medicare Australia 0.2 0.2 0.3 0.2
Total 9.9 41.2 48.3 45.9
The Government will provide $145.4 million over four years to provide support to children with autism spectrum disorders (ASD) and their families and carers.
This includes funding of $85.9 million over four years to support up to 15,000 families with children aged 0-6 years with ASD to access early intervention services. This will include funding for playgroups, group programmes and individual assistance, with the intensity of support tailored to the needs of each child. Autism advisors will also be funded to assist parents to find appropriate services for the particular needs of their child.
This measure includes funding of $22.5 million over four years for service providers to develop and deliver education, training and support to families of children with ASD in the post-diagnosis stages. It also includes funding of $20.3 million over four years to provide professional development for teachers and workshops and information sessions for parents and carers who support school-aged children with ASD.
This measure will also provide $16.6 million over four years to introduce new Medicare Benefits Schedule (MBS) items for diagnosis and treatment options for children. These items will allow paediatricians or psychiatrists to assess needs and develop intensive treatment programmes accordingly. Access to up to 20 new MBS services from a range of allied health professionals will also be available.
Further information can be found in the press releases of 3 October 2007 issued by the Prime Minister and Minister for Families, Community Services and Indigenous Affairs.

Appendix A: Policy decisions taken since the 2007-08 Budget
145
Daughters of Charity — funding Expense ($m)
2007-08 2008-09 2009-10 2010-11
Department of Families, Community Services and Indigenous Affairs 2.5 - - -
The Government will provide $2.5 million in 2007-08 to the Daughters of Charity appeal for the establishment of a new building in Fitzroy, Victoria, and associated costs. The Daughters of Charity undertake work in support of vulnerable members of the community, including through drug and alcohol counselling, assistance for homeless women and psychiatric disability rehabilitation services.
Disability assistance — support for people with disabilities, their families and carers Expense ($m)
2007-08 2008-09 2009-10 2010-11
Department of Families, Community Services and Indigenous Affairs 222.8 281.5 345.1 425.5
Related revenue ($m)
Australian Taxation Office - - - -
Related capital ($m)
Department of Families, Community Services and Indigenous Affairs 2.5 - - 0.4
Centrelink 0.1 - - -
Total 2.6 - - 0.4
The Government will provide $1.8 billion over five years (including $548.6 million in 2011-12) to assist people with disabilities, their families and carers.
The package of assistance includes funding of:
• $721.2 million over five years to provide carers with an annual tax-free payment of $1,000 for each child under the age of 16 with a disability for whom the carer is receiving Carer Allowance (Child), to assist with the purchase of items that improve the quality of life of children with a disability, their families and carers;
• $948.2 million over five years to fund accommodation support services to assist parent carers aged 65 or more, including: a new Australian Government-supported accommodation service ($562.6 million over five years); additional in-home and centre-based respite services ($270.3 million over five years); and a new in-home support service for people with a disability ($115.3 million over five years);

Appendix A: Policy decisions taken since the 2007-08 Budget
146
• $23.6 million over five years for specialist services for children with a disability targeted at areas of high need; and
• $13.8 million over five years to help older carers and their adult children to plan their future care needs.
To address longer-term needs, the Government will provide $1.5 million to establish an inquiry to explore ways to provide greater choice and flexibility in the delivery of supported accommodation.
In addition, the Government will provide $113.3 million over five years to ensure support is available to people in disability business services. This includes increasing the base funding for disability business services ($26.9 million over five years) and providing 750 additional supported employment places ($33.7 million over five years); temporary assistance to disability business services that suffer short-term financial difficulties in rural and regional areas ($21.8 million over five years); and continuing support for people participating in non-vocational activities ($30.9 million over five years).
This measure includes funding for Centrelink of $9.4 million in 2007-08, $2.9 million in 2008-09, $2.7 million in 2009-10, and $2.6 million per annum from 2010-11 to 2011-12.
This measure also includes capital funding of $2.6 million in 2007-08 and $0.4 million in 2010-11 for office fit-out.
Further information can be found in the press release of 28 June 2007 issued by the Prime Minister.
Disaster relief funding — Hunter, Central Coast and Gippsland regions Expense ($m)
2007-08 2008-09 2009-10 2010-11
Department of Families, Community Services and Indigenous Affairs 24.7 0.2 - -
The Government will provide $36.3 million over three years (including $11.4 million in 2006-07) under the Australian Government Disaster Recovery Payment programme to assist people affected by the June 2007 floods in the Central Coast and Hunter regions of New South Wales and the Gippsland region of Victoria. This measure involves funding for Centrelink of $5.7 million in 2007-08 and $0.2 million in 2008-09.
Payments of $1,000 per eligible adult and $400 per eligible child will be made available to people who, as a direct result of the flooding, were seriously injured and required hospitalisation for at least 48 hours or whose principal place of residence was destroyed or rendered uninhabitable for a period of 48 hours or more.

Appendix A: Policy decisions taken since the 2007-08 Budget
147
Further information can be found in the press releases of 10 June, 14 June and 29 June 2007 issued by the Prime Minister.
Drought Package 2007 — additional funding for the Emergency Relief Program Expense ($m)
2007-08 2008-09 2009-10 2010-11
Department of Families, Community Services and Indigenous Affairs 1.5 3.0 - -
The Government will provide additional funding of $4.5 million over two years for the Emergency Relief Program to assist community and charitable organisations to deliver additional assistance to individuals, rural families and communities in areas affected by the drought. Assistance may include: vouchers for food, pharmaceuticals and petrol; assistance with rent or accommodation; part payment of utility accounts; and assistance such as food parcels or clothing.
Further information can be found in the press release of 25 September 2007 issued by the Prime Minister.
Foodbank SA — financial assistance Expense ($m)
2007-08 2008-09 2009-10 2010-11
Department of Families, Community Services and Indigenous Affairs 0.1 0.1 - -
The Government will provide $0.2 million over two years to Foodbank SA to provide food to a network of welfare agencies in both metropolitan and rural South Australia. Foodbank SA sources donations from the food and grocery industry and supplies this food to welfare agencies for use in their food relief programmes.
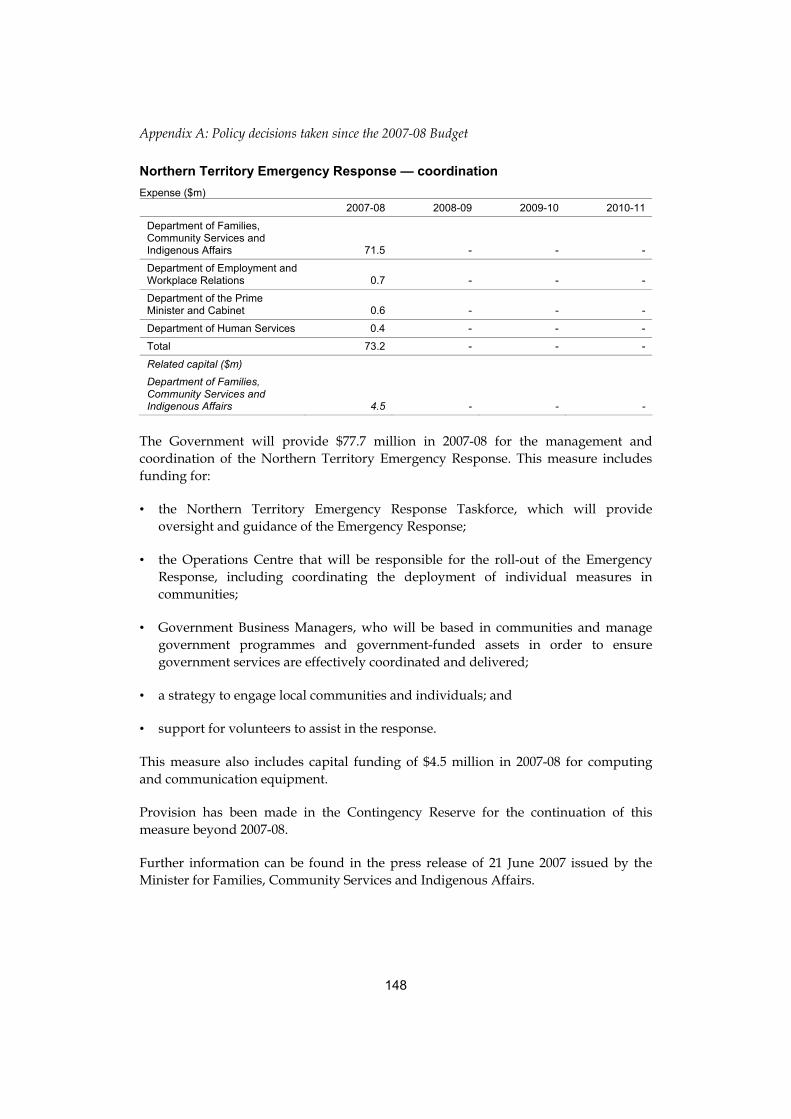
Appendix A: Policy decisions taken since the 2007-08 Budget
148
Northern Territory Emergency Response — coordination Expense ($m)
2007-08 2008-09 2009-10 2010-11
Department of Families, Community Services and Indigenous Affairs 71.5 - - -
Department of Employment and Workplace Relations 0.7 - - -
Department of the Prime Minister and Cabinet 0.6 - - -
Department of Human Services 0.4 - - -
Total 73.2 - - -
Related capital ($m)
Department of Families, Community Services and Indigenous Affairs 4.5 - - -
The Government will provide $77.7 million in 2007-08 for the management and coordination of the Northern Territory Emergency Response. This measure includes funding for:
• the Northern Territory Emergency Response Taskforce, which will provide oversight and guidance of the Emergency Response;
• the Operations Centre that will be responsible for the roll-out of the Emergency Response, including coordinating the deployment of individual measures in communities;
• Government Business Managers, who will be based in communities and manage government programmes and government-funded assets in order to ensure government services are effectively coordinated and delivered;
• a strategy to engage local communities and individuals; and
• support for volunteers to assist in the response.
This measure also includes capital funding of $4.5 million in 2007-08 for computing and communication equipment.
Provision has been made in the Contingency Reserve for the continuation of this measure beyond 2007-08.
Further information can be found in the press release of 21 June 2007 issued by the Minister for Families, Community Services and Indigenous Affairs.

Appendix A: Policy decisions taken since the 2007-08 Budget
149
Northern Territory Emergency Response — housing and land reform Expense ($m)
2007-08 2008-09 2009-10 2010-11
Department of Families, Community Services and Indigenous Affairs 49.2 - - -
Related capital ($m)
Department of Families, Community Services and Indigenous Affairs 29.9 - - -
The Government will provide $79.1 million in 2007-08 to address housing, land and infrastructure issues in 73 Indigenous communities in the Northern Territory.
This will include: providing new serviced blocks for housing associated with the Northern Territory Emergency Response; upgrading essential infrastructure systems, such as power, water and sewerage; and the provision of basic short-term accommodation for staff for the first 12 months of the Emergency Response.
The Government will also acquire townships prescribed by the Australian Government through five-year leases. A provision for funding of compensation for this acquisition has been included in the Contingency Reserve as these amounts are yet to be negotiated and are not included in the funding shown above.
Further information can be found in the press release of 21 June 2007 issued by the Minister for Families, Community Services and Indigenous Affairs.

Appendix A: Policy decisions taken since the 2007-08 Budget
150
Northern Territory Emergency Response — promoting law and order Expense ($m)
2007-08 2008-09 2009-10 2010-11
Department of Families, Community Services and Indigenous Affairs 25.6 - - -
Department of Defence 15.5 - - -
Attorney-General’s Department 11.0 - - -
Australian Federal Police 7.4 9.2 9.3 -
Australian Crime Commission 4.0 - - -
Office of the Commonwealth Ombudsman 0.2 - - -
Total 63.8 9.2 9.3 -
Related capital ($m)
Australian Crime Commission 0.7 - - -
Office of the Commonwealth Ombudsman 0.1 - - -
Total 0.9 - - -
The Government will provide $83.1 million over three years to implement a range of law and order activities as part of the Northern Territory Emergency Response.
This measure includes funding:
• to provide additional police stations and police housing; support for activities associated with changes to the alcohol and pornography laws in the Northern Territory, including licensing, non-police enforcement, computer review and education costs; and Aboriginal Community Liaison Officers to act as links between police forces and the local Indigenous communities;
• to expand existing Northern Territory night patrol activities to improve safety and assist people at risk; for additional Aboriginal Interpreter Services to meet an expected increase in demand resulting from the response; and for additional legal practitioners and support staff for a number of legal aid programmes which provide assistance to Indigenous Australians;
• for the deployment of 66 police personnel to the Northern Territory in 2007-08 sourced from the Australian Federal Police and State police forces. For 2008-09 and 2009-10 the 66 police personnel will be sourced from the Australian Federal Police;
• for the collection of intelligence that identifies incidences of child sexual abuse, and offenders, in order to assist police investigations across Australia;
• for logistical support services including vehicular and airborne transport, communications, temporary accommodation and contracting support; and

Appendix A: Policy decisions taken since the 2007-08 Budget
151
• to develop and support complaint-handling procedures for Commonwealth agencies delivering Emergency Response services.
This measure also includes $0.9 million in capital funding in 2007-08 for computer and communications equipment.
Provision has been made in the Contingency Reserve for the continuation of various elements of this measure beyond 2007-08.
Further information can be found in the press release of 21 June 2007 issued by the Minister for Families, Community Services and Indigenous Affairs.
Northern Territory Emergency Response — supporting families Expense ($m)
2007-08 2008-09 2009-10 2010-11
Department of Families, Community Services and Indigenous Affairs 32.8 - - -
The Government will provide $32.8 million in 2007-08 as part of the Northern Territory Emergency Response to increase the provision of family and children’s services within Indigenous communities.
This funding will establish ‘safe places’ (emergency and transitional accommodation) within Indigenous communities and major towns in the Northern Territory to provide immediate assistance to families suffering family violence. Funding will also be provided to employ additional child protection and community liaison workers to address the safety needs of children within Indigenous communities.
In addition, this measure will support Indigenous children and their families by providing funding to:
• expand existing child care services in major towns;
• expand existing government-funded early childhood services;
• upgrade existing and establish further creches; and
• expand Indigenous playgroups.
Funding will also be provided to establish three outreach-based services offering a range of alcohol diversionary activities for young people in remote communities.
Provision has been made in the Contingency Reserve for the continuation of this measure beyond 2007-08.
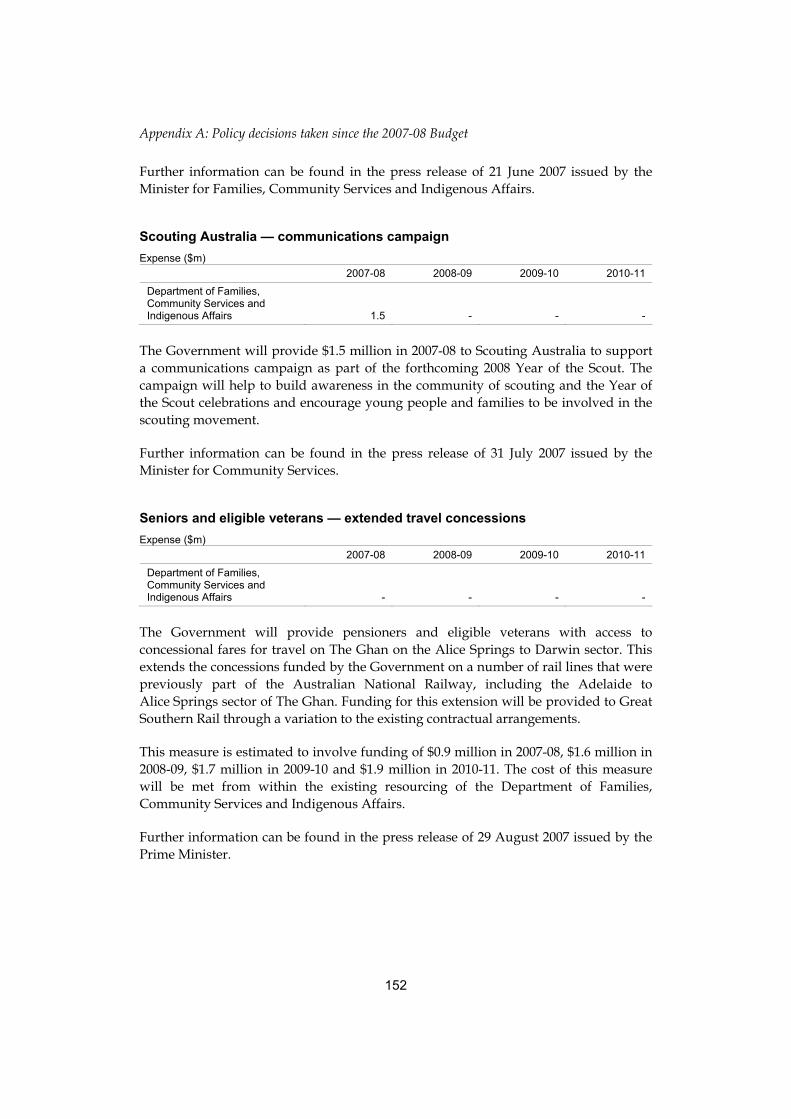
Appendix A: Policy decisions taken since the 2007-08 Budget
152
Further information can be found in the press release of 21 June 2007 issued by the Minister for Families, Community Services and Indigenous Affairs.
Scouting Australia — communications campaign Expense ($m)
2007-08 2008-09 2009-10 2010-11
Department of Families, Community Services and Indigenous Affairs 1.5 - - -
The Government will provide $1.5 million in 2007-08 to Scouting Australia to support a communications campaign as part of the forthcoming 2008 Year of the Scout. The campaign will help to build awareness in the community of scouting and the Year of the Scout celebrations and encourage young people and families to be involved in the scouting movement.
Further information can be found in the press release of 31 July 2007 issued by the Minister for Community Services.
Seniors and eligible veterans — extended travel concessions Expense ($m)
2007-08 2008-09 2009-10 2010-11
Department of Families, Community Services and Indigenous Affairs - - - -
The Government will provide pensioners and eligible veterans with access to concessional fares for travel on The Ghan on the Alice Springs to Darwin sector. This extends the concessions funded by the Government on a number of rail lines that were previously part of the Australian National Railway, including the Adelaide to Alice Springs sector of The Ghan. Funding for this extension will be provided to Great Southern Rail through a variation to the existing contractual arrangements.
This measure is estimated to involve funding of $0.9 million in 2007-08, $1.6 million in 2008-09, $1.7 million in 2009-10 and $1.9 million in 2010-11. The cost of this measure will be met from within the existing resourcing of the Department of Families, Community Services and Indigenous Affairs.
Further information can be found in the press release of 29 August 2007 issued by the Prime Minister.

Appendix A: Policy decisions taken since the 2007-08 Budget
153
Social security agreement between Australia and Greece Expense ($m)
2007-08 2008-09 2009-10 2010-11
Department of Families, Community Services and Indigenous Affairs - - - -
The Government will provide $165.2 million over four years to extend the current network of reciprocal social security agreements to include Greece. Upon taking effect, the agreement will enable former Australian residents living in Greece and Greek Australians living in Australia to claim their entitlement to a pension from either or both countries when they meet relevant eligibility requirements. Australia and Greece will share responsibility and costs for the social security coverage of eligible age pensioners according to their period of residence in Australia and/or their period of insurance in Greece. It is expected that the agreement will take effect during 2008 following completion of the necessary treaty, administrative and legislative processes in both countries.
This measure includes funding for Centrelink of $1.0 million in 2007-08, $7.5 million in 2008-09, $6.7 million in 2009-10 and $5.7 million in 2010-11 to process additional claims and implement system changes.
This measure involves funding of $1.1 million in 2007-08, $34.9 million in 2008-09, $63.9 million in 2009-10 and $65.3 million in 2010-11. Provision for this funding has already been included in the forward estimates.
Further information can be found in the press release of 23 May 2007 issued by the Prime Minister.
Sydney Christmas Parade — contribution Expense ($m)
2007-08 2008-09 2009-10 2010-11
Department of Families, Community Services and Indigenous Affairs - - - -
The Government will provide $1.0 million in 2007-08 to the Sydney Christmas Parade Trust to support the inaugural Sydney Christmas Parade 2007. The parade aims to strengthen the sense of community by bringing people together to celebrate the holiday season.
The cost of this measure will be met from within the existing resourcing of the Department of Families, Community Services and Indigenous Affairs.
Further information can be found in the press release of 30 September 2007 issued by the Prime Minister.
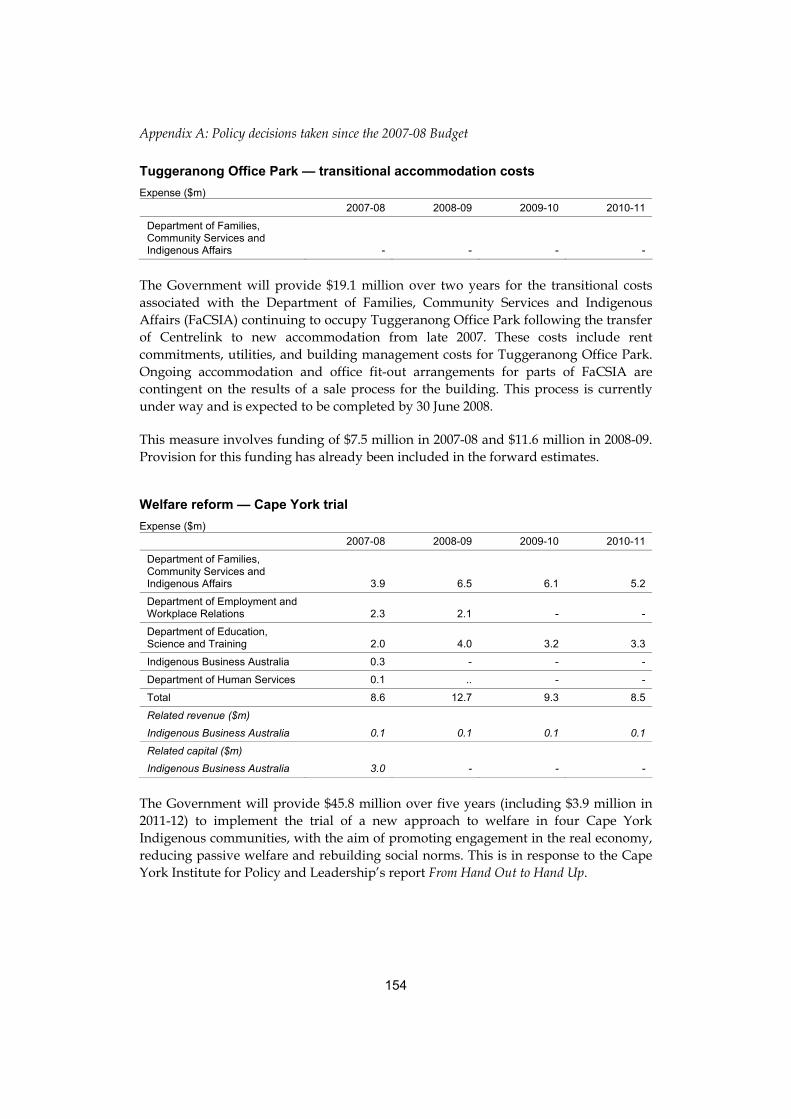
Appendix A: Policy decisions taken since the 2007-08 Budget
154
Tuggeranong Office Park — transitional accommodation costs Expense ($m)
2007-08 2008-09 2009-10 2010-11
Department of Families, Community Services and Indigenous Affairs - - - -
The Government will provide $19.1 million over two years for the transitional costs associated with the Department of Families, Community Services and Indigenous Affairs (FaCSIA) continuing to occupy Tuggeranong Office Park following the transfer of Centrelink to new accommodation from late 2007. These costs include rent commitments, utilities, and building management costs for Tuggeranong Office Park. Ongoing accommodation and office fit-out arrangements for parts of FaCSIA are contingent on the results of a sale process for the building. This process is currently under way and is expected to be completed by 30 June 2008.
This measure involves funding of $7.5 million in 2007-08 and $11.6 million in 2008-09. Provision for this funding has already been included in the forward estimates.
Welfare reform — Cape York trial Expense ($m)
2007-08 2008-09 2009-10 2010-11
Department of Families, Community Services and Indigenous Affairs 3.9 6.5 6.1 5.2
Department of Employment and Workplace Relations 2.3 2.1 - -
Department of Education, Science and Training 2.0 4.0 3.2 3.3
Indigenous Business Australia 0.3 - - -
Department of Human Services 0.1 .. - -
Total 8.6 12.7 9.3 8.5
Related revenue ($m)
Indigenous Business Australia 0.1 0.1 0.1 0.1
Related capital ($m)
Indigenous Business Australia 3.0 - - -
The Government will provide $45.8 million over five years (including $3.9 million in 2011-12) to implement the trial of a new approach to welfare in four Cape York Indigenous communities, with the aim of promoting engagement in the real economy, reducing passive welfare and rebuilding social norms. This is in response to the Cape York Institute for Policy and Leadership’s report From Hand Out to Hand Up.

Appendix A: Policy decisions taken since the 2007-08 Budget
155
The funding will be used to support a range of initiatives, including income and case management of welfare recipients not meeting defined obligations in relation to their children and other agreed community obligations; associated support services; investment in education, including extending opportunities for children to study away from home; and business development to support self-employment and small business activities.
Funding is also included for reforms to housing management with incentives for people to contribute to and maintain improvements in housing, and to meet rent and other tenancy obligations. In addition, funding of up to $2.3 million will be made available for 40 Australian Government jobs in service delivery that will be created by converting existing Community Development Employment Projects Programme positions into ongoing jobs.
This measure includes $3.0 million in capital funding to establish a business precinct.
The revenue to be received by Indigenous Business Australia results from interest on loans to support businesses and is largely offset by the public debt interest costs incurred by the Australian Government in financing the loans, which are separately accounted for in the Mid-Year Economic and Fiscal Outlook.
This measure includes funding for Centrelink of $1.2 million in 2007-08, $0.5 million in 2008-09, $0.4 million in 2009-10, $0.4 million in 2010-11 and $0.2 million in 2011-12.
Further information can be found in the press release of 18 July 2007 issued by the Minister for Families, Community Services and Indigenous Affairs.
Yamatji — native title representative body — additional funding for resolution of native title claim issues Expense ($m)
2007-08 2008-09 2009-10 2010-11
Department of Families, Community Services and Indigenous Affairs 5.5 - - -
The Government will provide $5.5 million in 2007-08 through the Native Title and Land Rights Program to Yamatji Marlpa Baba Maaja Aboriginal Corporation (Yamatji), a native title representative body. Funding will be provided to expedite resolution of outstanding issues relating to some existing native title land claims in the Pilbara region of Western Australia. Early resolution of these issues will enable negotiations to proceed between Rio Tinto Iron Ore and affected native title claimant groups in respect of mining access arrangements on affected land.

Appendix A: Policy decisions taken since the 2007-08 Budget
156
FINANCE AND ADMINISTRATION
Cornwell superannuation case — interim response Expense ($m)
2007-08 2008-09 2009-10 2010-11
Department of Finance and Administration 1.9 - - -
Commonwealth Superannuation Administration 0.8 - - -
Total 2.7 - - -
The Government will provide $2.7 million in 2007-08 for interim arrangements to manage the Australian Government’s response to the Cornwell superannuation case. This will allow processing and assessment of further claims against the Commonwealth for alleged negligent advice about superannuation eligibility.
This measure includes funding for ComSuper of $0.8 million to assist in managing claims.
Sydney Airports Corporation Limited stamp duty dispute — funding Expense ($m)
2007-08 2008-09 2009-10 2010-11
Department of Finance and Administration nfp nfp nfp nfp
The Government will provide funding to the Department of Finance and Administration for the legal and other costs related to the dispute with the New South Wales Government over the imposition of land-rich stamp duty on the sale of Australian Government shares in the Sydney Airports Corporation Limited.
Provision for this funding has been included in the forward estimates and is not for publication as the costs involve the engagement of specialist advisers, including lawyers. Consequently, the estimates are commercial-in-confidence.

Appendix A: Policy decisions taken since the 2007-08 Budget
157
FOREIGN AFFAIRS AND TRADE
Afghanistan and Pakistan — assistance Expense ($m)
2007-08 2008-09 2009-10 2010-11
AusAID - 66.3 - -
The Government will provide $114.9 million over two years for new and expanded assistance programmes in Afghanistan and Pakistan.
The funding will improve the delivery of essential services such as health and education, strengthen agricultural production and help build security and stability in Afghanistan and adjoining areas of Pakistan by strengthening the capacity of both national and provincial governments.
Funding of $48.6 million in 2007-08 will be met from within the existing resourcing of AusAID.
Further information can be found in the press release of 23 August 2007 issued by the Minister for Foreign Affairs.
Asia-Pacific Economic Cooperation forum — supporting Australia’s involvement Expense ($m)
2007-08 2008-09 2009-10 2010-11
Department of Foreign Affairs and Trade 1.3 3.9 3.9 1.9
Department of the Treasury 2.3 3.7 - -
Department of Health and Ageing - - - -
Department of Industry, Tourism and Resources - - - -
Total 3.5 7.6 3.9 1.9
The Government will provide $20.4 million over five years (including $0.2 million in 2011-12) to support Australia’s involvement in the Asia Pacific Economic Cooperation (APEC) forum, including through initiatives agreed at the APEC 2007 Economic Leaders’ and related meetings.

Appendix A: Policy decisions taken since the 2007-08 Budget
158
The measure involves funding for the Department of Foreign Affairs and Trade of $10.8 million over four years from 2007-08 for the establishment of a Policy Support Unit within the APEC Secretariat to undertake analysis on trade, structural reform and energy issues; and $0.3 million over three years from 2008-09 to increase Australia’s APEC membership contributions. The measure also includes $1.2 million over four years from 2008-09 to support Australian members of the APEC Business Advisory Council (ABAC) in representing the Australian business community. The cost of this support for ABAC will be met from within the existing resourcing of the Department of Foreign Affairs and Trade.
Funding of $5.9 million over two years will be provided to the Department of the Treasury to host ministerial and officials’ meetings to support structural reform across the region.
Funding of $1.8 million over three years from 2007-08 will be provided to support Australia’s chairing of the APEC Health Working Group, contingent on Australia being selected to chair this Group. The cost of this component of the measure will be met from within the existing resourcing of the Department of Health and Ageing.
The measure also includes funding for the Department of Industry, Tourism and Resources of $0.1 million over two years from 2007-08 to support Australia’s chairing and secretariat commitments in APEC working groups; and $0.3 million over two years from 2007-08 to establish an APEC Energy Investment and Trade Roundtable to develop and implement the APEC Energy Peer Review Mechanism, which aims to help APEC member economies attain energy efficiency goals. This funding will be met from within the existing resourcing of the Department of Industry, Tourism and Resources.
Emergency and humanitarian relief — contributions Expense ($m)
2007-08 2008-09 2009-10 2010-11
AusAID - - - -
The Government has provided $43.8 million since the 2007-08 Budget for emergency and humanitarian relief efforts. The funding has been provided through various international agencies, such as the United Nations Children’s Fund, the World Food Organisation and the World Health Organisation, and a number of non-government organisations. Examples of the assistance provided include: the provision of food aid to people in Zimbabwe; funding humanitarian services for conflict victims in Sri Lanka, Sudan, Somalia and Uganda; and contributing towards emergency relief efforts in storm and flood-affected communities in Bangladesh, Nepal, North Korea and Pakistan.
The cost of this measure was met from within the existing resourcing of AusAID.

Appendix A: Policy decisions taken since the 2007-08 Budget
159
Further information can be found in various press releases issued by the Minister for Foreign Affairs.
Fires in Greece — donation Expense ($m)
2007-08 2008-09 2009-10 2010-11
Department of Foreign Affairs and Trade 3.0 - - -
The Government provided $3.0 million in 2007-08 to the Hellenic Red Cross as part of its response to the devastation caused by the recent forest fires in Greece. The donation was given to the Hellenic Red Cross as a contribution to its special emergency fund for the victims of these fires.
Further information can be found in the press release of 27 August 2007 issued by the Prime Minister.
Global Fund — contribution Expense ($m)
2007-08 2008-09 2009-10 2010-11
AusAID - 46.5 46.5 -
The Government will provide $93.0 million over two years from 2008-09 to the Global Fund to Fight HIV/AIDS, Tuberculosis and Malaria (the Global Fund) — a public-private partnership between governments, the private sector and affected communities. This funding is in addition to $42.0 million provided in 2007-08 and will take Australia’s total contribution to the Global Fund to $135.0 million over three years.
Since its establishment in 2002, the Global Fund has funded AIDS and tuberculosis treatment, and distributed insecticide-treated bed nets for the prevention of malaria worldwide. Australia’s commitments will continue to assist in these areas.
The funding will be assigned from the unallocated provision for expanded aid funding held in the Contingency Reserve.
Further information can be found in the press release of 28 September 2007 issued by the Minister for Foreign Affairs.

Appendix A: Policy decisions taken since the 2007-08 Budget
160
Humanitarian assistance to Darfur Expense ($m)
2007-08 2008-09 2009-10 2010-11
AusAID - - - -
The Government provided an additional $20.0 million in humanitarian assistance to the Darfur region of Sudan in 2007-08. The funding included $16.0 million for food aid and air transport, $2.0 million for logistics support and $2.0 million for health projects to help alleviate the humanitarian crisis in Darfur.
The funding brings the Government’s total contribution to Sudan and neighbouring countries to more than $82.0 million since May 2004.
The cost of this measure was met from within the existing resourcing of AusAID.
Further information can be found in the press release of 15 July 2007 issued by the Minister for Foreign Affairs.
International Development Association 15 replenishment — contribution Expense ($m)
2007-08 2008-09 2009-10 2010-11
AusAID 42.2 - - -
The Government will provide a contribution to the current Replenishment of the International Development Association (IDA) — the concessional lending arm of the World Bank. IDA provides analysis and funding, through grants and loans, for developing economies in areas such as basic infrastructure, health and education systems and rural development. The Government’s Aid White Paper (April 2006) indicates that Australia will support appropriate expansions to IDA.
This measure includes up to $211.0 million in additional funding, with the remainder to be met from within the existing resourcing of AusAID. The final amount to be contributed will depend on exchange rates and the outcome of negotiations with IDA. The additional funding will be assigned from the unallocated provision for expanded aid funding held in the Contingency Reserve.
The contribution is expected to contain both loan and grant components. The estimated effect on the fiscal balance reflects an assumption on the relative proportions of these components. The provision of loans from the budget, and their repayment, affect only the composition of the Government’s financial assets and, as such, the loans component of this measure will have no impact on the fiscal balance. The public debt interest costs incurred by the Australian Government in financing the loans are separately accounted for in the Mid-Year Economic and Fiscal Outlook.

Appendix A: Policy decisions taken since the 2007-08 Budget
161
Working with Australians overseas to promote Australia’s interests Expense ($m)
2007-08 2008-09 2009-10 2010-11
Department of Foreign Affairs and Trade 0.5 0.2 0.2 -
The Government will provide $0.9 million over three years to support the activities of Advance, an organisation representing Australians working overseas. The funding will support infrastructure and specific projects to assist Australian expatriates and promote public diplomacy objectives in support of Australia’s foreign and trade policies.

Appendix A: Policy decisions taken since the 2007-08 Budget
162
HEALTH AND AGEING
Australian Red Cross Blood Service — Sydney headquarters relocation Expense ($m)
2007-08 2008-09 2009-10 2010-11
Department of Health and Ageing - - - 6.7
The Government will provide up to $99.0 million over 20 years from 2010-11 to the Australian Red Cross Blood Service (ARCBS) to assist in its relocation to new Sydney headquarters. Moving to new premises will assist the ARCBS to continue the efficient and effective delivery of Australia’s blood supply.
The ARCBS estimates total costs at around $157 million with the final amount dependent on further negotiation and finalisation of the ARCBS business case. In line with existing cost sharing arrangements under the National Blood Agreement, the States and Territories will also contribute to the cost of the relocation.
Further information can be found in the press release of 27 July 2007 issued by the Minister for Health and Ageing.
Clinical training for enrolled nurses Expense ($m)
2007-08 2008-09 2009-10 2010-11
Department of Health and Ageing 15.5 43.6 30.9 29.2
Department of Education, Science and Training 0.9 4.3 4.9 5.4
Total 16.4 47.9 35.9 34.7
Related revenue ($m)
Australian Taxation Office - - - -
The Government will provide $134.8 million over four years to create 25 Australian Hospital Nursing Schools to deliver hospital-based training within major public and private hospitals for enrolled nurses. Participating hospitals will be selected under a competitive tender process and will receive funding to establish, or upgrade existing, on-site educational facilities. Ongoing funding will also be available to maintain infrastructure and to employ clinical training staff.

Appendix A: Policy decisions taken since the 2007-08 Budget
163
The first intake of students will be in 2008 and 500 students will be enrolled annually when the programme is fully implemented. The Government will provide wage subsidies of $500 per week for each student to participating hospitals for the first three months and will also pay participating hospitals a $1,500 commencement bonus and a $2,500 completion bonus for each eligible student. The Government will directly pay each student a tax-exempt bonus of $2,000 once they have successfully completed their first six months of the course, and a further tax exempt bonus of $3,000 when they have successfully completed the course.
This measure includes $4.6 million over three years to implement national nursing competency standards including developing training packages for enrolled nurses. It also involves $7.3 million over five years for a career promotion campaign to promote nursing as an attractive and worthwhile career and ensure new nursing training places are taken up.
Further information can be found in the press release of 14 September 2007 issued by the Prime Minister.
Community Pharmacy Agreement amendment — increased dispensing fee Expense ($m)
2007-08 2008-09 2009-10 2010-11
Department of Health and Ageing 20.2 22.8 23.8 26.8
Department of Veterans’ Affairs 1.7 1.7 1.7 1.6
Total 22.0 24.5 25.4 28.5
The Government has, from 1 August 2007, amended the Fourth Community Pharmacy Agreement to increase the pharmacy dispensing fee by 12 cents, at an estimated cost of $100.4 million over four years. This one-off increase provides to pharmacies a proportion of the impact on pharmacy revenue of a price reduction on the lipid lowering drug simvastatin on the Pharmaceutical Benefits Scheme.

Appendix A: Policy decisions taken since the 2007-08 Budget
164
Dental Treatment — enhanced Medicare items for patients with chronic and complex conditions Expense ($m)
2007-08 2008-09 2009-10 2010-11
Department of Health and Ageing 4.9 3.0 -1.2 2.2
Medicare Australia 2.6 2.4 2.1 2.1
Total 7.6 5.4 0.9 4.3
Related capital ($m)
Medicare Australia .. - - -
The Government will provide additional funding of $18.1 million to build on the 2007-08 Budget measure, Dental Treatment — enhanced Medicare items for patients with chronic and complex conditions. This will enable eligible patients to receive up to $4,250 worth of Medicare-funded dental treatment over two consecutive calendar years.
In the 2007-08 Budget, the Government announced $377.6 million for an expansion of the existing Medicare dental items for people with chronic and complex conditions where their oral health is impacting, or is likely to impact, on their general health. This was based on an annual cap of $2,125. The new arrangements will provide patients with more flexibility to receive dental treatment when they require the services. The new Medicare dental arrangement will commence on 1 November 2007.
Further information can be found in the press release of 14 August 2007 issued by the Minister for Health and Ageing.
Grafton Hospital — funding Expense ($m)
2007-08 2008-09 2009-10 2010-11
Department of Health and Ageing 18.0 - - -
The Government will provide $18.0 million in 2007-08 for the upgrade of the accident and emergency department and three operating theatres at Grafton Hospital in NSW.
This funding will be conditional on the establishment of a properly constituted hospital board for the hospital, that will hold the funding in trust on behalf of the community and work with the community, hospital management and NSW health authorities to supervise the disbursement of the funds.

Appendix A: Policy decisions taken since the 2007-08 Budget
165
Health and Medical Investment Fund Expense ($m)
2007-08 2008-09 2009-10 2010-11
Department of Health and Ageing - - 150.0 203.8
The Government will establish a perpetual Health and Medical Investment Fund (HAMIF) with an initial investment of $2.5 billion funded from the 2006-07 Budget surplus. The initial investment will be transferred by the end of 2007-08. The Government will also invest the proceeds from the sale of Medibank Private in the HAMIF. The sale is expected to occur in 2008 with proceeds to be transferred in early 2009.
The HAMIF will be invested to earn income and the Future Fund Board of Guardians will be responsible for managing and investing the assets of the HAMIF. The real value of the capital is to be maintained with any additional earnings to be made available for distribution. The table above represents current estimates of the earnings that will be available for distribution. Actual payments from the HAMIF will depend on the Fund’s investment mandate and realised earnings.
Earnings from the Fund will be available for distribution from 2009-10 for new medical facilities and high technology medical equipment. Distributions from the Fund will be available on a competitive basis and subject to cost-benefit analysis. The Minister for Health and Ageing will determine the distributions after receiving advice from a panel of experts led by the Chief Medical Officer.
Further information can be found in the press release of 21 August 2007 issued by the Treasurer.

Appendix A: Policy decisions taken since the 2007-08 Budget
166
Human embryo and stem cell research — establishment of a regulatory framework Expense ($m)
2007-08 2008-09 2009-10 2010-11
National Health and Medical Research Council 0.9 0.5 0.4 0.3
Department of Health and Ageing 0.7 0.2 0.2 0.1
Total 1.6 0.7 0.6 0.4
Related capital ($m)
National Health and Medical Research Council 0.1 - - -
The Government will provide $3.4 million over four years to establish a new regulatory framework for research into human embryos, and to further implement the recommendations of the Legislation Review Committee’s review of the Prohibition of Human Cloning Act 2002 and Research Involving Human Embryos Act 2002 (the Lockhart Review).
Funding will also allow the National Health and Medical Research Council to review current research and clinical applications for the use of stem cells. This information will inform a public education campaign regarding stem cells, research involving human embryos and cloning to be managed by the Department of Health and Ageing.
Kava — tightening of import arrangements Expense ($m)
2007-08 2008-09 2009-10 2010-11
Department of Health and Ageing 5.9 0.3 0.3 0.3
Related capital ($m)
Department of Health and Ageing 0.2 - - -
The Government will provide $7.2 million over four years to fund a buy-back scheme for kava importers affected by the Government’s decision to restrict the commercial importation of kava, except for medical or scientific purposes, from 26 June 2007. This measure will also establish a diversion control programme to permit, monitor and report kava use for medical or scientific purposes.
Existing importation approval allows up to two kilograms of kava in the accompanied baggage of an incoming passenger (aged 18 years or over) to Australia. This will continue, in recognition that kava has traditional ceremonial and cultural uses for Pacific Islanders.
Further information can be found in the joint press release of 27 June 2007 issued by the Minister for Health and Ageing and the Minister for Justice and Customs.

Appendix A: Policy decisions taken since the 2007-08 Budget
167
Lifeline — financial assistance Expense ($m)
2007-08 2008-09 2009-10 2010-11
Department of Health and Ageing - 2.1 2.2 2.2
The Government will provide $8.2 million over four years (including $1.7 million in 2007-08) to Lifeline to assist it in effectively delivering its services.
Lifeline is a non-profit organisation dedicated to providing support to people in need through a 24-hour telephone counselling service.
Funding of $1.7 million in 2007-08 will be met from within the existing resourcing of the Department of Health and Ageing.
This measure builds on the 2003-04 Budget measure, Lifeline — assistance, the 2005-06 Budget measure, Lifeline — assistance for national telephony system and the 2006-07 Budget measure, COAG Mental Health — funding for telephone counselling, self-help and web-based support programmes.
Further information can be found in the press release of 3 September 2007 issued by the Prime Minister.
Magnetic Resonance Imaging — improved access Expense ($m)
2007-08 2008-09 2009-10 2010-11
Department of Health and Ageing 0.6 9.7 14.9 14.6
Medicare Australia .. .. .. ..
Total 0.6 9.7 14.9 14.7
The Government will provide $39.9 million over four years to improve access to affordable Magnetic Resonance Imaging (MRI) services. This measure will provide Medicare-eligible MRI units in an additional 11 locations. This will provide increased access to MRI services in these locations with no ‘out-of-pocket’ costs for pensioners, concession cardholders, children and hospital in-patients using the services. This measure will increase to 126 the number of Medicare-eligible MRI units that the Government has committed to support.
Further information can be found in the press release of 27 September 2007 issued by the Minister for Health and Ageing.

Appendix A: Policy decisions taken since the 2007-08 Budget
168
Medicare Benefits Schedule — new and revised listings Expense ($m)
2007-08 2008-09 2009-10 2010-11
Department of Health and Ageing 6.0 11.3 15.9 18.5
Department of Veterans’ Affairs 0.9 1.5 1.6 1.8
Medicare Australia 0.2 0.1 0.2 0.2
Total 7.1 12.9 17.7 20.5
The Government has added new and revised items on to the Medicare Benefits Schedule and Veterans’ Benefits at an estimated cost of $58.0 million over four years.
The changes include:
• new items for follow up services for patients who have undertaken an Aboriginal and Torres Strait Islander health check;
• new items for specialist geriatricians to prepare and review comprehensive care management plans for their patients;
• a new item for diagnosing and treating patients with obscure gastrointestinal bleeding;
• a new item for the staging and diagnosis of patients with gastrointestinal tumours;
• revised patient eligibility for radioactive treatment of tumour cells in the prostate gland; and
• revised items for dental practitioners with both medical and dental qualifications.
Further information will be available in the summary of changes included in the 1 November 2007 Medicare Benefits Schedule to be issued by the Department of Health and Ageing.
Mersey Community Hospital Tasmania — funding Expense ($m)
2007-08 2008-09 2009-10 2010-11
Department of Health and Ageing 51.4 64.0 64.0 64.0
The Government will provide funding for the operation of the Mersey Community Hospital to enable it to continue providing a comprehensive range of hospital services for public and private patients. The Mersey Community Hospital will be a community-controlled and Commonwealth-funded facility.
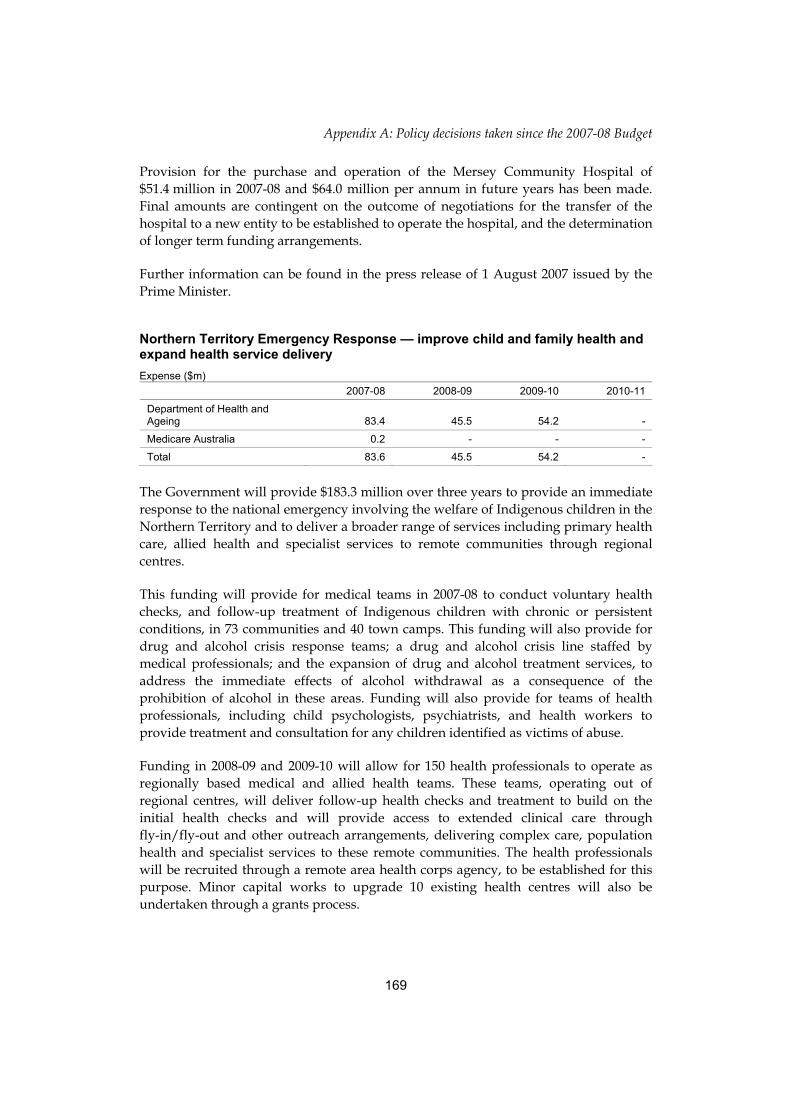
Appendix A: Policy decisions taken since the 2007-08 Budget
169
Provision for the purchase and operation of the Mersey Community Hospital of $51.4 million in 2007-08 and $64.0 million per annum in future years has been made. Final amounts are contingent on the outcome of negotiations for the transfer of the hospital to a new entity to be established to operate the hospital, and the determination of longer term funding arrangements.
Further information can be found in the press release of 1 August 2007 issued by the Prime Minister.
Northern Territory Emergency Response — improve child and family health and expand health service delivery Expense ($m)
2007-08 2008-09 2009-10 2010-11
Department of Health and Ageing 83.4 45.5 54.2 -
Medicare Australia 0.2 - - -
Total 83.6 45.5 54.2 -
The Government will provide $183.3 million over three years to provide an immediate response to the national emergency involving the welfare of Indigenous children in the Northern Territory and to deliver a broader range of services including primary health care, allied health and specialist services to remote communities through regional centres.
This funding will provide for medical teams in 2007-08 to conduct voluntary health checks, and follow-up treatment of Indigenous children with chronic or persistent conditions, in 73 communities and 40 town camps. This funding will also provide for drug and alcohol crisis response teams; a drug and alcohol crisis line staffed by medical professionals; and the expansion of drug and alcohol treatment services, to address the immediate effects of alcohol withdrawal as a consequence of the prohibition of alcohol in these areas. Funding will also provide for teams of health professionals, including child psychologists, psychiatrists, and health workers to provide treatment and consultation for any children identified as victims of abuse.
Funding in 2008-09 and 2009-10 will allow for 150 health professionals to operate as regionally based medical and allied health teams. These teams, operating out of regional centres, will deliver follow-up health checks and treatment to build on the initial health checks and will provide access to extended clinical care through fly-in/fly-out and other outreach arrangements, delivering complex care, population health and specialist services to these remote communities. The health professionals will be recruited through a remote area health corps agency, to be established for this purpose. Minor capital works to upgrade 10 existing health centres will also be undertaken through a grants process.

Appendix A: Policy decisions taken since the 2007-08 Budget
170
Provision has been made in the Contingency Reserve for the continuation of elements of this measure beyond 2007-08.
Further information can be found in the press release of 21 June 2007 issued by the Minister for Families, Community Services and Indigenous Affairs and the press release of 18 September 2007 issued by the Minister for Health and Ageing.
Pharmaceutical Benefits Scheme — extension to the listing of Taxotere® (docetaxel) Expense ($m)
2007-08 2008-09 2009-10 2010-11
Department of Health and Ageing 11.4 20.4 24.2 28.1
Department of Veterans’ Affairs 0.3 0.5 0.6 0.7
Medicare Australia .. .. .. ..
Total 11.7 21.0 24.8 28.9
Related revenue ($m)
Department of Health and Ageing nfp nfp nfp nfp
The Government will, from 1 November 2007, list Taxotere® (docetaxel) on the Pharmaceutical Benefits Scheme (PBS) and the Repatriation PBS, at an estimated cost of $86.4 million over four years. This includes funding for administering payments through Medicare Australia. A pricing agreement negotiated between the Government and the drug manufacturer allows for revenue offsets to the cost of Taxotere®.
Taxotere® is currently available on the PBS for the treatment of certain forms of breast, ovarian and lung cancer, and in specific cases where patients suffering from these cancers have failed to respond to alternative treatments. The extension to the listing will provide subsidised access to Taxotere® for patients with androgen independent metastatic prostate cancer.
The average cost to the PBS of providing Taxotere® is approximately $2,541 per patient per cycle. On average, seven cycles are required per patient, with two prescriptions required per cycle. General consumers will pay a $30.70 co-payment per prescription and concession card holders will pay a $4.90 co-payment per prescription.
Further information can be found in the press release of 2 September 2007 issued by the Minister for Health and Ageing.
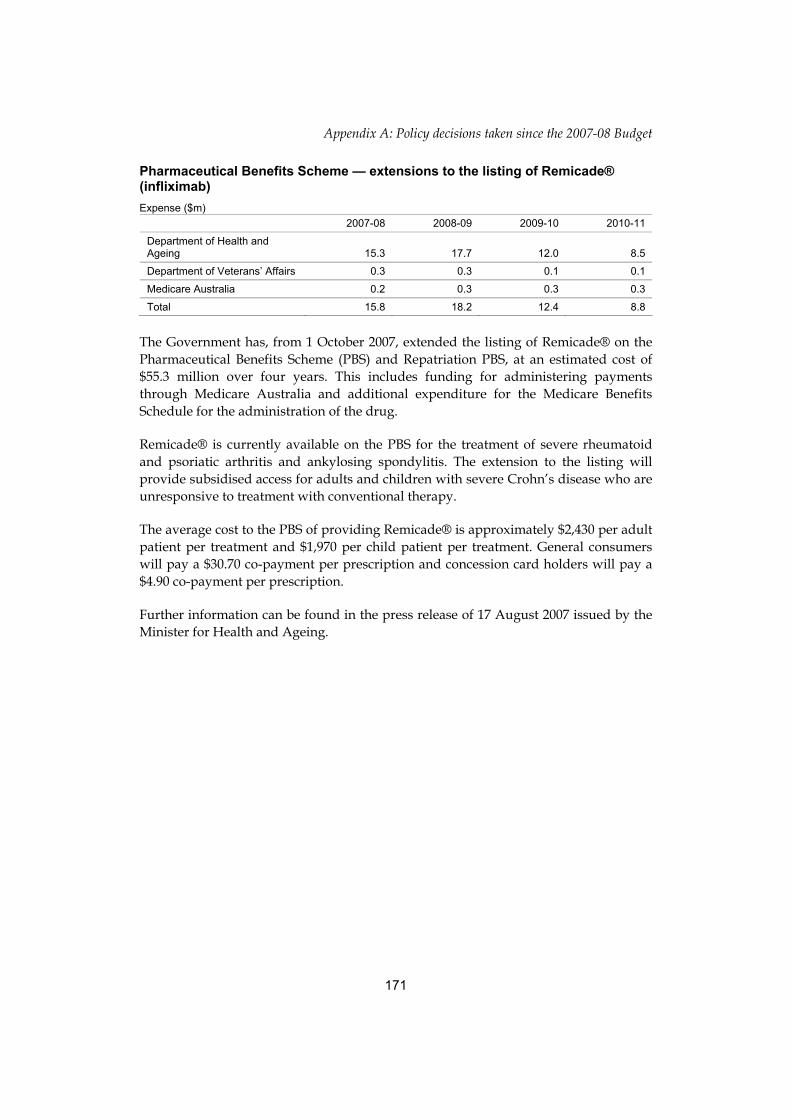
Appendix A: Policy decisions taken since the 2007-08 Budget
171
Pharmaceutical Benefits Scheme — extensions to the listing of Remicade® (infliximab) Expense ($m)
2007-08 2008-09 2009-10 2010-11
Department of Health and Ageing 15.3 17.7 12.0 8.5
Department of Veterans’ Affairs 0.3 0.3 0.1 0.1
Medicare Australia 0.2 0.3 0.3 0.3
Total 15.8 18.2 12.4 8.8
The Government has, from 1 October 2007, extended the listing of Remicade® on the Pharmaceutical Benefits Scheme (PBS) and Repatriation PBS, at an estimated cost of $55.3 million over four years. This includes funding for administering payments through Medicare Australia and additional expenditure for the Medicare Benefits Schedule for the administration of the drug.
Remicade® is currently available on the PBS for the treatment of severe rheumatoid and psoriatic arthritis and ankylosing spondylitis. The extension to the listing will provide subsidised access for adults and children with severe Crohn’s disease who are unresponsive to treatment with conventional therapy.
The average cost to the PBS of providing Remicade® is approximately $2,430 per adult patient per treatment and $1,970 per child patient per treatment. General consumers will pay a $30.70 co-payment per prescription and concession card holders will pay a $4.90 co-payment per prescription.
Further information can be found in the press release of 17 August 2007 issued by the Minister for Health and Ageing.

Appendix A: Policy decisions taken since the 2007-08 Budget
172
Pharmaceutical Benefits Scheme — listing of Lucentis® (ranibizumab) and Visudyne® (verteporfin) Expense ($m)
2007-08 2008-09 2009-10 2010-11
Department of Health and Ageing 87.9 138.7 167.2 183.8
Department of Veterans’ Affairs 23.3 33.8 36.3 35.6
Medicare Australia 1.0 1.1 1.2 1.3
Total 112.1 173.6 204.6 220.7
Related revenue ($m)
Department of Health and Ageing nfp nfp nfp nfp
The Government has, from 1 August 2007, listed Lucentis® (ranibizumab) and Visudyne® (verteporfin) on the Pharmaceutical Benefits Scheme (PBS) and the Repatriation PBS. Lucentis® and Visudyne® are used for the treatment of age-related macular degeneration and are available on the PBS under prescription issued by an ophthalmologist.
The cost of listing these drugs is estimated at $711.1 million over four years. This includes funding for administering payments through Medicare Australia and additional expenditure for the Medicare Benefits Schedule and Veterans’ Benefits related to the administration of these drugs. A pricing agreement negotiated between the Government and the drug manufacturer allows for revenue offsets to the cost of Lucentis®. Due to the listing of Visudyne® on the PBS, the existing Visudyne® Therapy Programme has been terminated from 1 August 2007.
The average cost to the PBS of providing Lucentis® is approximately $12,033 per patient per year. In the first year of treatment a patient is expected to require an average of seven prescriptions. The average cost to the PBS of providing Visudyne® is approximately $3,176 per patient per year. In the first year of treatment a patient is expected to require an average of two prescriptions. General consumers will pay a $30.70 co-payment per prescription and concession card holders will pay a $4.90 co-payment per prescription.
Further information can be found in the press release of 6 June 2007 issued by the Minister for Health and Ageing.

Appendix A: Policy decisions taken since the 2007-08 Budget
173
Pharmaceutical Benefits Scheme — minor new listings Expense ($m)
2007-08 2008-09 2009-10 2010-11
Department of Veterans’ Affairs 0.1 -0.4 -0.8 -1.1
Department of Health and Ageing -10.5 -28.6 -46.3 -64.8
Total -10.4 -28.9 -47.1 -65.9
Related revenue ($m)
Department of Health and Ageing nfp nfp nfp nfp
The Government has agreed to a number of minor new listings on the Pharmaceutical Benefits Scheme (PBS) and Repatriation PBS since the 2007-08 Budget, which will result in reduced costs of $152.4 million over four years.
The extension to the listings of Arabloc® and Arava®, for the treatment of psoriatic arthritis, will result in a reduction in the demand for more expensive treatments for the condition.
The other minor new listings (including extensions of PBS listings) are medicines that have been listed at either no additional cost to the budget (because they replace existing listings) or at an estimated cost each of less than $10 million per annum.
New listings that have a minor cost include:
• Mirena® as an alternative treatment to surgery for women who have menorrhagia;
• Sprycel® for the treatment of chronic myeloid leukaemia;
• Femara® for the treatment of breast cancer in women who have completed treatment with tamoxifen;
• Aptivus® for the treatment of HIV in patients who do not respond to, or have resistance to, at least three antiretroviral medications combined; and
• Mabthera® for the treatment of severe rheumatoid arthritis patients who have failed to respond to other treatments.
Further information can be found in the press release of 1 August 2007 issued by the Minister for Health and Ageing and the 1 June 2007 and 1 August 2007 updates to the Schedule of Pharmaceutical Benefits issued by the Department of Health and Ageing.

Appendix A: Policy decisions taken since the 2007-08 Budget
174
Pharmaceutical Benefits Scheme Reform — extension to the phasing of price reductions for F2T single brand drugs Expense ($m)
2007-08 2008-09 2009-10 2010-11
Department of Health and Ageing - 17.9 46.2 39.5
Department of Veterans’ Affairs - 1.2 3.1 2.6
Total - 19.1 49.3 42.1
The Government will extend the phasing of price reductions under the Mid-Year Economic and Fiscal Outlook 2006-07 measure Pharmaceutical Benefits Scheme Reform — achieving better value for the five single brand medicines listed on formulary 2T (F2T), at an estimated cost of $110.4 million over four years.
The F2T group of medicines are those that have multiple brands, including medicines interchangeable at the patient level with a multiple brand medicine, and for which significant discounting occurs. Medicines classified as F2T are subject to a 25 per cent price reduction from 1 August 2008, except for the single brand F2T medicines, which are scheduled to have the price reduction phased over a number of years.
The phasing of the price reduction for all single brand F2T medicines will now be extended to 2018. In the event that a new brand of one of these medicines enters the market before 2018, the remainder of the 25 per cent price reduction will be applied to that medicine in full at the next major update to the Schedule of Pharmaceutical Benefits (1 April, 1 August or 1 December each year).
Pharmaceutical Benefits Scheme Reform — support for prescribing software vendors Expense ($m)
2007-08 2008-09 2009-10 2010-11
Department of Health and Ageing - - - -
The Government will provide $0.8 million in 2007-08 to assist software vendors in modifying prescribing software to incorporate new streamlined authority arrangements. These arrangements, which were introduced as part of the Pharmaceutical Benefits Scheme (PBS) reforms announced on 16 November 2006, enable certain PBS medicines that previously required authorisation through a phone call to Medicare Australia to be authorised by a doctor.
The cost of this measure will be met from within the existing resourcing of the Department of Health and Ageing.
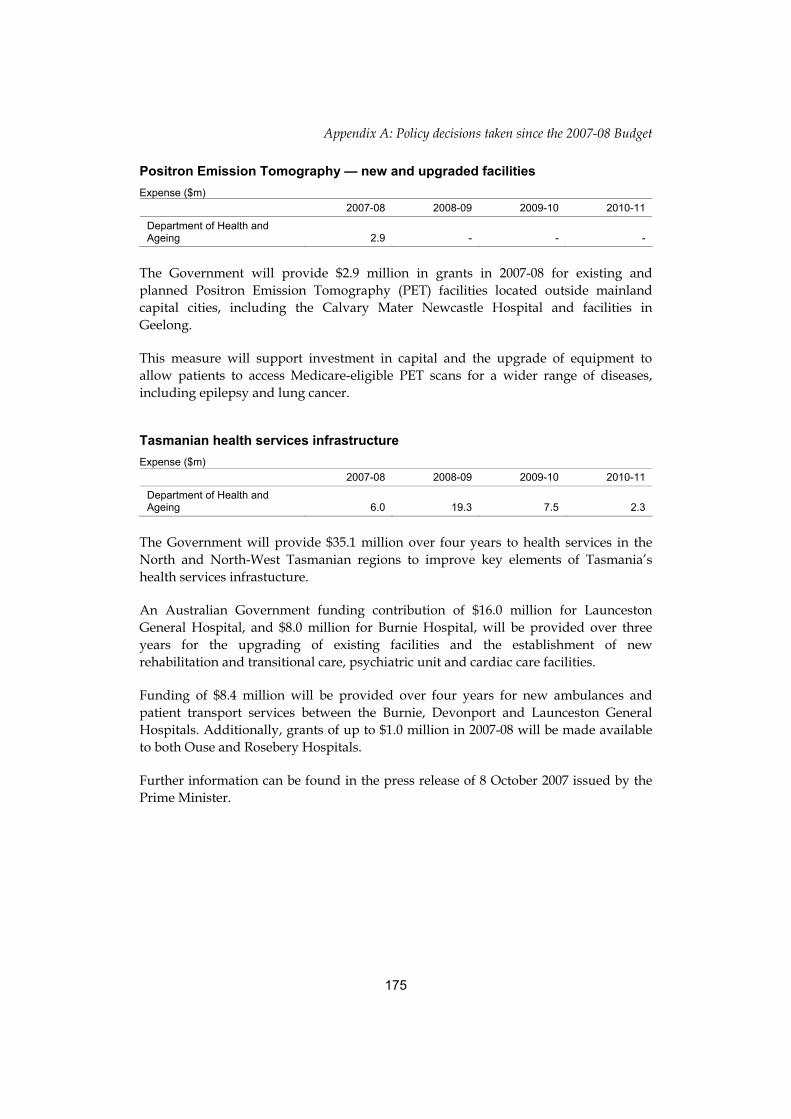
Appendix A: Policy decisions taken since the 2007-08 Budget
175
Positron Emission Tomography — new and upgraded facilities Expense ($m)
2007-08 2008-09 2009-10 2010-11
Department of Health and Ageing 2.9 - - -
The Government will provide $2.9 million in grants in 2007-08 for existing and planned Positron Emission Tomography (PET) facilities located outside mainland capital cities, including the Calvary Mater Newcastle Hospital and facilities in Geelong.
This measure will support investment in capital and the upgrade of equipment to allow patients to access Medicare-eligible PET scans for a wider range of diseases, including epilepsy and lung cancer.
Tasmanian health services infrastructure Expense ($m)
2007-08 2008-09 2009-10 2010-11
Department of Health and Ageing 6.0 19.3 7.5 2.3
The Government will provide $35.1 million over four years to health services in the North and North-West Tasmanian regions to improve key elements of Tasmania’s health services infrastucture.
An Australian Government funding contribution of $16.0 million for Launceston General Hospital, and $8.0 million for Burnie Hospital, will be provided over three years for the upgrading of existing facilities and the establishment of new rehabilitation and transitional care, psychiatric unit and cardiac care facilities.
Funding of $8.4 million will be provided over four years for new ambulances and patient transport services between the Burnie, Devonport and Launceston General Hospitals. Additionally, grants of up to $1.0 million in 2007-08 will be made available to both Ouse and Rosebery Hospitals.
Further information can be found in the press release of 8 October 2007 issued by the Prime Minister.
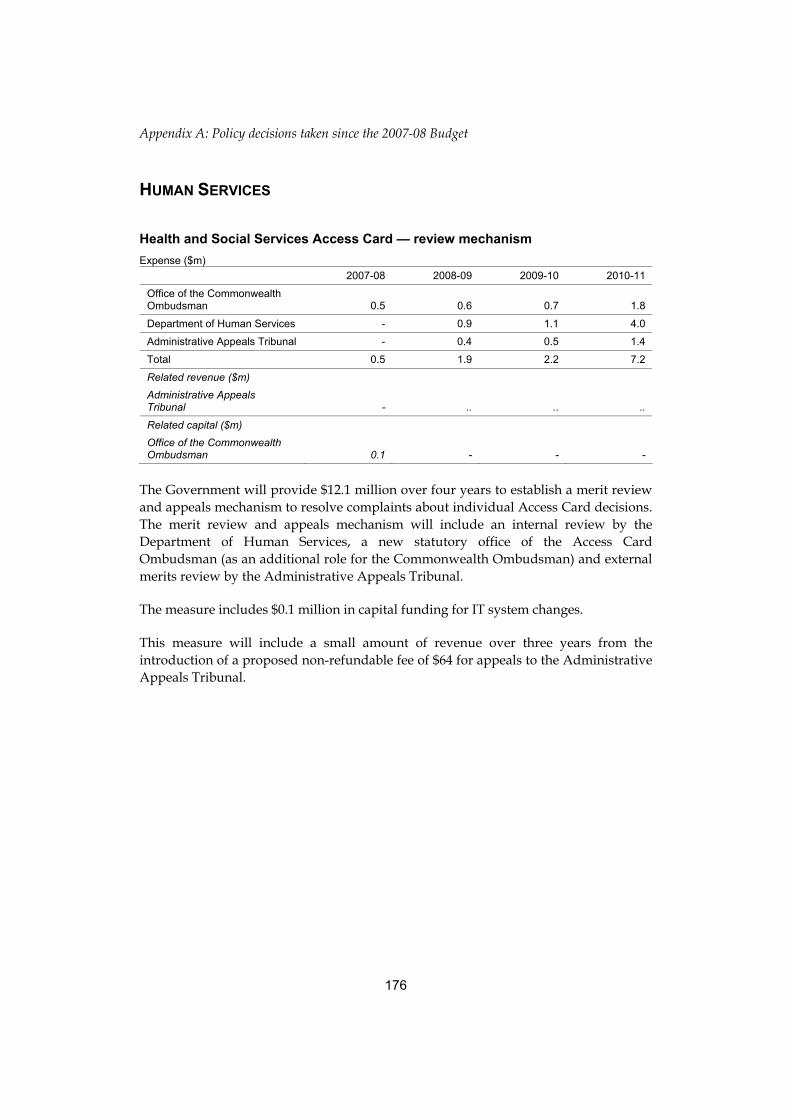
Appendix A: Policy decisions taken since the 2007-08 Budget
176
HUMAN SERVICES
Health and Social Services Access Card — review mechanism Expense ($m)
2007-08 2008-09 2009-10 2010-11
Office of the Commonwealth Ombudsman 0.5 0.6 0.7 1.8
Department of Human Services - 0.9 1.1 4.0
Administrative Appeals Tribunal - 0.4 0.5 1.4
Total 0.5 1.9 2.2 7.2
Related revenue ($m)
Administrative Appeals Tribunal - .. .. ..
Related capital ($m)
Office of the Commonwealth Ombudsman 0.1 - - -
The Government will provide $12.1 million over four years to establish a merit review and appeals mechanism to resolve complaints about individual Access Card decisions. The merit review and appeals mechanism will include an internal review by the Department of Human Services, a new statutory office of the Access Card Ombudsman (as an additional role for the Commonwealth Ombudsman) and external merits review by the Administrative Appeals Tribunal.
The measure includes $0.1 million in capital funding for IT system changes.
This measure will include a small amount of revenue over three years from the introduction of a proposed non-refundable fee of $64 for appeals to the Administrative Appeals Tribunal.

Appendix A: Policy decisions taken since the 2007-08 Budget
177
Medicare rebates — electronic claiming incentive package Expense ($m)
2007-08 2008-09 2009-10 2010-11
Department of Health and Ageing 12.7 23.3 16.4 -
Medicare Australia 7.6 7.9 3.9 1.1
Total 20.2 31.2 20.3 1.1
Related capital ($m)
Medicare Australia 0.6 - - -
The Government will provide $73.5 million over four years for a package of incentives to support the take-up of electronic claiming of Medicare rebates at doctors’ surgeries. This will enable patients who are not bulk-billed to receive the Medicare rebate directly into their bank accounts by electronic funds transfer, without the need to visit a Medicare office. The incentives will also aim to increase the level of various forms of electronic claiming by medical practices.
The package includes:
• assistance for medical practitioners to take-up and make greater use of electronic claiming;
• incentives for software vendors to assist medical practitioners to transition to electronic claiming;
• support for the pathology industry to transition to a newer, more secure electronic claiming method; and
• access to the 90 Day Pay Doctor Cheque Scheme by specialists, pathologists and radiologists who participate in electronic claiming.
This measure includes $0.6 million in capital funding in 2007-08 to establish systems to register eligible recipients and enable the payment of incentives.
Further information can be found in the press release of 20 September 2007 issued by the Minister for Human Services.

Appendix A: Policy decisions taken since the 2007-08 Budget
178
IMMIGRATION AND CITIZENSHIP
Adult Migrant English Programme — 12 month contract extension Expense ($m)
2007-08 2008-09 2009-10 2010-11
Department of Immigration and Citizenship - 3.3 - -
The Government will provide $3.3 million in 2008-09 to extend the Adult Migrant English Programme contracts for 12 months from 1 July 2008. The programme is administered through 20 contracts with educational bodies for English language tuition and associated services. This extension will synchronise the programme’s contracts with those of other English language programmes funded by the Government, creating the opportunity for synergies in future programme delivery.
Baxter Immigration Detention Centre — closure Expense ($m)
2007-08 2008-09 2009-10 2010-11
Department of Immigration and Citizenship -10.9 -3.1 -3.1 -3.2
The Government has closed the Baxter Immigration Detention Centre and returned the facility to the Department of Defence. The number of illegal boat arrivals has been significantly reduced, resulting in the centre becoming excess to requirements.
This measure is expected to lead to savings of $20.3 million over four years.
Further information can be found in the press release of 17 August 2007 issued by the Minister for Immigration and Citizenship.
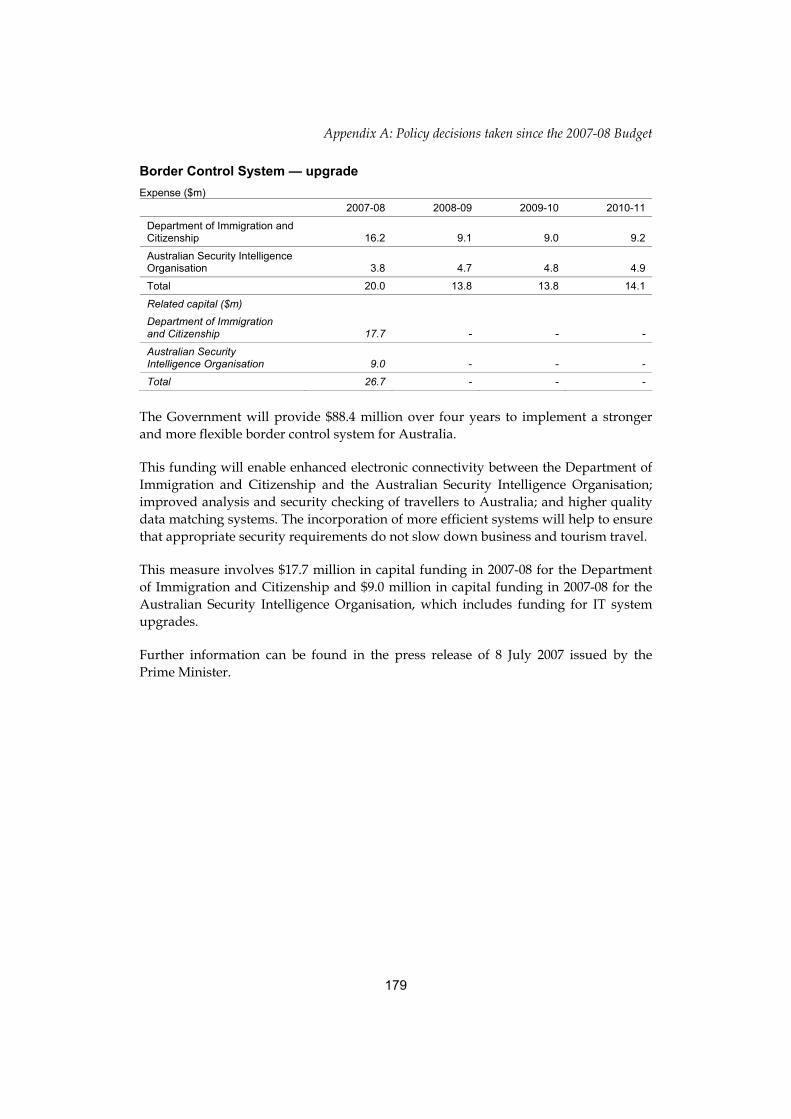
Appendix A: Policy decisions taken since the 2007-08 Budget
179
Border Control System — upgrade Expense ($m)
2007-08 2008-09 2009-10 2010-11
Department of Immigration and Citizenship 16.2 9.1 9.0 9.2
Australian Security Intelligence Organisation 3.8 4.7 4.8 4.9
Total 20.0 13.8 13.8 14.1
Related capital ($m)
Department of Immigration and Citizenship 17.7 - - -
Australian Security Intelligence Organisation 9.0 - - -
Total 26.7 - - -
The Government will provide $88.4 million over four years to implement a stronger and more flexible border control system for Australia.
This funding will enable enhanced electronic connectivity between the Department of Immigration and Citizenship and the Australian Security Intelligence Organisation; improved analysis and security checking of travellers to Australia; and higher quality data matching systems. The incorporation of more efficient systems will help to ensure that appropriate security requirements do not slow down business and tourism travel.
This measure involves $17.7 million in capital funding in 2007-08 for the Department of Immigration and Citizenship and $9.0 million in capital funding in 2007-08 for the Australian Security Intelligence Organisation, which includes funding for IT system upgrades.
Further information can be found in the press release of 8 July 2007 issued by the Prime Minister.

Appendix A: Policy decisions taken since the 2007-08 Budget
180
Citizenship Test — administration Expense ($m)
2007-08 2008-09 2009-10 2010-11
Department of Immigration and Citizenship 4.1 11.0 - -
Medicare Australia 0.9 0.4 - -
Total 5.0 11.3 - -
Related capital ($m)
Department of Immigration and Citizenship 10.6 0.2 - -
Centrelink 0.1 - - -
Total 10.8 0.2 - -
The Government will provide $27.3 million over two years to administer the Citizenship Test for prospective Australian citizens via a network of Australian Government offices, including selected Centrelink and Medicare Australia offices.
This approach to administering the test builds on the Citizenship Test measure announced in the 2007-08 Budget and will be reviewed prior to the 2009-10 Budget to assess its effectiveness.
The costs over two years are estimated at $25.9 million for the Department of Immigration and Citizenship and $1.3 million for Medicare Australia. The funding for the Department of Immigration and Citizenship includes $0.9 million in 2007-08 and $0.2 million in 2008-09 for services to be provided by Centrelink.
This measure includes $10.8 million over two years in capital funding for the Department of Immigration and Citizenship and $0.1 million in capital funding in 2007-08 for Centrelink for IT equipment and software to support this method of delivery.
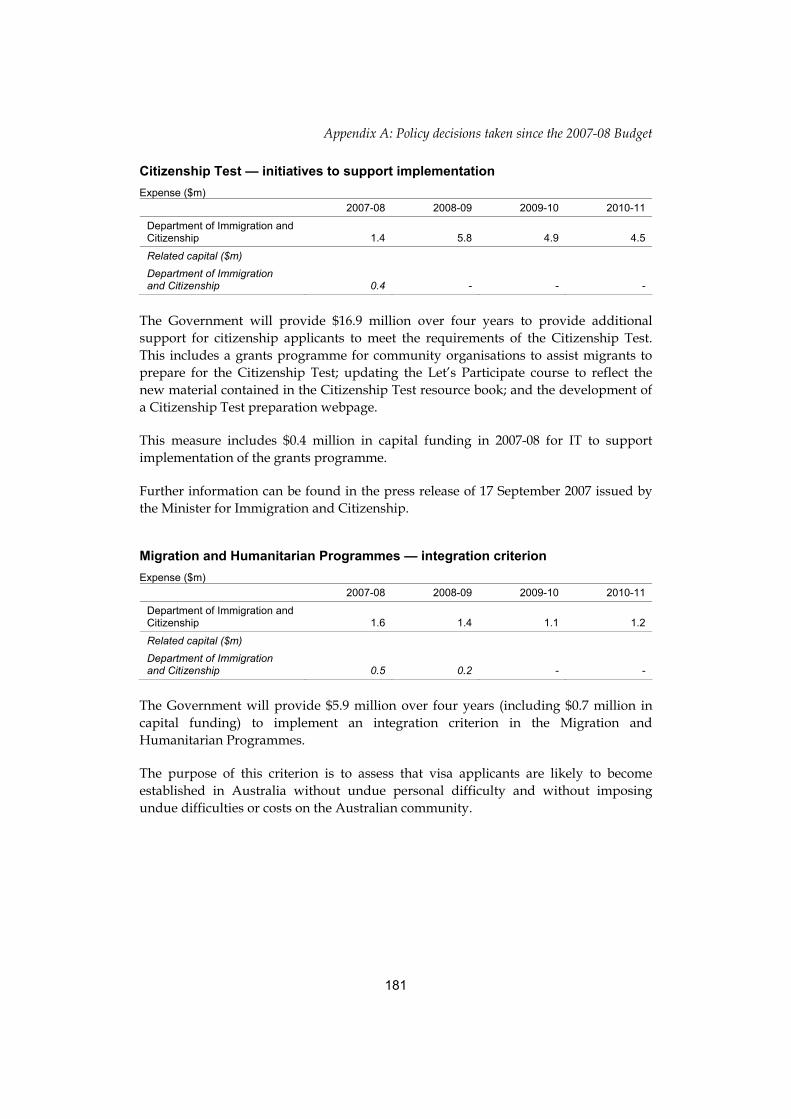
Appendix A: Policy decisions taken since the 2007-08 Budget
181
Citizenship Test — initiatives to support implementation Expense ($m)
2007-08 2008-09 2009-10 2010-11
Department of Immigration and Citizenship 1.4 5.8 4.9 4.5
Related capital ($m)
Department of Immigration and Citizenship 0.4 - - -
The Government will provide $16.9 million over four years to provide additional support for citizenship applicants to meet the requirements of the Citizenship Test. This includes a grants programme for community organisations to assist migrants to prepare for the Citizenship Test; updating the Let’s Participate course to reflect the new material contained in the Citizenship Test resource book; and the development of a Citizenship Test preparation webpage.
This measure includes $0.4 million in capital funding in 2007-08 for IT to support implementation of the grants programme.
Further information can be found in the press release of 17 September 2007 issued by the Minister for Immigration and Citizenship.
Migration and Humanitarian Programmes — integration criterion Expense ($m)
2007-08 2008-09 2009-10 2010-11
Department of Immigration and Citizenship 1.6 1.4 1.1 1.2
Related capital ($m)
Department of Immigration and Citizenship 0.5 0.2 - -
The Government will provide $5.9 million over four years (including $0.7 million in capital funding) to implement an integration criterion in the Migration and Humanitarian Programmes.
The purpose of this criterion is to assess that visa applicants are likely to become established in Australia without undue personal difficulty and without imposing undue difficulties or costs on the Australian community.

Appendix A: Policy decisions taken since the 2007-08 Budget
182
Unaccompanied Humanitarian Minors — additional funding Expense ($m)
2007-08 2008-09 2009-10 2010-11
Department of Immigration and Citizenship nfp nfp nfp nfp
The Government will provide additional funding over four years to state government welfare agencies across Australia for the welfare, supervision and support of Unaccompanied Humanitarian Minors (UHMs). The funding will meet the costs associated with the increased number and complexity of cases under this programme. UHMs are children, under 18 years of age, who enter Australia under the Humanitarian Programme and who are not in the care of a parent.
Provision for this funding has been included in the forward estimates and is not for publication due to ongoing negotiations with the States.
Visas — cessation of the Trade Skills Training Visa Expense ($m)
2007-08 2008-09 2009-10 2010-11
Department of Immigration and Citizenship -1.2 -1.1 -1.2 -1.2
Department of Education, Science and Training -2.2 -2.2 -2.3 -2.3
Total -3.3 -3.3 -3.4 -3.5
Related revenue ($m)
Department of Immigration and Citizenship .. .. .. ..
The Government has ceased the pilot programme for the Trade Skills Training Visa. The pilot, announced in the 2005-06 Budget, has experienced a significantly lower than expected application rate.
This measure is expected to lead to savings of $13.4 million over four years.

Appendix A: Policy decisions taken since the 2007-08 Budget
183
Visas — new work and holiday arrangements with the United States Expense ($m)
2007-08 2008-09 2009-10 2010-11
Department of Immigration and Citizenship 1.2 1.5 1.9 1.9
Related revenue ($m)
Department of Immigration and Citizenship 0.2 2.0 4.0 4.1
Related capital ($m)
Department of Immigration and Citizenship 1.1 - - -
The Government will provide $7.6 million over four years to implement a new reciprocal work and holiday visa arrangement with the United States of America (USA).
The purpose of this visa is to enable eligible applicants from the USA to holiday and travel in Australia and to undertake temporary work to supplement funds.
This measure includes $1.1 million in capital funding in 2007-08 for IT to support the new visa arrangement.
The cost of this measure will be offset by an increase in revenue of $10.2 million arising from additional visa charges.
Further information can be found in the press release of 5 September 2007 issued by the Assistant Minister for Immigration and Citizenship.

Appendix A: Policy decisions taken since the 2007-08 Budget
184
INDUSTRY, TOURISM AND RESOURCES
Australian Energy Market Council — additional funding Expense ($m)
2007-08 2008-09 2009-10 2010-11
Department of Industry, Tourism and Resources 1.5 - - -
The Government will provide $1.5 million in 2007-08 to the Australian Energy Market Council to enable it to undertake national electricity grid planning tasks assigned by the Council of Australian Governments (COAG) on 13 April 2007.
This measure builds on the recommendations in the Government’s Energy White Paper (2004) to promote reform and efficiencies in the national energy market.
This measure forms part of an agreement made by COAG on 13 April 2007. Further information can be found in the Communiqué available from www.coag.gov.au.
Climate change — Asia-Pacific Network for Energy Technology — establishment Expense ($m)
2007-08 2008-09 2009-10 2010-11
Department of Industry, Tourism and Resources 1.9 3.1 - -
The Government will provide $5.0 million over two years from 2007-08 to establish the Asia Pacific Network for Energy Technology (APNet).
The APNet initiative will improve linkages between researchers in the Asia-Pacific Economic Cooperation (APEC) region on emerging low emission energy and energy efficiency technologies, accelerating their development and contributing to medium and long-term reductions in greenhouse gas emissions.
This measure is part of the Government’s set of initiatives to support the APEC climate change agenda.
Further information can be found in the press release of 2 September 2007 issued by the Prime Minister.
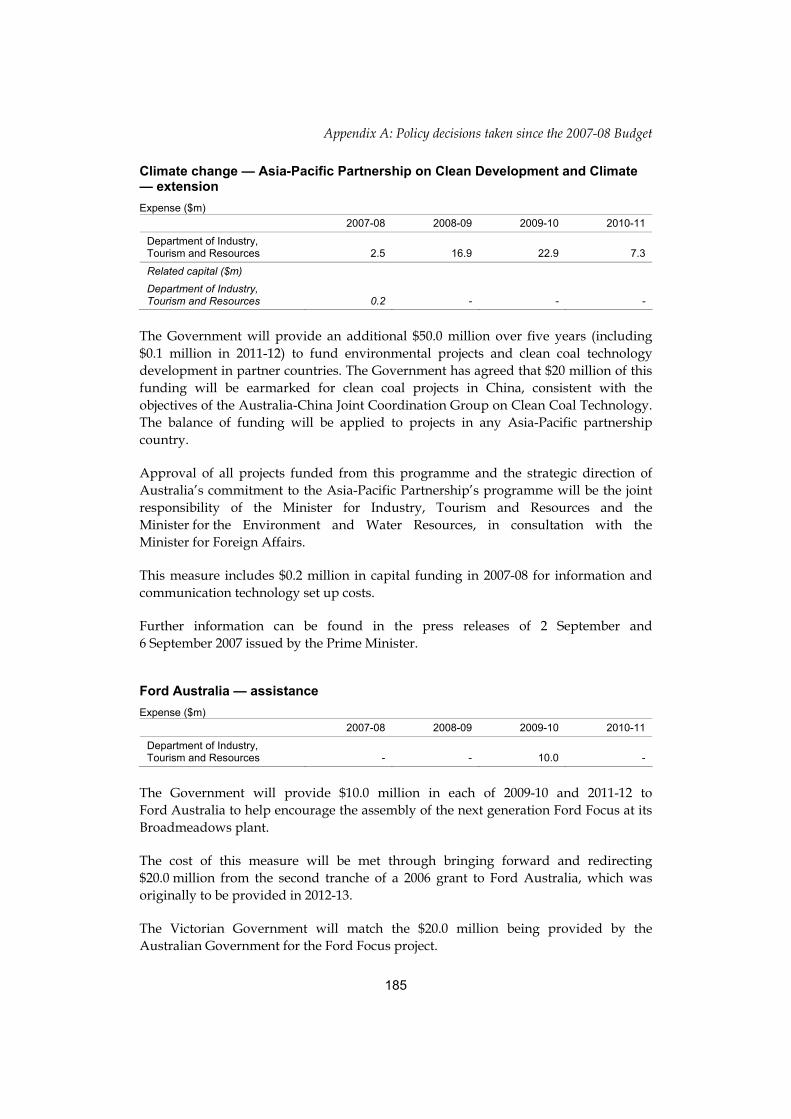
Appendix A: Policy decisions taken since the 2007-08 Budget
185
Climate change — Asia-Pacific Partnership on Clean Development and Climate — extension Expense ($m)
2007-08 2008-09 2009-10 2010-11
Department of Industry, Tourism and Resources 2.5 16.9 22.9 7.3
Related capital ($m)
Department of Industry, Tourism and Resources 0.2 - - -
The Government will provide an additional $50.0 million over five years (including $0.1 million in 2011-12) to fund environmental projects and clean coal technology development in partner countries. The Government has agreed that $20 million of this funding will be earmarked for clean coal projects in China, consistent with the objectives of the Australia-China Joint Coordination Group on Clean Coal Technology. The balance of funding will be applied to projects in any Asia-Pacific partnership country.
Approval of all projects funded from this programme and the strategic direction of Australia’s commitment to the Asia-Pacific Partnership’s programme will be the joint responsibility of the Minister for Industry, Tourism and Resources and the Minister for the Environment and Water Resources, in consultation with the Minister for Foreign Affairs.
This measure includes $0.2 million in capital funding in 2007-08 for information and communication technology set up costs.
Further information can be found in the press releases of 2 September and 6 September 2007 issued by the Prime Minister.
Ford Australia — assistance Expense ($m)
2007-08 2008-09 2009-10 2010-11
Department of Industry, Tourism and Resources - - 10.0 -
The Government will provide $10.0 million in each of 2009-10 and 2011-12 to Ford Australia to help encourage the assembly of the next generation Ford Focus at its Broadmeadows plant.
The cost of this measure will be met through bringing forward and redirecting $20.0 million from the second tranche of a 2006 grant to Ford Australia, which was originally to be provided in 2012-13.
The Victorian Government will match the $20.0 million being provided by the Australian Government for the Ford Focus project.

Appendix A: Policy decisions taken since the 2007-08 Budget
186
Further information can be found in the press release of 23 July 2007 issued by the Minister for Industry, Tourism and Resources.
FutureGen Alliance — membership Expense ($m)
2007-08 2008-09 2009-10 2010-11
Department of Industry, Tourism and Resources 15.0 - - -
The Government will provide $15.0 million in 2007-08 to secure membership in the FutureGen Alliance, which aims to develop a near-zero greenhouse emissions coal-fuelled power plant.
The FutureGen partnership is a public-private partnership led by the United States Department of Energy, and has a number of industry members from Australia, such as BHP Billiton, Xstrata and Rio Tinto.
Australia’s membership will provide access to the research programme and will give Australia a seat on the government steering committee which oversees the FutureGen project.
Further information can be found in the press release of 5 September 2007 issued by the Prime Minister.
Geelong Investment and Innovation Fund Expense ($m)
2007-08 2008-09 2009-10 2010-11
Department of Industry, Tourism and Resources 3.6 6.9 4.0 0.2
The Government will provide $14.6 million over five years (including $0.1 million in 2011-12) to establish the Geelong Investment and Innovation Fund, following the decision by Ford Australia to restructure its Geelong manufacturing operations.
The fund will provide structural adjustment assistance in the form of competitive, merit-based grants to local businesses and groups for new employment creation projects in the Geelong region of Victoria.
The new fund will consist of contributions from the Australian Government; $6.0 million from the Victorian Government; and $3.0 million from Ford Australia.
Further information can be found in the press release of 18 July 2007 issued by the Minister for Industry, Tourism and Resources.

Appendix A: Policy decisions taken since the 2007-08 Budget
187
Innovation Ambassador Programme Expense ($m)
2007-08 2008-09 2009-10 2010-11
Department of Industry, Tourism and Resources - - - -
The Government will provide $5.0 million over three years from 2008-09 for a new Innovation Ambassador Programme to promote innovation and entrepreneurship in the Australian community, particularly amongst small business and young Australians.
This measure will provide for innovation awareness activities for small business and young entrepreneurs; sponsorships that promote innovation and entrepreneurial achievement; and research to provide industry innovation intelligence to Government, with a view to enhancing the delivery and design of innovation programmes.
The cost of this measure will be met from within the existing resourcing of the Department of Industry, Tourism and Resources.
Further information can be found in the press release of 28 September 2007 issued by the Minister for Industry, Tourism and Resources.
World Youth Day — additional contribution Expense ($m)
2007-08 2008-09 2009-10 2010-11
Department of Industry, Tourism and Resources 15.0 - - -
The Government will provide an additional $15.0 million in 2007-08 to the Catholic Archdiocese of Sydney as a further contribution to the cost of hosting World Youth Day in Sydney from 15 to 20 July 2008.
This measure builds on a contribution of $20.0 million ($10.0 million in 2005-06 and $10.0 million in 2007-08) that was provided to the Archdiocese for this purpose in the 2006-07 Budget.

Appendix A: Policy decisions taken since the 2007-08 Budget
188
PRIME MINISTER AND CABINET
Asia-Pacific Economic Cooperation — additional funding for related activities Expense ($m)
2007-08 2008-09 2009-10 2010-11
Department of the Prime Minister and Cabinet 0.2 - - -
The Government will provide additional funding of $0.2 million in 2007-08 for activities related to the hosting of the Asia-Pacific Economic Cooperation (APEC) meeting of leaders, including provision of policy input and arrangements for bilateral meetings between the Prime Minister and the world leaders who were in Australia at the time of APEC.
Canada-Australia public policy initiative — establishment Expense ($m)
2007-08 2008-09 2009-10 2010-11
Department of the Prime Minister and Cabinet 0.4 0.9 0.7 0.9
The Government will provide $3.3 million over five years (including $0.3 million in 2011-12) to establish a public policy initiative between the Australian and Canadian Governments.
The objective of the initiative is to deepen the working relationship between the two governments by exploring public policy challenges. It includes an interchange programme, an annual retreat and an annual public lecture series.

Appendix A: Policy decisions taken since the 2007-08 Budget
189
TRANSPORT AND REGIONAL SERVICES
AusLink — additional AusLink National Network funding in 2007-08 and 2008-09 Expense ($m)
2007-08 2008-09 2009-10 2010-11
Department of Transport and Regional Services 20.0 80.0 - -100.0
The Government will provide additional funding of $100.0 million for AusLink National Network projects in 2007-08 and 2008-09. The $100.0 million is already included in the forward estimates as part of the 2009-10 to 2013-14 AusLink 2 programme. The funding will be brought forward from 2010-11 to allow for the early initiation of projects.
AusLink — inland rail Expense ($m)
2007-08 2008-09 2009-10 2010-11
Department of Transport and Regional Services 13.5 61.5 -75.0 -
The Government will provide $100.0 million over three years to the Australian Rail Track Corporation for the development of the AusLink rail network. This comprises $15.0 million for a scoping study involving the detailed planning and design work for a future inland rail corridor and $85.0 million for projects on existing sections of the AusLink rail network which could contribute to a future inland rail corridor.
Provision for the funding of $100.0 million is already included in the forward estimates as part of the 2009-10 to 2013-14 AusLink 2 programme. However, funding of $75.0 million will be brought forward from 2009-10 to allow for the commencement of these projects in 2007-08.
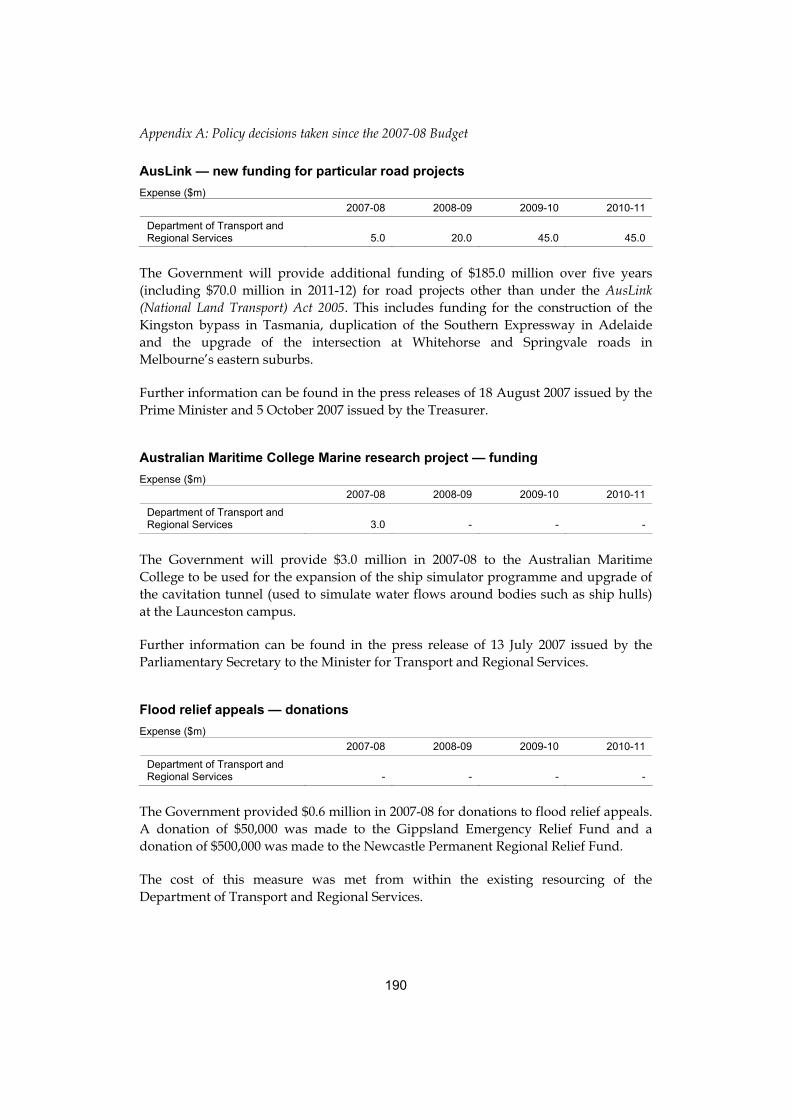
Appendix A: Policy decisions taken since the 2007-08 Budget
190
AusLink — new funding for particular road projects Expense ($m)
2007-08 2008-09 2009-10 2010-11
Department of Transport and Regional Services 5.0 20.0 45.0 45.0
The Government will provide additional funding of $185.0 million over five years (including $70.0 million in 2011-12) for road projects other than under the AusLink (National Land Transport) Act 2005. This includes funding for the construction of the Kingston bypass in Tasmania, duplication of the Southern Expressway in Adelaide and the upgrade of the intersection at Whitehorse and Springvale roads in Melbourne’s eastern suburbs.
Further information can be found in the press releases of 18 August 2007 issued by the Prime Minister and 5 October 2007 issued by the Treasurer.
Australian Maritime College Marine research project — funding Expense ($m)
2007-08 2008-09 2009-10 2010-11
Department of Transport and Regional Services 3.0 - - -
The Government will provide $3.0 million in 2007-08 to the Australian Maritime College to be used for the expansion of the ship simulator programme and upgrade of the cavitation tunnel (used to simulate water flows around bodies such as ship hulls) at the Launceston campus.
Further information can be found in the press release of 13 July 2007 issued by the Parliamentary Secretary to the Minister for Transport and Regional Services.
Flood relief appeals — donations Expense ($m)
2007-08 2008-09 2009-10 2010-11
Department of Transport and Regional Services - - - -
The Government provided $0.6 million in 2007-08 for donations to flood relief appeals. A donation of $50,000 was made to the Gippsland Emergency Relief Fund and a donation of $500,000 was made to the Newcastle Permanent Regional Relief Fund.
The cost of this measure was met from within the existing resourcing of the Department of Transport and Regional Services.

Appendix A: Policy decisions taken since the 2007-08 Budget
191
Further information can be found in the press release of 6 July 2007 issued by the Prime Minister.
Growing Regions Programme Expense ($m)
2007-08 2008-09 2009-10 2010-11
Department of Transport and Regional Services 2.5 30.0 40.0 75.0
The Government will provide $200.0 million over five years (including $52.5 million in 2011-12) for the Growing Regions Programme which will support local community projects that deal with the increasing demands on infrastructure, services and employment in regional Australia caused by rapid growth, structural change, population migration and population ageing. The Programme will provide funding of $1.0 million to $3.0 million per project. This measure will commence from 1 January 2008.
Further information can be found in the joint press release of 12 September 2007 issued by the Deputy Prime Minister and Minister for Transport and Regional Services.
Local government amalgamation — plebiscites in Queensland Expense ($m)
2007-08 2008-09 2009-10 2010-11
Department of Transport and Regional Services * * * *
The Australian Government has announced that the Australian Electoral Commission (AEC) will conduct, at the expense of the Australian Government, plebiscites about amalgamation proposals in local government areas in Queensland. Funding will be provided for payment to the AEC to offset any costs incurred by the AEC. The funding requirement cannot be determined at this stage as it will depend on the number of local government areas included in the plebiscites and the format for the plebiscites.
Further information can be found in the press release of 19 August 2007 issued by the Prime Minister.

Appendix A: Policy decisions taken since the 2007-08 Budget
192
Seat belts on regional school buses Expense ($m)
2007-08 2008-09 2009-10 2010-11
Department of Transport and Regional Services 10.0 10.0 10.0 10.0
The Government will provide $40.0 million over four years to increase the number of school buses equipped with seat belts for students in rural and regional areas. This measure will fund grants, to be paid directly to private rural and regional bus operators, of up to $25,000 per existing in-service bus to be fitted with seat belts. It is envisaged that it would fund the installation of seat belts in at least 1,500 regional school buses.
Further information can be found in the press release of 19 September 2007 issued by the Prime Minister.
Tasmanian freight subsidy arrangements — improved administration Expense ($m)
2007-08 2008-09 2009-10 2010-11
Department of Transport and Regional Services 1.8 0.7 0.7 0.8
The Government will provide $4.0 million over four years to improve the administration of the Tasmanian Freight Equalisation Scheme in response to the recommendations of the Productivity Commission inquiry into the Tasmanian Freight Subsidy Arrangements.
This measure includes payments to Centrelink of $0.9 million in 2007-08, $0.1 millon in 2008-09, $0.1 million in 2009-10 and $0.1 million in 2010-11 for improvements to its IT systems used to manage payments under the Scheme on behalf of the Department of Transport and Regional Services.
Further information can be found in the press release of 21 June 2007 issued by the Minister for Local Government, Territories and Roads.
Young District Medical Centre Expense ($m)
2007-08 2008-09 2009-10 2010-11
Department of Transport and Regional Services 0.1 - - -
The Government will provide $0.1 million in 2007-08 to contribute to the expansion of the Young District Medical Centre to accommodate a specialist GP Anaesthetist and to supply educational and training facilities for medical students and registrars.

Appendix A: Policy decisions taken since the 2007-08 Budget
193
TREASURY
National Plan for Water Security — Australian Competition and Consumer Commission regulatory arrangements Expense ($m)
2007-08 2008-09 2009-10 2010-11
Australian Competition and Consumer Commission 5.9 6.8 6.1 6.1
Department of the Environment and Water Resources -7.0 -6.8 -6.1 -6.1
Total -1.1 - - -
Related capital ($m)
Australian Competition and Consumer Commission 1.1 - - -
The Government will provide $65.5 million over 10 years, from the $10 billion National Plan for Water Security administered by the Department of the Environment and Water Resources, to support the Australian Competition and Consumer Commission (ACCC) in its role of providing advice to the Australian Government on the water charging and market rules to apply within the Murray-Darling Basin. The ACCC will also be responsible for enforcing these rules and will approve or determine bulk water charges.
The ACCC will also provide advice on the water charging implications of new Australian Government infrastructure investment under the National Plan for Water Security.
This measure includes $1.1 million in capital funding in 2007-08 for fit-out, office furniture and computers.
Regulations for private rulings requiring valuations Expense ($m)
2007-08 2008-09 2009-10 2010-11
Australian Taxation Office 8.2 13.3 6.5 6.3
The Government will provide $34.3 million over four years to make it easier for taxpayers to seek valuations as part of a private ruling.

Appendix A: Policy decisions taken since the 2007-08 Budget
194
Taxpayers will not be charged by the Australian Taxation Office for a review of a valuation where that valuation was conducted professionally by a member of an approved professional association. Where the taxpayer has not provided their own valuation, or the valuation they provided was not conducted by a member of an approved professional association, the Australian Taxation Office will retain the power to charge the taxpayer for the valuation process.
Further information can be found in the press release of 23 August 2007 issued by the Minister for Revenue and Assistant Treasurer.
Royal Australian Mint — information management system upgrade — Phase 2 Expense ($m)
2007-08 2008-09 2009-10 2010-11
Royal Australian Mint 2.7 2.2 1.0 1.0
Related capital ($m)
Royal Australian Mint 4.2 1.8 0.2 -
The Government will provide $13.1 million over four years (including $6.2 million in capital funding) to the Royal Australian Mint to support the implementation of Phase 2 of the upgrade of its information management and business systems.
The systems upgrade will integrate data across the Mint’s manufacturing and other business areas to provide enhanced information reporting, data management, and financial and human resource systems administration.
This funding is in addition to $0.5 million provided by the Government for implementing Phase 1. See the capital measure titled Royal Australian Mint – internal security and upgrade of associated systems in the 2007-08 Budget.
Further information can be found in the press release of 12 September 2007 issued by the Royal Australian Mint.
Screen media support package — further policy amendments Expense ($m)
2007-08 2008-09 2009-10 2010-11
Australian Taxation Office 2.1 1.1 1.1 1.1
Related revenue ($m)
Australian Taxation Office - -6.0 - -
Following consultation with the industry, the Government has amended some elements of the screen media support package announced in the 2007-08 Budget to better meet the objectives of the policy and the needs of the screen production industry in Australia, at an estimated cost of $11.4 million over four years.

Appendix A: Policy decisions taken since the 2007-08 Budget
195
Under the amendments:
• the 15 per cent location offset applies for large-budget productions commencing principal photography or production of the animated image from 8 May 2007, rather than 1 July 2007; and
• ‘one-off’ documentaries are eligible on the same basis as multiple episode documentaries and a common definition of ‘series’ applies across all media types.
To assist taxpayers to adjust to the phasing out of current film tax concessions, taxpayers are able to continue to utilise film tax concessions provided under Division 10B and 10BA of the Income Tax Assessment Act 1936 by allowing applications for certificates to be accepted up until the date of Royal Assent of the amending legislation, rather than 30 June 2007.
This measure relates to the Screen media support package of measures announced in the 2007-08 Budget, involving funding of $282.9 million over four years.
Further information can be found in the press releases of 3 August 2007 and 16 August 2007 issued by the Minister for the Arts and Sport.
Simplified Superannuation — additional funding for media coverage Expense ($m)
2007-08 2008-09 2009-10 2010-11
Australian Taxation Office 17.6 - - -
The Government will provide $17.6 million in 2007-08 for increased media coverage to ensure the community is fully informed of the changes delivered through the simplified superannuation reforms.
This measure relates to the Simplified Superannuation measures announced in the Mid-Year Economic and Fiscal Outlook 2006-07 and Simplified Superannuation – additional funding for implementation announced in the 2007-08 Budget.

Appendix A: Policy decisions taken since the 2007-08 Budget
196
Standard Business Reporting Expense ($m)
2007-08 2008-09 2009-10 2010-11
Australian Taxation Office 14.2 15.8 12.8 7.8
Department of the Treasury 9.9 9.9 14.6 4.7
Australian Bureau of Statistics 3.3 3.2 3.4 2.4
Australian Securities and Investments Commission 1.7 1.4 1.6 0.8
Australian Customs Service 1.6 - - -
Australian Prudential Regulation Authority 0.7 1.6 4.0 1.9
Department of Industry, Tourism and Resources 0.6 2.0 2.0 0.5
Department of Finance and Administration 0.3 1.0 0.3 -
Total 32.3 34.8 38.7 18.0
Related capital ($m)
Australian Taxation Office 9.6 19.4 3.5 -
Department of the Treasury 8.8 9.3 7.2 -
Australian Bureau of Statistics 5.9 4.8 3.8 0.9
Department of Industry, Tourism and Resources 2.1 1.3 1.1 -
Australian Securities and Investments Commission 1.5 3.2 1.0 -
Australian Prudential Regulation Authority - 1.9 1.0 -
Total 27.9 39.8 17.7 0.9
The Government will provide $210.2 million over four years to initiate the Standard Business Reporting programme. The programme aims to cut the red tape confronting business when reporting to government through better, more streamlined computer reporting systems. It will first target financial reporting, by allowing businesses to use a single, secure log-on to send financial information to the Australian Bureau of Statistics, the Australian Prudential Regulation Authority, the Australian Securities and Investments Commission, the Australian Taxation Office and, potentially, the State Revenue Offices.
This measure includes capital funding of $86.3 million for information and communications technology equipment.
The measure also includes $1.6 million in 2007-08 for the Australian Customs Service to develop electronic trade solutions.
This measure relates to the Standard Business Reporting measure announced in the 2007-08 Budget, involving funding of $7.3 million in 2006-07.
Further information can be found in the press release of 30 August 2007 issued by the Treasurer.

Appendix A: Policy decisions taken since the 2007-08 Budget
197
VETERANS’ AFFAIRS
Compensation — ex-gratia payment Expense ($m)
2007-08 2008-09 2009-10 2010-11
Department of Veterans’ Affairs - - - -
The Government will provide $10,000 in 2007-08 in ex-gratia assistance to compensate a Vietnam Veteran in consideration of his particular medical circumstances.
The cost of this measure will be met from within the existing resourcing of the Department of Veterans’ Affairs.
Veterans’ Disability Pension — changes to indexation and increases to the General and Extreme Disablement Adjustment Rates Expense ($m)
2007-08 2008-09 2009-10 2010-11
Department of Veterans’ Affairs 16.5 61.3 72.7 85.3
Department of Health and Ageing .. .. -0.1 -0.1
Department of Employment and Workplace Relations -0.1 -0.3 -0.3 -0.4
Department of Families, Community Services and Indigenous Affairs -0.4 -1.6 -2.0 -2.5
Total 16.1 59.5 70.3 82.3
Related capital ($m)
Department of Veterans’ Affairs 0.1 - - -
The Government will provide $235.9 million over four years to index the General Rate component of the veterans’ Disability Pension to movements in the Consumer Price Index and Male Total Average Weekly Earnings, whichever is the greater. The new indexation arrangements will apply from 20 March 2008. The Government will also increase the General Rate of the Disability Pension by 5 per cent and increase the Extreme Disablement Adjustment Rate by $15 per fortnight. The new indexation arrangements will benefit approximately 140,000 disability pensioners, including those on the Special, Intermediate and Extreme Disablement Adjustment Rates of the Disability Pension.
This measure includes $0.1 million in capital funding in 2007-08 to upgrade related computer systems.
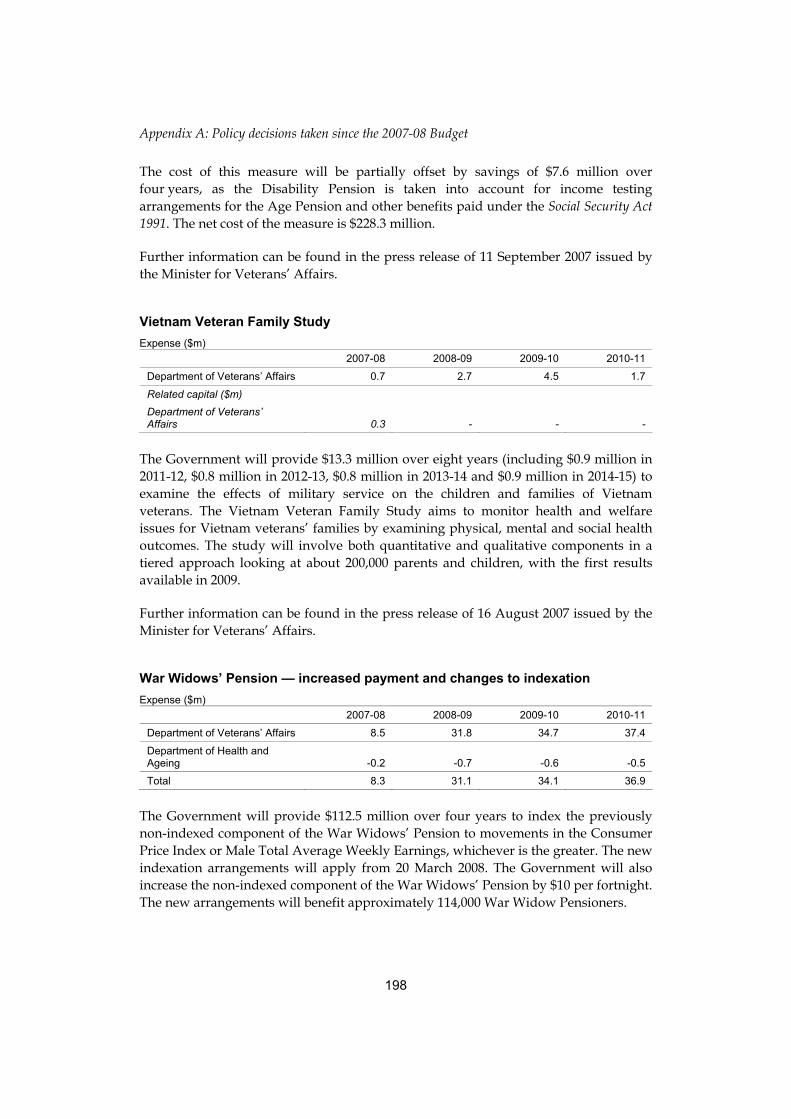
Appendix A: Policy decisions taken since the 2007-08 Budget
198
The cost of this measure will be partially offset by savings of $7.6 million over four years, as the Disability Pension is taken into account for income testing arrangements for the Age Pension and other benefits paid under the Social Security Act 1991. The net cost of the measure is $228.3 million.
Further information can be found in the press release of 11 September 2007 issued by the Minister for Veterans’ Affairs.
Vietnam Veteran Family Study Expense ($m)
2007-08 2008-09 2009-10 2010-11
Department of Veterans’ Affairs 0.7 2.7 4.5 1.7
Related capital ($m)
Department of Veterans’ Affairs 0.3 - - -
The Government will provide $13.3 million over eight years (including $0.9 million in 2011-12, $0.8 million in 2012-13, $0.8 million in 2013-14 and $0.9 million in 2014-15) to examine the effects of military service on the children and families of Vietnam veterans. The Vietnam Veteran Family Study aims to monitor health and welfare issues for Vietnam veterans’ families by examining physical, mental and social health outcomes. The study will involve both quantitative and qualitative components in a tiered approach looking at about 200,000 parents and children, with the first results available in 2009.
Further information can be found in the press release of 16 August 2007 issued by the Minister for Veterans’ Affairs.
War Widows’ Pension — increased payment and changes to indexation Expense ($m)
2007-08 2008-09 2009-10 2010-11
Department of Veterans’ Affairs 8.5 31.8 34.7 37.4
Department of Health and Ageing -0.2 -0.7 -0.6 -0.5
Total 8.3 31.1 34.1 36.9
The Government will provide $112.5 million over four years to index the previously non-indexed component of the War Widows’ Pension to movements in the Consumer Price Index or Male Total Average Weekly Earnings, whichever is the greater. The new indexation arrangements will apply from 20 March 2008. The Government will also increase the non-indexed component of the War Widows’ Pension by $10 per fortnight. The new arrangements will benefit approximately 114,000 War Widow Pensioners.

Appendix A: Policy decisions taken since the 2007-08 Budget
199
The cost of this measure will be partially offset by savings of $2.1 million over four years, as the War Widows’ Pension is taken into account for aged care income testing arrangements. The net cost of the measure is $110.4 million.
Further information can be found in the press release of 19 September 2007 issued by the Minister for Veterans’ Affairs.

Appendix A: Policy decisions taken since the 2007-08 Budget
200
CAPITAL MEASURES
EDUCATION, SCIENCE AND TRAINING
Department of Education, Science and Training central office fit-out Capital ($m)
2007-08 2008-09 2009-10 2010-11
Department of Education, Science and Training - - 20.0 -
The Government will provide $60.0 million in 2009-10 for the fit-out of a new building to accommodate the Department of Education, Science and Training in Canberra, of which $40.0 million will be funded from within the existing resourcing of the Department.
The new building will consolidate the Department’s Canberra accommodation, provide enhanced operational efficiency and facilitate greater levels of environmental performance.

Appendix A: Policy decisions taken since the 2007-08 Budget
201
FINANCE AND ADMINISTRATION
Intra-government Communications Network — capital funding Capital ($m)
2007-08 2008-09 2009-10 2010-11
Department of Finance and Administration - - - -
The Government will provide $4.2 million over five years for the development of the Intra-government Communications Network (ICON), a communications system providing dedicated point-to-point links for Australian Government agencies in Canberra through the use of underground fibre optic cables.
There is no fiscal balance impact because the additional expenditure by the Department of Finance and Administration will be offset by contributions from agencies using ICON.

Appendix A: Policy decisions taken since the 2007-08 Budget
202
HEALTH AND AGEING
National Medical Stockpile — replenishment Capital ($m)
2007-08 2008-09 2009-10 2010-11
Department of Health and Ageing - - - -
The Government will provide $29.3 million in 2007-08 to replace National Medical Stockpile pharmaceuticals and pandemic vaccination packs that expire in 2007-08. This will include purchasing pharmaceuticals to assist the health system in responding to a possible influenza pandemic or a chemical, biological or radiological incident.
The National Medical Stockpile was created in 2002 as a strategic reserve of medications and medical equipment to respond to potential mass casualty emergencies or health disasters.
The cost of this measure will be met from within the existing resourcing of the Department of Health and Ageing.

Appendix A: Policy decisions taken since the 2007-08 Budget
203
TRANSPORT AND REGIONAL SERVICES
Acquisition of land for a future embassy site Capital ($m)
2007-08 2008-09 2009-10 2010-11
National Capital Authority 3.0 - - -
The Government will provide funding of $3.0 million in 2007-08 to acquire and develop land in Yarralumla for a future embassy site.
Christmas Island Immigration Reception and Processing Centre — replacement of power cables Capital ($m)
2007-08 2008-09 2009-10 2010-11
Department of Transport and Regional Services 5.0 - - -
The Government will provide funding of $5.0 million in 2007-08 for the replacement of faulty power cables on Christmas Island to ensure a reliable power supply to the Christmas Island Immigration Reception and Processing Centre.

Appendix A: Policy decisions taken since the 2007-08 Budget
204
TREASURY
Royal Australian Mint — refurbishment Capital ($m)
2007-08 2008-09 2009-10 2010-11
Royal Australian Mint 8.5 8.0 - -
Department of Finance and Administration 8.2 0.5 - -
Total 16.7 8.5 - -
Related expense ($m)
Royal Australian Mint - 0.1 0.2 0.2
The Government will provide $25.6 million over four years to complete the refurbishment of the Royal Australian Mint building.
This measure includes funding of $16.9 million over four years to the Royal Australian Mint for tenancy-related fit-out costs and process engineering improvements to coin proof and tool rooms; and $8.7 million over two years to the Department of Finance and Administration for base building works.
This funding is in addition to $41.2 million provided in the 2005-06 Budget measure, Royal Australian Mint buildings – refurbishment. The current capital works represent the first major refurbishment of the building since it was purpose-built in 1965.

205
APPENDIX B: GOVERNMENT FINANCE STATISTICS STATEMENTS
Financial tables presented in this Appendix are prepared in accordance with the Australian Bureau of Statistics’ (ABS) accrual Government Finance Statistics (GFS) framework.
The tables include an operating statement, balance sheet and cash flow statement for the Australian Government general government, public non-financial corporations and total non-financial public sectors. A statement of other economic flows is also included for the Australian Government general government sector.
The Australian, State and Territory Governments have an agreed framework — the Accrual Uniform Presentation Framework — for the presentation of government financial information on a basis consistent with the ABS GFS publication. This Appendix presents Australian Government data on an ABS GFS basis, as required by the Accrual Uniform Presentation Framework, except for the departures (other than in relation to the treatment of goods and services tax (GST)) detailed in Attachment A to Part 4.
The only difference between the Australian Government general government sector statements in Part 4 and this Appendix is the treatment of the GST. The clear policy intent of the Intergovernmental Agreement on the Reform of Commonwealth-State Financial Relations is that GST is collected by the Australian Taxation Office, as an agent for the States and Territories (the States), and appropriated to the States. Consequently, it is not shown as Australian Government revenue in other parts in this document. However, the tables in this Appendix show GST as taxation revenue and payments to the States as grant expenses.
As a result of the different treatments of GST related transactions, fiscal balance, net operating balance and net worth estimates in this Appendix differ from those reported elsewhere in this document. This difference represents the effect of GST revenue accrued but not yet received and, therefore, not yet paid or payable to the States (as GST obligations to the States are on a cash basis).1 The cash flows presented in this statement include GST (except in respect to GST flows internal to the general government sector). The GFS cash surplus/deficit is not affected and provides identical results under both treatments of GST receipts.
Transactions between the Australian Government general government and public non-financial corporations sectors are included in the relevant tables, but removed
1 Table E3 in Appendix E shows the difference in the net operating and fiscal balance estimates resulting from the two treatments. The change in expenses when moving between the two GFS presentations of the estimates is less than the change in revenue.

Appendix B: Government Finance Statistics statements
206
from the total non-financial public sector tables as they are transactions internal to that sector.
Computer software and other intangibles are recorded at historic costs, as an active market is not observable for such assets. This affects the public non-financial corporations sector balance sheet, but does not affect the general government sector balance sheet.
Appendix E provides reconciliations between key GFS aggregates and their Australian Accounting Standards counterparts.
In accordance with Accrual Uniform Presentation Framework requirements, this Appendix also contains an update of the Australian Government’s Loan Council Allocation.
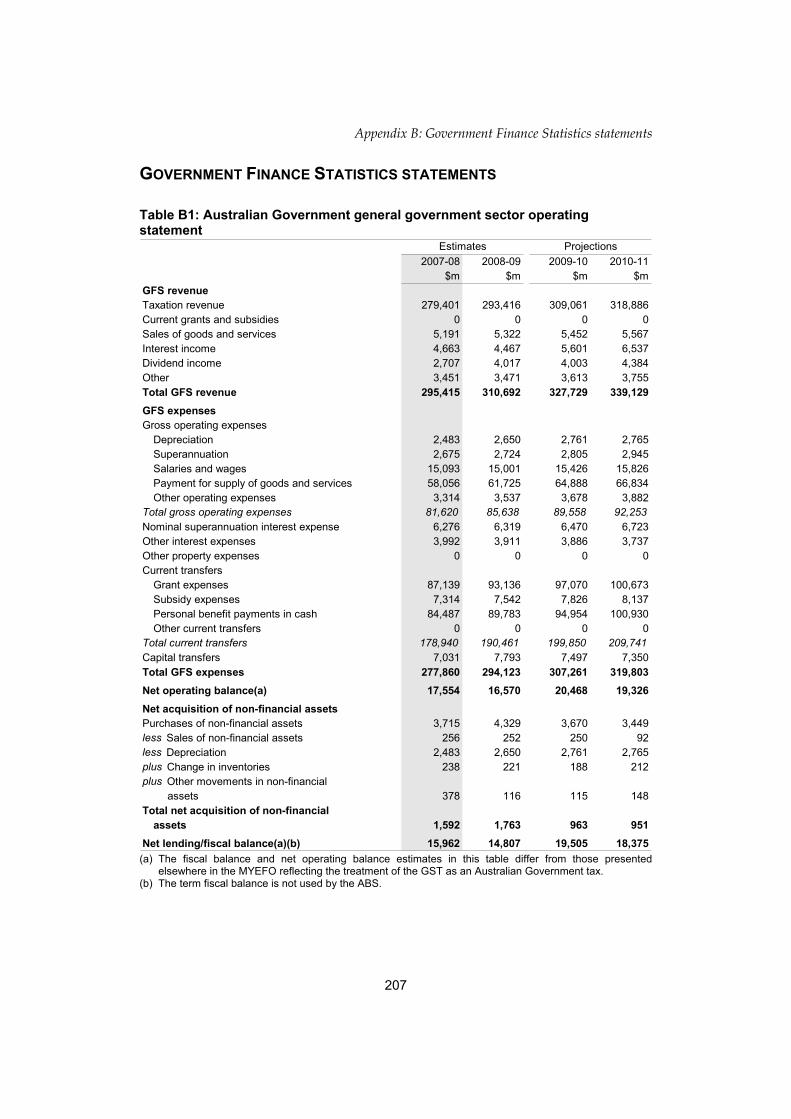
Appendix B: Government Finance Statistics statements
207
GOVERNMENT FINANCE STATISTICS STATEMENTS
Table B1: Australian Government general government sector operating statement
2007-08 2008-09 2009-10 2010-11$m $m $m $m
GFS revenueTaxation revenue 279,401 293,416 309,061 318,886Current grants and subsidies 0 0 0 0Sales of goods and services 5,191 5,322 5,452 5,567Interest income 4,663 4,467 5,601 6,537Dividend income 2,707 4,017 4,003 4,384Other 3,451 3,471 3,613 3,755Total GFS revenue 295,415 310,692 327,729 339,129GFS expensesGross operating expenses
Depreciation 2,483 2,650 2,761 2,765Superannuation 2,675 2,724 2,805 2,945Salaries and wages 15,093 15,001 15,426 15,826Payment for supply of goods and services 58,056 61,725 64,888 66,834Other operating expenses 3,314 3,537 3,678 3,882
Total gross operating expenses 81,620 85,638 89,558 92,253Nominal superannuation interest expense 6,276 6,319 6,470 6,723Other interest expenses 3,992 3,911 3,886 3,737Other property expenses 0 0 0 0Current transfers
Grant expenses 87,139 93,136 97,070 100,673Subsidy expenses 7,314 7,542 7,826 8,137Personal benefit payments in cash 84,487 89,783 94,954 100,930Other current transfers 0 0 0 0
Total current transfers 178,940 190,461 199,850 209,741Capital transfers 7,031 7,793 7,497 7,350Total GFS expenses 277,860 294,123 307,261 319,803Net operating balance(a) 17,554 16,570 20,468 19,326Net acquisition of non-financial assetsPurchases of non-financial assets 3,715 4,329 3,670 3,449less Sales of non-financial assets 256 252 250 92less Depreciation 2,483 2,650 2,761 2,765plus Change in inventories 238 221 188 212plus Other movements in non-financial
assets 378 116 115 148Total net acquisition of non-financial
assets 1,592 1,763 963 951Net lending/fiscal balance(a)(b) 15,962 14,807 19,505 18,375
Estimates Projections
(a) The fiscal balance and net operating balance estimates in this table differ from those presented
elsewhere in the MYEFO reflecting the treatment of the GST as an Australian Government tax. (b) The term fiscal balance is not used by the ABS.

Appendix B: Government Finance Statistics statements
208
Table B2: Australian Government general government sector balance sheet
2007-08 2008-09 2009-10 2010-11$m $m $m $m
GFS assetsFinancial assets
Cash and deposits 1,043 1,135 1,018 1,420Advances paid 25,013 26,132 27,062 28,197Investments, loans and placements 57,039 74,542 91,902 100,089Other non-equity assets 30,625 30,567 31,363 32,756Equity(a) 72,191 74,229 77,567 81,154
Total financial assets 185,911 206,605 228,912 243,616Non-financial assets
Land 6,940 6,972 6,900 7,016Buildings 16,981 18,258 19,122 20,062Plant, equipment and infrastructure 10,931 11,084 11,049 10,784Inventories 3,486 3,610 3,788 3,971Heritage and cultural assets 8,245 8,258 8,280 8,294Other non-financial assets 3,090 3,206 3,251 3,307
Total non-financial assets 49,673 51,387 52,389 53,433Total GFS assets 235,584 257,992 281,301 297,049GFS liabilitiesDeposits held 263 263 263 263Advances received 0 0 0 0Government securities 59,288 59,469 58,917 50,947Loans 7,085 6,801 6,556 6,610Other borrowing 365 824 784 741Superannuation liability 106,879 110,654 114,379 118,158Other employee entitlements and provisions 8,479 8,829 9,204 9,645Other non-equity liabilities 26,381 26,724 26,862 27,403Total GFS liabilities 208,739 213,563 216,964 213,767Net worth(b)(c) 26,845 44,429 64,337 83,283Net financial worth(d) -22,828 -6,959 11,948 29,849Net debt(e)(f) -16,094 -34,452 -53,463 -71,145
Estimates Projections
(a) Equity includes share holdings of the Future Fund. (b) The net worth estimates in this table differ from those presented elsewhere in the MYEFO reflecting the
treatment of GST as an Australian Government tax. (c) Net worth is calculated as total assets minus total liabilities. (d) Net financial worth equals total financial assets minus total liabilities. That is, it excludes non-financial
assets. (e) Net debt equals the sum of deposits held, advances received, government securities, loans and other
borrowing, minus the sum of cash and deposits, advances paid, and investments, loans and placements. (f) Includes the impact of the sale of the Government’s holding in Telstra. The net debt estimate in 2007-08
assumes that the Future Fund will increasingly be invested in equities, which are not included in the calculation of net debt.

Appendix B: Government Finance Statistics statements
209
Table B3: Australian Government general government sector cash flow statement(a)
2007-08 2008-09 2009-10 2010-11$m $m $m $m
Cash receipts from operating activitiesTaxes received(b) 274,115 287,539 303,088 312,667Receipts from sales of goods and services(c) 5,188 5,338 5,448 5,560Grants and subsidies received 0 0 0 0Interest receipts 4,482 4,185 5,310 6,240Dividends 2,692 4,017 3,983 4,434GST input credits received by
general government(c) 0 0 0 0Other receipts 3,150 3,356 3,509 3,654Total operating receipts 289,628 304,436 321,337 332,554Cash payments for operating activitiesPayments for goods and services(c) -57,977 -61,506 -64,660 -66,736Grants and subsidies paid(d) -98,849 -104,678 -109,687 -113,683Interest paid -3,646 -3,594 -3,472 -4,472Personal benefit payments -83,983 -89,519 -94,799 -100,632Salaries, wages and other entitlements -20,044 -20,218 -20,884 -21,659GST payments by general government to
taxation authority(c) 0 0 0 0Other payments for operating activities -3,272 -3,517 -3,577 -3,682Total operating payments -267,771 -283,032 -297,080 -310,864Net cash flows from operating activities 21,857 21,404 24,257 21,690Cash flows from investments in
non-financial assetsSales of non-financial assets 301 258 254 88Purchases of non-financial assets -3,938 -3,698 -3,568 -3,371Net cash flows from investments in
non-financial assets -3,637 -3,440 -3,313 -3,283Net cash flows from investments in
financial assets for policy purposes 4,550 891 -1,806 -2,008Cash flows from investments in
financial assets for liquidity purposesIncrease in investments -24,884 -18,415 -18,010 -8,773Net cash flows from investments in
financial assets for liquidity purposes -24,884 -18,415 -18,010 -8,773Cash flows from financing activitiesAdvances received (net) 0 0 0 0Borrowing (net) 2,542 167 -699 -6,995Deposits received (net) 0 0 0 0Other financing (net) -540 -516 -546 -229Net cash flows from financing activities 2,002 -349 -1,245 -7,224Net increase/decrease in cash held -112 92 -117 402
Estimates Projections

Appendix B: Government Finance Statistics statements
210
Table B3: Australian Government general government sector cash flow statement(a) (continued)
Projections2007-08 2008-09 2009-10 2010-11
$m $m $m $mNet cash from operating activities
and investments in non-financial assets 18,220 17,964 20,944 18,407Finance leases and similar arrangements(e) -4 -502 -6 0Equals surplus(+)/deficit(-) 18,216 17,463 20,938 18,406
Estimates
(a) A positive number denotes a cash inflow; a negative sign denotes a cash outflow. (b) Includes GST cash receipts on an Australian Government tax basis, which is $47 million higher in
2007-08 than GST cash receipts measured on a State tax basis (as shown in Appendix C, Note 16). (c) GST flows are excluded from these categories. (d) Includes GST cash payments on an Australian Government tax basis. (e) The acquisition of assets under finance leases decreases the surplus or increases the deficit. The
disposal of assets previously held under finance leases increases the surplus or decreases the deficit.

Appendix B: Government Finance Statistics statements
211
Table B4: Australian Government general government sector statement of other economic flows (reconciliation of net worth)
2007-08 2008-09 2009-10 2010-11$m $m $m $m
Opening net worth 2,689 26,845 44,429 64,337Opening net worth adjustments(a) 8,291 0 0 0Adjusted opening net worth 10,980 26,845 44,429 64,337Change in net worth from operating
transactions 17,554 16,570 20,468 19,326Change in net worth from other
economic flowsRevaluation of equity(b) 608 3,866 2,627 2,917Net writedowns of assets
(including bad and doubtful debts) -2,229 -2,338 -2,595 -2,704Assets recognised for the first time 7 4 19 12Liabilities recognised for the first time 0 0 0 0Actuarial revaluations 0 0 0 0Net foreign exchange gains 0 0 0 0Net swap interest received -113 -127 -109 -99Market valuation of debt -381 152 117 125Other economic revaluations(c) 419 -543 -619 -632
Total other economic flows -1,689 1,014 -559 -381Closing net worth 26,845 44,429 64,337 83,283
Estimates Projections
(a) Adjustment to net worth arising mainly from a change in accounting policy for education grants. (b) Revaluations of equity reflects changes in the market valuation of investments. This line also reflects any
equity revaluations at the point of disposal or sale. (c) Largely reflects revaluation of assets and liabilities.

Appendix B: Government Finance Statistics statements
212
Table B5: Australian Government public non-financial corporations operating statement
Estimates2007-08
$mGFS revenueCurrent grants and subsidies 50Sales of goods and services 6,840Interest income 79Other 2Total GFS revenue 6,970GFS expensesGross operating expensesDepreciation 292Salaries, wages and other entitlements 2,946Other operating expenses 2,858Total gross operating expenses 6,096Interest expenses 48Other property expenses 352Current transfersTax expenses 316Other current transfers 0Total current transfers 316Capital transfers 0Total GFS expenses 6,812Net operating balance 158Net acquisition of non-financial assetsPurchases of non-financial assets 1,241less Sales of non-financial assets 58less Depreciation 292plus Change in inventories 19plus Other movements in non-financial assets -139Total net acquisition of non-financial assets 771Net lending/fiscal balance(a) -612 (a) The term fiscal balance is not used by the ABS.

Appendix B: Government Finance Statistics statements
213
Table B6: Australian Government public non-financial corporations balance sheet
Estimates2007-08
$mGFS assetsFinancial assets
Cash and deposits 1,155Advances paid 0Investments, loans and placements 1,945Other non-equity assets 855Equity 439
Total financial assets 4,394Non-financial assets
Land and fixed assets 4,215Other non-financial assets(a) 171
Total non-financial assets 4,386Total GFS assets 8,780GFS liabilitiesDeposits held 0Advances received 0Borrowing 744Unfunded superannuation liability and other employee entitlements 1,015Provisions (other than depreciation and bad and doubtful debts)(a) 610Other non-equity liabilities 710Total GFS liabilities 3,079Shares and other contributed capital 5,700Net worth(b) 0Net financial worth(c) -4,386Net debt(d) -2,355 (a) Includes the elimination of commercial taxation adjustments. (b) Net worth is calculated as total assets minus total liabilities minus shares and other contributed capital. A
zero net worth is recorded as shares and contributed capital for the non-financial corporations controlled by the Government are valued at net assets (a proxy for market value for unlisted companies).
(c) Net financial worth equals total financial assets minus total liabilities minus shares and other contributed capital. That is, it excludes non-financial assets.
(d) Net debt equals the sum of deposits held, advances received and borrowing, minus the sum of cash and deposits, advances paid, and investments, loans and placements.

Appendix B: Government Finance Statistics statements
214
Table B7: Australian Government public non-financial corporations cash flow statement(a)
Estimates2007-08
$mCash receipts from operating activitiesReceipts from sales of goods and services 7,220Grants and subsidies received 0GST input credit receipts 290Other receipts 167Total operating receipts 7,678Cash payments for operating activitiesPayment for goods and services -3,120Interest paid -45Salaries, wages and other entitlements -2,793GST payments to taxation authority -522Other payments for operating activities -244Total operating payments -6,723Net cash flows from operating activities 954Cash flows from investments in non-financial assetsSales of non-financial assets 58Purchases of non-financial assets -1,093Net cash flows from investments in non-financial assets -1,035Net cash flows from investments in financial assets
for policy purposes 0Cash flows from investments in financial assets
for liquidity purposesIncrease in investments 345Net cash flows from investments in financial assets
for liquidity purposes 345Cash flows from financing activitiesAdvances received (net) 0Borrowing (net) 91Deposits received (net) 0Distributions paid (net) -428Other financing (net) 103Net cash flows from financing activities -234Net increase/decrease in cash held 30Net cash from operating activities and investments in
non-financial assets -81Finance leases and similar arrangements(b) 0Distributions paid -428Equals surplus(+)/deficit(-) -509 (a) A positive number denotes a cash inflow; a negative sign denotes a cash outflow. (b) The acquisition of assets under finance leases decreases the surplus or increases the deficit. The
disposal of assets previously held under finance leases increases the surplus or decreases the deficit.

Appendix B: Government Finance Statistics statements
215
Table B8: Australian Government total non-financial public sector operating statement
Estimates2007-08
$mGFS revenueTaxation revenue 279,086Current grants and subsidies 0Sales of goods and services 11,352Interest income 4,742Dividend income 2,355Other 3,453Total GFS revenue 300,988GFS expensesGross operating expenses
Depreciation 2,775Superannuation 2,778Salaries and wages 18,039Payment for supply of goods and services 60,132Other operating expenses 3,314
Total gross operating expenses 87,038Nominal superannuation interest expense 6,276Other interest expenses 4,040Other property expenses 0Current transfers
Grant expenses 87,139Subsidy expenses 7,264Personal benefit payments in cash 84,487Other current transfers 0
Total current transfers 178,890Capital transfers 7,031Total GFS expenses 283,276Net operating balance 17,712Net acquisition of non-financial assets Purchases of non-financial assets 4,956less Sales of non-financial assets 314less Depreciation 2,775plus Change in inventories 257plus Other movements in non-financial assets 239Total net acquisition of non-financial assets 2,363Net lending/fiscal balance(a) 15,350 (a) The term fiscal balance is not used by the ABS.
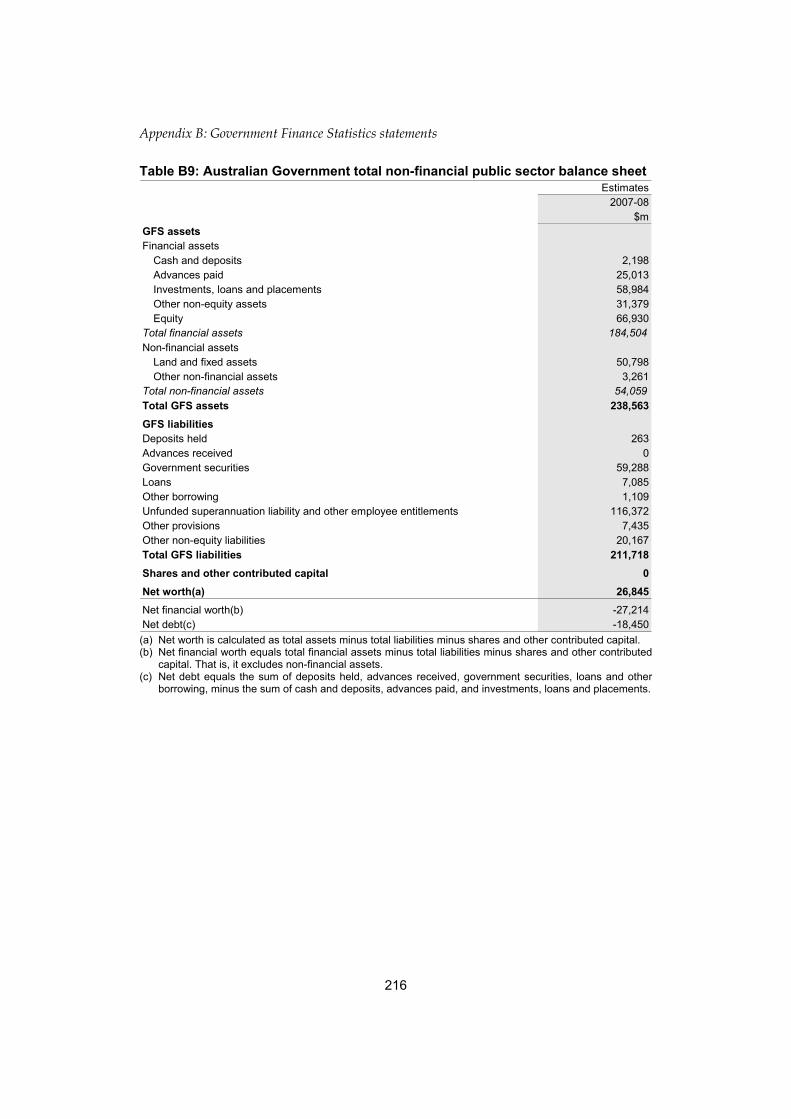
Appendix B: Government Finance Statistics statements
216
Table B9: Australian Government total non-financial public sector balance sheet Estimates
2007-08$m
GFS assetsFinancial assets
Cash and deposits 2,198Advances paid 25,013Investments, loans and placements 58,984Other non-equity assets 31,379Equity 66,930
Total financial assets 184,504Non-financial assets
Land and fixed assets 50,798Other non-financial assets 3,261
Total non-financial assets 54,059Total GFS assets 238,563GFS liabilitiesDeposits held 263Advances received 0Government securities 59,288Loans 7,085Other borrowing 1,109Unfunded superannuation liability and other employee entitlements 116,372Other provisions 7,435Other non-equity liabilities 20,167Total GFS liabilities 211,718Shares and other contributed capital 0Net worth(a) 26,845Net financial worth(b) -27,214Net debt(c) -18,450 (a) Net worth is calculated as total assets minus total liabilities minus shares and other contributed capital. (b) Net financial worth equals total financial assets minus total liabilities minus shares and other contributed
capital. That is, it excludes non-financial assets. (c) Net debt equals the sum of deposits held, advances received, government securities, loans and other
borrowing, minus the sum of cash and deposits, advances paid, and investments, loans and placements.

Appendix B: Government Finance Statistics statements
217
Table B10: Australian Government total non-financial public sector cash flow statement(a)
Estimates2007-08
$mCash receipts from operating activitiesTaxes received 273,800Receipts from sales of goods and services(b) 11,819Grants and subsidies received 0Interest receipts 4,555Dividends 2,302GST input credit receipts(b) 0Other receipts 3,207Total operating receipts 295,682Cash payments for operating activitiesPayments for goods and services(b) -60,739Grants and subsidies paid -98,849Interest paid -3,691Personal benefit payments -83,983Salaries, wages and other entitlements -22,838GST payments to taxation authority(b) 0Other payments for operating activities -3,200Total operating payments -273,299Net cash flows from operating activities 22,383Cash flows from investments in non-financial assetsSales of non-financial assets 359Purchases of non-financial assets -5,031Net cash flows from investments in non-financial assets -4,672Net cash flows from investments in financial assets
for policy purposes 4,550Cash flows from investments in financial assets
for liquidity purposesIncrease in investments -24,539Net cash flows from investments in financial assets
for liquidity purposes -24,539Cash flows from financing activitiesAdvances received (net) 0Borrowing (net) 2,632Deposits received (net) 0Distributions paid (net) 0Other financing (net) -437Net cash flows from financing activities 2,195Net increase/decrease in cash held -83Net cash from operating activities and investments
in non-financial assets 17,711Finance leases and similar arrangements(c) -4Distributions paid 0Equals surplus(+)/deficit(-) 17,707 (a) A positive number denotes a cash inflow; a negative sign denotes a cash outflow. (b) GST flows are excluded from these categories. (c) The acquisition of assets under finance leases decreases the surplus or increases the deficit. The
disposal of assets previously held under finance leases increases the surplus or decreases the deficit.

Appendix B: Government Finance Statistics statements
218
AUSTRALIAN LOAN COUNCIL ALLOCATION
Under Loan Council arrangements, every year the Australian Government and each State and Territory Government nominate a Loan Council Allocation. A jurisdiction’s Loan Council Allocation incorporates:
• the estimated non-financial public sector GFS cash deficit/surplus (made up from the general government and public non-financial corporations sector balances);
• net cash flows from investments in financial assets for policy purposes; and
• memorandum items, which involve transactions that are not formally borrowings but nevertheless have many of the characteristics of borrowings.
Loan Council Allocation nominations are considered by the Loan Council, having regard to each jurisdiction’s fiscal position and infrastructure requirements, as well as the macroeconomic implications of the aggregate figure.
In March 2007, the Australian Government nominated, and the Loan Council endorsed, a Loan Council Allocation surplus of $17,163 million. In the 2007-08 Budget, the Australian Government estimated a Loan Council Allocation surplus of $17,905 million.
Table B11 presents a revised estimate for the Australian Government’s 2007-08 Loan Council Allocation of a $22,483 million surplus.
Table B11: Australian Government Loan Council Allocation for 2007-08 2007-08 Budget 2007-08 MYEFO
Estimate Estimate$m $m
General government sector cash deficit(+)/surplus(-) -13,628 -18,216PNFC sector cash deficit(+)/surplus(-) 756 509Non-financial public sector cash deficit(+)/surplus(-) -12,872 -17,707less Net cash flows from investments
in financial assets for policy purposes(a) 4,652 4,550plus Memorandum items(b) -382 -226Loan Council Allocation -17,905 -22,483
(a) Such transactions involve the transfer or exchange of a financial asset and are not included within the cash deficit/surplus. However, the cash flow from investments in financial assets for policy purposes has implications for a government’s call on financial markets.
(b) For the Australian Government, memorandum items comprise the change in net present value (NPV) of operating leases (with NPV greater than $5 million) and over-funding of superannuation.
219
APPENDIX C: AUSTRALIAN ACCOUNTING STANDARDS FINANCIAL STATEMENTS
This Appendix presents financial statements that have been prepared on an accrual basis in accordance with applicable Australian Accounting Standards (AAS), being the Australian Equivalents to International Financial Reporting Standards (AEIFRS) and AAS 31 Financial Reporting by Governments, except where departures from the standard are identified in Note 1.
A reconciliation of the Australian Government’s general government sector AAS income, expenses and operating result with the general government sector Government Finance Statistics (GFS) revenue, expenses and operating balance is provided in Appendix E.

Appendix C: Australian Accounting Standards financial statements
220
Table C1: Australian Government general government sector income statement
2007-08 2008-09 2009-10 2010-11Note $m $m $m $m
RevenuesTaxation
Income tax 3 203,060 213,190 226,280 233,040Indirect tax 4 30,411 31,071 31,391 31,761Other taxes 2,199 2,322 2,219 2,283
Total taxation revenue 235,670 246,583 259,890 267,084Non-taxation
Sales of goods and services 5,191 5,322 5,452 5,567Interest and dividends 5 8,670 9,333 10,173 11,214Other sources of non-tax revenue 6 3,674 3,675 3,814 3,959
Total non-tax revenue 17,536 18,330 19,439 20,740Total revenue 253,206 264,913 279,330 287,824Gains
Net foreign exchange gains 0 0 0 0Net gains from sale of assets 18 1,523 0 4Other gains 976 3,452 4,248 4,534
Total gains 994 4,975 4,248 4,538Income 254,199 269,888 283,578 292,362ExpensesGoods and services
Employees 7 27,357 27,580 28,379 29,376Suppliers 8 23,365 23,324 23,133 23,063Depreciation and amortisation 9 5,221 5,390 5,358 5,241Net write-down and impairment of
assets and fair value losses 3,692 3,752 3,865 3,968Net foreign exchange losses 0 0 0 0Net losses from sale of assets 0 0 0 0Other goods and services expenses 10 8,333 8,795 9,589 10,294
Total goods and services 67,969 68,841 70,323 71,940Subsidies benefits and grants
Personal benefits 102,878 109,605 116,214 123,694Subsidies 12,897 13,612 14,363 14,758Grants 11 48,410 51,578 52,779 53,609
Total subsidies benefits and grants 164,185 174,795 183,356 192,061Borrowing costs
Interest 5,677 5,261 4,964 4,562Other borrowing costs 303 357 382 282
Total interest and other borrowing costs 5,980 5,619 5,347 4,844
Total expenses 238,133 249,255 259,026 268,845Operating result 16,066 20,634 24,552 23,517
Estimates Projections
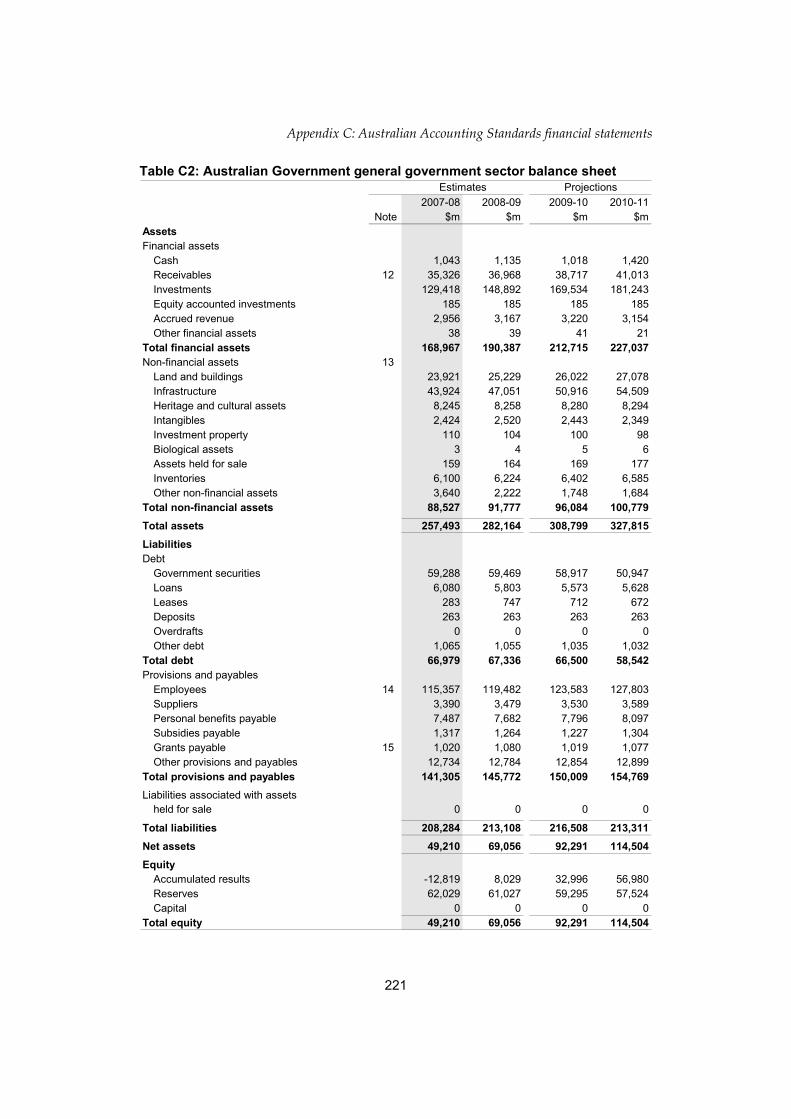
Appendix C: Australian Accounting Standards financial statements
221
Table C2: Australian Government general government sector balance sheet
2007-08 2008-09 2009-10 2010-11Note $m $m $m $m
AssetsFinancial assets
Cash 1,043 1,135 1,018 1,420Receivables 12 35,326 36,968 38,717 41,013Investments 129,418 148,892 169,534 181,243Equity accounted investments 185 185 185 185Accrued revenue 2,956 3,167 3,220 3,154Other financial assets 38 39 41 21
Total financial assets 168,967 190,387 212,715 227,037Non-financial assets 13
Land and buildings 23,921 25,229 26,022 27,078Infrastructure 43,924 47,051 50,916 54,509Heritage and cultural assets 8,245 8,258 8,280 8,294Intangibles 2,424 2,520 2,443 2,349Investment property 110 104 100 98Biological assets 3 4 5 6Assets held for sale 159 164 169 177Inventories 6,100 6,224 6,402 6,585Other non-financial assets 3,640 2,222 1,748 1,684
Total non-financial assets 88,527 91,777 96,084 100,779Total assets 257,493 282,164 308,799 327,815LiabilitiesDebt
Government securities 59,288 59,469 58,917 50,947Loans 6,080 5,803 5,573 5,628Leases 283 747 712 672Deposits 263 263 263 263Overdrafts 0 0 0 0Other debt 1,065 1,055 1,035 1,032
Total debt 66,979 67,336 66,500 58,542Provisions and payables
Employees 14 115,357 119,482 123,583 127,803Suppliers 3,390 3,479 3,530 3,589Personal benefits payable 7,487 7,682 7,796 8,097Subsidies payable 1,317 1,264 1,227 1,304Grants payable 15 1,020 1,080 1,019 1,077Other provisions and payables 12,734 12,784 12,854 12,899
Total provisions and payables 141,305 145,772 150,009 154,769Liabilities associated with assets
held for sale 0 0 0 0
Total liabilities 208,284 213,108 216,508 213,311Net assets 49,210 69,056 92,291 114,504Equity
Accumulated results -12,819 8,029 32,996 56,980Reserves 62,029 61,027 59,295 57,524Capital 0 0 0 0
Total equity 49,210 69,056 92,291 114,504
Estimates Projections

Appendix C: Australian Accounting Standards financial statements
222
Tabl
e C
3: A
ustr
alia
n G
over
nmen
t gen
eral
gov
ernm
ent s
ecto
r sta
tem
ent o
f cha
nges
in e
quity
A
ccum
ulat
ed re
sults
Ass
et re
valu
atio
nO
ther
rese
rves
Con
tribu
ted
Tota
l equ
ityre
serv
eeq
uity
/cap
ital
2007
-08
2008
-09
2007
-08
2008
-09
2007
-08
2008
-09
2007
-08
2008
-09
2007
-08
2008
-09
$m$m
$m$m
$m$m
$m$m
$m$m
Ope
ning
bal
ance
Bal
ance
car
ried
forw
ard
from
pre
viou
s pe
riod
5,07
9-1
2,81
919
,325
19,4
158,
612
42,6
130
033
,016
49,2
10A
djus
tmen
t for
erro
rs /
entit
y ad
just
men
ts-3
4,01
4-1
7-4
20
34,0
220
00
-34
-17
Adj
ustm
ent f
or c
hang
es in
acc
ount
ing
polic
y0
00
00
00
00
0Ad
just
ed o
peni
ng b
alan
ce-2
8,93
5-1
2,83
619
,283
19,4
1542
,634
42,6
140
032
,982
49,1
93In
com
e an
d ex
pens
eR
even
ues
and
expe
nses
reco
gnis
ed d
irect
lyin
equ
ityC
urre
ncy
trans
latio
n ga
in (l
oss)
nana
nana
00
nana
00
Fina
ncia
l ass
et re
valu
atio
nsna
na11
330
00
nana
113
30N
on-fi
nanc
ial a
sset
reva
luat
ions
nana
3235
nana
nana
3235
Tota
l rev
enue
s an
d ex
pens
es re
cogn
ised
dire
ctly
in e
quity
00
145
650
00
014
565
Net
ope
ratin
g re
sult
16,0
6620
,634
nana
nana
nana
16,0
6620
,634
Tota
l inc
ome
and
expe
nses
Tran
sfer
s be
twee
n re
serv
es23
-8-1
62
-76
00
00
Div
iden
ds0
00
00
00
00
0O
ther
mov
emen
ts27
240
35
-13
-1,0
810
017
-836
Clo
sing
bal
ance
-12,
819
8,02
919
,415
19,4
8742
,613
41,5
390
049
,210
69,0
56

Appendix C: Australian Accounting Standards financial statements
223
Tabl
e C
3: A
ustr
alia
n G
over
nmen
t gen
eral
gov
ernm
ent s
ecto
r sta
tem
ent o
f cha
nges
in e
quity
(con
tinue
d)
Acc
umul
ated
resu
ltsA
sset
reva
luat
ion
Oth
er re
serv
esC
ontri
bute
dTo
tal e
quity
rese
rve
equi
ty/c
apita
l20
09-1
020
10-1
120
09-1
020
10-1
120
09-1
020
10-1
120
09-1
020
10-1
120
09-1
020
10-1
1$m
$m$m
$m$m
$m$m
$m$m
$mO
peni
ng b
alan
ceB
alan
ce c
arrie
d fo
rwar
d fro
m p
revi
ous
perio
d8,
029
32,9
9619
,487
19,5
6741
,539
39,7
280
069
,056
92,2
91A
djus
tmen
t for
erro
rs /
entit
y ad
just
men
ts-2
0-7
60
-10
10
0-2
0-7
6A
djus
tmen
t for
cha
nges
in a
ccou
ntin
g po
licy
00
00
00
00
00
Adju
sted
ope
ning
bal
ance
8,00
932
,920
19,4
8719
,566
41,5
4039
,728
00
69,0
3692
,215
Inco
me
and
expe
nse
Rev
enue
s an
d ex
pens
es re
cogn
ised
dire
ctly
in e
quity
Cur
renc
y tra
nsla
tion
gain
(los
s)na
nana
na0
0na
na0
0Fi
nanc
ial a
sset
reva
luat
ions
nana
3037
00
nana
3037
Non
-fina
ncia
l ass
et re
valu
atio
nsna
na43
34na
nana
na43
34To
tal r
even
ues
and
expe
nses
reco
gnis
eddi
rect
ly in
equ
ity0
073
720
00
073
72N
et o
pera
ting
resu
lt24
,552
23,5
17na
nana
nana
na24
,552
23,5
17To
tal i
ncom
e an
d ex
pens
esTr
ansf
ers
betw
een
rese
rves
-7-5
10
65
00
00
Div
iden
ds0
00
00
00
00
0O
ther
mov
emen
ts44
254
86
6-1
,818
-1,8
530
0-1
,370
-1,2
99
Clo
sing
bal
ance
32,9
9656
,980
19,5
6719
,644
39,7
2837
,880
00
92,2
9111
4,50
4

Appendix C: Australian Accounting Standards financial statements
224
Table C4: Australian Government general government sector cash flow statement
2007-08 2008-09 2009-10 2010-11Note $m $m $m $m
Operating activitiesCash received
Taxation 16 231,729 242,184 255,342 262,459Sales of goods and services 5,445 5,593 5,701 5,813Interest 6,175 5,545 6,386 7,070Dividends 2,692 4,017 3,983 4,434GST input credit receipts 3,951 3,921 3,888 3,881Other 3,240 3,435 3,586 3,733
Total operating cash received 253,232 264,695 278,885 287,389Cash used
Payments to employees 23,117 23,425 24,248 25,125Payments to suppliers 27,743 27,537 27,290 27,321Subsidies paid 12,321 13,031 13,836 14,217Personal benefits 102,374 109,340 116,060 123,395Grant payments 47,994 50,369 52,504 53,606Interest and other financing costs 5,753 5,427 4,956 5,404GST payments to taxation authority 74 73 73 73Other 8,171 8,670 9,488 10,218
Total operating cash used 227,546 237,873 248,455 259,360Net cash from operating activities 25,687 26,822 30,430 28,029Investing activitiesCash received
Proceeds from asset sales program 6,602 2,815 0 0Proceeds from sales of property,
plant and equipment and intangibles 301 258 254 88Other net investing cash received 288 313 331 346
Total investing cash received 7,191 3,387 585 434Cash used
Purchase of property, plant andequipment and intangibles 8,155 9,484 10,148 9,812
Net loans, advances and HELP 2,052 1,924 1,806 2,008Other net investing cash paid 25,200 18,731 18,341 9,119
Total investing cash used 35,406 30,139 30,296 20,939Net cash from investing activities -28,215 -26,752 -29,710 -20,505Financing activities Cash received
Net cash received from currencyissues 0 0 0 0
Other 0 0 0 0Total financing cash received 0 0 0 0Cash used
Net repayments of borrowings -2,542 -167 699 6,995Other 126 145 138 127
Total financing cash used -2,416 -22 837 7,122Net cash from financing activities 2,416 22 -837 -7,122Net increase/decrease in cash held 2 -112 92 -117 402
Estimates Projections
Appendix C: Australian Accounting Standards financial statements
225
NOTES TO THE AAS FINANCIAL STATEMENTS
Note 1: External reporting standards and accounting policies The Charter of Budget Honesty Act 1998 requires that the Mid-Year Economic and Fiscal Outlook be based on external reporting standards and that departures from applicable external reporting standards be identified.
The financial statements included in this Appendix have been prepared on an accrual basis in accordance with applicable Australian Accounting Standards (AAS), being the Australian Equivalents to International Financial Reporting Standards (AEIFRS) and AAS 31 Financial Reporting by Governments (AAS 31).
AAS requires governments to prepare accrual based general purpose financial reports. This means that assets, liabilities, income and expenses are recorded in financial statements when transactions have an economic impact on the government, rather than when the cash flow associated with these transactions occurs. Consistent with AAS, an income statement, a balance sheet, a statement of changes in equity, and a cash flow statement have been prepared for the budget year and the three forward years.
The accounting policies in this Appendix are generally consistent with the accounting policies in AAS. While the scope for financial reporting recommended in AAS 31 is the whole of government (that is, the Australian Government public sector), in accordance with the Charter of Budget Honesty Act 1998, the presentation covers the general government sector only. This Appendix includes notes showing disaggregated information.
AAS would suggest the gross amount of goods and services tax (GST) be included in the Australian Government’s financial statements. However, under the Intergovernmental Agreement on the Reform of Commonwealth-State Financial Relations, GST is collected by the Australian Taxation Office as an agent for the States and Territories (the States), and appropriated to the States. Therefore, GST cash flows and any accrued GST revenues and associated payments to the States are not recorded in the financial statements.
The new AEIFRS standard relating to superannuation is AASB 119 Employee Benefits. The standard requires the government bond rate at balance date to be referenced when valuing the superannuation liability, with the relevant bond yield to match the term of the liability. However, the longest maturing government bond is only 10 years, significantly shorter than the term of the superannuation liability. Therefore, in applying this standard, a longer term rate of 6 per cent as determined by actuaries is adopted to discount the liability for budget reporting. Guidance has been sought from the Australian Accounting Standards Board to clarify the differing interpretations in applying AASB 119 for outcomes.

Appendix C: Australian Accounting Standards financial statements
226
The basis of recognition of the Government’s obligation for education grants, primarily to the States, has changed to when payments are due to be made. The financial effect of this change is recognised in the statement of changes in equity. Further details are contained in Box 2 in Attachment E of Part 4.

Appendix C: Australian Accounting Standards financial statements
227
Note 2: Reconciliation of cash
2007-08 2008-09 2009-10 2010-11$m $m $m $m
Operating result (revenues less expenses) 16,066 20,634 24,552 23,517less Revenues not providing cash
Foreign exchange gains 0 0 0 0 Gains from asset sales programme 0 1,511 0 0 Gains from sale of assets 52 16 2 7 Other 913 3,349 4,128 4,509
Total revenues not providing cash 965 4,876 4,130 4,516plus Expenses not requiring cash
Increase/(decrease) in employee entitlements 4,216 4,125 4,100 4,220 Depreciation/amortisation expense 5,221 5,390 5,358 5,241 Provision for bad and doubtful debts 33 41 55 67 Provision for diminution in value of assets 471 382 384 400 Losses from asset sales programme 27 0 0 0 Losses from sale of assets 0 0 0 0 Foreign exchange losses 0 0 0 0 Other 234 204 236 141
Total expenses not requiring cash 10,201 10,142 10,133 10,069plus Cash provided by working capital items
Decrease in inventories 0 0 0 0 Decrease in receivables 475 0 0 0 Decrease in other financial assets 0 0 0 97 Decrease in other non-financial assets 857 1,194 396 3 Increase in benefits subsidies and grants payable 248 247 151 399 Increase in suppliers' liabilities 63 89 51 59 Increase in other provisions and payables 0 17 186 0
Total cash provided by working capital items 1,643 1,547 783 558less Cash used by working capital items
Increase in inventories 366 124 178 183 Increase in receivables 0 261 515 734 Increase in other financial assets 521 187 66 0 Increase in other non-financial assets 0 0 0 0 Decrease in benefits subsidies and grants payable 325 53 150 0 Decrease in other provisions and payables 47 0 0 682 Decrease in suppliers' liabilities 0 0 0 0
Total cash used by working capital items 1,259 626 909 1,600equals Net cash from/(to) operating activities 25,687 26,822 30,430 28,029
plus Net cash from/(to) investing activities -28,215 -26,752 -29,710 -20,505
Net cash from operating activities andinvestment -2,529 70 720 7,524plus Net cash from/(to) financing activities 2,416 22 -837 -7,122
equals Net (decrease)/increase in cash -112 92 -117 402
Estimates Projections

Appendix C: Australian Accounting Standards financial statements
228
Note 2(a): Consolidated Revenue Fund The estimated and projected cash balances reflected in the balance sheet for the Australian Government general government sector (Table C2) include the reported cash balances controlled and administered by Australian Government agencies subject to the Financial Management and Accountability Act 1997 and the reported cash balances controlled and administered by entities, subject to the Commonwealth Authorities and Companies Act 1997 (CAC Act), that implement public policy through the provision of primarily non-market services.
Revenues or monies raised by the Executive Government automatically form part of the Consolidated Revenue Fund by force of section 81 of the Australian Constitution. For practical purposes, total Australian Government general government sector cash, less cash controlled and administered by CAC Act entities, plus special public monies represents the Consolidated Revenue Fund referred to in section 81 of the Australian Constitution. On this basis, the balance of the Consolidated Revenue Fund is shown below.
2007-08 2008-09 2009-10 2010-11$m $m $m $m
Total general government sector cash (Appendix C) 1,043 1,135 1,018 1,420
less CAC Agency cash balances 1,061 1,190 1,027 1,351plus Special public monies 115 118 120 123Balance of Consolidated Revenue Fund
at 30 June 97 63 111 192
Estimates Projections

Appendix C: Australian Accounting Standards financial statements
229
Note 3: Income tax revenue
2007-08 2008-09 2009-10 2010-11$m $m $m $m
Individuals and other withholding taxesGross income tax withholding 113,330 115,980 122,210 129,110Gross other individuals 28,110 29,140 30,860 31,430less: Refunds 19,790 21,850 22,420 24,090
Total individuals and other withholding taxation 121,650 123,270 130,650 136,450Fringe benefits tax 3,970 4,100 3,960 3,950Superannuation funds
Contributions and earnings 10,050 11,580 12,810 13,810Superannuation surcharge 80 10 10 10
Total superannuation taxation 10,130 11,590 12,820 13,820Company tax 65,250 71,850 76,100 76,580Petroleum resource rent tax 2,060 2,380 2,750 2,240Income taxation revenue 203,060 213,190 226,280 233,040
Estimates Projections
Note 4: Indirect tax revenue
2007-08 2008-09 2009-10 2010-11$m $m $m $m
Excise dutyPetroleum and other fuel products 14,490 14,740 15,160 15,670Crude oil 340 170 160 220Other excise 8,260 8,440 8,620 8,780
Customs duty 6,010 6,350 6,040 5,630Other indirect taxation 1,311 1,371 1,411 1,461GST 43,530 46,650 48,990 51,620
less transfers to States in relation toGST revenue 43,530 46,650 48,990 51,620
GST revenue 0 0 0 0Mirror taxes 370 390 412 436
less transfers to States in relation tomirror tax revenue 370 390 412 436
Mirror tax revenue 0 0 0 0Indirect taxation revenue 30,411 31,071 31,391 31,761
Estimates Projections
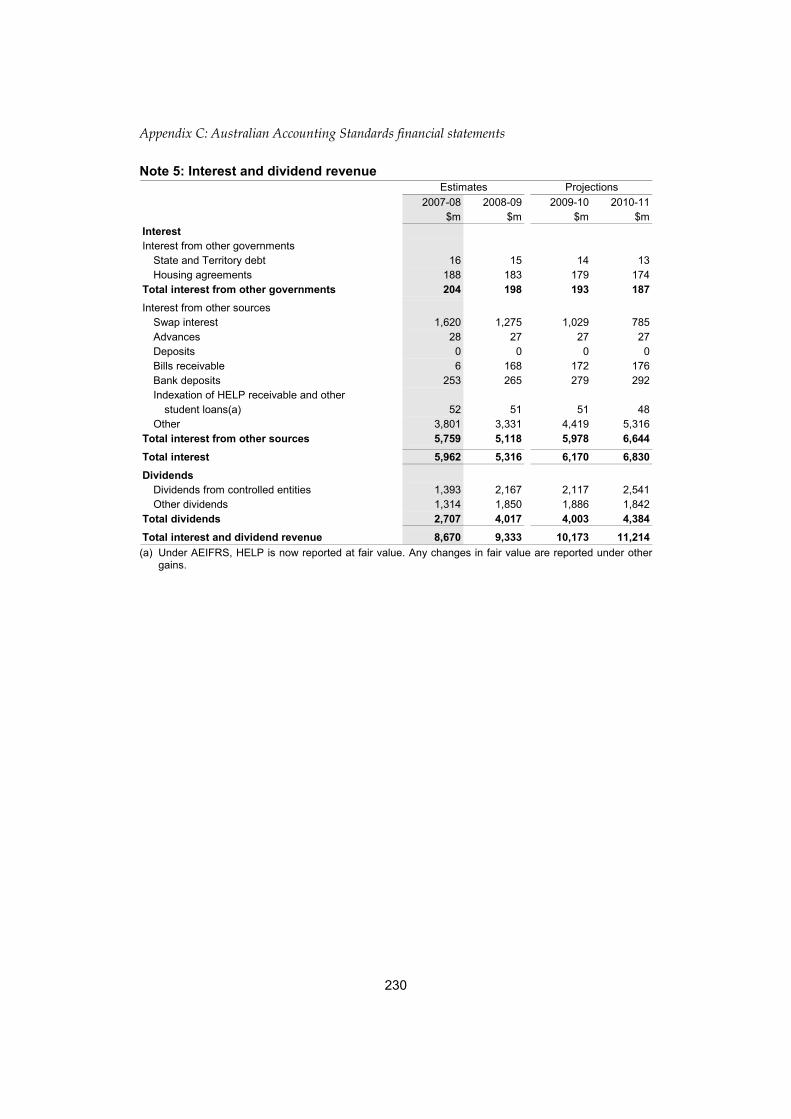
Appendix C: Australian Accounting Standards financial statements
230
Note 5: Interest and dividend revenue
2007-08 2008-09 2009-10 2010-11$m $m $m $m
InterestInterest from other governments
State and Territory debt 16 15 14 13Housing agreements 188 183 179 174
Total interest from other governments 204 198 193 187Interest from other sources
Swap interest 1,620 1,275 1,029 785Advances 28 27 27 27Deposits 0 0 0 0Bills receivable 6 168 172 176Bank deposits 253 265 279 292Indexation of HELP receivable and other
student loans(a) 52 51 51 48Other 3,801 3,331 4,419 5,316
Total interest from other sources 5,759 5,118 5,978 6,644Total interest 5,962 5,316 6,170 6,830Dividends
Dividends from controlled entities 1,393 2,167 2,117 2,541Other dividends 1,314 1,850 1,886 1,842
Total dividends 2,707 4,017 4,003 4,384Total interest and dividend revenue 8,670 9,333 10,173 11,214
Estimates Projections
(a) Under AEIFRS, HELP is now reported at fair value. Any changes in fair value are reported under other
gains.

Appendix C: Australian Accounting Standards financial statements
231
Note 6: Other sources of non-tax revenue
2007-08 2008-09 2009-10 2010-11$m $m $m $m
Industry contributions 213 198 198 199International Monetary Fund related revenue 5 4 4 4Royalties 1,272 1,257 1,331 1,303Seigniorage 106 103 103 103Other 2,080 2,113 2,178 2,351Total other sources of non-taxation revenue 3,674 3,675 3,814 3,959
Estimates Projections
Note 7: Employee expenses
2007-08 2008-09 2009-10 2010-11$m $m $m $m
Salaries and wages(a) 15,093 15,001 15,426 15,826Leave and other entitlements 1,495 1,522 1,570 1,687Separations and redundancies 44 46 46 44Workers compensation premiums 10 6 5 10Other (including superannuation) 10,716 11,005 11,332 11,808
Total employee expenses 27,357 27,580 28,379 29,376
Estimates Projections
(a) Salaries and wages do not include superannuation.
Note 8: Suppliers expenses
2007-08 2008-09 2009-10 2010-11$m $m $m $m
Supply of goods and services 20,984 20,842 20,630 20,672Operating lease rental expenses 1,791 1,863 1,911 1,858Other 590 619 591 533
Total suppliers expenses 23,365 23,324 23,133 23,063
Estimates Projections
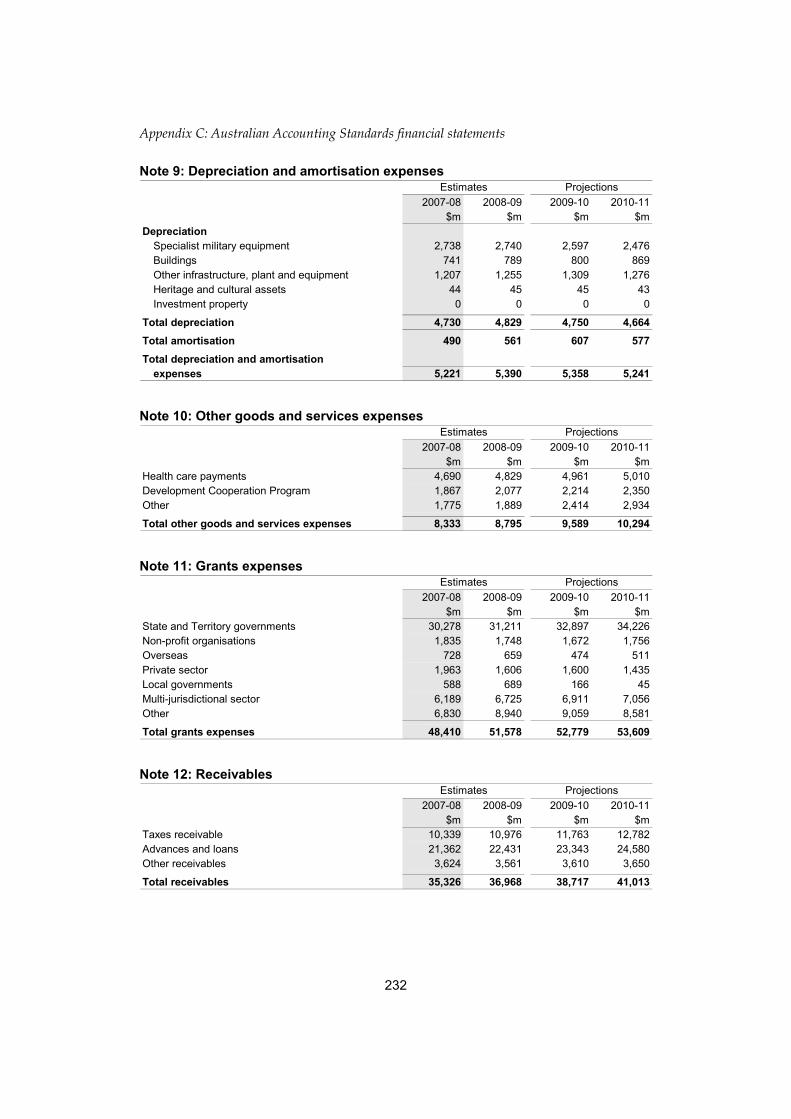
Appendix C: Australian Accounting Standards financial statements
232
Note 9: Depreciation and amortisation expenses
2007-08 2008-09 2009-10 2010-11$m $m $m $m
DepreciationSpecialist military equipment 2,738 2,740 2,597 2,476Buildings 741 789 800 869Other infrastructure, plant and equipment 1,207 1,255 1,309 1,276Heritage and cultural assets 44 45 45 43Investment property 0 0 0 0
Total depreciation 4,730 4,829 4,750 4,664Total amortisation 490 561 607 577Total depreciation and amortisation
expenses 5,221 5,390 5,358 5,241
Estimates Projections
Note 10: Other goods and services expenses
2007-08 2008-09 2009-10 2010-11$m $m $m $m
Health care payments 4,690 4,829 4,961 5,010Development Cooperation Program 1,867 2,077 2,214 2,350Other 1,775 1,889 2,414 2,934
Total other goods and services expenses 8,333 8,795 9,589 10,294
Estimates Projections
Note 11: Grants expenses
2007-08 2008-09 2009-10 2010-11$m $m $m $m
State and Territory governments 30,278 31,211 32,897 34,226Non-profit organisations 1,835 1,748 1,672 1,756Overseas 728 659 474 511Private sector 1,963 1,606 1,600 1,435Local governments 588 689 166 45Multi-jurisdictional sector 6,189 6,725 6,911 7,056Other 6,830 8,940 9,059 8,581
Total grants expenses 48,410 51,578 52,779 53,609
Estimates Projections
Note 12: Receivables
2007-08 2008-09 2009-10 2010-11$m $m $m $m
Taxes receivable 10,339 10,976 11,763 12,782Advances and loans 21,362 22,431 23,343 24,580Other receivables 3,624 3,561 3,610 3,650
Total receivables 35,326 36,968 38,717 41,013
Estimates Projections

Appendix C: Australian Accounting Standards financial statements
233
Note 13: Non-financial assets
2007-08 2008-09 2009-10 2010-11$m $m $m $m
Land and buildingsLand 6,940 6,972 6,900 7,016Buildings 16,981 18,258 19,122 20,062
Total land and buildings 23,921 25,229 26,022 27,078Infrastructure
Specialist military equipment 33,900 37,027 41,093 44,961Other 10,025 10,024 9,824 9,548
Total infrastructure 43,924 47,051 50,916 54,509Intangibles
Computer software 2,277 2,326 2,253 2,177Other 146 194 190 172
Total intangibles 2,424 2,520 2,443 2,349Total heritage and cultural assets 8,245 8,258 8,280 8,294Total investment properties 110 104 100 98Total biological assets 3 4 5 6Total assets held for sale 159 164 169 177Total inventories 6,100 6,224 6,402 6,585Other non-financial assets
Prepayments 3,259 1,824 1,229 1,022Other 381 398 518 662
Total other non-financial assets 3,640 2,222 1,748 1,684Total non-financial assets 88,527 91,777 96,084 100,779
Estimates Projections
Note 14: Employee and superannuation liabilities
2007-08 2008-09 2009-10 2010-11$m $m $m $m
Superannuation 106,305 110,056 113,782 117,561Leave and other entitlements 4,642 4,821 5,007 5,292Accrued salaries and wages 254 298 359 384Workers compensation claims 1,530 1,568 1,602 1,638Separations and redundancies 33 32 32 32Workers compensation premiums 1,613 1,691 1,774 1,858Other 981 1,016 1,027 1,039
Total employee and superannuation liabilities 115,357 119,482 123,583 127,803
Estimates Projections

Appendix C: Australian Accounting Standards financial statements
234
Note 15: Grants payable
2007-08 2008-09 2009-10 2010-11$m $m $m $m
State and Territory governments 52 47 49 50Non-profit organisations 50 50 50 50Private sector 241 216 208 207Overseas 393 449 365 392Local governments 4 4 4 4Other 280 314 342 374Total grants payable 1,020 1,080 1,019 1,077
Estimates Projections
Note 16: Taxation receipts
2007-08 2008-09 2009-10 2010-11$m $m $m $m
Total taxation receipts 274,349 287,844 303,423 313,025less payments to States
in relation to GST receipts 42,250 45,270 47,670 50,130less payments to States
in relation to mirror tax receipts 370 390 412 436Taxation receipts 231,729 242,184 255,342 262,459
Estimates Projections

235
APPENDIX D: STATEMENT OF RISKS
OVERVIEW
Full details of fiscal risks and contingent liabilities are provided in Budget Paper No. 1, Budget Strategy and Outlook 2007-08. The following statement updates (where necessary) those fiscal risks and contingent liabilities that have changed since the 2007-08 Budget.
The forward estimates of revenue and expenses in the Mid-Year Economic and Fiscal Outlook 2007-08 incorporate assumptions and judgements based on information available at the time of publication.
DETAILS OF FISCAL RISKS AND CONTINGENT LIABILITIES
New or revised fiscal risks and contingent liabilities with a possible impact on the forward estimates greater than $20 million in any year, or $40 million over the forward estimates period, that have arisen or changed since the 2007-08 Budget are described below and summarised in Table D1.
Information on contingent liabilities is also provided in the annual financial statements of departments, agencies and non-budget entries.
Table D1: Summary of material changes to Statement of Risks since the 2007-08 Budget Contingent liabilities — quantifiable
Defence and Defence Materiel Organisation Indemnities Modified
Finance and Administration Potential claims relating to superannuation benefits Sale of Sydney Airports Corporation Limited Future Fund Board of Guardians — Indemnity
Modified Modified New
Foreign Affairs and Trade Export Finance and Insurance Corporation (EFIC) Modified
Treasury Reserve Bank of Australia — Guarantee Modified Agriculture, Fisheries and Forestry Compensation claims arising from Equine Influenza (EI) Outbreak New Defence HMAS Melbourne and HMAS Voyager damages claims Modified
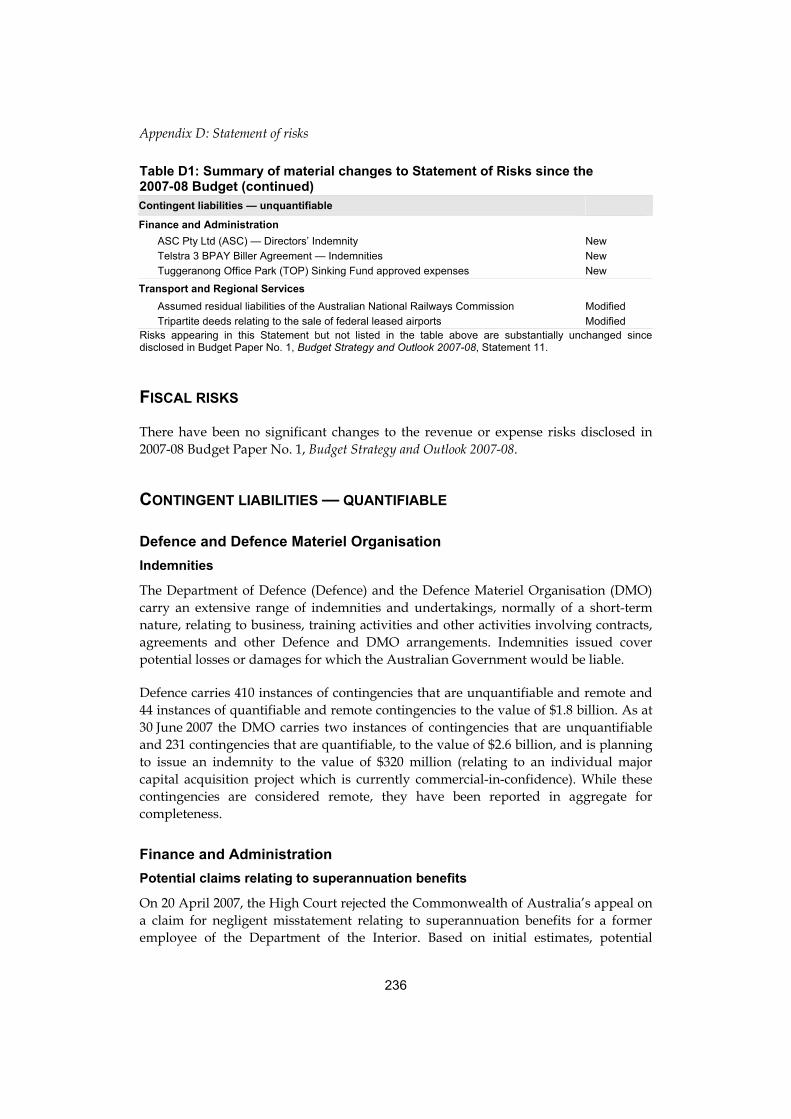
Appendix D: Statement of risks
236
Table D1: Summary of material changes to Statement of Risks since the 2007-08 Budget (continued) Contingent liabilities — unquantifiable
Finance and Administration ASC Pty Ltd (ASC) — Directors’ Indemnity Telstra 3 BPAY Biller Agreement — Indemnities Tuggeranong Office Park (TOP) Sinking Fund approved expenses
New New New
Transport and Regional Services Assumed residual liabilities of the Australian National Railways Commission Tripartite deeds relating to the sale of federal leased airports
Modified Modified
Risks appearing in this Statement but not listed in the table above are substantially unchanged since disclosed in Budget Paper No. 1, Budget Strategy and Outlook 2007-08, Statement 11.
FISCAL RISKS
There have been no significant changes to the revenue or expense risks disclosed in 2007-08 Budget Paper No. 1, Budget Strategy and Outlook 2007-08.
CONTINGENT LIABILITIES — QUANTIFIABLE
Defence and Defence Materiel Organisation Indemnities
The Department of Defence (Defence) and the Defence Materiel Organisation (DMO) carry an extensive range of indemnities and undertakings, normally of a short-term nature, relating to business, training activities and other activities involving contracts, agreements and other Defence and DMO arrangements. Indemnities issued cover potential losses or damages for which the Australian Government would be liable.
Defence carries 410 instances of contingencies that are unquantifiable and remote and 44 instances of quantifiable and remote contingencies to the value of $1.8 billion. As at 30 June 2007 the DMO carries two instances of contingencies that are unquantifiable and 231 contingencies that are quantifiable, to the value of $2.6 billion, and is planning to issue an indemnity to the value of $320 million (relating to an individual major capital acquisition project which is currently commercial-in-confidence). While these contingencies are considered remote, they have been reported in aggregate for completeness.
Finance and Administration Potential claims relating to superannuation benefits
On 20 April 2007, the High Court rejected the Commonwealth of Australia’s appeal on a claim for negligent misstatement relating to superannuation benefits for a former employee of the Department of the Interior. Based on initial estimates, potential
Appendix D: Statement of risks
237
liabilities arising from this decision are quantified at $296 million. However, there is uncertainty around this estimate in relation to both the number of claims and the size of potential damage payouts (because no claims have yet been determined).
Sale of Sydney Airports Corporation Limited
An indemnity has been provided to Southern Cross Airports Corporation as purchaser of the Sydney Airports Corporation Ltd in the event of a liability arising under Chapter 3 of the Duties Act 1997 (New South Wales) by reason of the sale of shares in Sydney Airports Corporation Ltd constituting a relevant acquisition in a land-rich private corporation.
The New South Wales Office of State Revenue issued a notice of assessment on 17 November 2006, which the Australian Government disputes to be a valid assessment. In the event the liability is sustained it is estimated to be valued at between $401.5 million and $441.9 million.
Future Fund Board of Guardians — indemnity
The Australian Government has provided the members of the Future Fund Board of Guardians (the Future Fund Board) with an indemnity, to cover liabilities in excess of the Board’s insurance policies.
Members of the Future Fund Board are indemnified, to the maximum extent permitted by law, in relation to all official actions. Similar to indemnities that are provided to members of Boards that operate under the Commonwealth Authorities and Companies Act 1997, the indemnity does not cover a Board member for conduct that he or she engages in other than in good faith, and in respect of certain other liabilities and costs incurred.
The indemnity is financially limited, in broad terms, to the value of the Future Fund.
Foreign Affairs and Trade Export Finance and Insurance Corporation (EFIC)
The Australian Government guarantees the due payment by the EFIC of money that is, or may at any time become, payable by EFIC to any body other than the Australian Government. The Australian Government also has in place a $200 million callable facility available to EFIC on request to cover liabilities, losses and claims. As at 31 August 2007, the Australian Government’s total contingent liability was $2.8 billion, comprising EFIC’s liabilities to third parties ($2.1 billion) and EFIC’s overseas investments insurance, contracts of insurance and guarantees ($0.7 billion).
Treasury Reserve Bank of Australia — guarantee
This contingent liability relates to the Australian Government’s guarantee of the liabilities of the Reserve Bank of Australia. It is measured as the Bank’s total liabilities
Appendix D: Statement of risks
238
excluding capital, reserve and Australian Government deposits. The major component of the Bank’s liabilities are notes (that is, currency) on issue. Notes on issue amount to $40.3 billion as at 30 June 2007 and the total guarantee is $59.9 billion.
CONTINGENT LIABILITIES — UNQUANTIFIABLE
Agriculture, Fisheries and Forestry Compensation claims arising from Equine Influenza (EI) Outbreak
The Australian Government may become liable for compensation actions should the Department of Agriculture, Fisheries and Forestry be found negligent in relation to the recent outbreak of EI. At this stage any potential liability resulting from the EI outbreak cannot be quantified. An independent inquiry is being conducted into the entry and spread of EI in Australia.
Defence HMAS Melbourne and HMAS Voyager damages claims
Former crew members of HMAS Melbourne have instituted legal proceedings against the Australian Government claiming damages for injuries allegedly caused by the HMAS Voyager/HMAS Melbourne collision on 10 February 1964. As at 24 September 2007 fifty three claims remain current and nine of the current claims are statute barred under applicable state laws. In those cases, the plaintiffs will require an extension of time prior to progressing their claims for damages. Further claims are likely to be made in connection with the collision.
Finance and Administration ASC Pty Ltd (ASC) — Directors’ indemnities
The Australian Government has indemnified the ASC Directors for any claim made against them as a result of complying with ASC’s obligations under the Process Agreement between the Electric Boat Corporation (EBC), the Australian Government and ASC.
The Australian Government has indemnified Board members of the ASC for any claim against them as a result of complying with ASC’s obligations under the Service Agreement between ASC, the Department of Defence, EBC and Electric Boat Australia.
The Australian Government has indemnified Board members of ASC for any claim and legal costs arising from the result of the Directors’ acting in accordance with the Board’s Tasks and Responsibilities, as defined under the indemnity.
Telstra 3 BPAY Biller Agreement — indemnities
The Australian Government has entered into a mutual indemnity arrangement under a BPAY Biller Agreement with the Commonwealth Bank of Australia (CBA) to facilitate

Appendix D: Statement of risks
239
the use of BPAY for the Telstra 3 retail application settlement. The Australian Government has issued an indemnity in the CBA’s favour against any harm or losses that the CBA may suffer as a result of any negligence, misrepresentation, fraud or misuse of BPAY marks committed by the Australian Government in respect of its obligations under the Agreement, including as a result of any claims. Likewise, the CBA has provided the Australian Government with a reciprocal indemnity.
Tuggeranong Office Park (TOP) Sinking Fund approved expenses
As part of the current work on the TOP completion strategy, the Department of Finance and Administration has received revised advice that under the Commonwealth Conditional Indemnity relating to the TOP sinking fund a potential tax liability and sale costs may become payable. The extent of this liability will not be known until the completion process is further advanced.
Transport and Regional Services Assumed residual liabilities of the Australian National Railways Commission The Australian Government under Schedule 3 of the Australian National Railways Commission Sale Act 1997 assumed the residual liabilities of the Australian National Railways Commission. A writ of summons was filed in the High Court of Australia on 20 August 2004 by a single plaintiff and a statement of claim on behalf of 24 other plaintiffs was filed in the District Court of South Australia on 22 September 2005. The High Court and District Court proceedings were consolidated into a joint action involving 25 plaintiffs by the District Court at a directions hearing on 5 June 2007. The plaintiffs’ consolidated statement of claim seeks unspecified damages for personal injuries as a result of exposure to lead and other particles from trains carrying lead and zinc ore at Broken Hill, which were operated by the Australian National Railways Commission between 1983 and 1998.
Tripartite deeds relating to the sale of federal leased airports Tripartite deeds apply to 12 federal leased airports (Adelaide, Alice Springs, Bankstown, Brisbane, Canberra, Gold Coast, Darwin, Launceston, Melbourne, Perth, Sydney and Townsville). The tripartite deeds between the Australian Government, the airport lessee company and financiers provide for limited step-in-rights for the financiers in circumstances when the airport lease is terminated to enable the financiers to correct the circumstances that triggered such a termination event. These contingent liabilities are considered to be unquantifiable and remote.


241
APPENDIX E: FINANCIAL REPORTING STANDARDS AND BUDGET CONCEPTS
REPORTING STANDARDS
The Charter of Budget Honesty Act 1998 requires that the Mid-Year Economic and Fiscal Outlook (MYEFO) be based on external reporting standards. Accordingly, the major external standards used in the MYEFO are the Australian Bureau of Statistics’ (ABS) accrual Government Finance Statistics (GFS) framework and Australian Accounting Standards (AAS), being the Australian Equivalents to International Financial Reporting Standards (AEIFRS) and AAS 31 Financial Reporting by Governments. The major fiscal aggregates (including the fiscal and underlying cash balances) are based on the accrual GFS framework.
The Charter also requires that departures from applicable external reporting standards be identified. These are disclosed in Attachment A to Part 4, the opening text of Appendix B and Note 1 in Appendix C.
The next section provides a brief overview of the GFS and AAS reporting frameworks.
ACCRUAL GFS FRAMEWORK
The GFS reporting framework is a specialised accounting and financial reporting system designed to support economic analysis of the public sector. It allows comprehensive assessments to be made of the economic impact of government and is consistent with international statistical standards (the System of National Accounts 1993 (SNA93) and the International Monetary Fund’s (IMF) Government Finance Statistics Manual 2001).1
The GFS conceptual framework is divided into a number of separate statements, each of which draws out analytical aggregates or balances of particular economic significance. Together, these aggregates provide for a thorough understanding of the financial position of the public sector. The GFS statements reported in the MYEFO are the operating statement, balance sheet, cash flow statement and statement of other economic flows.
All GFS data are recorded as either stocks (assets and liabilities) or flows (classified as either transactions or other economic flows).
1 Additional information on the Australian accrual GFS framework is available in the ABS publication Australian System of Government Finance Statistics: Concepts, Sources and Methods, 2005 (cat. no. 5514.0).
Appendix E: Financial reporting standards and budget concepts
242
A transaction results from a mutually agreed interaction between economic entities. Despite their compulsory nature, taxes are transactions deemed to occur by mutual agreement between the government and the taxpayer. Transactions that increase or decrease net worth (assets minus liabilities) are reported as revenues and expenses respectively in the operating statement.2
A change to the value or volume of an asset or liability that does not result from a transaction is an other economic flow. This can include changes in values from market prices, most actuarial valuations and exchange rates and changes in volumes from discoveries, depletion and destruction. Other economic flows are reported in the statement of other economic flows.
Under the accrual GFS framework, flows are recorded in the period in which they occurred. As a result, prior period outcomes may be revised where information arises that could reasonably be expected to have been known in the past, is material in at least one of the affected periods and can be reliably assigned to the relevant period(s).
Operating statement The operating statement presents details of transactions in GFS revenues, GFS expenses and the net acquisition of non-financial assets (net capital investment) for an accounting period.
GFS revenues arise from transactions that increase net worth and GFS expenses arise from transactions that decrease net worth. GFS revenues less GFS expenses gives the GFS net operating balance. The net operating balance is comparable to the National Accounts concept of government saving plus capital transfers.
The net acquisition of non-financial assets (net capital investment) measures the change in the Australian Government’s stock of non-financial assets due to transactions. As such, it measures the net effect of purchases, sales and consumption (for example, depreciation of fixed assets and use of inventory) of non-financial assets during an accounting period.
Net acquisition of non-financial assets equals gross fixed capital formation, less depreciation, plus changes (investment) in inventories, plus other transactions in non-financial assets.
Fiscal balance
The fiscal balance (or GFS net lending/borrowing) is the net operating balance less net capital investment. Thus, fiscal balance includes the impact of net expenditure
2 Not all transactions impact on net worth. For example, transactions in financial assets and liabilities do not impact on net worth as they represent the swapping of assets and liabilities on the balance sheet.

Appendix E: Financial reporting standards and budget concepts
243
(effectively purchases less sales) on non-financial assets rather than consumption (depreciation) of non-financial assets.3
The fiscal balance measures the Australian Government’s investment-saving balance. It measures in accrual terms the gap between government savings plus net capital transfers, and investment in non-financial assets. As such, it approximates the contribution of the Australian Government general government sector to the balance on the current account in the balance of payments.
Balance sheet The balance sheet shows stocks of assets, liabilities and GFS net worth. Net debt is also reported in the balance sheet.
Net debt
Net debt is the sum of selected financial liabilities (deposits held, advances received, government securities, loans, and other borrowing) less the sum of selected financial assets (cash and deposits, advances paid, and investments, loans and placements). Net debt does not include superannuation related liabilities. Net debt is a common measure of the strength of a government’s financial position. High levels of net debt impose a call on future revenue flows to service that debt.
Net worth
The net worth of the general government sector is defined as assets less liabilities. For the public financial corporations and public non-financial corporations sectors, net worth is defined as assets less liabilities less shares and other contributed capital. Net worth is an economic measure of wealth, reflecting the Australian Government’s contribution to the wealth of Australia.
Cash flow statement The cash flow statement identifies how cash is generated and applied in a single accounting period. The cash flow statement reflects a cash basis of recording (rather than an accrual basis) where information is derived indirectly from underlying accrual transactions and movements in balances. This, in effect, means that transactions are captured when cash is received or when cash payments are made. Cash transactions are specifically identified because cash management is considered an integral function of accrual budgeting.
3 The net operating balance includes consumption of non-financial assets because depreciation is a GFS expense. Depreciation also forms part of net capital investment, which (in the calculation of fiscal balance) offsets the inclusion of depreciation in the net operating balance.

Appendix E: Financial reporting standards and budget concepts
244
Underlying cash balance
The underlying cash balance plus Future Fund earnings (GFS cash surplus/deficit) is the cash counterpart of the fiscal balance, reflecting the Australian Government’s cash investment-saving balance. This measure is conceptually equivalent under the current accrual framework and the previous cash framework. For the general government sector, the underlying cash balance is calculated as shown below.
Net cash flows from operating activities
plus
Net cash flows from investments in non-financial assets
less
Net acquisitions of assets acquired under finance leases and similar arrangements4
equals
GFS cash surplus/deficit
less
Future Fund earnings
equals
Underlying cash balance
The Government is reporting the underlying cash balance net of Future Fund earnings from 2005-06 onwards because the earnings are being reinvested to meet future superannuation payments and are therefore not available for current spending. However, Future Fund earnings are included in the fiscal balance because superannuation expenses relating to future cash payments are recorded in the fiscal balance estimates.
4 The underlying cash balance treats the acquisition and disposal of non-financial assets in the same manner regardless of whether they occur by purchase/sale or finance lease —acquisitions reduce the underlying cash balance and disposals increase the underlying cash balance. However, finance leases do not generate cash flows at the time of acquisition or disposal equivalent to the value of the asset. As such, net acquisitions of assets under finance leases are not shown in the body of the cash flow statement but are reported as a supplementary item for the calculation of the underlying cash balance.

Appendix E: Financial reporting standards and budget concepts
245
Expected Future Fund earnings are separately identified in the Australian Government cash flow statement in Part 4 Attachment B and the historic tables in Appendix F.
Headline cash balance
The headline cash balance is calculated by adding cash flows from investments in financial assets for policy purposes and Future Fund earnings to the underlying cash balance.
Cash flows from investments in financial assets for policy purposes include equity transactions and net advances.5 Equity transactions include equity injections into controlled businesses and privatisations of government businesses. Net advances include net loans to the States, net loans to students under the Higher Education Loan Programme (HELP), and contributions to international organisations that increase the Australian Government’s financial assets.
Statement of other economic flows (reconciliation of net worth) The statement of other economic flows outlines changes in net worth driven by economic flows other than GFS revenues and GFS expenses. GFS revenues, GFS expenses and other economic flows sum to the total change in net worth during a period. The majority of other economic flows for the Australian Government general government sector arise from price movements in its assets and liabilities.
Sectoral classifications To assist in analysing the public sector, GFS data are presented by institutional sector. GFS distinguishes between the general government sector, the public non-financial corporations sector and the public financial corporations sector, as shown in Figure E1.
5 Cash flows from investments in financial assets for policy purposes were called net advances under the cash budgeting framework.

Appendix E: Financial reporting standards and budget concepts
246
Figure E1: Institutional structure of the public sector
Total public sector
Public financial corporations
Public non-financial corporationsGeneral government sector
Total non-financialpublic sector
(Includes Reserve Bank of Australia and other borrowing authorities)
(Government departments and agencies that provide non-market public services and are funded mainly through taxes)
(Provide goods and services to consumers on a commercial basis, are funded largely by the sale of these goods and services and are generally legally distinguishable from the governments that own them)
Budget reporting focuses on the general government sector. The general government sector provides public services that are mainly non-market in nature, and for the collective consumption of the community, or involve the transfer or redistribution of income. These services are largely financed through taxes and other compulsory levies, although user charging and external funding have increased in recent years. This sector comprises all government departments, offices and some other bodies.
In preparing financial statements for the sectors all material transactions and balances between entities within the sectors are eliminated.
AUSTRALIAN ACCOUNTING STANDARD REPORTING FRAMEWORK
The AAS reporting framework, being the AEIFRS and AAS 31, requires the preparation of accrual-based general purpose financial reports, showing government assets, liabilities, income, expenses and cash flows. Reporting under this framework is intended to provide a consolidated overview of the financial performance and financial position of government.
There are four main general purpose statements that must be prepared in accordance with the AAS framework. These are:
• an income statement, which includes an operating result;
Appendix E: Financial reporting standards and budget concepts
247
• a balance sheet, which shows net assets;
• a statement of changes in equity, which shows movements in equity; and
• a cash flow statement, which includes the net increase/decrease in cash held.
In addition to these general purpose statements, notes to the financial statements are required. These notes include a summary of accounting policies, disaggregated information and other disclosures required by AAS.
A full set of AAS financial statements and accompanying notes prepared for the general government sector can be found in Appendix C.
RECONCILIATION OF GFS AND AAS AGGREGATES
There is a general consistency of treatment of the elements of financial statements between GFS and AAS. Both frameworks are based on the concept of economic events that give rise to stocks and flows. As a result, the definitions of stocks are broadly similar under the two frameworks and relate to the control of economic benefits, while flows are defined with reference to changes in stocks.
The GFS and AAS definitions of the scope of the public sector agree in almost all cases, with AAS 31 recommending the same segmentation of the public sector into general government, public non-financial corporations and public financial corporations sectors.
Transactions are generally treated in a similar manner by GFS and AAS; however, where GFS is a framework designed to facilitate macro-economic analysis, AAS is designed for general purpose financial reporting. The different objectives of the two systems lead to some variation in the treatment of certain items. This differing treatment relates predominantly to the definitions of revenues and expenses under the two frameworks.
In particular, revaluations of assets and liabilities are classified differently under the AAS and GFS standards. Major revaluations include writedowns of bad and doubtful debts (excluding those that are mutually agreed), changes in the valuation of superannuation liabilities, and gains and losses due to changes in foreign exchange rates and interest rates.

Appendix E: Financial reporting standards and budget concepts
248
Under AAS reporting, valuation changes may affect income or expenses and therefore the operating result. However, under GFS reporting, revaluations are not considered to be transactions (that is, they are considered to be other economic flows) and accordingly do not form part of revenues or expenses. Therefore, most revaluations are not taken into account in the calculation of the GFS net operating balance or fiscal balance. However, revaluations still impact on GFS assets and liabilities, as can be seen in the statement of other economic flows.
Some of the major differences between the GFS and AAS treatments of transactions are outlined in Table E1. Further information on the differences between the two systems is provided in the ABS publication Australian System of Government Finance Statistics: Concepts, Sources and Methods, 2005 (cat. no. 5514.0).
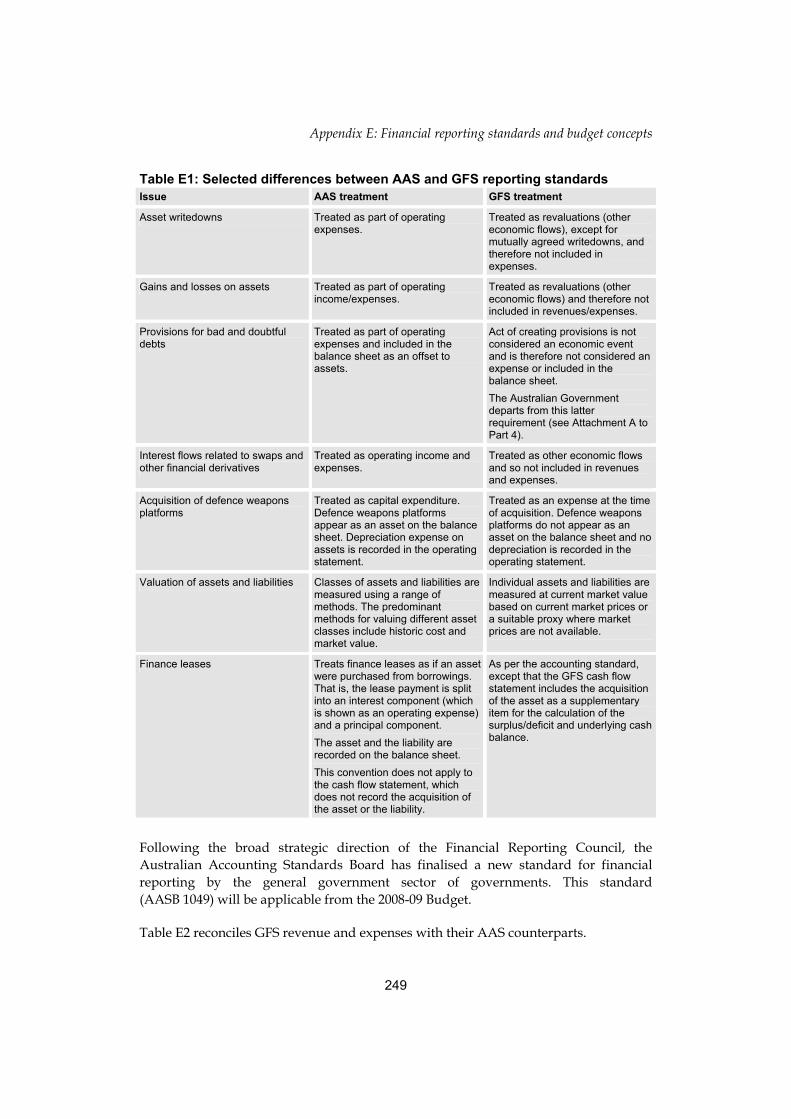
Appendix E: Financial reporting standards and budget concepts
249
Table E1: Selected differences between AAS and GFS reporting standards Issue AAS treatment GFS treatment
Asset writedowns Treated as part of operating expenses.
Treated as revaluations (other economic flows), except for mutually agreed writedowns, and therefore not included in expenses.
Gains and losses on assets Treated as part of operating income/expenses.
Treated as revaluations (other economic flows) and therefore not included in revenues/expenses.
Provisions for bad and doubtful debts
Treated as part of operating expenses and included in the balance sheet as an offset to assets.
Act of creating provisions is not considered an economic event and is therefore not considered an expense or included in the balance sheet. The Australian Government departs from this latter requirement (see Attachment A to Part 4).
Interest flows related to swaps and other financial derivatives
Treated as operating income and expenses.
Treated as other economic flows and so not included in revenues and expenses.
Acquisition of defence weapons platforms
Treated as capital expenditure. Defence weapons platforms appear as an asset on the balance sheet. Depreciation expense on assets is recorded in the operating statement.
Treated as an expense at the time of acquisition. Defence weapons platforms do not appear as an asset on the balance sheet and no depreciation is recorded in the operating statement.
Valuation of assets and liabilities Classes of assets and liabilities are measured using a range of methods. The predominant methods for valuing different asset classes include historic cost and market value.
Individual assets and liabilities are measured at current market value based on current market prices or a suitable proxy where market prices are not available.
Finance leases Treats finance leases as if an asset were purchased from borrowings. That is, the lease payment is split into an interest component (which is shown as an operating expense) and a principal component. The asset and the liability are recorded on the balance sheet. This convention does not apply to the cash flow statement, which does not record the acquisition of the asset or the liability.
As per the accounting standard, except that the GFS cash flow statement includes the acquisition of the asset as a supplementary item for the calculation of the surplus/deficit and underlying cash balance.
Following the broad strategic direction of the Financial Reporting Council, the Australian Accounting Standards Board has finalised a new standard for financial reporting by the general government sector of governments. This standard (AASB 1049) will be applicable from the 2008-09 Budget.
Table E2 reconciles GFS revenue and expenses with their AAS counterparts.
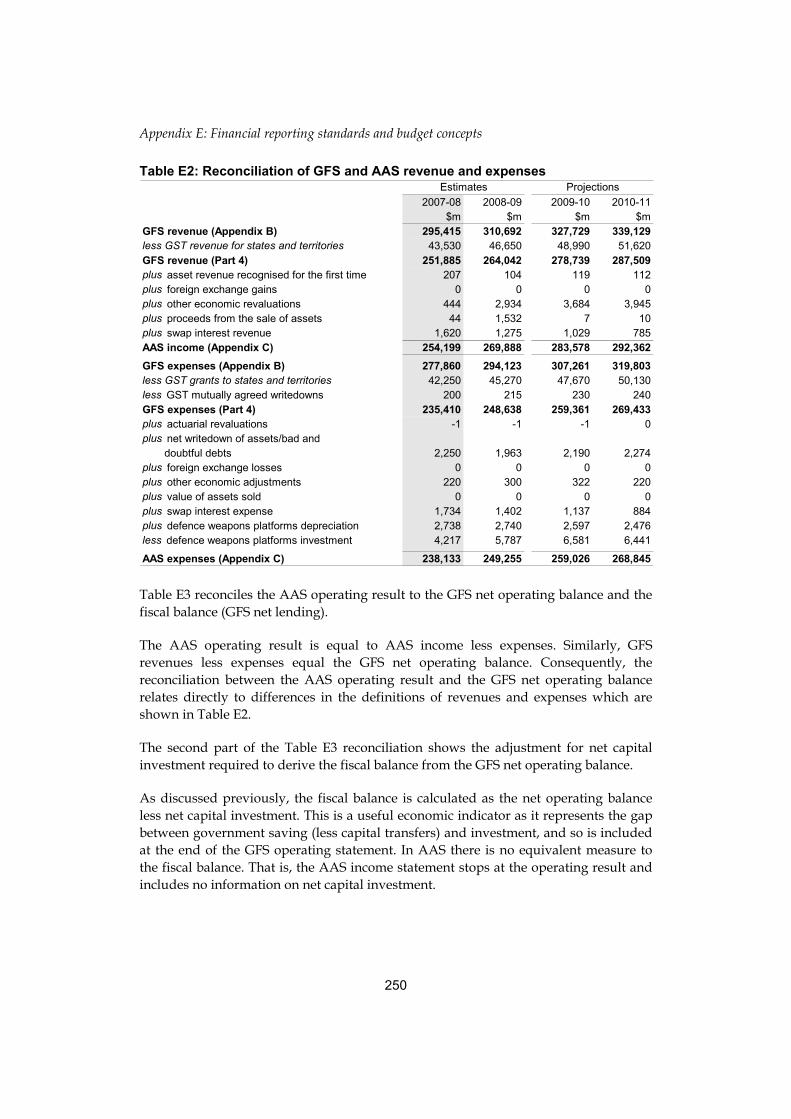
Appendix E: Financial reporting standards and budget concepts
250
Table E2: Reconciliation of GFS and AAS revenue and expenses
2007-08 2008-09 2009-10 2010-11$m $m $m $m
GFS revenue (Appendix B) 295,415 310,692 327,729 339,129less GST revenue for states and territories 43,530 46,650 48,990 51,620GFS revenue (Part 4) 251,885 264,042 278,739 287,509plus asset revenue recognised for the first time 207 104 119 112plus foreign exchange gains 0 0 0 0plus other economic revaluations 444 2,934 3,684 3,945plus proceeds from the sale of assets 44 1,532 7 10plus swap interest revenue 1,620 1,275 1,029 785AAS income (Appendix C) 254,199 269,888 283,578 292,362GFS expenses (Appendix B) 277,860 294,123 307,261 319,803less GST grants to states and territories 42,250 45,270 47,670 50,130less GST mutually agreed writedowns 200 215 230 240GFS expenses (Part 4) 235,410 248,638 259,361 269,433plus actuarial revaluations -1 -1 -1 0plus net writedown of assets/bad and
doubtful debts 2,250 1,963 2,190 2,274plus foreign exchange losses 0 0 0 0plus other economic adjustments 220 300 322 220plus value of assets sold 0 0 0 0plus swap interest expense 1,734 1,402 1,137 884plus defence weapons platforms depreciation 2,738 2,740 2,597 2,476less defence weapons platforms investment 4,217 5,787 6,581 6,441
AAS expenses (Appendix C) 238,133 249,255 259,026 268,845
Estimates Projections
Table E3 reconciles the AAS operating result to the GFS net operating balance and the fiscal balance (GFS net lending).
The AAS operating result is equal to AAS income less expenses. Similarly, GFS revenues less expenses equal the GFS net operating balance. Consequently, the reconciliation between the AAS operating result and the GFS net operating balance relates directly to differences in the definitions of revenues and expenses which are shown in Table E2.
The second part of the Table E3 reconciliation shows the adjustment for net capital investment required to derive the fiscal balance from the GFS net operating balance.
As discussed previously, the fiscal balance is calculated as the net operating balance less net capital investment. This is a useful economic indicator as it represents the gap between government saving (less capital transfers) and investment, and so is included at the end of the GFS operating statement. In AAS there is no equivalent measure to the fiscal balance. That is, the AAS income statement stops at the operating result and includes no information on net capital investment.
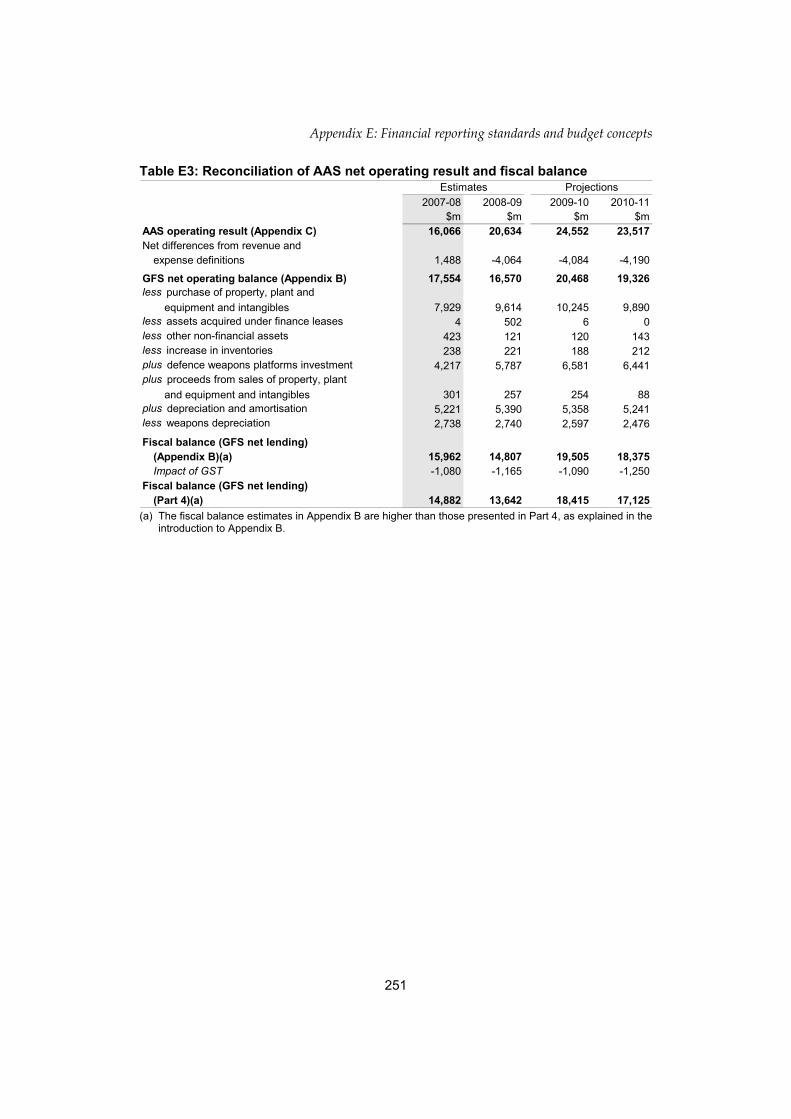
Appendix E: Financial reporting standards and budget concepts
251
Table E3: Reconciliation of AAS net operating result and fiscal balance
2007-08 2008-09 2009-10 2010-11$m $m $m $m
AAS operating result (Appendix C) 16,066 20,634 24,552 23,517Net differences from revenue and
expense definitions 1,488 -4,064 -4,084 -4,190
GFS net operating balance (Appendix B) 17,554 16,570 20,468 19,326less purchase of property, plant and
equipment and intangibles 7,929 9,614 10,245 9,890less assets acquired under finance leases 4 502 6 0less other non-financial assets 423 121 120 143less increase in inventories 238 221 188 212plus defence weapons platforms investment 4,217 5,787 6,581 6,441plus proceeds from sales of property, plant
and equipment and intangibles 301 257 254 88plus depreciation and amortisation 5,221 5,390 5,358 5,241less weapons depreciation 2,738 2,740 2,597 2,476
Fiscal balance (GFS net lending)(Appendix B)(a) 15,962 14,807 19,505 18,375Impact of GST -1,080 -1,165 -1,090 -1,250
Fiscal balance (GFS net lending)(Part 4)(a) 14,882 13,642 18,415 17,125
Estimates Projections
(a) The fiscal balance estimates in Appendix B are higher than those presented in Part 4, as explained in the
introduction to Appendix B.


253
APPENDIX F: HISTORICAL AUSTRALIAN GOVERNMENT DATA
This appendix provides historical data for the Australian Government fiscal aggregates across the general government, public non-financial corporations and non-financial public sectors.
Under the accrual Government Finance Statistics (GFS) framework, flows are recorded in the period in which they occurred. As a result, prior period outcomes may be revised where information arises that could reasonably be expected to have been known in the past, is material in at least one of the affected periods and can be reliably assigned to the relevant period(s).
Estimates up to and including 1998-99 are calculated on cash terms, while estimates from 1999-00 onwards are derived from an accrual framework. Due to methodological and data source changes associated with the move to an accrual accounting framework, time series data that include measures derived under both cash and accrual accounting should be used with caution.
There are other structural breaks within the data set, prior to the shift to accrual reporting. Classification differences and revisions, as well as changes to the structure of the budget, can impact on comparisons over such an extended period.
Specific factors that affect the comparability of data between years include:
• classification differences in the data relating to the period prior to 1976-77 (which means that earlier data may not be entirely consistent with data for 1976-77 onwards);
• adjustments in the coverage of agencies included in the accounts of the different sectors. These include the reclassification of Central Banking Authorities from the general government to the public financial corporations sector in 1998-99, and subsequent back casting to account for this change;
• consistent with the revised GFS treatment announced by the Australian Bureau of Statistics (ABS) (cat. no. 5501.0, released October 2002), the general government surplus measures in this statement, from 1998-99 onwards, incorporate the interest component of superannuation related payments by the Australian Government general government sector in respect of accumulated public non-financial corporations’ superannuation liabilities;
• transfers of taxing powers between the Australian Government and the States;
• other changes in financial arrangements between the Australian Government and the state/local government sector; and
Appendix F: Historical Australian Government data
254
• changes in arrangements for transfer payments, where tax concessions or rebates are replaced by payments through the social security system. This has the effect of increasing both cash receipts and payments, as compared with earlier periods, but not changing cash balances. Changes in the opposite direction (tax expenditures replacing payments) reduce both cash payments and receipts.
Cash data from 1998-99 onwards, net debt data from 1999-00 onwards and accrual data are sourced from Australian Government Final Budget Outcomes and Treasury estimates. Cash data prior to 1998-99 are sourced from the Australian Bureau of Statistics (ABS) 1997-98 Government Finance Statistics (cat. no. 5512.0), net debt data from 1987-88 to 1998-99 are from ABS 1999-00 Government Financial Estimates (cat. no. 5501.0) and ABS 1998 Public Sector Financial Assets and Liabilities (cat. no. 5513.0), and net debt data prior to 1987-88 are Treasury estimates.
Occasionally classification changes are made that require revisions to the historic series. Where appropriate, the changes are back-cast to 1999-00 to ensure that data is consistent across the accrual period. For example, the back-casting to account for the market valuation of net debt as discussed on page 2-12 of Budget Paper No. 1, Budget Strategy and Outlook 2003-04.
While approximate adjustments can be made to identify trends in budget aggregates on a generally consistent basis, the further back the analysis is taken, the more difficult the task becomes.

Appendix F: Historical Australian Government data
255
Table F1: Australian Government general government sector receipts, payments and underlying cash balance(a)
FutureFund
earningsPer cent Per cent
real Per cent real Per cent Per cent$m growth of GDP $m growth of GDP $m $m of GDP
1974-75 15,325 5.7 22.0 15,275 15.7 21.9 - 50 0.11975-76 18,316 3.7 22.4 19,876 12.9 24.3 - -1,560 -1.91976-77 21,418 4.1 22.7 22,657 1.5 24.0 - -1,239 -1.31977-78 23,491 0.8 22.8 25,489 3.4 24.8 - -1,998 -1.91978-79 25,666 3.3 22.1 27,753 2.9 23.8 - -2,087 -1.81979-80 29,780 5.9 22.5 31,041 2.1 23.5 - -1,261 -1.01980-81 35,148 6.7 23.5 35,260 2.7 23.6 - -112 -0.11981-82 40,831 2.8 23.7 40,394 1.4 23.4 - 437 0.31982-83 44,675 -1.7 24.1 47,907 6.5 25.8 - -3,232 -1.71983-84 49,102 3.0 23.4 55,966 9.5 26.7 - -6,864 -3.31984-85 57,758 11.8 25.0 63,639 8.0 27.5 - -5,881 -2.51985-86 64,845 5.7 25.4 69,838 3.3 27.4 - -4,993 -2.01986-87 73,145 5.4 26.2 75,392 0.9 27.0 - -2,247 -0.81987-88 81,217 3.0 25.4 79,440 -2.2 24.9 - 1,777 0.61988-89 88,369 -0.2 24.4 82,202 -5.1 22.7 - 6,167 1.71989-90 95,517 1.8 24.0 88,882 1.8 22.4 - 6,635 1.71990-91 97,705 -2.6 23.9 97,333 4.2 23.8 - 372 0.11991-92 92,966 -6.7 22.3 104,551 5.3 25.1 - -11,585 -2.81992-93 94,448 0.3 21.6 111,484 5.3 25.4 - -17,036 -3.91993-94 100,142 5.1 21.8 117,252 4.3 25.5 - -17,110 -3.71994-95 109,720 8.6 22.5 122,901 3.9 25.3 - -13,181 -2.71995-96 121,105 7.7 23.4 131,182 4.1 25.3 - -10,077 -1.91996-97 129,845 5.5 23.8 135,126 1.4 24.8 - -5,281 -1.01997-98 135,779 3.2 23.5 134,608 -1.7 23.3 - 1,171 0.21998-99 146,496 7.6 24.1 142,159 5.3 23.4 - 4,337 0.7
1999-00 166,089 na 25.7 153,030 na 23.7 - 13,059 2.02000-01 161,114 -7.1 23.4 155,143 -2.9 22.5 - 5,970 0.92001-02 162,884 -1.2 22.1 163,867 3.2 22.3 - -983 -0.12002-03 176,503 5.2 22.6 169,017 0.1 21.6 - 7,486 1.02003-04 187,336 2.1 22.3 179,300 2.1 21.3 - 8,036 1.02004-05 203,960 4.7 22.7 190,344 2.1 21.2 - 13,616 1.52005-06 221,834 3.6 23.0 205,991 3.1 21.3 51 15,792 1.62006-07 236,697 1.7 22.6 217,355 0.6 20.8 2,135 17,208 1.62007-08(e) 251,840 3.5 22.5 233,624 4.5 20.8 3,382 14,834 1.32008-09(e) 263,594 1.6 22.1 246,132 2.3 20.6 3,066 14,396 1.22009-10(p) 278,063 4.2 22.3 257,124 3.2 20.6 3,210 17,729 1.42010-11(p) 286,646 1.9 22.1 268,240 3.1 20.7 3,317 15,089 1.2
balance(b)Receipts Payments
Underlyingcash
(a) There is a break in the series between 1998-99 and 1999-00. Data for the years up to and including 1998-99
are consistent with the cash ABS GFS reporting requirements. From 1999-00, data are derived from an accrual ABS GFS reporting framework, with receipts proxied by receipts from operating activities and sales of non-financial assets, and payments proxied by payments for operating activities, purchases of non-financial assets and net acquisition of assets under finance leases. Due to associated methodological and data-source changes, time series data that encompass measures derived under both cash and accrual accounting should be used with caution.
(b) Underlying cash balance is equal to receipts less payments less expected Future Fund earnings. For the purposes of consistent comparison with years prior to 2005-06, Future Fund earnings should be added back to the underlying cash balance.
(e) Estimates. (p) Projections. na Not applicable, due to a structural break in the series.

Appendix F: Historical Australian Government data
256
Table F2: Australian Government general government sector taxation receipts, non-taxation receipts and total receipts(a)
Per cent Per cent Per cent real Per cent real Per cent real Per cent
$m growth of GDP $m growth of GDP $m growth of GDP1974-75 14,141 7.1 20.3 1,184 -8.2 1.7 15,325 5.7 22.01975-76 16,920 3.8 20.7 1,396 2.3 1.7 18,316 3.7 22.41976-77 19,714 3.8 20.9 1,704 8.7 1.8 21,418 4.1 22.71977-78 21,428 -0.1 20.8 2,063 11.3 2.0 23,491 0.8 22.81978-79 23,409 3.3 20.1 2,257 3.4 1.9 25,666 3.3 22.11979-80 27,473 7.2 20.8 2,307 -6.7 1.7 29,780 5.9 22.51980-81 32,641 7.4 21.8 2,507 -1.7 1.7 35,148 6.7 23.51981-82 37,880 2.7 22.0 2,951 4.2 1.7 40,831 2.8 23.71982-83 41,025 -2.7 22.1 3,650 11.1 2.0 44,675 -1.7 24.11983-84 44,849 2.4 21.4 4,253 9.2 2.0 49,102 3.0 23.41984-85 52,970 12.2 22.9 4,788 7.0 2.1 57,758 11.8 25.01985-86 58,841 4.6 23.1 6,004 18.0 2.4 64,845 5.7 25.41986-87 66,467 5.5 23.8 6,678 3.9 2.4 73,145 5.4 26.21987-88 75,076 4.8 23.5 6,141 -14.7 1.9 81,217 3.0 25.41988-89 83,452 1.9 23.0 4,917 -26.6 1.4 88,369 -0.2 24.41989-90 90,773 2.5 22.8 4,744 -9.1 1.2 95,517 1.8 24.01990-91 92,739 -2.8 22.7 4,966 -0.4 1.2 97,705 -2.6 23.91991-92 87,364 -7.7 20.9 5,602 10.6 1.3 92,966 -6.7 22.31992-93 88,760 0.3 20.3 5,688 0.3 1.3 94,448 0.3 21.61993-94 93,362 4.3 20.3 6,780 18.2 1.5 100,142 5.1 21.81994-95 104,921 11.4 21.6 4,799 -29.8 1.0 109,720 8.6 22.51995-96 115,700 7.6 22.3 5,405 9.9 1.0 121,105 7.7 23.41996-97 124,559 5.9 22.8 5,286 -3.8 1.0 129,845 5.5 23.81997-98 130,984 3.8 22.7 4,795 -10.5 0.8 135,779 3.2 23.51998-99 141,105 7.5 23.2 5,391 12.1 0.9 146,496 7.6 24.11999-00 151,313 na 23.5 14,777 na 2.3 166,089 na 25.72000-01 146,698 -7.2 21.3 14,416 -6.6 2.1 161,114 -7.1 23.42001-02 148,343 -1.2 20.2 14,541 -1.5 2.0 162,884 -1.2 22.12002-03 161,418 5.7 20.7 15,084 0.7 1.9 176,503 5.2 22.62003-04 173,023 3.1 20.6 14,313 -8.7 1.7 187,336 2.1 22.32004-05 188,176 4.6 21.0 15,784 6.1 1.8 203,960 4.7 22.72005-06 203,918 3.3 21.1 17,916 8.2 1.9 221,834 3.6 23.02006-07 217,866 1.8 20.8 18,831 0.2 1.8 236,697 1.7 22.62007-08(e) 231,818 3.5 20.7 20,022 3.4 1.8 251,840 3.5 22.52008-09(e) 242,263 1.4 20.3 21,331 3.4 1.8 263,594 1.6 22.12009-10(p) 255,418 4.2 20.5 22,645 4.9 1.8 278,063 4.2 22.32010-11(p) 262,538 1.6 20.2 24,109 5.2 1.9 286,646 1.9 22.1
Taxation receipts Non-taxation receipts Total receipts
(a) There is a break in the series between 1998-99 and 1999-00. Data for the years up to and including 1998-99
are consistent with the cash ABS GFS reporting requirements. From 1999-00, data are derived from an accrual ABS GFS reporting framework, with receipts proxied by receipts from operating activities and sales of non-financial assets. Due to associated methodological and data source changes, time series data that encompass measures derived under both cash and accrual accounting should be used with caution.
(e) Estimates. (p) Projections. na Not applicable, due to a structural break in the series.

Appendix F: Historical Australian Government data
257
Table F3: Australian Government general government sector receipts Actual2006-07 2007-08 2008-09 2009-10 2010-11
$m $m $m $m $mIncome taxationIndividuals and other withholding taxes
Gross income tax withholding 107,119 112,730 115,330 121,500 128,320Gross other individuals 25,797 27,140 28,050 29,620 30,150less: Refunds 17,145 19,790 21,850 22,420 24,090
Total individuals and other withholding taxation 115,770 120,080 121,530 128,700 134,380Fringe benefits tax 3,761 3,880 4,010 3,870 3,850Superannuation funds
Contributions and earnings 7,513 10,000 11,520 12,740 13,740Superannuation surcharge 699 120 40 40 40
Total superannuation taxation 8,211 10,120 11,560 12,780 13,780Company tax 57,100 63,830 70,230 74,360 74,840Petroleum resource rent tax 1,510 1,950 2,230 2,720 2,320Income taxation receipts 186,353 199,860 209,560 222,430 229,170Excise and customsExcise duty
Petrol 7,139 7,070 6,990 7,040 7,140Diesel 6,207 6,400 6,580 6,800 7,030Other fuel products 792 980 1,130 1,280 1,460Crude oil 525 340 170 160 220Beer 1,829 1,890 1,940 2,000 2,040Potable spirits 874 950 1,050 1,150 1,260Tobacco 5,382 5,420 5,450 5,470 5,480
Total excise duty receipts 22,749 23,050 23,310 23,900 24,630Customs duty
Textiles, clothing and footwear 928 1,000 1,060 830 590Passenger motor vehicles 819 960 1,050 830 560Excise-like goods 2,204 2,340 2,480 2,630 2,770Other imports 1,482 1,530 1,590 1,650 1,710less: Refunds and drawbacks 370 370 380 380 380
Total customs duty receipts 5,063 5,460 5,800 5,560 5,250Excise and customs receipts 27,812 28,510 29,110 29,460 29,880Other taxationWine equalisation tax 650 670 690 710 730Luxury car tax 364 390 400 420 430Agricultural levies 608 589 599 401 369Other taxes 2,080 1,800 1,904 1,997 1,959Other taxation receipts 3,701 3,448 3,593 3,528 3,488Taxation receipts 217,866 231,818 242,263 255,418 262,538Non-taxation Sales of goods and services 5,025 5,445 5,593 5,701 5,813Dividends 3,197 2,692 4,017 3,983 4,434Interest received 3,731 4,482 4,185 5,310 6,240Other non-taxation receipts 6,879 7,402 7,536 7,652 7,623Non-taxation receipts 18,831 20,022 21,331 22,645 24,109Total receipts 236,697 251,840 263,594 278,063 286,646
ProjectionsEstimates
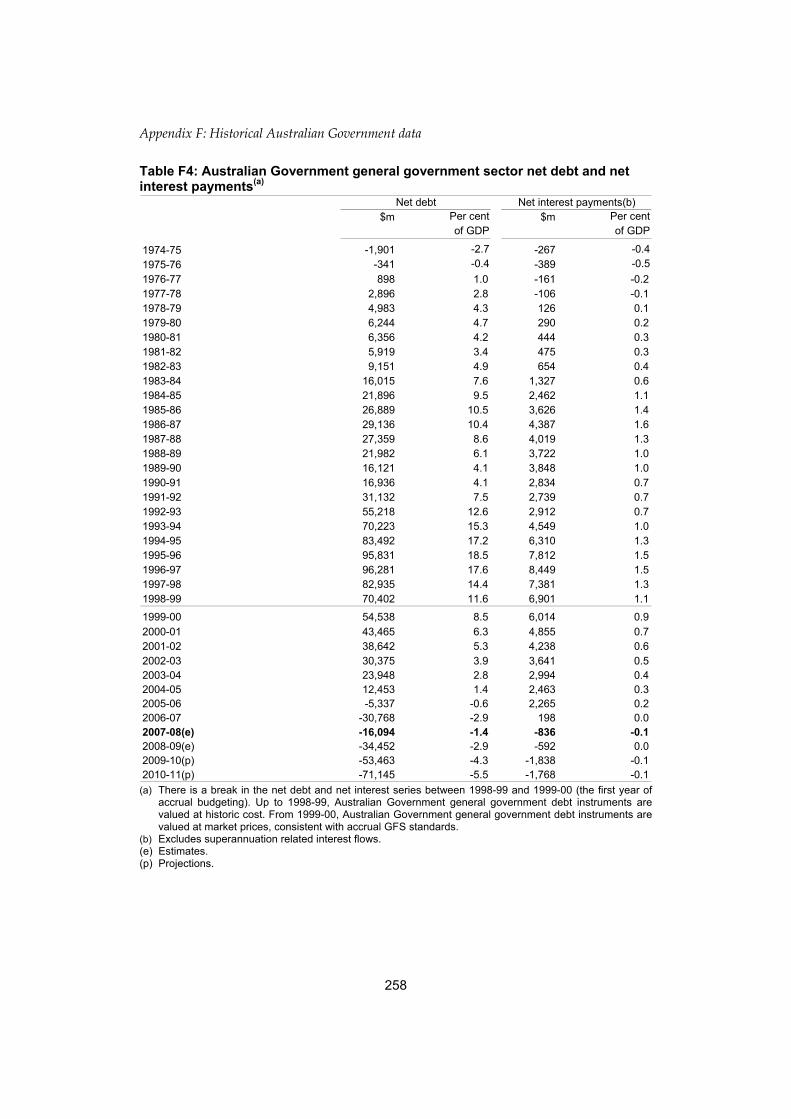
Appendix F: Historical Australian Government data
258
Table F4: Australian Government general government sector net debt and net interest payments(a)
$m Per cent $m Per centof GDP of GDP
1974-75 -1,901 -2.7 -267 -0.41975-76 -341 -0.4 -389 -0.51976-77 898 1.0 -161 -0.21977-78 2,896 2.8 -106 -0.11978-79 4,983 4.3 126 0.11979-80 6,244 4.7 290 0.21980-81 6,356 4.2 444 0.31981-82 5,919 3.4 475 0.31982-83 9,151 4.9 654 0.41983-84 16,015 7.6 1,327 0.61984-85 21,896 9.5 2,462 1.11985-86 26,889 10.5 3,626 1.41986-87 29,136 10.4 4,387 1.61987-88 27,359 8.6 4,019 1.31988-89 21,982 6.1 3,722 1.01989-90 16,121 4.1 3,848 1.01990-91 16,936 4.1 2,834 0.71991-92 31,132 7.5 2,739 0.71992-93 55,218 12.6 2,912 0.71993-94 70,223 15.3 4,549 1.01994-95 83,492 17.2 6,310 1.31995-96 95,831 18.5 7,812 1.51996-97 96,281 17.6 8,449 1.51997-98 82,935 14.4 7,381 1.31998-99 70,402 11.6 6,901 1.1
1999-00 54,538 8.5 6,014 0.92000-01 43,465 6.3 4,855 0.72001-02 38,642 5.3 4,238 0.62002-03 30,375 3.9 3,641 0.52003-04 23,948 2.8 2,994 0.42004-05 12,453 1.4 2,463 0.32005-06 -5,337 -0.6 2,265 0.22006-07 -30,768 -2.9 198 0.02007-08(e) -16,094 -1.4 -836 -0.12008-09(e) -34,452 -2.9 -592 0.02009-10(p) -53,463 -4.3 -1,838 -0.12010-11(p) -71,145 -5.5 -1,768 -0.1
Net debt Net interest payments(b)
(a) There is a break in the net debt and net interest series between 1998-99 and 1999-00 (the first year of
accrual budgeting). Up to 1998-99, Australian Government general government debt instruments are valued at historic cost. From 1999-00, Australian Government general government debt instruments are valued at market prices, consistent with accrual GFS standards.
(b) Excludes superannuation related interest flows. (e) Estimates. (p) Projections.

259
Appendix F: Historical Australian Government data Ta
ble
F5: A
ustr
alia
n G
over
nmen
t gen
eral
gov
ernm
ent s
ecto
r rev
enue
, exp
ense
s, n
et c
apita
l inv
estm
ent,
fisca
l bal
ance
and
ne
t wor
th(a
)
Per
cen
t P
er c
ent
Per
cen
t P
er c
ent
Per
cen
t $m
of G
DP
$mof
GD
P$m
of G
DP
$mof
GD
P$m
of G
DP
1996
-97
141,
688
26.0
145,
809
26.7
900.
0-4
,211
-0.8
-74,
354
-13.
619
97-9
814
6,82
025
.414
8,64
625
.714
70.
0-1
,973
-0.3
-68,
544
-11.
919
98-9
915
1,89
725
.014
6,62
024
.11,
433
0.2
3,84
40.
6-7
6,15
0-1
2.5
1999
-00
167,
158
25.9
156,
492
24.3
-1,2
25-0
.211
,892
1.8
-35,
142
-5.4
2000
-01
162,
074
23.5
157,
261
22.8
-1,1
68-0
.25,
981
0.9
-37,
484
-5.4
2001
-02
162,
956
22.1
166,
672
22.7
-369
-0.1
-3,3
47-0
.5-4
2,52
7-5
.820
02-0
317
5,51
322
.517
0,95
021
.9-2
190.
04,
782
0.6
-47,
301
-6.1
2003
-04
187,
924
22.4
181,
948
21.7
724
0.1
5,25
20.
6-3
3,22
2-4
.020
04-0
520
6,60
523
.019
4,84
921
.714
70.
011
,609
1.3
-23,
075
-2.6
2005
-06
221,
918
23.0
205,
475
21.3
1,05
20.
115
,391
1.6
-15,
011
-1.6
2006
-07
237,
008
22.7
218,
895
20.9
2,20
80.
215
,905
1.5
2,22
30.
220
07-0
8(e)
251,
885
22.5
235,
410
21.0
1,59
20.
114
,882
1.3
17,2
171.
520
08-0
9(e)
264,
042
22.1
248,
638
20.8
1,76
30.
113
,642
1.1
34,1
412.
920
09-1
0(p)
278,
739
22.4
259,
361
20.8
963
0.1
18,4
151.
553
,494
4.3
2010
-11(
p)28
7,50
922
.126
9,43
320
.895
10.
117
,125
1.3
71,7
505.
5
Net
wor
th(b
)(c)
Rev
enue
Exp
ense
s(b)
Net
cap
ital i
nves
tmen
tFi
scal
bal
ance
(b)
(a
) Th
e fis
cal b
alan
ce is
equ
al to
reve
nue
less
exp
ense
s le
ss n
et c
apita
l inv
estm
ent.
Net
wor
th is
cal
cula
ted
as a
sset
s m
inus
liab
ilitie
s.
(b)
Exp
ense
s ha
ve b
een
revi
sed
dow
nwar
ds a
nd th
e fis
cal b
alan
ce re
vise
d up
war
ds fo
r th
e pe
riod
from
200
0-01
to 2
006-
07 d
ue to
a c
hang
e in
acc
ount
ing
treat
men
t th
at re
cogn
ises
edu
catio
n ex
pens
es w
hen
gran
ts a
re d
ue to
be
paid
, rat
her t
han
whe
n th
e M
inis
teria
l det
erm
inat
ion
is s
igne
d. T
he re
duct
ion
in a
ccru
ed li
abili
ties
due
to th
is c
hang
e al
so im
prov
es n
et w
orth
for t
he p
erio
d fro
m 1
999-
00 to
200
6-07
. (c
) Th
ere
is a
bre
ak in
the
net w
orth
ser
ies
betw
een
1998
-99
and
1999
-00.
Dat
a up
to 1
998-
99 a
re s
ourc
ed fr
om th
e A
ustra
lian
Gov
ernm
ent’s
Con
solid
ated
Fin
anci
al
Sta
tem
ents
bas
ed o
n A
ustra
lian
acco
untin
g st
anda
rds.
Dat
a be
ginn
ing
in 1
999-
00 a
re b
ased
on
the
GFS
fram
ewor
k. F
or th
e ge
nera
l gov
ernm
ent s
ecto
r, th
e m
ajor
ch
ange
acr
oss
the
brea
k in
the
serie
s is
an
impr
ovem
ent i
n ne
t wor
th. T
his
is p
rimar
ily d
ue to
the
mov
e fro
m v
alui
ng in
vest
men
ts in
pub
lic c
orpo
ratio
ns a
t his
toric
co
st to
cur
rent
mar
ket v
alue
(w
hich
is c
alcu
late
d us
ing
the
shar
e pr
ice
for
liste
d co
rpor
atio
ns).
This
is p
artly
offs
et b
y de
fenc
e w
eapo
ns p
latfo
rms
no lo
nger
bei
ng
reco
rded
as
asse
ts a
nd v
alui
ng d
ebt a
t cur
rent
mar
ket v
alue
. (e
) E
stim
ates
. (p
) P
roje
ctio
ns.
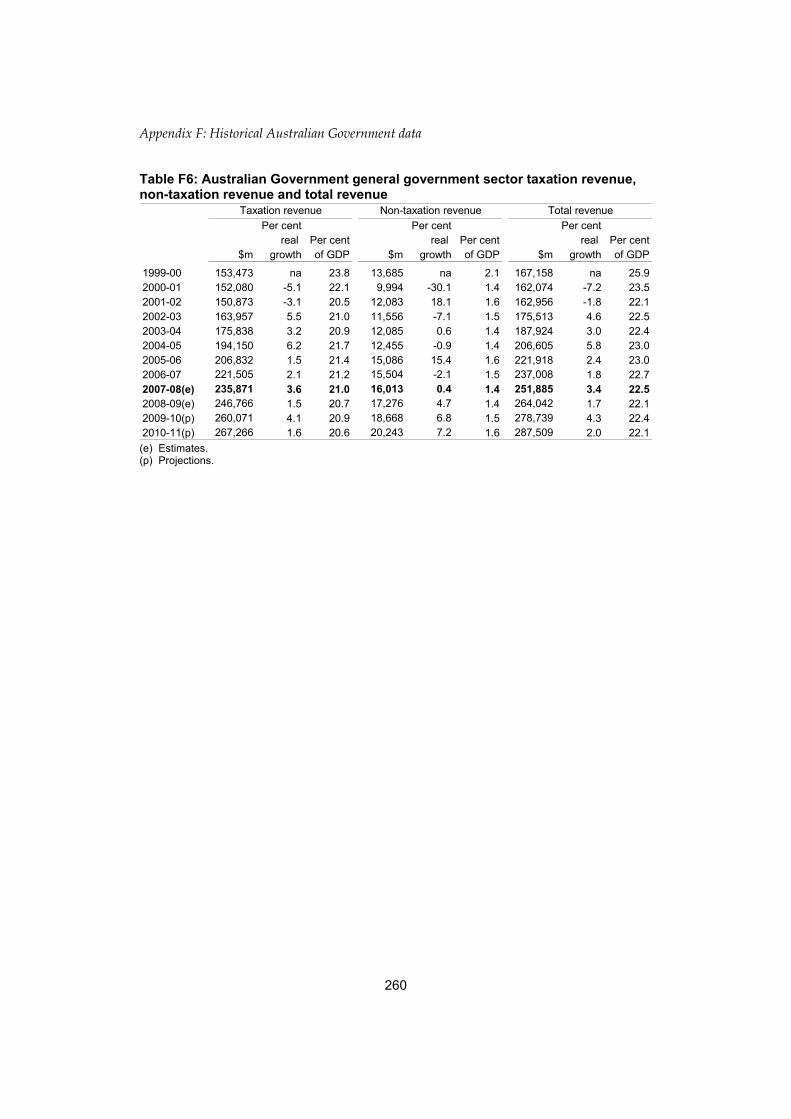
Appendix F: Historical Australian Government data
260
Table F6: Australian Government general government sector taxation revenue, non-taxation revenue and total revenue
Per cent Per cent Per cent real Per cent real Per cent real Per cent
$m growth of GDP $m growth of GDP $m growth of GDP
1999-00 153,473 na 23.8 13,685 na 2.1 167,158 na 25.92000-01 152,080 -5.1 22.1 9,994 -30.1 1.4 162,074 -7.2 23.52001-02 150,873 -3.1 20.5 12,083 18.1 1.6 162,956 -1.8 22.12002-03 163,957 5.5 21.0 11,556 -7.1 1.5 175,513 4.6 22.52003-04 175,838 3.2 20.9 12,085 0.6 1.4 187,924 3.0 22.42004-05 194,150 6.2 21.7 12,455 -0.9 1.4 206,605 5.8 23.02005-06 206,832 1.5 21.4 15,086 15.4 1.6 221,918 2.4 23.02006-07 221,505 2.1 21.2 15,504 -2.1 1.5 237,008 1.8 22.72007-08(e) 235,871 3.6 21.0 16,013 0.4 1.4 251,885 3.4 22.52008-09(e) 246,766 1.5 20.7 17,276 4.7 1.4 264,042 1.7 22.12009-10(p) 260,071 4.1 20.9 18,668 6.8 1.5 278,739 4.3 22.42010-11(p) 267,266 1.6 20.6 20,243 7.2 1.6 287,509 2.0 22.1
Total revenueNon-taxation revenueTaxation revenue
(e) Estimates. (p) Projections.

Appendix F: Historical Australian Government data
261
Table F7: Australian Government general government sector revenue Actual2006-07 2007-08 2008-09 2009-10 2010-11
$m $m $m $m $mIncome taxationIndividuals and other withholding taxes
Gross income tax withholding 107,809 113,330 115,980 122,210 129,110Gross other individuals 26,952 28,110 29,140 30,860 31,430less: Refunds 17,147 19,790 21,850 22,420 24,090
Total individuals and other withholding taxation 117,614 121,650 123,270 130,650 136,450Fringe benefits tax 3,754 3,970 4,100 3,960 3,950Superannuation funds
Contributions and earnings 7,577 10,050 11,580 12,810 13,810Superannuation surcharge 302 80 10 10 10
Total superannuation taxation 7,879 10,130 11,590 12,820 13,820Company tax 58,538 65,250 71,850 76,100 76,580Petroleum resource rent tax 1,594 2,060 2,380 2,750 2,240Income taxation revenue 189,378 203,060 213,190 226,280 233,040Excise and customsExcise duty
Petrol 7,128 7,110 7,030 7,080 7,180Diesel 6,197 6,400 6,580 6,800 7,030Other fuel products 803 980 1,130 1,280 1,460Crude oil 525 340 170 160 220Beer 1,826 1,890 1,940 2,000 2,040Potable spirits 873 950 1,050 1,150 1,260Tobacco 5,382 5,420 5,450 5,470 5,480
Total excise duty revenue 22,734 23,090 23,350 23,940 24,670Customs duty
Textiles, clothing and footwear 932 1,000 1,060 830 590Passenger motor vehicles 1,253 1,360 1,450 1,160 790Excise-like goods 2,204 2,340 2,480 2,630 2,770Other imports 1,485 1,540 1,600 1,660 1,720less: Refunds and drawbacks 230 230 240 240 240
Total customs duty revenue 5,644 6,010 6,350 6,040 5,630Excise and customs revenue 28,379 29,100 29,700 29,980 30,300Other taxationWine equalisation tax 651 680 700 720 740Luxury car tax 365 400 410 430 440Agricultural levies 608 589 599 401 369Other taxes 2,124 2,042 2,166 2,259 2,376Other taxation revenue 3,748 3,710 3,875 3,810 3,925Taxation revenue 221,505 235,871 246,766 260,071 267,266Non-taxation Sales of goods and services 5,064 5,191 5,322 5,452 5,567Dividends 2,999 2,707 4,017 4,003 4,384Interest received 3,921 4,663 4,467 5,601 6,537Other non-taxation revenue 3,520 3,451 3,471 3,613 3,755Non-taxation revenue 15,504 16,013 17,276 18,668 20,243Total revenue 237,008 251,885 264,042 278,739 287,509
Estimates Projections
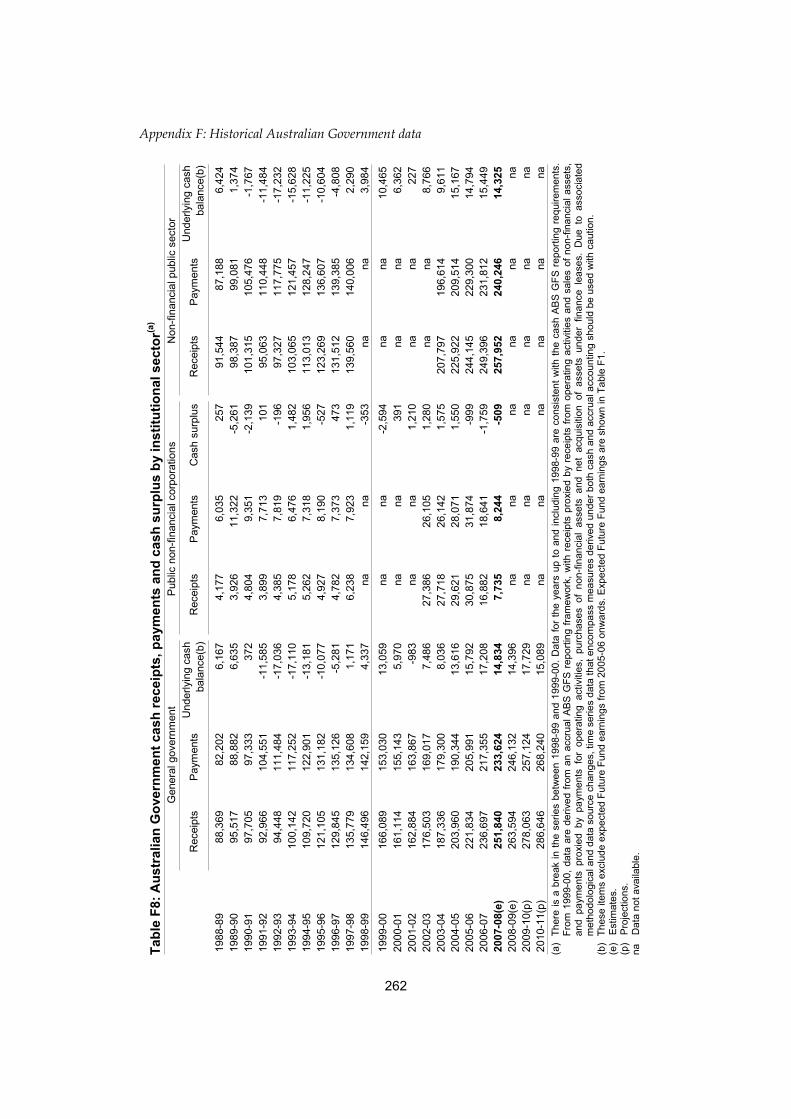
Appendix F: Historical Australian Government data
262
Tabl
e F8
: Aus
tral
ian
Gov
ernm
ent c
ash
rece
ipts
, pay
men
ts a
nd c
ash
surp
lus
by in
stitu
tiona
l sec
tor(a
)
Rec
eipt
sP
aym
ents
Und
erly
ing
cash
bala
nce(
b)R
ecei
pts
Pay
men
tsC
ash
surp
lus
Rec
eipt
sP
aym
ents
Und
erly
ing
cash
bala
nce(
b)
1988
-89
88,3
6982
,202
6,16
74,
177
6,03
525
791
,544
87,1
886,
424
1989
-90
95,5
1788
,882
6,63
53,
926
11,3
22-5
,261
98,3
8799
,081
1,37
419
90-9
197
,705
97,3
3337
24,
804
9,35
1-2
,139
101,
315
105,
476
-1,7
6719
91-9
292
,966
104,
551
-11,
585
3,89
97,
713
101
95,0
6311
0,44
8-1
1,48
419
92-9
394
,448
111,
484
-17,
036
4,38
57,
819
-196
97,3
2711
7,77
5-1
7,23
219
93-9
410
0,14
211
7,25
2-1
7,11
05,
178
6,47
61,
482
103,
065
121,
457
-15,
628
1994
-95
109,
720
122,
901
-13,
181
5,26
27,
318
1,95
611
3,01
312
8,24
7-1
1,22
519
95-9
612
1,10
513
1,18
2-1
0,07
74,
927
8,19
0-5
2712
3,26
913
6,60
7-1
0,60
419
96-9
712
9,84
513
5,12
6-5
,281
4,78
27,
373
473
131,
512
139,
385
-4,8
0819
97-9
813
5,77
913
4,60
81,
171
6,23
87,
923
1,11
913
9,56
014
0,00
62,
290
1998
-99
146,
496
142,
159
4,33
7na
na-3
53na
na3,
984
1999
-00
166,
089
153,
030
13,0
59na
na-2
,594
nana
10,4
6520
00-0
116
1,11
415
5,14
35,
970
nana
391
nana
6,36
220
01-0
216
2,88
416
3,86
7-9
83na
na1,
210
nana
227
2002
-03
176,
503
169,
017
7,48
627
,386
26,1
051,
280
nana
8,76
620
03-0
418
7,33
617
9,30
08,
036
27,7
1826
,142
1,57
520
7,79
719
6,61
49,
611
2004
-05
203,
960
190,
344
13,6
1629
,621
28,0
711,
550
225,
922
209,
514
15,1
6720
05-0
622
1,83
420
5,99
115
,792
30,8
7531
,874
-999
244,
145
229,
300
14,7
9420
06-0
723
6,69
721
7,35
517
,208
16,8
8218
,641
-1,7
5924
9,39
623
1,81
215
,449
2007
-08(
e)25
1,84
023
3,62
414
,834
7,73
58,
244
-509
257,
952
240,
246
14,3
2520
08-0
9(e)
263,
594
246,
132
14,3
96na
nana
nana
na20
09-1
0(p)
278,
063
257,
124
17,7
29na
nana
nana
na20
10-1
1(p)
286,
646
268,
240
15,0
89na
nana
nana
na
Gen
eral
gov
ernm
ent
Pub
lic n
on-fi
nanc
ial c
orpo
ratio
ns
Non
-fina
ncia
l pub
lic s
ecto
r
(a
) Th
ere
is a
bre
ak in
the
serie
s be
twee
n 19
98-9
9 an
d 19
99-0
0. D
ata
for t
he y
ears
up
to a
nd in
clud
ing
1998
-99
are
cons
iste
nt w
ith th
e ca
sh A
BS
GFS
rep
ortin
g re
quire
men
ts.
From
199
9-00
, dat
a ar
e de
rived
from
an
accr
ual A
BS G
FS r
epor
ting
fram
ewor
k, w
ith r
ecei
pts
prox
ied
by r
ecei
pts
from
ope
ratin
g ac
tiviti
es a
nd s
ales
of n
on-fi
nanc
ial a
sset
s,
and
paym
ents
pro
xied
by
paym
ents
for
ope
ratin
g ac
tiviti
es,
purc
hase
s of
non
-fina
ncia
l as
sets
and
net
acq
uisi
tion
of a
sset
s un
der
finan
ce l
ease
s. D
ue t
o as
soci
ated
m
etho
dolo
gica
l and
dat
a so
urce
cha
nges
, tim
e se
ries
data
that
enc
ompa
ss m
easu
res
deriv
ed u
nder
bot
h ca
sh a
nd a
ccru
al a
ccou
ntin
g sh
ould
be
used
with
cau
tion.
(b
) Th
ese
item
s ex
clud
e ex
pect
ed F
utur
e Fu
nd e
arni
ngs
from
200
5-06
onw
ards
. Exp
ecte
d Fu
ture
Fun
d ea
rnin
gs a
re s
how
n in
Tab
le F
1.
(e)
Estim
ates
. (p
) Pr
ojec
tions
. na
D
ata
not a
vaila
ble.

263
Appendix F: Historical Australian Government data Ta
ble
F9: A
ustr
alia
n G
over
nmen
t acc
rual
reve
nue,
exp
ense
s an
d fis
cal b
alan
ce b
y in
stitu
tiona
l sec
tor(a
)
Rev
enue
Exp
ense
s(b)
Fisc
al b
alan
ce(b
)R
even
ueE
xpen
ses
Fisc
al b
alan
ceR
even
ueE
xpen
ses
Fisc
al b
alan
ce
1996
-97
141,
688
145,
809
-4,2
1127
,431
26,0
15-3
31na
na-4
,542
1997
-98
146,
820
148,
646
-1,9
7329
,618
26,9
992,
360
nana
387
1998
-99
151,
897
146,
620
3,84
427
,687
26,0
88-8
1617
5,68
216
8,80
63,
028
1999
-00
167,
158
156,
492
11,8
9225
,485
23,5
421,
062
188,
695
174,
929
12,9
5320
00-0
116
2,07
415
7,26
15,
981
25,8
6924
,762
-826
183,
337
177,
417
5,15
620
01-0
216
2,95
616
6,67
2-3
,347
26,6
3825
,341
793
184,
986
187,
405
-2,5
5420
02-0
317
5,51
317
0,95
04,
782
24,3
3922
,916
1,97
519
4,72
518
8,78
16,
758
2003
-04
187,
924
181,
948
5,25
225
,449
23,4
442,
143
207,
628
199,
647
7,39
520
04-0
520
6,60
519
4,84
911
,609
26,9
6525
,191
1,47
322
7,68
521
4,15
513
,081
2005
-06
221,
918
205,
475
15,3
9128
,143
29,5
31-2
,442
243,
276
228,
221
12,9
4920
06-0
723
7,00
821
8,89
515
,905
15,4
4316
,360
-1,7
6324
8,66
423
1,46
914
,143
2007
-08(
e)25
1,88
523
5,41
014
,882
6,97
06,
812
-612
257,
458
240,
826
14,2
7020
08-0
9(e)
264,
042
248,
638
13,6
42na
nana
nana
na20
09-1
0(p)
278,
739
259,
361
18,4
15na
nana
nana
na20
10-1
1(p)
287,
509
269,
433
17,1
25na
nana
nana
na
Gen
eral
gov
ernm
ent
Pub
lic n
on-fi
nanc
ial c
orpo
ratio
ns
Non
-fina
ncia
l pub
lic s
ecto
r
(a
) Th
e fis
cal b
alan
ce is
equ
al to
reve
nue
less
exp
ense
s le
ss n
et c
apita
l inv
estm
ent.
Net
cap
ital i
nves
tmen
t is
not s
how
n in
this
tabl
e.
(b)
Exp
ense
s ha
ve b
een
revi
sed
dow
nwar
ds a
nd th
e fis
cal b
alan
ce re
vise
d up
war
ds fo
r th
e pe
riod
from
200
0-01
to 2
006-
07 d
ue to
a c
hang
e in
acc
ount
ing
treat
men
t th
at re
cogn
ises
edu
catio
n ex
pens
es w
hen
gran
ts a
re d
ue to
be
paid
, rat
her t
han
whe
n th
e M
inis
teria
l det
erm
inat
ion
is s
igne
d.
(e)
Est
imat
es.
(p)
Pro
ject
ions
. na
D
ata
not a
vaila
ble.
