mid-term evaluation of the erasmus+...
TRANSCRIPT

1
MID-TERM EVALUATION OF THE ERASMUS+ PROGRAMME UNITED KINGDOM NATIONAL AUTHORITY REPORT
OCTOBER 2017

2
TABLE OF CONTENTS EXECUTIVE SUMMARY 3 METHODOLOGY 5 RESPONSES TO THE QUESTIONS POSED BY THE COMMISSION 6 Question 1 6 Questions 2, 3, 4 9 Question 5 10 Questions 6,7 11 Question 8 12 Question 9 13 Questions 10, 11, 12 14 Question 13 15 Question 14 16 Questions 15, 16, 17 17 Questions 18, 19 19 Questions 20, 21 20 ANNEXES Annex A General and Specific Objectives of the Programme referred to in questions 1 & 21 22 Annex B Impact assessment projects involving the UK National Agency 24 Annex C Satisfaction data from the Dashboard 29 Table C0 Sample size 29 Table C1 General Satisfaction 30 Table C2 Better Skills 31 Table C3 Formal Recognition 32 Table C4 Language Skills 32 Table C5 Employability 33 Table C6 Social and political participation of young people 34 Annex D Summary and detailed conclusions from Erasmus+ Sector Consultative Groups’ meeting in London on 4 May 20172
35
Annex E Summary and detailed conclusions of consultations with Erasmus+ Country Advisory Groups meeting in the respective capitals of the Devolved Administrations of Scotland, Wales and Northern Ireland during May and June 2017 and views sought from the Erasmus+ Cross-Government Programme Board
36
Annex F Results of survey of relevant stakeholders conducted in May 2017 37 Annex G Selected results of Literature search 39
1 As specified in Articles 4 and 5 of the legal base 2 The sub annexes to D, E and F are available separately on request from [email protected].

3
EXECUTIVE SUMMARY
Delivery of objectives and added value: Most stakeholders and the National Agency conclude that
Erasmus + is delivering successfully against its objectives. The programme is popular and feedback is
generally positive. Erasmus+ in higher education accounts for around 50% of UK undergraduate
outward mobility. Amongst other key areas, institutions and participants draw particular attention
to the impact on standards of academic provision and outcomes, the benefits of an international
experience, support for languages and employability and the benefits of networks through which to
exchange experience and good practice. With regard to additionality, we asked our analysts to give a
view; they responded that, based on the material collected, the “added value” of Erasmus+ is
difficult to identify, largely because of the absence of a comparable control group. Those who
choose to participate in an Erasmus scheme are likely to be a self-selecting sample with greater
potential to achieve higher degree outcomes and higher earnings. However, analytical advice also
suggests that the British Council “Culture at Work” report provided good evidence to show that skills
gained/improved upon through Erasmus+ are desirable to employers. We welcome the
Commission’s intention to conduct a counterfactual impact study, and look forward to seeing the
results3.
Integration of programmes into Erasmus + (from the previous design of separate sectoral
programmes and brands): The integration of several predecessor programmes into Erasmus+ has
had a positive impact on the efficiency of implementation at all levels in the UK. The programme is
well regarded by all the sectors it covers, and seen as an improvement on its predecessors. The
satisfaction data available on the Erasmus+ Dashboard shows high overall satisfaction with the
programme by participants. There are likewise high ratings for the programme increasing skills,
contributing to employability, increasing social and political participation and contributing to
language learning. The introduction of International Credit Mobility (ICM) in 2015 extended
opportunities for mobility under the programme beyond Europe. The UK and other Member States
welcomed this development but called for simplification of the system for allocating these funds. We
welcome the progress the Commission has made which led to an improved take-up of ICM in the
following year. Looking ahead, we believe that further improvements can be made including the
possibility of greater allocation of funds to popular countries which are heavily over-subscribed.
Operations (and procedures): Overall, administration of the programme has been simplified and
made more effective – a key objective of the new 2011 programme design - but feedback indicates
that there remains scope for further improvement. The simplified (unit cost) budgets have made
project management and monitoring simpler and have improved scrutiny of financial activity; this is
especially true in the Youth sector. However, some applicants and beneficiaries reported difficulty
with the management and reporting procedures, particularly where they are being asked to report
on unit costs to the UK National Agency (NA), but also on actual expenditure to their organisations’
finance departments. In particular, the application forms continue to present a barrier for smaller
organisations to engage with the process. This may create an unintentional bias in favour of larger
organisations with resources and experience. In 2014 we highlighted our continued concerns about
delayed or malfunctioning Erasmus+ IT tools, and some delays to the Commission’s delivery of key
guidance documents such as the work programme guidelines. We are pleased that this has since
substantially improved, but note that some problems remain. The reporting process to the
Commission is made more challenging by the updates to E+Link and Business Object Reports.
3 Ares(2016)6533380 - 21/11/2016 section 2.2 final paragraph.

4
Updates to online reports sometimes result in errors in data (or data not being properly recorded at
all) and this has made reconciliation processes more difficult, requiring additional NA resource to
address it. However, the Erasmus+ Dashboard is an excellent tool that provides a welcome overview
of the programme as a whole as well as by country, sector and action.

5
METHODOLOGY This report has gathered evidence as follows:
1 From the National Agency in terms of Dashboard statistics (Annex C), and for certain questions
where they were best placed to answer or one of several bodies that could (nos. 2, 3, 4, 6, 7, 8, 9, 10,
11, 12, 13, 14, 15, 16, 17, 18, 19, 20, 21.)
The NA has a project to improve impact assessment of the Programme, based on a logic model, and
is involved in the European project ‘Impact+’. Unfortunately, these are at too early a stage to yield
any data for this study. A summary of this activity is provided at Annex B.
2 From stakeholders via:
• Erasmus+ Sector Consultative Groups in a meeting in London on 4 May 2017 (see Annex D)
• Erasmus+ Country Advisory Groups meeting in the respective capitals of the Devolved
Administrations of Scotland, Wales and Northern Ireland during May and June 2017
• The Erasmus+ Cross-Government Programme Board, which brings together the National
Authority (the Department for Education), the Devolved Administrations of Scotland, Wales
and Northern Ireland, and the Department for Culture, Media and Sport, which has policy
responsibility in England for youth and sport (see Annex E)
• A survey of relevant stakeholders conducted in May 2017 (Annex F.)
3 From past reports by the National Authority to the Commission on the National Agency’s
performance.
4 Universities UK conducted a survey of its members, on which it gave a presentation to the 4 May
Sector Consultative Groups’ meeting. Evidence from this for the HE sector has been taken into
account in this report.
5 A literature search has been conducted by the National Agency; the results are summarised at
Annex G.
Where responses include any individual’s names, or other details that count as personal information,
these have been redacted in accordance with Data Protection principles and law.
In line with the Commission instructions for this exercise (Ares(2016)6533380) we have not aimed to
carry out an evaluation of centralised actions; therefore for these consultations, and in order to
focus the event and thus maximise the likely usefulness of the responses, consultees were asked to
particularly attend to questions 5, 7, 8, 9, 11, 12, 13, 14, 18 and 21. Where comments relating to the
centralised actions have been received, however, we have included them as we think the maximum
feedback to the Commission is desirable.
The Commission has asked us to answer using the framework of questions below. In our view these
questions have significant overlaps, so we have cross-referenced where necessary in order to avoid
duplication, and in the interests of brevity.

6
RESPONSES TO THE QUESTIONS POSED BY THE COMMISSION Effectiveness 1. To what extent have Erasmus+ and its predecessor programmes contributed to the realisation
of the Erasmus+ specific objectives (as listed in point B.2 in annex 3) in your country? Are there
differences across fields? Please provide, where relevant, your assessment for each of the specific
objectives and provide evidence and examples where possible.
The specific objectives may be found at Annex A. The Department for Education is the National Authority for the Erasmus+ programme in the UK. Our
strategy supports and complements those set out in the work programme, the Erasmus+ regulation
and the Guidance for National Authorities. We align the delivery of the programme with the
objectives of Her Majesty’s Government, the Department for Education as responsible for education
in England, and the Devolved Administrations of Scotland, Wales and Northern Ireland. The NAU
consults with key policy leads through the Erasmus+ Cross-Government Programme Board, and the
Board members ensure that the priorities of their respective departments/ administrations are
reflected through their work. The Board meets at least three times a year to discuss the Erasmus+
programme, and there is regular contact between the members. This collaboration enables each
element of the programme to be managed efficiently, with the aim to achieve best value for money
and maximise drawdown of funding from the programme.
In our annual reports on the performance of the National Agency, we have noted that there were
significant teething problems in 2014, notably with regard to the IT tools and delivery of key
documentation (cf. q9 and q14) which reached the point that it was beginning to affect the impact of
projects and the drawdown of funds in the UK. We are pleased that the Commission addressed
these concerns as a priority, and the situation improved, but more still remains to be done.
The vast majority of the quantitative evidence on impacts of E+ covers student mobility in higher
education, with some research on staff mobility. Evidence from other sectors included in E+ and the
other key actions (e.g. strategic partnerships) is generally limited to case studies, which reflects the
nature of the impacts.
Evidence on student mobility in higher education suggests that in the UK:
Students who have studied/worked abroad are more likely to achieve better degree outcomes. Students who were mobile at some point during their studies are more likely to achieve a first or an upper second class degree (81%) than those who were non-mobile (72%).
Students who undertook a period of outward mobility were also a third less likely to be unemployed, more likely to be in a graduate job and on average had a starting salary of 5% higher than non-mobile students 6 months after graduation.
There are effects on social mobility. Although disadvantaged and BME students are less likely to participate in a mobility scheme, the benefits of these schemes are greater for them. The difference in starting salary of those from advantaged backgrounds was 3% (mobile vs. non-mobile) compared to those from disadvantaged backgrounds with a difference of 6%.
There are clear differences in the outcomes of mobile compared to non-mobile students.

7
Care must be taken to interpret this impact, as it will not be wholly due to Erasmus+, which accounts
for about half4 of UK HE outward mobility.
Case studies and feedback from stakeholders (to the National Agency) have highlighted impacts
across the education sectors including improving confidence, employability, social skills, language
skills, cultural awareness, and academic attainment of students. These reports suggest that mobility
may have a larger impact on those in vocational education as it gives them the opportunity to
expand their horizons and to live and work independently, for many who have never travelled
before. Institutions reported that it had a positive effect on their international reputation and built
soft power.
Staff mobility and strategic partnerships were reported to be core to development of innovative
approaches of delivering learning, improving teaching quality and building research links particularly
in higher education. These activities enabled staff to acquire new skills which could then be shared
with others in their own organisation, which improved student outcomes and staff retention.
Impacts were found in terms of enhancing UK competitiveness though international partnerships,
and fostering research and entrepreneurship. The National Association of Head Teachers cites the
benefits of participating in E+ on schools as: teachers learning good practice from abroad;
introducing new teaching methods; increased job satisfaction; enhanced career opportunities; and
the opportunities it offers to broaden pupils’ outlook. There is evidence of participation in E+
increasing the take up of pupils taking modern foreign languages at GCSE, but this is only anecdotal.
Some of our stakeholders felt that the European strategic priorities were less relevant at national or
local level, and urged greater flexibility to meet local needs. We note that education is a devolved or
local matter in many Member States including the UK, and therefore it is important that the
Programme is responsive to local needs.
Statistical data from the Erasmus+ Dashboard (Annex C) shows high overall satisfaction with the
Programme by participants, with positive ratings in 2016 ranging from 99.0% (adult education staff)
to 89.4% (HE students/ trainees). There are likewise high ratings - over 60% - for the Programme
increasing skills, contributing to employability, increasing social and political participation and
contributing to language learning. The only area in which a score below 60% was recorded was for
formal recognition of mobility, with only 24% of VET staff saying their experience was recognised;
however this seems to be very much an outlier, as responses from all other groups ranged from
82.8% to 96.3%.
With regard to Education and Training:
For Objective 1a (to improve the level of key competences and skills, relevant for the labour market) scores for ‘better skills’ ranged from 69.7% for adult education to 95.9% for VET learners.in 2016, whilst those for employability ranged from 72.2% (Youth workers) to 90.2% (VET learners).
The introduction of International Credit Mobility (ICM) in 2015 led to problems of take-up in the UK due to the complex system of envelopes. We and other MS, who welcomed the introduction of ICM, requested further simplification in KA1 HE ICM, as highlighted in our letter to the Commission of 6 July 2015, and are grateful for the simplification which has been implemented which led to an improved take-up of ICM this year. Looking ahead, however, we believe a much simpler system is required to maximise the important benefits of ICM.
4 http://go.international.ac.uk/sites/default/files/HESA%202014%20to%202015%20printable%20analysis_2.pdf

8
For Objective 1b (to foster quality improvements, innovation excellence and internationalisation at the level of education and training institutions, in particular through enhanced transnational cooperation between education and training providers and other stakeholders) the UK has encouraged the HE sector to set its own internationalisation agenda, which was published in 2012. HE participation in the Programme, although it is estimated to have dipped in the 2014/15 academic year, is estimated to have risen since. When this is coupled with the high satisfaction ratings recorded, it can be concluded that Erasmus+ has contributed to this objective.
For Objective 1c (to promote the emergence and raise awareness of a European lifelong learning area designed to ... support the modernisation of education and training ...) evidence shows employers are increasingly seeking employees with international experience. The share of employers across Europe who consider experience abroad to be important for employability nearly doubled between 2006 and 2013, from 37% to 64%5. Further research in the UK found that seven in ten of the SMEs surveyed thought future executives would need foreign language skills and international experience6. The E+ impact survey found that over 90% of employers are looking for personality traits boosted by the Programme such as tolerance, confidence, problem-solving skills and curiosity when recruiting.
For Objective 1d (to enhance the international dimension of education and training... by increasing the attractiveness of European higher education institutions) the UK has for many years had the highest percentage of incoming students in Europe at degree level, and one of the largest ratios of incoming Erasmus students to outgoing. It is therefore difficult to assess whether Erasmus+ has increased our HEIs’ attractiveness, or simply facilitated a trend that existed already.
For Objective 1e (to improve the teaching and learning of languages etc.) responses ranged from 82.7% positive (VET learners) to 96.3% (Youth/EVS), so it can be concluded that the Programme did contribute to this Objective in the UK. The Government is committed to increasing language learning, and just under half of outgoing Erasmus students are studying Languages and Philological Sciences7.
For Objective 1f) (to promote excellence in teaching and research activities in European integration through the Jean Monnet activities), we note that Jean Monnet funding consists of specific funding to six named institutions, and competitively-bid research project funding. Unfortunately, no respondents during the consultations we have undertaken mentioned either of these funding streams, though we know some universities have used Jean Monnet competitive funding.
With regard to the Youth Objectives (2a to 2d): for 2a) Youth rated ‘better skills’ at 94% positive, ‘employability’ at 77.4% and ‘language skills’ 96.3%; the corresponding figures for youth workers were 95.4% and 72.2% for the first two, with no data collected on the third.
With regard to the Sport Objectives (3a-3c):
These objectives are in line with objectives for sport in the UK. As the sports action is centralised it was not possible for us to survey participants; and as it is largely new in Erasmus+ any evidence would have to be treated with caution; we look forward with interest to receiving the Commission’s impact analysis.
5Erasmus+ Impact study, 2014 6 CBI, 2016 7 https://www.erasmusplus.org.uk/statistics-and-results-for-erasmus

9
2. To what extent has the progress on the realisation of the specific objectives contributed to the
realisation of the Erasmus+ general objectives (as listed in point B.2 in annex 3) in your country?
The general objectives may be found at Annex A.
See Annex B for UK approach to capture/ assess the impacts of the Programme in the UK, and
involvement in European projects addressing it.
With regard to the Objectives of the Europe 2020 strategy, including the headline education target,
the UK has declined to set national targets on the basis that target setting per se was not in line with
national policy, and that this was unnecessary action at EU level. Instead, we simply cite the impact
indicators from published Departmental/ DA business plans that are most closely aligned with the
European-level targets. For education in England these are: attainment at age 16 and 19, and an
international comparison (within the OECD) of the qualification levels of the working age population.
However, the UK met the 40% EU target on HE participation prior to the entry into force of the
Programme; and for early-school leaving our rate, though above the EU target of 10% at 10.8%
(2015), is slightly below the overall EU rate of 11%.
3. To what extent have Erasmus+ actions influenced policy developments in the domains of
education and training, youth and sport in your country? Which actions were most effective in
doing so? Are there marked differences between different fields?
All of these fields are devolved matters in the UK, though there are often similar approaches across
the different UK education jurisdictions. The E+ Programme Board considers that the Programme
has supported delivery of education policy in some areas. For example, Northern Ireland noted that
Erasmus+ has made a significant contribution to the achievement of her HE Strategy objectives in
relation to mobility. However, there are relatively few examples of the Programme directly
influencing national policy. Whilst, for example, the objective to increase language learning is
certainly helped by Erasmus+ activity in schools (e-twinning), other interventions such as curriculum
content, teaching methods etc., almost certainly have more impact.
4. What specific approaches (such as co-financing, promotion or others) have you taken in order to
try to enhance the effects of Erasmus+ in your country? To what extent have these approaches
been effective? Can any particular points for improvement be identified?
The governance and delivery structure of the Programme in the UK (see q1) is based on the
Department for Education (as National Authority) and a Programme Board feeding in the views of
other responsible Departments and the Devolved Administrations. This arrangement ensures that
Erasmus+ adequately reflects variation across the UK.
The fact that the UK has a single National Agency (NA), with a consistent approach to promotion,
dissemination and engagement with stakeholders across sectors, enhances the strength of the
message concerning the value of the Programme. It has also resulted in a wider impact through
shared expertise, experience and learning between the sectors of education, training and youth.
The enhanced effects of Erasmus+ resulting from the governance and delivery structure are such
that the Programme appears to be more widely understood in the UK than in the past, as shown by
the increasing interest in all fields. Moreover, the quality of funded activities and the greater
opportunities for dissemination mean that the impact of Erasmus+ is greater and more visible.

10
In order to ensure greater reach, the NA also works closely with a range of stakeholders (please see
the response to question 9). Aside from established stakeholder groups the NA regularly undertakes
promotion and dissemination of Erasmus+ alongside other education, training and youth activities
and events, enabling access to a wider audience and adding substantial value to the communications
work delivered exclusively by the NA. Improvements to the way dissemination activities are
organised at centralised level might also have enhanced the effect of the Programme in the UK
(please see the response to question 9).
5. Do you consider that certain actions of the programme are more effective than others? Are
there differences across fields? What are the determining factors for making these actions of the
programme more effective?
Both mobility and strategic partnerships (including the development of intellectual outputs) have
been important to UK stakeholders. However, as the different programme actions are intended to
achieve different ends their effectiveness is difficult to compare. With regard to the actions
implemented at decentralised level there is a much greater awareness of Erasmus+ and its value to
participants, beneficiaries and stakeholders in education, training and youth than there was for the
predecessor programmes, as shown by the increased take-up. Not only is a greater amount of grant
funding available under Key Action 1 (Mobility) and Key Action 2 (Strategic Partnerships) but the NA
is also better placed to engage with the relevant audience and disseminate programme results more
effectively across the UK.
There is a substantial amount of funding available under Key Action 2 and Key Action 3 managed at a
centralised level by the Commission’s Executive Agency. Although UK organisations are funded
through these actions, either as partners or co-ordinators, awareness of these activities and their
impact is limited. There are very few communications activities undertaken by the Executive Agency
regarding participation in these actions and the impact of projects. The information shared with the
NAU and NA could be improved significantly in order to enhance the effectiveness of actions
implemented at centralised level. (Cf. on the Student Loan Guarantee Facility below.)
It is clear that within the respective decentralised actions there are differences in effectiveness
across the programme fields. This is, in part, a consequence of the way the budget is divided. The
principle of attributing more funding to actions that involve learner (as opposed to only staff)
mobility is logical. However, within the respective fields the split of the grant across actions reflects
the way the budget was divided in the predecessor Lifelong Learning Programme (2007-2013). As
only organisations (and not individuals) can now apply for funding under Erasmus+, the result is that
a relatively low number of projects can be funded in some sectors, for example in Key Action 1 for
schools and adult education. There is also limited funding available for youth workers despite
significantly high demand. We suggest that National Agencies could have a greater degree of
flexibility in allocating funding among the sectors within the programme to achieve a critical mass in
priority areas.
The emphasis on individual learner mobility is an important feature of Erasmus+. However it should
be acknowledged that if, as for example in the HE sector, the funding for key action 2 (strategic
partnerships) is only 5% and the funding for key action 1 (mobility) is 95% of the total budget
available, then the effectiveness of the actions cannot be meaningfully compared. Some of our
stakeholders were critical of the evaluation and dissemination provisions, with suggestions that the
former can be too much of a box-ticking exercise, and that there is a need for more funding for
dissemination, for example for conferences and seminars.

11
The UK was supportive of the Student Loan Guarantee Facility in the negotiation of the Regulation,
as we considered that it addressed a real gap - one we have also recently addressed by introducing a
domestic Masters Loan - so we are disappointed that the development of the scheme has been
slower than expected. Loans to UK citizens have only very recently been rolled out, and while we
understand the UK has been a popular destination for those countries where it was first introduced
(Spain and France) we have yet to see detailed evidence. Consequently we cannot comment on its
operation or impact in the UK, but welcome the Commission’s proposal to redirect some of the
earmarked funding that will otherwise not be spent to other HE areas.
6. To what extent has the integration of several programmes into Erasmus+ made the programme
more effective in your country? Do you see scope for changes to the structure of Erasmus+ or its
successor programme that could increase effectiveness?
Please see the comments in response to question 4, regarding the governance and delivery structure
of Erasmus+ in the UK, and question 12 regarding budget flexibility. In general the integration of
several programmes has been a positive development. However, during the negotiations leading to
agreement of the Erasmus+ Regulation, we supported maximum budget flexibility in order to enable
the Programme to respond to demand, whilst ensuring the core activities were adequately funded,
and we were disappointed that the final Regulation allowed for relatively little flexibility. Experience
has borne out the view (cf. the comments concerning the budget division at question 5 above), that
a greater degree of flexibility in allocating the funding across fields would be helpful. It would be of
particular value in the youth field in the UK, where funding cannot be transferred to or from
education and training, but the youth programme would have benefitted from additional funds to
address high demand, particularly in Key Actions 2 and 3 at decentralised level.
Despite apparent consistency across programme fields, there are also significant differences in the
types of activity that can be undertaken, for example in Key Action 1 (mobility). Moreover the rules
around participation in Erasmus+ differ across fields, e.g. some require a charter8; some enable
informal groups (and not only organisations) to apply, whilst others do not. There are differences in
funding levels for participants depending on their field, and differences in the eligible duration of
placements and projects without obvious rationale. These nuances largely reflect the distinctions
that existed in the LLP and appear to have been continued to ensure consistency over time, rather
than between programme fields. In our view, therefore, though Erasmus+ at the top level both
appears and is more integrated than in the past, it would benefit from a greater degree of
consistency. Distinctions should only exist where they are logical and reflect the needs of the
respective target audience.
Stakeholders remarked that the Key Action structure was effective, but few felt that the intention to
encourage more cross-sectoral working had succeeded overall, and that there was a long way to go
to reach a fully integrated approach.
7. Is the size of budget appropriate and proportionate to what Erasmus+ is setting out to achieve?
Is the distribution of funds across the programme’s fields and actions appropriate in relation to
their level of effectiveness and utility?
UK experience is that demand is much higher versus budget in certain sectors and actions,
particularly Key Action 2, than others; and in these cases we could absorb an increased budget and
the programme could be expected to deliver greater impact. The budget for Key Action 1 is broadly
8 These also differ: whereas the ECHE is compulsory, the VET Charter is voluntary, and arguably more of a quality mark.

12
adequate for most sectors apart from schools where demand is significantly higher than the budget
allows.
In the case of Key Action 2 (strategic partnerships) we would recommend that the maximum funding
available to individual projects be limited. This would enable the NA to fund a greater number of
projects, with a wider reach within sectors and across the UK, resulting in a greater degree of
effectiveness for the programme.
Please also see the comments relating to the budget made in response to questions 4 and 6.
8. What challenges and difficulties do you encounter while implementing the various actions of
Erasmus+? What changes would need to be introduced in Erasmus+ or its successor programme to
remedy these?
Feedback from all sectors, but particularly from schools, continues to be that the application process
is too long and administratively onerous, particularly for those institutions – the majority of schools
– which do not have access to ‘professional’ funding bid writers. The Programme Guide issued by the
EC is largely impenetrable for most schools, which find it challenging to link the Guide to the
application form. NA support, including adaptation of the Guide for schools, is often necessary.
Expert assessors have commented that the forms demand much repetition, which can cause
confusion.
At the regular VET Sector Consultative Group Meetings in the UK, representatives queried the
administration of travel funding, which they considered disadvantaged those in or travelling to
remote areas, particularly for travel to/ from an international hub airport. It is therefore positive to
see the introduction in 2017 of a new approach to travel costs (outlined below) which should now
aid beneficiaries:
1) top-up for expensive domestic travel
2) an increase in the levels of funding for international travel to the furthest-to-reach
participating countries i.e. to overseas territories
3) the introduction of a new travel band that covers short trips (10-99 km) for participants, for
example a participant from Northern Ireland traveling to a placement in the Republic of Ireland
would previously not have received any funding for travelling to the placement even when they
incurred this cost.
Beneficiaries also stated that participant reports could be better tailored for VET learners, with some
VET staff describing the report format as containing irrelevant and repetitive questions. Many
funded beneficiaries have told us of difficulty meeting the requirement that 100% of participant
reports must be submitted with their final report, and have required National Agency support.
Participant report feedback outlined that the online linguistic support (OLS) was not as helpful as it
could be, with many participants stating that the platform is confusing in its design. A mobile app or
mobile friendly version was recommended as few participants take a laptop with them during their
mobility period. Participants also considered that OLS should not be a substitute for face-to-face
language classes.
We have seen an improvement in the overall stability of the environment for programme management, with more detailed and accurate planning made possible by a better established administrative and management context at programme level. This has been of particular benefit in the area of grant management, where more accurate planning of the assessment, grant award and

13
disbursement processes has been possible. There remain difficulties reported, in particular by institutions, in the use of systems and tools, although 2016 appears to have seen encouraging progress in this area, and the issue is less frequently raised with the NA as a matter of critical difficulty. 9. To what extent are the approaches and tools that are used for disseminating and exploiting the
results of Erasmus+ and its predecessor programmes in your country effective? Where can you see
the possibilities for improvements?
A range of tools are used to promote and disseminate Erasmus+ and its results across the UK. This
includes a programme website, social media, events, publications and networks. As well as its own
activities the NA also engages with relevant activities across the UK to reach out to the education,
training, youth and sport communities particularly those who are not already involved in the
programme. Balancing an integrated approach to the programme with responding to the varying
needs of the different sectors is the best way of disseminating the programme and its results. We
would like to highlight particularly the following as effective approaches in the UK:
Formal structures for engaging with sector and country stakeholders: our establishment of Sector
Consultative Groups and Country Advisory Groups is a useful approach for the ongoing engagement
of relevant stakeholders and policymakers in the programme. Holding regular meetings enables us
to build expertise within the group and develop committed two-way relationships with organisations
who can promote the programme beyond the reach of the UK National Agency. There are over 160
members across these groups who regularly engage with the National Agency. Our NA is examining
more closely how an advisory group for England or its constituent parts (regions, local authorities)
could be constituted. It is also considering adding a European dimension to its existing initiative
facilitating peer-to-peer networks for programme beneficiary organisations, enabling beneficiaries
to share expertise and knowledge and to ‘find’ each other’s results. This would enable partner links
to be made and UK projects to be promoted outside the UK.
The NA’s online communications channels are successful at reaching our target audiences and
increasing the outreach of the programme. Visitors to the UK website (www.erasmusplus.org.uk)
have increased dramatically over time and the success of the programme in the UK in terms of
numbers of projects funded shows that the NA’s methods of explaining the programme and
encouraging organisations to participate are working. However, it is always possible to improve and
undertake new approaches. The UK NA would benefit from more frequent opportunities to meet
with the European Commission and other NAs to discuss and share successful communications
approaches.
UK organisations are more likely to engage with dissemination activities undertaken at national
level. Tools produced at European level, such as the results platform, are largely accessed through
NA communications channels, such as the UK Erasmus+ website. As such it would be helpful to
involve NAs more in the development of approaches and tools used by the Commission: in particular
to ensure quality and relevance for the intended audience.

14
Efficiency 10. To what extent is the system of cooperation and division of tasks between the Commission,
Executive Agency, National Agencies, National Authorities, Independent Audit Bodies, and
Erasmus+ Committee efficient and well-functioning from the point of view of your country? What
are the areas for possible improvement or simplification in the implementation of Erasmus+ or a
successor programme?
In general we consider the arrangements are working well. There could have been more advanced
planning by the Commission to enable the NA to implement the programme effectively, and more
transparency (on, for example, the Call for Proposals) so that the NA had advanced warning before
information is in the public domain. Greater transparency is also desirable on the centralised actions.
We welcome the replacement of the predecessor programmes’ Declarations of Assurance by the
NAU with the Management Declaration by the NA, which have reduced the effort required by both
the NAU and the NA. The deadlines for reporting and audit have, however, always been
acknowledged by the Commission to be short, and the NA does consider them to be too short. We
note that, although performance is improving, many programme countries are late submitting the
reports. This both suggests that more time is indeed needed, and is frustrating for those who make
great efforts to submit on time.
11. To what extent has the integration of several programmes into Erasmus+ resulted in efficiency
gains or losses for the implementation of the programme in your country, both at the level of the
National Agency/ies and on the beneficiaries' and participants' level? Do you see scope for
changes to the structure of Erasmus+ or its successor programme that could increase efficiency?
The integration of several programmes into Erasmus+ has had a positive impact on the efficiency of implementation at all levels in the UK. For detail please see the responses to questions 4 and 6. 12. Do you consider that the implementation of certain actions of the programme is more efficient
than others? Are there differences across fields? What good practices of these more efficient
actions of the programme could be transferred to others?
In terms of efficiency there are differences between the actions of Erasmus+, and also between
sectors within these actions. These differences are in part reflected in the size of the related
programme budget (please see the response to questions 5 and 6). As mentioned, since the different
programme actions are intended to achieve different ends their efficiency is difficult to compare.
Projects in Key Action 1 and Key Action 2 for example involve different requirements and processes
at application stage and throughout project delivery and monitoring to final reporting and
dissemination. These differences are determined by the nature of the project and cannot be
compared across actions from the point of view of assessing efficiency.
Because the UK has a single NA, it is well placed to take advantage of efficiencies across actions, and
strives to maximise the consistency of implementation through all our activities and support during
the ‘customer journey’.
During the negotiations leading to agreement of the Erasmus+ Regulation, we supported maximum
budget flexibility in order to enable the Programme to respond to demand, whilst ensuring the core
activities were adequately funded, and we were disappointed that the final Regulation allowed for
relatively little flexibility. The Programme has since had to respond to two major crises - the terrorist
attacks leading to adoption of the Paris Declaration on countering violent extremism, and the
migrant crisis - and may soon have to accommodate the new European Solidarity Corps initiative.

15
Whilst we believe the Commission has found acceptable ways to respond to these within the
present Regulation, our experience suggests that greater flexibility is necessary across the
Programme.
13. To what extent has the system of simplified grants resulted in a reduction of the
administrative burden for National Agencies and programme beneficiaries and participants? Are
there differences across actions or fields? What elements of the programme could be changed to
further reduce the administrative burden, without unduly compromising its results and impact?
The simplified (unit cost) budgets make project management and monitoring simpler and reduce the
burden of financial monitoring. However, some applicants and beneficiaries have struggled to adapt
to these arrangements, particularly where they are being asked to report on unit costs to the NA but
on actual expenditure to their organisations’ finance departments. There are also some examples (in
all sectors) of applicants complaining that travel budgets are too low for those traveling long
distances to reach a “hub”. We believe this could be addressed by the improvement of the in-
country travel budget for 2017.
Regarding youth, the simplified approach is certainly better than the predecessor Youth in Action
(YiA) programme. This can be seen in most processes. The time taken by the NA to process Final
Reports is shorter under Erasmus+ than it was under YiA. However due to the complexity of KA105,
the level of detail required on Mobility Tool+ and from Annex III, the Final Report checks undertaken
by the NA are extensive and time consuming, with a number of budget categories not benefiting
from unit costs.
Beneficiaries prefer the clearer unit costs but find several aspects in the application and reporting
more complicated than in YiA. Many beneficiaries see the programme as still over-complicated and
requiring a lot of administration and careful organisation. While we acknowledge the improvements
and the continuing process of simplification, the compliance requirements under Erasmus+ are
sometimes seen as a disincentive to participation, especially among smaller youth organisations.
Regarding schools, simplification, in our opinion, is only affecting the narrative and not the
technicalities of the budget and activities. Changes have not been significant enough and have barely
been noticeable. The school sector particularly likes the flexibility on project management.
Organisational support, whilst encouraged to be used for preparation, on occasion is utilised as a
top-up fund.
The following observations/suggestions apply across most sectors:
The word count should be increased on both application form and on OEET
Consideration should be given to having a separate Consortium Application Form
Clearer definitions are required for exceptional costs, multiplier events and particularly for intellectual outputs.
Consideration should be given to whether the application form could list cities and activities and utilise auto-calculate options similar to Mobility Tool+.
The following suggestions on simplification also apply to most sectors:
A checklist in Mobility Tool+ relating to the grant agreement would assist in implementation. Standardised templates for all NAs would also improve efficiency.
Use of PDF documents by beneficiaries is difficult, particularly for the schools sector, in terms of ensuring compatibility with existing IT suites and firewalls. We welcome the Commission’s beginning to replace pdfs with online forms; this should be completed sooner rather than later.

16
Might it be possible to link activities and budgets with no option to contradict, within given application forms?
A Mobility Tool+ style application form with tabs, auto-calculate etc. could be considered. The application format should be made consistent with how beneficiaries would be expected to report if successful.
Consultation periods for key resources should be extended, such as for application forms. This should be a genuine consultation, rather than a notification of intended changes.
Improve Yammer consultation groups to address specific needs and to encourage better relationships and co-operation among all NAs.
14. To what extent are the IT tools provided by the Commission adequate for the efficient
management and implementation of the programme in your country? Do they answer your
needs? Give specific examples where they can be improved. Is the set of IT tools appropriate or
should it cover more/less elements of the programme implementation?
The application form continues to present a barrier for smaller organisations, particularly schools,
youth and adult education organisations which may not have the experience or capacity to engage
with the application process. This inevitably creates an unintentional bias in favour of larger
organisations which have the resources to submit applications or applications of a higher quality,
such as by using professional bid writers.
It is also unfortunate that a number of technical errors were identified after application forms were
published. Although some work-rounds were provided it would be welcomed if application forms in
the future could be thoroughly tested before being published.
The reporting process to the Commission is made more challenging by the updates to E+Link and
Business Object (BO) Reports. Updates to BO Reports often result in errors in data (or data not being
pulled through at all) and this makes the reconciliation process more difficult, requiring additional
NA resource to address it. For example, the BO Reports have not been pulling through data in
relation to Transnational Cooperation Activities (TCA), and there have been errors within the
Primary Checks reports which have led to additional work. The NA has investigated inconsistencies
and worked with the EC as best it can (mainly through the Information Management Tool) in order
to bring about improvements, but feels that at this stage of the programme the IT tools available for
reporting should be much more stable than they are to allow NAs to focus on data reconciliation
rather than highlighting technical issues.
In respect of Key Action 2 Strategic Partnerships the key challenge remains the validation of UK
partner organisations in projects coordinated in other countries, as this represents a high volume of
work with a tight deadline, during the period of assessment and selection for UK lead projects. As
such it would be helpful to review the requirements for validation in the future, and create a more
efficient approach at European level.
The reporting process to the Commission is made extremely challenging by the updates to E+Link
and Business Object Reports. These updates invariably take place immediately before the report
submission and this results in data errors which have to be corrected and reconciled, creating
substantial additional work. This practice should be avoided for future reporting cycles. The UK NA
has fed back in detail to the Commission through the Yearly Report process. We would also welcome
quicker response times (including indicative response times) in case of technical difficulties.

17
Management of Participant Identification Codes remains a challenge, and we would request the
appointment of a designated officer at the Commission to support this area, working alongside NA
colleagues.
The Erasmus+ Dashboard is an excellent tool that provides a welcome overview of the programme
as a whole as well as by country, sector and action. We hope to see a public version of the
Dashboard made available in 2017, especially given the increased focus on the programme during
the year, and welcome Commission plans to do this.
15. To what extent is the level of human and financial resources that is available for the
implementation of the programme in your country adequate? What steps did you take to optimise
the efficiency of the resources deployed for the Erasmus+ implementation in your country? What
kind of rationalisation effort did you make in this respect?
The UK NA was chosen through a competitive tender which clearly outlined the financial and human
resources to be provided annually. It was clearly understood that, due to the steep profile of the
programme budget in the latter years of the programme, resources would be scarcer in the earlier
years but should be able to be recouped in the later ones. Provision was also made on exchange
risk.
That said, the NA and NAU have found that resources would be adequate with improved
functionality of IT tools and a more streamlined bureaucracy. Current arrangements result in a
disproportionate administrative burden. It would have been useful to have known the profile of the
Commission contribution to the management fee in order to plan the work more easily across years.
This might also have improved the tender.
Relevance 16. To what extent do the Erasmus+ objectives continue to address the needs or problems they
are meant to solve? Are these needs or problems (still) relevant in the context of your country?
Have the needs or problems evolved in such a way that the objectives of Erasmus+ or its successor
programme need to be adjusted?
See answers to questions 1-3. As noted, the Programme has had to adapt to two major unplanned events, and we believe it has been flexible enough to do so. However, more flexibility, both at decentralised and centralised level, would enable better use of budgets and better meeting of the substantial demand. 17. To what extent are needs of different stakeholders and sectors addressed by the Erasmus+
objectives? How successful is the programme in attracting and reaching target audiences and
groups within different fields of the programme's scope? Is the Erasmus+ programme well known
to the education and training, youth and sport communities? In case some target groups are not
sufficiently reached, what factors are limiting their access and what actions could be taken to
remedy this?
In our consultations all sectors reported benefits from the Programme, but felt there was limited
awareness due to insufficient promotion. Most felt the name was most associated with HE and/ or
mobility, with little understanding that the ‘+’ covered multiple sectors and other activities.
Overall there was criticism that the administrative requirements favoured large organisations over
small ones which lacked staff time to deal with this burden, and that consequently sectors where
smaller organisations predominate - schools, adult education and youth - were probably not
benefiting from the programme as much. Indeed one respondent observed that ‘simplification has

18
sometimes created complication’. One suggestion was that funds should be made available for
schools etc. to pay for a professional bid writer/ project manager, whilst others advocated the use of
consortia. Another common theme was that the programme was not appreciated until experienced,
again particularly in the sectors with smaller players. Some queried why - except for youth - there
was only one call annually. It would be interesting to discuss this possibility, particularly in those
fields where mobility is usually for shorter periods.
There were some complaints from stakeholders about insufficient funding for some projects. In-
country travel (e.g. from remote rural areas to international airports) was highlighted as one issue
here, so the changes announced for 2018 may have a positive impact. Others suggested the need for
more funding for preparatory visits and for dissemination. Some mentioned cross-sectoral/
partnership working as beneficial. Most understood that the Programme aimed to provide a
contribution to costs, but some felt that full cost recovery should be the core principle, and that
current limits on eligible costs were too rigid, for example not meeting actual management costs.
One suggestion is that the cost of passports for disadvantaged students should be an eligible cost, to
help efforts to increase their mobility.
The HE sector felt the programme was very beneficial to students, in terms of retention, attainment
and employability, and to staff. These two are related: staff who have undertaken mobility
encourage their students to do so too and/ or use their mobility to organise their students’ mobility.
Many stated the programme was key to their internationalisation strategies. KA107 (HE
International Credit Mobility) was praised for supporting student and staff mobility through research
and partnerships, though there was some complaint that the budget split meant that the most
popular countries were oversubscribed, limiting opportunities. The view was also expressed that
some disciplines participated more than others, and that this was partly to do with restrictions on
vocational courses by the relevant professional bodies.
The view was expressed that publicity for other sectors of the programme had raised awareness in
HEIs; this suggests that the integration of the predecessor programmes into Erasmus+ has been
positive. Others looked at it the other way: the name was widely known but associated with HE or
mobility only: the ‘+’ (or as one respondent put it, ‘the complexity’!) was not understood. Other
respondents pleaded for no further rebranding.
The FE sector noted benefits, including the ability to use the programme to make courses unique
and to have longer-term partnerships. Consortium working was noted as one way round the
administrative burden. One respondent stated that Erasmus+ had much greater impact than [the
predecessor] Comenius [programme], due to the strategic context. One respondent felt Comenius
had been better known and this had made promoting E+ FE more difficult. Others felt that some
disciplines did better out of the programme than others. One complaint was that the Programme
Guide assumed higher education was delivered only in universities, which is not the case in the UK
or some other Member States. There was also a suggestion to have a common Charter with HE.
It was felt the programme was less well-known in some regions of the UK, especially those in
England, than others. It is not clear why this might be, as the NA’s remit from the NAU is to try to
ensure broadly even geographical participation, and it plans and rolls out its publicity accordingly.
The schools sector reported difficulties getting schools to engage with the programme. A difficulty
cited was lack of staff time to apply or to administer the projects, which relates to complaints also
received about over-complicated forms and administrative burdens. Some felt that even schools
which did apply, applied for too little money, or were unable to use the programme strategically e.g.

19
for professional development of teachers; and that the changes from the LLP had not been fully
understood. Benefits included support to language teaching.
The adult education sector reported little knowledge of the programme and consequently of the
benefits, as well as lack of capacity for the administration. Some reported overcoming the latter by
working in consortia.
The youth sector felt the programme benefitted young people who might not be reached by
“traditional” Erasmus activity, partly because of the shorter length of placements. Nonetheless it
was challenging to stimulate participation amongst those not in education or training. Benefits
included employability. However, the youth sector also reported lack of institutional capacity, partly
due to recent reductions in local authority budgets; this is linked to complaints about insufficient
staff time to deal with the administrative burden – success often depended on particularly
enthusiastic/ committed individuals. A further complaint/comment was that only incorporated
youth groups could apply, disenfranchising many other groups and reducing inclusivity.
The sports sector reported cross-sector benefits, and that these related to UK objectives.
The NA has promoted the new International Credit Mobility (ICM) action since its inception in 2015,
and take-up is strong in most budget envelopes, and improving year on year. It hopes to achieve
close to full budget take-up in 2018.
Internal and external coherence and complementarity 18. To what extent are the various actions that have been brought together in Erasmus+ coherent?
Can you identify any existing or potential synergies between actions within Erasmus+? Can you
identify any tensions, inconsistencies or overlaps between actions within Erasmus+?
Please see the response to question 6. 19. To what extent does Erasmus+ complement other national and international programmes
available in your country? Can you identify any tensions, inconsistencies or overlaps with other
programmes?
In addition to management of the decentralised actions, our single National Agency is also
responsible for managing the Erasmus+ networks ECVET, SALTO and Eurodesk, and works to ensure
effective synergy between these networks and the decentralised actions for VET and Youth, through
its stakeholder engagement and through cross-promotion.
NA marketing and dissemination activities ensure beneficial synergy with the decentralised actions
in Erasmus+.
Smaller agencies have been designated to manage Eurydice, Europass and Euroguidance in the UK,
and a joint forum for the NA and these agencies allows for sharing communications activities and
seeking synergy with the activities managed by the National Agency.
Within the centralised actions:
The British Council was a partner in the first ‘Support to the European Higher Education Area (EHEA)’ contract for the NAU
Universities UK and the British Council are partners in the second EHEA contract for the NAU
The British Council provides the National Support Service for eTwinning
Ecorys UK provides both the Central Support Service and the National Support Service for EPALE

20
The British Council and Ecorys have been supporting NFER in the development of the Youth wiki.
The NAU receives Erasmus+ grant funding for the ACTive Citizenship Project. European added value and sustainability 20. To what extent Erasmus+ and its predecessor programmes produce effects that are additional
to the effects that would have resulted from similar actions initiated only at regional or national
levels in your country? What possibilities do you see to adjust Erasmus+ or its successor
programme in order to increase its European value added?
See also responses to questions 1 and 2.
We have asked DfE analysts to give a view on the evidence collected in this report with regard to added value. They considered that a common limitation is that these studies/reports generally show the outcomes for individuals who have participated in Erasmus+ schemes compared with non-mobile students. In the majority of cases it cannot be claimed with confidence that these differences in outcomes are specifically because of Erasmus+. For example, it may be that those who participate in Erasmus will, for example, earn more in the future. But the reverse could also be true - those who have the ability/skills to earn higher wages are more likely to choose to participate in a mobility scheme. The difficulty of assessing additionality applies to some extent to all the sources listed in Annex G. Nevertheless, at aggregate level these sources provide a positive and encouraging picture of the value of international mobility and exchanges. We also note that Erasmus+ is the single largest HE mobility scheme in the UK, accounting for some 46% of all outward mobility. Against this background, we therefore welcome the Commission’s intention to conduct a counterfactual impact study, and look forward to seeing the results. 21. To what extent Erasmus+ will be able to absorb in an effective way the sharp increase in the
budget that is foreseen in the coming years up to 2020 in your country? Could the programme use
even higher budgets in an effective way? Do you see challenges to effectively use more money for
particular actions or fields of the programme?
The UK NA is able to allocate the full decentralised budget, apart from three envelopes under ICM.
The need to vire budgets between the education and training sectors has reduced from 2014 to
now, as the number of quality applications received for each sector has reached the levels required
to absorb the allocated budgets by sector. The NA strives to increase the number of new entrants
and to encourage widening participation year by year.
There continues to be high demand in the UK across most Key Actions and sectors, which has grown in recent years, so we are reasonably confident that we can absorb a very high proportion of the increased budget. But as noted above, we would favour greater flexibility in order to be able to meet changes in demand as they occur.

21
ANNEXES9 Annex A General and Specific Objectives of the Programme referred to in questions 1 and 210 Annex B Impact assessment projects involving the UK National Agency Annex C Satisfaction data from the Dashboard Table C0 Sample size Table C1 General Satisfaction Table C2 Better Skills Table C3 Formal Recognition Table C4 Language Skills Table C5 Employability Table C6 Social and political participation of young people Annex D Summary and detailed conclusions from Erasmus+ Sector Consultative Groups’ meeting in London on 4 May 2017 Annex E Summary and detailed conclusions of consultations with Erasmus+ Country Advisory Groups meeting in the respective capitals of the Devolved Administrations of Scotland, Wales and Northern Ireland during May and June 2017 and views sought from the Erasmus+ Cross-Government Programme Board Annex F Results of survey of relevant stakeholders conducted in May 2017 Annex G Selected results of Literature search
9 The sub annexes to D, E and F are available separately on request from [email protected]. 10 As specified in Articles 4 and 5 of the legal base

22
Annex A General and Specific Objectives for the Erasmus+ Programme referred to in questions 1 and 2 General objectives of the Erasmus + Programme The Programme shall contribute to the achievement of 1) the objectives of the Europe 2020 strategy, including the headline education target; 2) the objectives of the strategic framework for European cooperation in education and training ('ET 2020'), including the corresponding benchmarks; 3) the sustainable development of partner countries in the field of higher education; 4) the overall objectives of the renewed framework for European cooperation in the youth field (2010-2018); 5) the objective of developing the European dimension in sport, in particular grassroots sport, in line with the Union work plan for sport; and 6) the promotion of European values in accordance with Article 2 of the Treaty on European Union, i.e. the values of respect for human dignity, freedom, democracy, equality, the rule of law and respect for human rights including the rights of persons belonging to minorities. Specific objectives In line with the general objectives of the Programme, the specific objectives are structured under the headings of (1) education and training, (2) youth and (3) sport. 1) Education and Training a) to improve the level of key competences and skills, with particular regard to their relevance for the labour market and their contribution to a cohesive society, in particular through increased opportunities for learning mobility and through strengthened cooperation between the world of education and training and the world of work; b) to foster quality improvements, innovation excellence and internationalisation at the level of education and training institutions, in particular through enhanced transnational cooperation between education and training providers and other stakeholders; c) to promote the emergence and raise awareness of a European lifelong learning area designed to complement policy reforms at national level and to support the modernisation of education and training systems, in particular through enhanced policy cooperation, better use of Union transparency and recognition tools and the dissemination of good practices; d) to enhance the international dimension of education and training, in particular through cooperation between Union and partner-country institutions in the field of VET and in higher education, by increasing the attractiveness of European higher education institutions and supporting the Union's external action, including its development objectives, through the promotion of mobility and cooperation between the Union and partner-country higher education institutions and targeted capacity-building in partner countries; e) to improve the teaching and learning of languages and to promote the Union's broad linguistic diversity and intercultural awareness; f) to promote excellence in teaching and research activities in European integration through the Jean Monnet activities worldwide. 2) Youth a) to improve the level of key competences and skills of young people, including those with fewer opportunities, as well as to promote participation in democratic life in Europe and the labour market, active citizenship, intercultural dialogue, social inclusion and solidarity, in particular through increased learning mobility opportunities for young people, those active in youth work or youth organisations and youth leaders, and through strengthened links between the youth field and the labour market;

23
b) to foster quality improvements in youth work, in particular through enhanced cooperation between organisations in the youth field and/or other stakeholders; c) to complement policy reforms at local, regional and national level and to support the development of knowledge and evidence-based youth policy as well as the recognition of non-formal and informal learning, in particular through enhanced policy cooperation, better use of Union transparency and recognition tools and the dissemination of good practices; d) to enhance the international dimension of youth activities and the role of youth workers and organisations as support structures for young people in complementarity with the Union's external action, in particular through the promotion of mobility and cooperation between the Union and partner-country stakeholders and international organisations and through targeted capacity-building in partner countries. 3) Sport a) to tackle cross-border threats to the integrity of sport, such as doping, match-fixing and violence, as well as all kinds of intolerance and discrimination; b) to promote and support good governance in sport and dual careers of athletes; c) to promote voluntary activities in sport, together with social inclusion, equal opportunities and awareness of the importance of health-enhancing physical activity through increased participation in, and equal access to, sport for all. The above objectives of the integrated Erasmus+ programme have been developed and emanate from the general, specific and operational objectives of the previously existing programmes in the domain of Education, Training, Youth and Sport as outlined in their respective legal basis.

24
Annex B Impact Assessment: projects involving the UK National Agency (Provided by the National Agency) Role of Impact Assessment
To gather evidence of the extent and nature of programme impact in the UK.
To support NA delivery of Erasmus+ in the UK.
To help support Erasmus+ beneficiaries to implement their projects. Logic Model The central approach to impact assessment adopted by the UK National Agency in respect of the Erasmus+ programme is a Logic Model. The aim of this approach is to provide structure to measuring impact and ensures a direct correlation with the aims and objectives of Erasmus+. As such it helps to show why the programmes exists, measure its success and inform the debate around a future programme.
The impact assessment work of the UK NA is geared towards populating the Logic Model. Data becomes available in stages • Inputs, activities & some outputs are already available. • Outcomes data will emerge later in 2017. • Impact data is more difficult to judge – hard data may not become available and it may be necessary to rely on outcome data to ‘indicate’ likely impact.

25
Therefore, at this stage the logic model only shows information for the first three stages of the process. • Inputs and activities are from 2014-16 with provisional 2015/16 figures. • Data on participants is only provisional for 2014 so far. More data and possible outcomes data are expected in 2017.

26
Programme Statistics
Produced for several purposes
Statistical reports covering: Applications received; Application results; Projects funded; and Outputs (i.e. KA1 Mobility participants).
Reports revised in 2016 following consultation with Country Advisory Groups & Sector Consultative Groups – shorter reports, more detailed annex of data tables.
1. Primarily for populating the Logic Model. Also for communicating information about the programme to stakeholders, press, beneficiaries (potential and actual) and helping manage the programme (annual priorities). 2. 4 types of report. Outputs report covering 2014 KA1 mobilities was a new feature introduced in 2016 covering contracted outputs – some projects are or were ongoing at publication. • 2015 KA1 data and 2014-15 KA3 data was published in 2016. • KA2 data still under investigation – anticipated in the second half of 2017. 3. Revisions to data reports focused on making them more user-friendly. • Reports are much shorter and now contain the UK headlines and include time series data from 2014 to the present. • Detail now in the data table annexes – include fuller breakdown of data by Key Action, Sub-Actions, Field & UK country – all in time series from 2014-present. The impact assessment work also provides contributions to: • Evaluation of Erasmus+ at European and National level • EU and UK consultations • UK Parliamentary and Devolved Administration Committees, e.g., Welsh Government Enterprise & Business Committee in 2015 • Help identify UK annual priorities by Country, Key Action or Field. In addition, in relation to impact assessment the UK NA provides online resources for applicants and beneficiaries, and other support via contributions to : • Information days • Start-up Seminars • Learning Networks - Measuring Impact • Annual conference Supporting Beneficiaries
Applications do not all demonstrate a high level of understanding of or planning for impact / evaluation.
Analysis of 2014/15 KA1 VET & AE Impact & Dissemination application assessment scores showed 20-25% of applications fail to reach the minimum score for funding.
National Agency needs to improve the quality of applications and to improve the quality of project impact assessment.
27
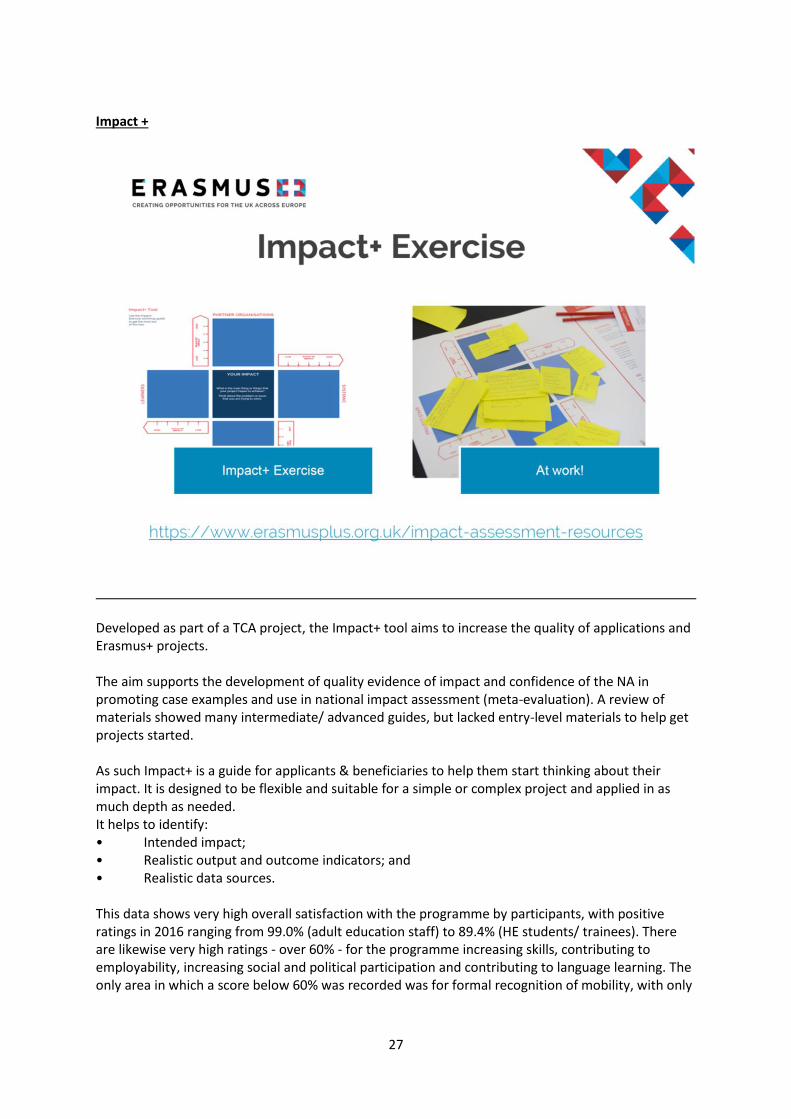
Impact +
Developed as part of a TCA project, the Impact+ tool aims to increase the quality of applications and Erasmus+ projects. The aim supports the development of quality evidence of impact and confidence of the NA in promoting case examples and use in national impact assessment (meta-evaluation). A review of materials showed many intermediate/ advanced guides, but lacked entry-level materials to help get projects started. As such Impact+ is a guide for applicants & beneficiaries to help them start thinking about their impact. It is designed to be flexible and suitable for a simple or complex project and applied in as much depth as needed. It helps to identify: • Intended impact; • Realistic output and outcome indicators; and • Realistic data sources. This data shows very high overall satisfaction with the programme by participants, with positive ratings in 2016 ranging from 99.0% (adult education staff) to 89.4% (HE students/ trainees). There are likewise very high ratings - over 60% - for the programme increasing skills, contributing to employability, increasing social and political participation and contributing to language learning. The only area in which a score below 60% was recorded was for formal recognition of mobility, with only

28
24% of VET staff saying their experience was recognised; however this seems to be very much an outlier, as responses from all other groups ranged from 82.8% to 96.3%.] Further information
Impact Assessment at the Erasmus+ UK NA: www.erasmusplus.org.uk/impact
Impact+ Exercise: www.erasmusplus.org.uk/impact-assessment-resources
Steven Murray, Impact Assessor [email protected]

29
Annex C Satisfaction data from Dashboard Table C0 Sample size: The sample size for the extracts which follow are estimated, using those for ‘General satisfaction’ as a proxy for overall sample size across all questions, as follows (unfortunately a software glitch meant no data could be extracted for VET population, represented by ‘XXX’):
Sector // Activity Type 2014 Surveys
% Positive
Contracted mobilities
2015 Surveys
% Positive
Contracted mobilities
Higher Education // Student Mobility for studies and training in partner and programme countries 13,170 89.9%
15136
14,633 91.2%
17241
Higher Education // Staff Mobility for teaching and training in partner and programme countries 1,929 99.1%
2542
2,776 99.1%
2871
Youth // EVS and Youth Exchanges in partner and programme countries 570 92.6%
5737
838 93.2%
6396
Youth // Mobility of Youth Workers in partner and programme countries 2,186 97.3%
5862
1,678 97.7%
3227
Schools // Job shadowing, staff training, teaching assignments, structured courses and training events abroad 1,024 98.1%
1394
593 98.7%
1378
KA102 VET learner and staff mobility XXX 96.7%
5843 XXX 95%
6249
Adult Education // Staff mobility in partner and programme countries 271 99.6%
271
354 98.6%
480

30
Table C1 General Satisfaction
2014 2015 2016
Sector // Activity Type Surveys % Positive Surveys
% Positive Surveys
% Positive
Higher Education // Student Mobility for studies and training in partner and programme countries 13,170 89.9% 14,633 91.2% 3,847 89.4%
Higher Education // Staff Mobility for teaching and training in partner and programme countries 1,929 99.1% 2,776 99.1% 1,228 99.0%
Youth // EVS and Youth Exchanges in partner and programme countries 570 92.6% 838 93.2% 304 97.0%
Youth // Mobility of Youth Workers in partner and programme countries 2,186 97.3% 1,678 97.7% 613 95.8%
Schools // Job shadowing, staff training, teaching assignments, structured courses and training events abroad 1,024 98.1% 593 98.7% 154 98.1%
VET // Learner traineeships in vocational institutes/companies in partner and programme countries 2 100.0% 3 66.7% 1,059 94.1%
VET // Staff mobility in partner and programme countries 710 96.6% 335 95.5% 186 98.9%
Adult Education // Staff mobility in partner and programme countries 271 99.6% 354 98.6% 81 98.8%
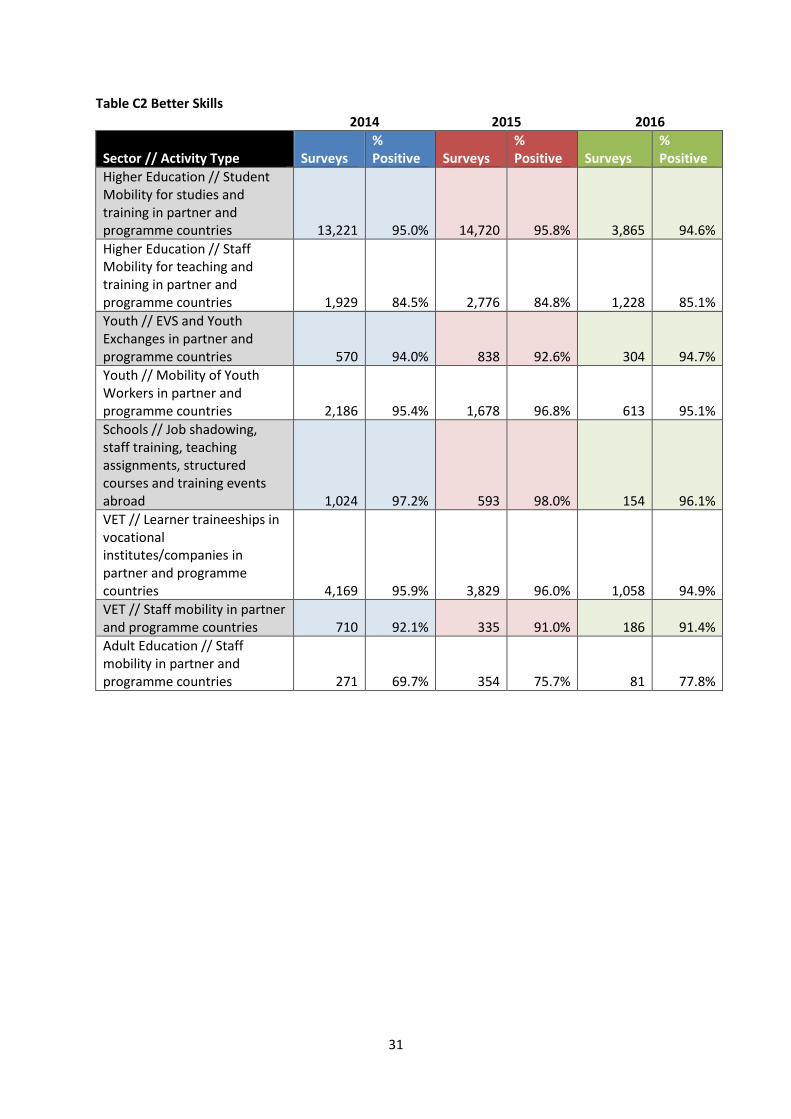
31
Table C2 Better Skills
2014 2015 2016
Sector // Activity Type Surveys % Positive Surveys
% Positive Surveys
% Positive
Higher Education // Student Mobility for studies and training in partner and programme countries 13,221 95.0% 14,720 95.8% 3,865 94.6%
Higher Education // Staff Mobility for teaching and training in partner and programme countries 1,929 84.5% 2,776 84.8% 1,228 85.1%
Youth // EVS and Youth Exchanges in partner and programme countries 570 94.0% 838 92.6% 304 94.7%
Youth // Mobility of Youth Workers in partner and programme countries 2,186 95.4% 1,678 96.8% 613 95.1%
Schools // Job shadowing, staff training, teaching assignments, structured courses and training events abroad 1,024 97.2% 593 98.0% 154 96.1%
VET // Learner traineeships in vocational institutes/companies in partner and programme countries 4,169 95.9% 3,829 96.0% 1,058 94.9%
VET // Staff mobility in partner and programme countries 710 92.1% 335 91.0% 186 91.4%
Adult Education // Staff mobility in partner and programme countries 271 69.7% 354 75.7% 81 77.8%

32
Table C3 Formal recognition
2014 2015 2016
Sector // Activity Type Surveys % Positive Surveys
% Positive Surveys
% Positive
Higher Education // Student Mobility for studies and training in partner and programme countries 4,532 74.5% 5,117 82.3% 1,160 82.8%
Higher Education // Staff Mobility for teaching and training in partner and programme countries 1,161 85.8% 2,463 90.7% 1,228 92.2%
Youth // EVS and Youth Exchanges in partner and programme countries 554 86.3% 824 83.4% 304 87.8%
Youth // Mobility of Youth Workers in partner and programme countries 2,186 77.2% 1,678 80.2% 613 92.7%
Schools // Job shadowing, staff training, teaching assignments, structured courses and training events abroad 1024 79.8% 593 89.2% 154 83.1%
VET // Learner traineeships in vocational institutes/companies in partner and programme countries 4169 72.8% 3,829 74.6% 1,058 94.9%
VET // Staff mobility in partner and programme countries 710 50.7% 335 41.8% 186 24.7%
Adult Education // Staff mobility in partner and programme countries 271 87.5% 354 79.4% 81 96.3%
Table C4 Language Skills 2014 2015 2016
Sector // Activity Type Surveys % Positive Surveys % Positive Surveys % Positive
Higher Education // Student Mobility for studies and training in partner and programme countries 9,433 93.1% 10,090 92.9% 2,769 91.9%
Youth // EVS and Youth Exchanges in partner and programme countries 161 96.3% 194 89.2% 10 100.0%
VET // Learner traineeships in vocational institutes/companies in partner and programme countries 2,612 82.7% 2,438 83.7% 719 80.0%

33
Table C5 Employability (May 2017)
2014 2015 2016
Sector // Activity Type Surveys % Positive Surveys % Positive Surveys % Positive
Higher Education // Student Mobility for studies and training in partner and programme countries 13,221 89.5% 14,720 90.7% 3,865 87.6%
Higher Education // Staff Mobility for teaching and training in partner and programme countries 1,929 68.3% 2,776 70.6% 1,228 68.4%
Youth // EVS and Youth Exchanges in partner and programme countries 570 77.4% 838 78.9% 304 85.5%
Youth // Mobility of Youth Workers in partner and programme countries 2,186 72.2% 1,678 73.2% 613 71.9%
Schools // Job shadowing, staff training, teaching assignments, structured courses and training events abroad 1,024 79.0% 593 81.8% 154 70.8%
VET // Learner traineeships in vocational institutes/companies in partner and programme countries 4,169 90.2% 3,829 89.4% 1,058 90.3%
VET // Staff mobility in partner and programme countries 710 73.5% 335 77.6% 186 67.7%
Adult Education // Staff mobility in partner and programme countries 271 78.2% 354 73.2% 81 72.8%

34
Table C6 Social and political participation of young people (May 2017)
2014 2015 2016
Sector // Activity Type Surveys % Positive Surveys % Positive Surveys % Positive
Higher Education // Student Mobility for studies and training in partner and programme countries
13,221 89.5% 14,720 72.2% 3,865 68.7%
Youth // EVS and Youth Exchanges in partner and programme countries
175 78.9% 248 73.4% 13 61.5%
Youth // Mobility of Youth Workers in partner and programme countries
2,186 69.0% 1,678 68.2% 613 68.7%
VET // Learner traineeships in vocational institutes/companies in partner and programme countries
4,169 76.1% 3,829 78.0% 1,058 74.5%
Source for Tables C1 to C6: Summary data compiled from EC Erasmus+ Participant Report Forms, as
extracted by the UK National Agency from the Dashboard on 31 May 2017

35
Annex D Summary and detailed conclusions from Erasmus+ Sector Consultative Groups’ meeting in London on 4 May 2017 (available on request) Notes of the various sessions were taken by the NA on the day in ‘brainstorming’ format on the day. These are available separately on request. They represent the views of participants only, and not the Government, on the Programme and other matters, and in some cases may be factually inaccurate. They have been only slightly edited for clarity, e.g. to spell out certain acronyms. Annex D1 summarises views expressed in the plenary session attended by all sectors; D2-D6 those of the adult education, HE, VET, Schools and Youth sector representatives present during their dedicated sessions. In the case of the HE dedicated session a formal note was taken by the NA (D7).

36
Annex E Summary and detailed conclusions of consultations with Erasmus+ Country Advisory Groups (CAG) meeting in the respective capitals of the Devolved Administrations of Scotland, Wales and Northern Ireland during May and June 2017 and views sought from the Erasmus+ Cross-Government Programme Board Scotland responded that she did not have the capacity to produce her own evaluation and was content for DfE to collate one as the UK national authority. Northern Ireland noted that Erasmus+ has made a significant contribution to the achievement of her HE Strategy objectives in relation to mobility, but otherwise did not send an official view. A summary of the views of her youth sector was received, however the contributor stated a preference to include the responses in any analysis in a non-attributable form and to quote responses anonymously; therefore the summary is not included in these Annexes. Wales did not respond directly, but a summary of the views of her college sector was received and is available on request from [email protected]. It should be noted that there has not been an operational Executive in Northern Ireland since March 2017, therefore any reference to NI policy reflects the situation in the time the last Executive was disbanded.

37
Annex F Results of survey of relevant stakeholders conducted in May 2017 The surveys was directed to the following respondents. Many of these attended the Sector Consultative Groups’ joint meeting on 4 May and we understand that many have also responded directly to the Commission’s public consultation: HE Universities UK International (UUKi) Russell Group [university association] Million+ [university association] Guild HE [university association] National Union of Students (NUS) NUS Scotland NUS Wales NUS/ USI (Northern Ireland) VET Association of Colleges Colleges Wales College Development Network [Scotland] Educational Institute of Scotland Association of Teachers and Lecturers UK NARIC Trades Union Congress (TUC) AE Aspire-igen Ministry of Justice [responsible for prison education] Schools National Association of Head Teachers National Union of Teachers (NUT) National Association of Schoolmasters/ Union of Women Teachers (NASUWT) Voice [early years teacher trade union] Youth British Youth Council Department for Communities and Local Government (DCLG) [responsible for youth work in England] Sport Sport England sportscotland Sport Wales/ Chwaraeon Cymru Sport Northern Ireland UK Sport Three responses were received:
Sportscotland - which regretted that they had had too little interaction with the programme to respond;
the National Association of Head Teachers (NAHT);


39
Annex G Selected results of Literature search (Provided by the National Agency)
Source and description Sector / KA
Impact on individuals’ educational and/or employment outcomes and any evidence of impact upon their social mobility
1 The HEFCE Attainment in Higher Education 2009 study11 highlighted that 75% of Erasmus students receive a first or upper second-class degree, compared with 60% of students who did not study or train abroad12. This important HEFCE study corrects statistically for differences of attainment at entry to university and compares results for final degree class strictly on a like for like basis, thus demonstrating that it is the actual experience of study/work abroad which makes the difference.
HE KA1
2 UK HE Gone International Mobile Students and their outcomes 2015 report13 findings: A higher proportion of graduates who were mobile were working abroad, if in employment (11% of those in full-time work vs 2%). On average, graduates who were mobile earned more across 11 out of 17 subject areas This analysis of HESA data is now carried out annually, so there are reports as well for 2016 and 2017. 2016 report at: http://www.go.international.ac.uk/gone-international-2016-value-mobility with important findings in the executive summary on employability benefits, in particular for disadvantaged and BME students. 2017 report at: http://www.universitiesuk.ac.uk/policy-and-analysis/reports/Documents/International/GoneInternational2017_A4.pdf again important findings which reinforce those of 2016.
HE KA1
3 EC Erasmus impact survey14 1/3 of Erasmus+ trainees are offered jobs with the company where they trained
The unemployment rate (5 years after graduation) is 23% lower for mobile than
non-mobile students
HE KA1
4 EC 30+ statistics: KA1 VET / HE / EVS15 Erasmus+ vocational education alumni tend to find their first job faster and earn 25 % more
VET KA1
11 http://www.hefce.ac.uk/data/year/2009/Attainment,in,higher,education,-,Erasmus,and,placement,students/ 12 http://www.hefce.ac.uk/data/Year/2009/Attainment,in,higher,education,-,Erasmus,and,placement,students/Title,93230,en.html 13 http://go.international.ac.uk/gone-international-mobile-students-and-their-outcomes-press-release 14 http://ec.europa.eu/dgs/education_culture/repository/education/library/study/2014/erasmus-impact_en.pdf 15 http://www.agence-erasmus.fr/docs/2448_observatoire-n2-en.pdf
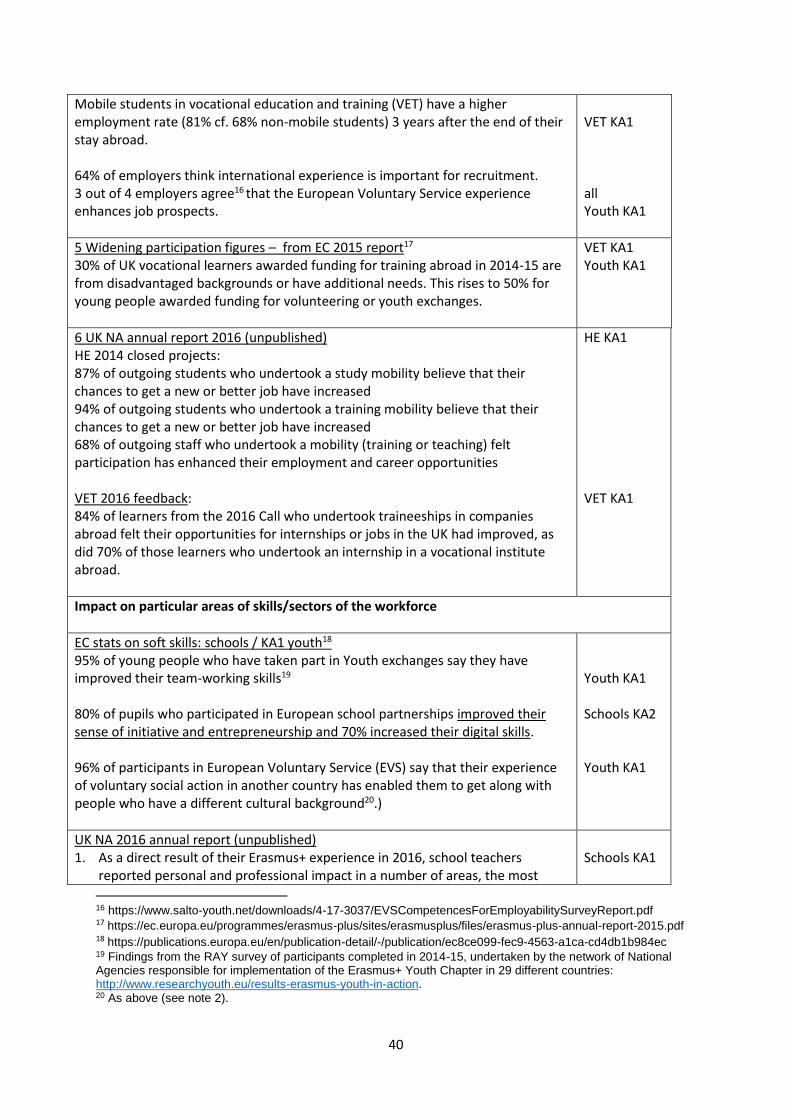
40
Mobile students in vocational education and training (VET) have a higher employment rate (81% cf. 68% non-mobile students) 3 years after the end of their stay abroad. 64% of employers think international experience is important for recruitment. 3 out of 4 employers agree16 that the European Voluntary Service experience enhances job prospects.
VET KA1 all Youth KA1
5 Widening participation figures – from EC 2015 report17 30% of UK vocational learners awarded funding for training abroad in 2014-15 are from disadvantaged backgrounds or have additional needs. This rises to 50% for young people awarded funding for volunteering or youth exchanges.
VET KA1 Youth KA1
6 UK NA annual report 2016 (unpublished) HE 2014 closed projects: 87% of outgoing students who undertook a study mobility believe that their chances to get a new or better job have increased 94% of outgoing students who undertook a training mobility believe that their chances to get a new or better job have increased 68% of outgoing staff who undertook a mobility (training or teaching) felt participation has enhanced their employment and career opportunities VET 2016 feedback: 84% of learners from the 2016 Call who undertook traineeships in companies abroad felt their opportunities for internships or jobs in the UK had improved, as did 70% of those learners who undertook an internship in a vocational institute abroad.
HE KA1 VET KA1
Impact on particular areas of skills/sectors of the workforce
EC stats on soft skills: schools / KA1 youth18 95% of young people who have taken part in Youth exchanges say they have improved their team-working skills19 80% of pupils who participated in European school partnerships improved their sense of initiative and entrepreneurship and 70% increased their digital skills. 96% of participants in European Voluntary Service (EVS) say that their experience of voluntary social action in another country has enabled them to get along with people who have a different cultural background20.)
Youth KA1 Schools KA2 Youth KA1
UK NA 2016 annual report (unpublished) 1. As a direct result of their Erasmus+ experience in 2016, school teachers
reported personal and professional impact in a number of areas, the most
Schools KA1
16 https://www.salto-youth.net/downloads/4-17-3037/EVSCompetencesForEmployabilitySurveyReport.pdf 17 https://ec.europa.eu/programmes/erasmus-plus/sites/erasmusplus/files/erasmus-plus-annual-report-2015.pdf 18 https://publications.europa.eu/en/publication-detail/-/publication/ec8ce099-fec9-4563-a1ca-cd4db1b984ec 19 Findings from the RAY survey of participants completed in 2014-15, undertaken by the network of National Agencies responsible for implementation of the Erasmus+ Youth Chapter in 29 different countries: http://www.researchyouth.eu/results-erasmus-youth-in-action. 20 As above (see note 2).

41
impactful being: adoption of new teaching approaches (83% agreed or strongly agreed this was the case); learning from good practice abroad (91%); and increased job satisfaction (88%)
2. 90% of participants in Youth Worker Mobility projects reported improvements in skills and qualifications as a result of their involvement in international partnership projects21.
Youth KA1
The British Council World of Experience 2015 report22 found that 46% of those with an international experience (including Erasmus graduates) were involved in innovation, compared with 25% of those with no international experience:
Those with international experience were more likely to be in roles with an international focus, with 60% liaising with international colleagues, suppliers and customers, compared with less than 30% of those without international experience. Those who had spent time abroad believed that they were more confident in their ability to communicate with people from other countries and cultures and to deal with linguistic barriers (71% compared with 45% in the group without international experience). A large majority of people with international experience described themselves as having abilities needed for innovation, including strong analytical and critical thinking skills (73%) and strong problem-solving skills (83%). Individuals with international experience believed that this had helped them to develop these skills.
HE, Schools Youth KA1
21 As above (see note 2). 22 https://www.britishcouncil.org/organisation/policy-insight-research/research/world-experience

42
British Council Research = World Class: How global thinking can improve your school23 The benefits for learners are at the heart of international education, and the research revealed some interesting insights into how they benefitted from it. Reading, writing and communication skills all improved, as did the learners’ moral and spiritual development, such as awareness of right and wrong, and understanding of cultural and religious behaviour. The research also showed that it had a major effect on the performance of under-achieving learners, who became more focussed and motivated, resulting in improved behaviour in classrooms and around the school. Finally, international education was found to contribute towards a more open-minded attitude with regard to global issues, and a belief that learners have the ability to take action and bring about a change locally.
Schools KA1/2
British Council Research: Culture at work report24 Research commissioned by the British Council through IPSOS, covering HR managers from over 350 companies in nine different countries, showed that intercultural skills (including – but not limited to – the ability to communicate in a foreign language) are seen as increasingly important by private-, public- and voluntary-sector employers25.
All KA1
All Party Parliamentary Group for Education report: How well do schools prepare children for their future? 26 In a labour market that is already changing, there is a growing consensus amongst employers that formal knowledge is no longer enough to prepare young people for the workforce. In their submission of evidence to our inquiry, the Association of School and College Lecturers (ASCL) described “a desire for young people to arrive in the workforce better equipped with attributes which allow them to move more quickly into mastery of new situations”. The skills which allow children be adaptable in this way fall under a number of monikers, but are most often described as “soft skills”; characteristics which are valued by employers that are broadly applicable across a range of industries and positions. Soft skills include attitudinal characteristics such as confidence, motivation, and self-awareness; life skills such as social skills and time-keeping; and transferable skills like problem-solving and teamwork. These characteristics are also typically underdeveloped in socio-economically disadvantaged young people, presenting a major barrier to social mobility. The desire among employers for young people with better soft skills is demonstrated by a recent survey by the Institute of Directors which found that 38% of their members were suffering from an inability to find the right person to fill a vacancy. The skills that these employers most often reported as lacking in young people fall under the broad umbrella of soft skills, with 33% worried specifically about communications skills, 35% about team working and 36% about resourcefulness. The CBI’s most recent skills survey also finds that businesses are
Schools KA1/KA2
23 https://schoolsonline.britishcouncil.org/content/world-class-how-global-thinking-can-improve-your-school 24 https://www.britishcouncil.org/organisation/policy-insight-research/research/culture-work-intercultural-skills-workplace 25 http://www.britishcouncil.org/organisation/publications/culture-work-intercultural-skills-workplace 26 http://www.educationappg.org.uk/inquiry-2016-17/report-how-well-do-schools-prepare-children-for-their-future/. See source for references to the material quoted therein.

43
not satisfied with school leavers’ communication (50%), analysis (50%), and self-management (48%). This data articulates issues for the UK which Erasmus+ can be demonstrated as addressing.
Impact on UK soft power
1. UK NA participation outputs 2. OR EC 2015 report incoming/ outgoing 3. OR MT+ data for 15/16 Provisional 2015-16 incoming and outgoing mobility statistics across all sectors, extracted from the mobility tool+ dashboard by the UK National Agency on 23 January 2017: This data can be broken down by sector/activity, from the dashboard reports or the EC’s report
Top five destinations for UK study, volunteering or training abroad 2015
Country Total Participants Staff
Students and young people
Spain 5,885 880 5,005
France 5,021 485 4,536
Germany 3,074 332 2,742
Italy 1,810 310 1,500
Netherlands 1,423 225 1,198
Top five sending countries to the UK in 2015
Country Total Participants Staff
Students and young people
France 6,215 1,471 4,744
Germany 6,189 1,645 4,544
Spain 5,800 1,357 4,443
Italy 5,323 1,107 4,216
Netherlands 5,254 869 4,385
a) According to statistics released from 2015 activity the UK is the number one destination for education staff to train abroad, with 13,799 staff training in the UK, ahead of Spain with 12,630 and Italy with 10,226.
b) The UK is also the third most popular destination for students volunteering, studying or training abroad with 49,896 people, coming behind Spain (66,768) and Germany (53,706).
c) Most participants from the UK went to Spain (5,885), followed by France (5,021) and Germany (3,074).
All KA1
3. World of experience – percentage of schools 82% of primary schools have links with international schools
Schools KA1/2

44
Economic impacts, and impact on UK exports, particularly the UK HE sector
UUKi mid- term review of Erasmus+27 91% of HE respondents stated as a benefit of Erasmus+ the recruitment of European students for future fee-paying full degree mobility following an Erasmus+ period in the UK
HE KA1
Impact on future cooperation – e.g. on future HE research collaboration
1. UK National Agency 2015 factsheet, produced by the EC
KA2
2. UUKi mid-term review of Erasmus+ 91% of HE respondents stated this as a benefit of Erasmus+: Foundation it provides for the development of partnerships with European universities and 62.5% agreed this benefit: Foundation it provides to access other European funding, including Horizon 2020 funding The main benefits of engaging with E+ are considered to be the support it provides for mobility as well as the foundation for partnership development. This is comparable1 to UUKi’s findings in a February 2015 survey on the First Experiences of the Implementation of the Erasmus+ Programme. The main difference is that in the 2015 survey, the internationalisation of the staff community was only highlighted by 60%, or 21 of respondents, whereas in the 2016 survey it was much higher at 85%, or 41 respondents.
HE
3. eTwinning cooperation eTwinning, the online community for schools across Europe, is a free and secure online network where teachers from more than 40 countries can find partners, work on projects, exchange best practice and enable student collaboration. 50% of schools in the UK who received Erasmus+ funding in 2016 are using the free and secure online platform eTwinning to support their project. 2016 saw 2,070 UK teachers register and over 8,900 international projects have taken place in UK schools since the platform launched in 2005.
Schools eTwinning
27 http://www.universitiesuk.ac.uk/policy-and-analysis/reports/Pages/Erasmus-Interim-Evaluation-UUKi'sSubmission-March2017.aspx

45
Other sources
1 British Council HE case studies can be found at https://www.erasmusplus.or.uk/stories/sector (click on the HE tab).
2 eTwinning - note by the National Agency
1. Description of the programme
The eTwinning programme contributes to internationalisation and a higher quality of teaching and learning in schools across Europe and beyond by fostering co-operation between schools through the provision, marketing and customer support for the online eTwinning database for school teachers. The database includes a partner-finding tool and a range of resources for school partnerships and projects online. In the UK in 2016, there were 1000 new school registrations, 2000 new member registrations and 1200 new UK projects, including 45 national projects (those involving only UK schools) and 45 projects with eTwinning Plus countries (Armenia, Azerbaijan, Georgia, Moldova, Tunisia and Ukraine).
2. eTwinning funding
The eTwinning budget is agreed in principle for the seven years 2014-2020, and agreed in detail on an annual or bi-annual basis. The total amount is anticipated to be in the region of €11 million from the EU, plus a 20% contribution of approximately €1.4 million from the British Council: the eTwinning budget is inclusive of management costs. The eTwinning programme is expected to continue under the next MFF 2021-2028.
3. eTwinning activities, outcome/impact and benefit to the UK
The British Council has delivered a marketing, communications and customer service plan, including a series of events, for schoolteachers across the UK, to encourage strong take-up of eTwinning opportunities ad to disseminate the results. eTwinning (as part of the total Erasmus+ programme) forms a key part of a whole-school approach to the international dimension in schools and contributes to the professional development of teachers; eTwinning supports national education strategies and policy priorities; there is increasing support for eTwinning among key stakeholders/influencers, particularly school leaders, and an increase in quality of projects.
By December 2016, the total numbers of UK registrations on the eTwinning portal were as follows:
23,029 teachers
13,587 schools
9,180 projects.
3 Erasmus+ Youth Chapter: Impact on young people’s development in the UK - Briefing
note for DfE by The British Council (extracts)
1. Introduction 1.1 Young people’s non-formal learning – the learning that takes place beyond the formal context of school, college and work-place – has been the focus of increased attention from government in

46
recent years. New statements of policy have been published in each UK country – beginning with Positive for Youth28, the cross-departmental document from the Westminster Government29. Each responds to a shared policy concern: how to enable young people to gain the skills they need to prosper in a global economy and to participate fully in the life of their communities. 1.2 This briefing note summarises the evidence available for the impact of European and international experience, through the Erasmus+ programme, on the dual aim to increase young people’s economic and social participation. It recognises that the effects of non-formal learning tend to be assessed in terms of intermediate outcomes – particularly in the attitudes, skills and behaviours often referred to as young people’s emotional and social capabilities. 1.3 Positive for Youth confirmed the ‘fundamental importance of social and emotional capabilities for achievement of all other outcomes for young people.’ These are the basis for effective decision-making; enabling young people to directly shape their present and their future30. 1.4 The briefing also notes the increased policy-level interest in the impact of young people’s non-formal learning (including non-formal learning with a European/international dimension) on emerging policy priorities in health and well-being31, digital literacy and safety32, and the risks from extremism and radicalisation33. 2. Erasmus+ take-up 2.1 The Erasmus+ Youth Chapter awards grant funds, on a competitive basis, to collaborative projects involving young people (aged 13 to 30) and youth workers from the UK, other Programme Countries34 and Neighbouring Partner Countries. These projects give opportunities for young people to work together and to make a difference on the issues that matter to them. Typical activities include: identifying practical measures to improve access to employment35, contributing to voluntary social action projects while experiencing life in another country, planning and organising consultation between young people and community leaders (including elected politicians). 2.2 In first three years of the Erasmus+ programme, 2014-16, UK youth organisations submitted 787 successful project applications (equivalent to 27% of the total across sectors), attracting EU grant funds totalling €34,061,580 (equivalent to 10% of the UK total). Once completed, these projects will have included 46,672 participants (equivalent to 20% of the UK total). 2.3 Roughly one in four participants in Erasmus+ Youth projects is a youth worker/other adult practitioner. Through job attachments, training and other professional development activities, they gain new perspectives, new connections and new resources for partnership. In this way, Erasmus+ Youth projects build the capacity of youth organisations and create better learning opportunities for
28 https://www.gov.uk/government/publications/positive-for-youth-executive-summary 29 Equivalent documents from the UK Devolved Administrations:-
Northern Ireland: https://www.education-ni.gov.uksites/default/files/publications/de/priorities-for-youth.pdf Scotland: https://www.education.gov.scot/Documents/youth-work-strategy-181214.pdf Wales: http://www.youthworkwales.org.uk/creo_files/upload/files/140221-national-youth-work-strategy-en.pdf
The United Nations World Youth Report (2016) gives an overview of wider trends in youth policy development: https://www.un.org/development/desa/dspd/2016/07/19/world-youth-report-on-youth-civic-engagement/ 30 Positive for Youth also refers to the Framework of outcomes for young people produced by the Young Foundation (2012): https://www.gov.uk/government/publications/framework-of-outcomes-for-young-people. Though created with reference to prevailing conditions in England, these outcomes can also be considered applicable across the UK. 31 https://www.gov.uk/government/publications/improving-young-peoples-health-and-wellbeing-a-framework-for-public-health 32 https://www.youthlinkscotland.org/media/1301/youthlinkscotland-childrenandtheinternetresponse.pdf 33 http://data.consilium.europa.eu/doc/document/ST-9640-2016-INIT/en/pdf; 34 Erasmus+ Programme Countries are EU Member, EEA countries and EU candidate/accession countries. 35 Access to employment is commonly referred to by young people as the area where they face most obstacles (see below, note 8, for details of the RAY research and analysis). There are significant differences between responses from young people in the UK and in other countries. 66% of UK respondents to the RAY survey identified employment as the least accessible area, compared to 78% in other countries, while 53% of UK respondents identified social and political participation as the least accessible, compared to 48% elsewhere

47
young people. Demand for project support under this area of the programme has been consistently high; in 2016 alone, the value of project applications exceeded total available funding by 119%. 2.4 Over the three completed years of the programme, an average of 43% of participants in Erasmus+ Youth projects in the UK were categorised as having fewer opportunities (the EU classification, denoting different forms of disadvantage and vulnerability). The proportion of participants in this category has risen 30% (to 55%) and is expected to reach 65% by the end of the programme, 2020. Since Erasmus+ Youth projects are based on non-formal learning approaches (emphasising flexibility and voluntary participation) they are especially relevant to the most disadvantaged and vulnerable young people, and others whose formal educational attainment may be at risk36. 3. Assessment of impact 3.1 As noted above, youth workers and others in positions of responsibility for young people’s non-formal learning tend to look for changes in the attitudes, skills and behaviours that contribute to personal and social development, in order to verify the results of their work. These include changes in the areas of: communication, confidence and agency, planning and problem-solving, relationships and leadership, creativity, resilience and leadership, managing feelings37. 3.2 For Erasmus+ in the UK, the table below shows the connections between results at the individual level and results sought in organisations, communities and national populations38.
Policy priority / objective (UK government / UK DAs)
Programme priority / objective (EC)
Indicator of results (organisation-level)
Indicator of results (individual-level)*
Improved standards in education and training
Improved level of key competences and skills
Improved quality of youth work / non-formal learning
Improved personal and social skills
Improved contribution to UK prosperity
Improved links between the youth field and the labour market
Improved co-operation among youth organisations and other stakeholders
Improved employability
Improved educational attainment / improved proficiency in foreign languages
Multilingualism: improved language learning, awareness of linguistic diversity and intercultural competence
Improved support for foreign language learning, awareness of linguistic diversity and intercultural competence
Improved foreign language skills
Improved political participation by young people
Improved levels of active citizenship / participation in democratic life in Europe;
Improved support for the development of evidence-based youth policy
Improved participation in democratic processes
Improved skill and qualification levels among teachers, youth workers and other educators
Improved co-operation and mobility of teachers, youth workers and other educators
Improved skill and qualification levels among teachers, youth workers and other educators
Improved skills and competences (as above)
Improved social mobility and access to opportunities for all
Social inclusion and solidarity – through improved access by participants with
Improved support for inclusion and participation of young people with disadvantaged
Improved level of participation by young people with disadvantaged backgrounds and fewer opportunities
36 The Casey review into community integration and social cohesion noted the positive impact of social action initiatives, such as the National Citizen Service, on understanding between young people from different backgrounds: https://www.gov.uk/government/uploads/system/uploads/attachment_data/file/575973/The_Casey_Review_Report.pdf 37 The Centre for Youth Impact (created 2014) has summarised the experience of organisations in using the Framework of Outcomes for Young People (Young Foundation, 2012) and collated other relevant resources: https://www.youthimpact.uk/resources-hub/resource-type/outcomes-frameworks. These are also highlighted to Erasmus+ applicant and beneficiary organisations in the guidance provided by the UK National Agency: https://www.erasmusplus.org.uk/impact-assessment-resources. 38 The Erasmus+ UK National Agency’s Logic Model sets out these connections in more detail, to clarify cause and effect: https://www.erasmusplus.org.uk/erasmus-uk-logic-model.

48
disadvantaged backgrounds and fewer opportunities
backgrounds and fewer opportunities
Improved understanding and respect for difference
Improved awareness and understanding cultural diversity – within and beyond Europe
Improved intercultural competence; improved support for young people’s awareness and understanding of cultural diversity
Improved intercultural competence
3.3 Data from Erasmus+ Youth projects, for these main impact areas, is shown in the table below. Unless otherwise stated, data sources are as follows:-
EU Participant Survey: optional survey designed for use by all Erasmus+ project participants.
Current data sets cover UK projects (2014-16) under Learning Mobility of Individuals (Key
Action 1) – including European Voluntary Service (EVS), Youth Exchange and Youth Worker
Mobility.
RAY Survey39: targeted survey for use with selected project participants, designed on behalf
of the network of National Agencies implementing the Erasmus+ Youth Chapter. Findings
used in this briefing paper are from projects completed during the first two years of the
Programme, 2014-15, under Learning Mobility of Individuals (Key Action 1), TCA projects (Key Action 2)40 and Meetings Between Young People and Decision-makers (Key Action 3).
3.4 Where possible, a percentage rating is given. This denotes the proportion of participants confirming that their Erasmus+ experience has brought about positive change.
Impact area Project participants, 2014-16
Young people Youth workers / other practitioners
Improved personal and social skills 93%41 n/a
Improved quality of youth work / young people’s non-formal learning
n/a 68%
Improved employability 80%42 70%
Improved co-operation between organisations in the youth field and other stakeholders
n/a See below, para. 4. Case-studies
Improved foreign language skills 86% 89%
Improved participation in democratic decision-making
77%43 n/a
Improved support for youth policy development
64%44 73%
Improved skill and qualification levels among teachers, youth workers and other educators
n/a 90%
39 http://www.researchyouth.eu/results-erasmus-youth-in-action. The RAY survey findings cover projects supported in all Programme countries, including 617 projects led by organisations in the UK. 40 TCA projects are short-term residential training courses, focussing on aspects of professional practice relevant to
European/international projects (such as, support for inclusion and diversity in Youth volunteering, or the development of young people’s entrepreneurship skills). TCA projects are planned and managed by National Agencies, using Key Action 2 funds, and listed on the SALTO Training Calendar: https://www.salto-youth.net/tools/european-training-calendar/. 41 Project participants - EVS and Youth Exchange. 42 As above (see note 14). 43 As above (see note 14). 44 Project participants – Youth Exchange only.
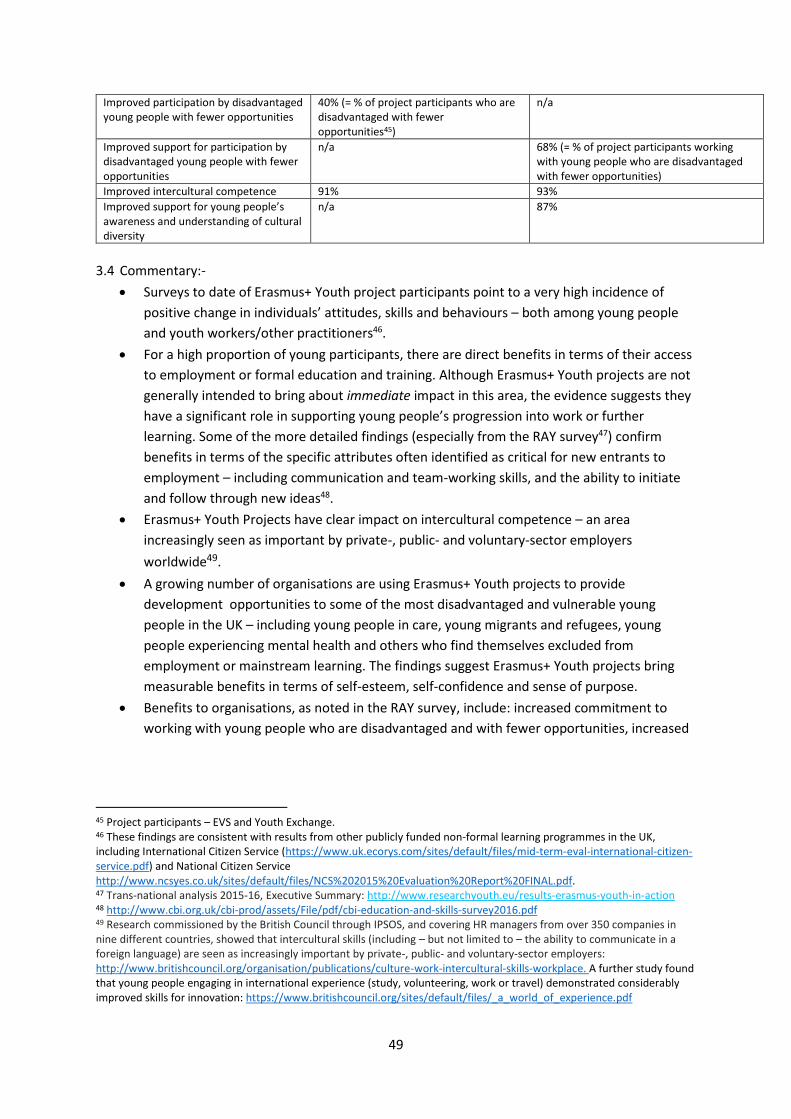
49
Improved participation by disadvantaged young people with fewer opportunities
40% (= % of project participants who are disadvantaged with fewer opportunities45)
n/a
Improved support for participation by disadvantaged young people with fewer opportunities
n/a 68% (= % of project participants working with young people who are disadvantaged with fewer opportunities)
Improved intercultural competence 91% 93%
Improved support for young people’s awareness and understanding of cultural diversity
n/a 87%
3.4 Commentary:-
Surveys to date of Erasmus+ Youth project participants point to a very high incidence of
positive change in individuals’ attitudes, skills and behaviours – both among young people
and youth workers/other practitioners46.
For a high proportion of young participants, there are direct benefits in terms of their access
to employment or formal education and training. Although Erasmus+ Youth projects are not
generally intended to bring about immediate impact in this area, the evidence suggests they
have a significant role in supporting young people’s progression into work or further
learning. Some of the more detailed findings (especially from the RAY survey47) confirm
benefits in terms of the specific attributes often identified as critical for new entrants to
employment – including communication and team-working skills, and the ability to initiate
and follow through new ideas48.
Erasmus+ Youth Projects have clear impact on intercultural competence – an area
increasingly seen as important by private-, public- and voluntary-sector employers
worldwide49.
A growing number of organisations are using Erasmus+ Youth projects to provide
development opportunities to some of the most disadvantaged and vulnerable young
people in the UK – including young people in care, young migrants and refugees, young
people experiencing mental health and others who find themselves excluded from
employment or mainstream learning. The findings suggest Erasmus+ Youth projects bring
measurable benefits in terms of self-esteem, self-confidence and sense of purpose.
Benefits to organisations, as noted in the RAY survey, include: increased commitment to
working with young people who are disadvantaged and with fewer opportunities, increased
45 Project participants – EVS and Youth Exchange. 46 These findings are consistent with results from other publicly funded non-formal learning programmes in the UK, including International Citizen Service (https://www.uk.ecorys.com/sites/default/files/mid-term-eval-international-citizen-service.pdf) and National Citizen Service http://www.ncsyes.co.uk/sites/default/files/NCS%202015%20Evaluation%20Report%20FINAL.pdf. 47 Trans-national analysis 2015-16, Executive Summary: http://www.researchyouth.eu/results-erasmus-youth-in-action 48 http://www.cbi.org.uk/cbi-prod/assets/File/pdf/cbi-education-and-skills-survey2016.pdf 49 Research commissioned by the British Council through IPSOS, and covering HR managers from over 350 companies in nine different countries, showed that intercultural skills (including – but not limited to – the ability to communicate in a foreign language) are seen as increasingly important by private-, public- and voluntary-sector employers: http://www.britishcouncil.org/organisation/publications/culture-work-intercultural-skills-workplace. A further study found that young people engaging in international experience (study, volunteering, work or travel) demonstrated considerably improved skills for innovation: https://www.britishcouncil.org/sites/default/files/_a_world_of_experience.pdf

50
project management competences, and increased knowledge transfer and implementation
of good practice50.
4. Case-studies 4.1 Calum Barron was selected by the European Commission to present his experience as a volunteer in a video promoting EVS (European Voluntary Service), the youth volunteering strand of Erasmus+. Calum’s placement was arranged by UNA Exchange, under the Step by Step programme (supported by the Welsh Government through GwirVol).
‘I think EVS was the best cure for mental health – better than any drug, therapist or doctor. Since I was a kid, I was always in trouble, and then I turned 16 and was getting into worse stuff – trouble with the law, drugs, hanging out with the wrong people. I think this was the reason my youth workers arranged to send me to a project in Italy – to keep me out of jail. It was a real eye-opener and life-changing. In that place, I started to behave. I became quite open-minded because I realised that people in other countries are just people like me. I learnt about respect, I learnt about loyalty. If I hadn’t gone, I would probably be dead or in jail51.’
4.2 Care2Work: voices of young, marginalised carers – led by the London-based IARS International Institute, this Strategic partnership focused the situation of young carers from minority backgrounds – and the challenges they face in accessing employment. It is estimated that one in five of Europe’s population has responsibilities as a carer. In the UK alone, there are 1.5 million carers aged under 35; most are young women and girls. Those from a minority background often face additional challenges in pursuing their natural desire and ambition to be fully involved in the economy and in wider society. With project partners in Greece, Italy and Sweden, IARS enabled young carers themselves to research the issues, to present their findings and recommendations in discussion with policy-makers from the care, education and employment sectors52, and to co-create accredited training materials53. The starting-point was young carers’ own experience:-
‘There are a lot of freedoms that other people may take for granted but that as a young carer are not an option. The bigger picture meant that for me my mother’s comfort meant more to me. While at university I had to miss lectures because the carers didn’t turn up. I would make sure that the time I left for university was at a time when the carer would already be at the house. I would never leave my mum on her own so if the carer was late or if there was a tube strike or anything it meant that my going to university was secondary because my mum’s life and wellbeing were the priority.’
4.3 Mental health in schools – participants in the Connections project, an initiative of the Northern Ireland Assembly’s Education Service – supported under Meetings between young people and decision-makers (Erasmus+ Key Action 3), identified mental health as an area of priority concern. This became the focus of the young people’s inquiry – using the full range of professional support and specialist facilities normally only available to Assembly Members. Following consultation with over 2,400 young people across Northern Ireland, project participants designed and produced three short films54 – launched on World Mental Health Day, 10 October 2015, to an audience of legislators
50 Since most of the projects for organisational collaboration (Strategic partnerships) supported under Key Action 2 have not yet been completed, and have not yet submitted Final Reports, there is currently insufficient evidence for a detailed assessment of the impact on capacity-building. 51 Details: https://www.erasmusplus.org.uk/casestudy/erasmus-volunteer-calum-barron 52 The Care2Work project illustrates the finding from the RAY survey, that involvement in international partnership projects enables organisations to create new connections and synergies in their own communities. 53 The e-learning training course and other project outputs are available at: http://www.care2work.org/ 54 http://education.niassembly.gov.uk/video-gallery/mental-health-schools_short-film-explores-mental-health-schools. Assembly Members subsequently made a commitment to including Mental Health in the Northern Ireland Programme for Government.

51
and civil society influencers. The Connections project55 showed young people’s capacity for creativity and self-organisation, engaging both their peers and the authority generation in support of their stated aim,
‘to encourage positive, respectful relationships and represent the voices of young people on issues which affect their lives.’
55 Selected as a good practice project by the European Commission: http://ec.europa.eu/programmes/erasmus-plus/projects/eplus-project-details-page/?nodeRef=workspace://SpacesStore/f5786a3d-8ad3-41f0-868f-70893a70f71b.