mid-term business plan 2015 - topcon...mid-term plan fy2012 results exchange fluctuation effect of...
TRANSCRIPT

©2013 Topcon Corporation Creativity & Growth
Ⅱ Group Vision for the Mid-Term Business Plan
7
- new growth strategies -

©2013 Topcon Corporation Creativity & Growth
Strategic Directions to Achieve Mid-Term Business Plan 2015
8
Shift up a gear from Reform to Growth Strategy!! Aim to become a true Global Top !
Profitable and sustainable growth by creativity
Accelerate TM-1 products
Pioneer new business &
Strengthen conventional business
Utilize Global human resources
Strategy 1 Strategy 2 Strategy 3
New Slogan
Targeting ROE 20%!

©2013 Topcon Corporation Creativity & Growth
Topcon’s Business Domain
Expanding business in growing fields
9
IT Agriculture
Applied IT to agriculture and increase of productivity
IT Construction Automation of construction work
Survey/Construction
Infrastructure building in emerging countries
Ophthalmology Total solutions in response to increase of eye diseases caused by aging society
POC
SIC
POC
ECC
Monitoring Diagnostic evaluation of deteriorated infrastructure/ Disaster prevention system
GPS(GNSS)
SIC

©2013 Topcon Corporation Creativity & Growth
Strategy 1. Enhance new business (Strengthen core business)
10
Grow our business by aggressive investment
Core Business 60%
New Business 40%
R&D (New & Core)
35 billion yen
Net Sales (Unit: billion yen)
R&D to Sales Ratio
10%
0
70
140
FY2012 FY2013 FY2014 FY2015
New BusinessCore Business

©2013 Topcon Corporation Creativity & Growth 11
Core
New
Survey/Construction/ Building
IT for disaster prevention
Construction Information Modeling
Building Information Modeling
Enhance new business with strong basis of surveying instruments
Market Size
100
20
30
30
Core Business 54%
New Business 46%
Growth Rate
105%
150%
2,000%
150%
(FY12-15 plan)
Sensors for IT Agriculture
10 800%
Net Sales (Unit: billion yen)
(billion yen)
Strategy 1. Enhance new business (Strengthen core business)
0
25
50
FY2012 FY2013 FY2014 FY2015
New BusinessCore Business

©2013 Topcon Corporation Creativity & Growth 12
GNSS
IT Agriculture
IT Construction
Utilizing GNSS(GPS) as a core technology for rapid expansion in IT Construction & IT Agriculture
90
150
90
Core Business 55%
New Business 45%
140%
135%
200%
Net Sales (Unit: billion yen)
Core
New Market Size
Growth Rate (FY12-15 plan) (billion yen)
Strategy 1. Enhance new business (Strengthen core business)
0
30
60
FY2012 FY2013 FY2014 FY2015
New BusinessCore Business

©2013 Topcon Corporation Creativity & Growth 13
Strengthen Preventive Medicine and Treatment Segment by Enhancing the Strong Competitiveness of Examination/Diagnosis Segment
Examination/Diagnostic
Prevention/Checkup
Treatment/ Prognostic Management
Ophthalmic IT
100
80 70
30
Core Business 67%
New Business 33%
130%
160% 400%
160%
Net Sales (Unit: billion yen)
Core
New Market Size
Growth Rate (FY12-15 plan) (billion yen)
Strategy 1. Enhance new business (Strengthen core business)
0
25
50
FY2012 FY2013 FY2014 FY2015
New BusinessCore Business

©2013 Topcon Corporation Creativity & Growth 14
Strategy 2. Launch disruptive products
FY2010 - FY2012 (Results)
FY2013 - FY2015 (Plan)
Disruptive Innovation 5 models 10 models
World’s No.1 22 models 17 models
World’s First 9 models 22 models
Reduction of COGS 8 models 10 models
Products for emerging Markets 4 models 9 models
Enhancement of Sales Capability 3 models 6 models
Total 51 models 74 models
Accelerate development of strategic products by investing in R&D

©2013 Topcon Corporation Creativity & Growth
Strategy 3. Capitalize on the full value of global human resources
★福澤 弘 ★澤口 茂之 ★レイモンド・オコーナー
★内田 憲男 Topcon
Eye Care Company
Smart Infrastructure Company
★Hiroshi Fukuzawa ★ShigeyukiSawaguchi ★レイモンド・オコーナー
★Norio Uchida
Positioning Company
★Raymond O'Connor
Positioning Company (U.S.A.) ★Raymond O'Connor
Topcon Technology Center (Russia) ★Scott Baker
Topcon Precision Agriculture Pty Ltd. (Australia) ★Albert Zahalka
Tierra S.p.A. (Italy) ★Ivan Di Federico
Only 2% of POC employees are Japanese
3 in-house companies
15
Selecting right person for the right job globally
Only 40% of employees are Japanese
Topcon Corporation

©2013 Topcon Corporation Creativity & Growth
Financial Targets
[Consolidated] FY2012 FY2013 FY2014 FY2015
Net Sales 97,345 110,000 120,000 132,000
Operating Income (Operating income ratio)
5,214 (5.4%)
11,500 (10.5%)
16,000 (13.3%)
22,000 (16.7%)
Ordinary Income 3,471 10,000 14,500 20,500
Net Income 511 5,000 8,300 12,800
ROE 1.3% 10.3% 15% 20%
ROIC 3.8% 9.5% 11% 15%
Dividends per Share (yen) ¥6 ¥10 ¥16 ¥24 Dividend Payout Ratio 109.4% 21.6% 20% 20%
Assumed Exchange
Rate
US$ (yen) ¥83.23 ¥90 ¥90 ¥90
EUR(yen) ¥107.57 ¥120 ¥120 ¥120
16
Average Exchange Rate
(Unit: million yen)
Average Exchange Rate
※ Target Dividend Payout Ratio: TOPCON targets 20% as the consolidated dividend payout ratio
Mid-Term Plan 2015
©2013 Topcon Corporation Creativity & Growth
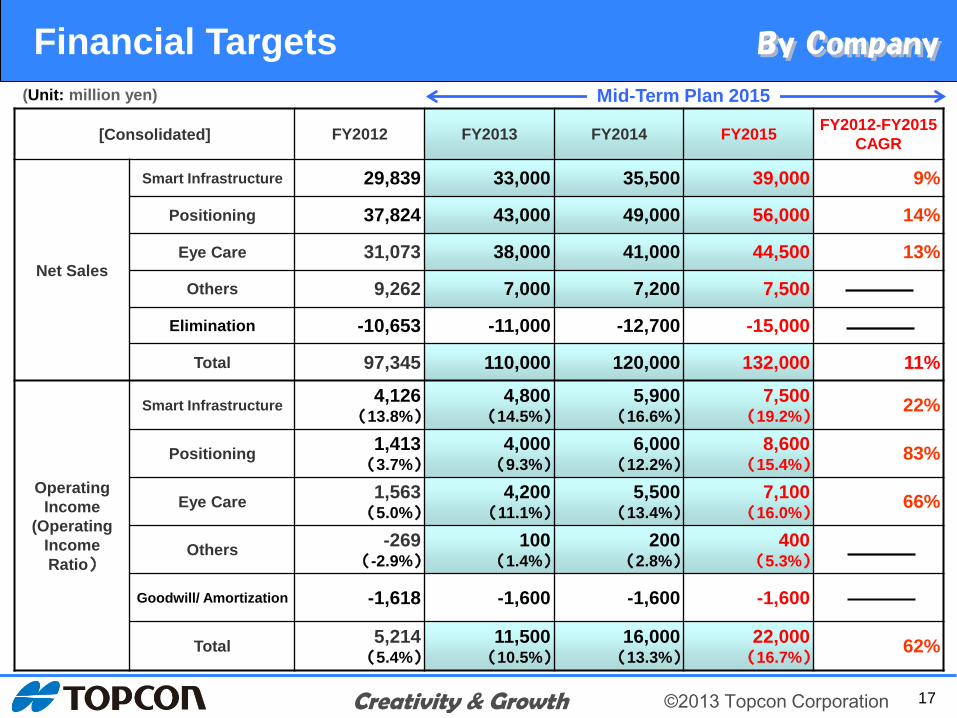
Financial Targets
17
[Consolidated] FY2012 FY2013 FY2014 FY2015 FY2012-FY2015 CAGR
Net Sales
Smart Infrastructure 29,839 33,000 35,500 39,000 9%
Positioning 37,824 43,000 49,000 56,000 14%
Eye Care 31,073 38,000 41,000 44,500 13%
Others 9,262 7,000 7,200 7,500
Elimination -10,653 -11,000 -12,700 -15,000
Total 97,345 110,000 120,000 132,000 11%
Operating Income
(Operating Income Ratio)
Smart Infrastructure 4,126 (13.8%)
4,800 (14.5%)
5,900 (16.6%)
7,500 (19.2%) 22%
Positioning 1,413 (3.7%)
4,000 (9.3%)
6,000 (12.2%)
8,600 (15.4%) 83%
Eye Care 1,563 (5.0%)
4,200 (11.1%)
5,500 (13.4%)
7,100 (16.0%) 66%
Others -269 (-2.9%)
100 (1.4%)
200 (2.8%)
400 (5.3%)
Goodwill/ Amortization -1,618 -1,600 -1,600 -1,600
Total 5,214 (5.4%)
11,500 (10.5%)
16,000 (13.3%)
22,000 (16.7%) 62%
(Unit: million yen) Mid-Term Plan 2015

©2013 Topcon Corporation Creativity & Growth
5.2 3.0 1.4
- 4.8
8.0
- 4.0
13.2
16.8
22.0
Analysis of Operating Income (Unit: billion yen)
18
FY2012 Actual Results
FY2015 Mid-Term Plan
FY2012 Results
Exchange Fluctuation
Effect of Reform
Plan Investment for Development
COGS Reduction
Sales Price Down
Sales Increase
FY2015 Mid-Term Plan
Total Amount of Gain and
Loss Factors