mid-term management plan€¦ · mid-term management plan fy12/10 earnings announcement meeting...
TRANSCRIPT

FY12/10 Earnings Announcement Meeting
Mid-term Management PlanFY12/10 FY12/10 Earnings Announcement MeetingEarnings Announcement Meeting
Mid-term Management Plan
Feb 10th, 2011Feb 10th, 2011
enen--japan Inc.japan Inc.

-2-
FY12/10 Operating Results Summary ・・・・・・Company wide・Summary of Segment Information
Market Trends ・・・・・・・・・・・・・・・・・・・・・・・・・・・・・・・
Mid-term Management Plan ・・・・・・・・・・・・・・・・
FY12/11 Operating Results Projections ・・・
Return to Shareholders ・・・・・・・・・・・・・・・・・・・・・
(Reference) Non-consolidated Financial Statement ・・・・・・・
Appendix ・・・・・・・・・・・・・・・・・・・・・・・・・・・・・・・・・・・
P 3
P 20
P 24
P 39
P 44
P 46
P 54

-3-
FY12/10
Operating Results Summary
- Company wide -
FY12/10
Operating Results Summary
- Company wide -

-4-
Although the unemployment rate remains high, the number of job offers showed a moderate increase, led by active recruitment in some industries and companies. The overall business environment is still severe although the business environment of staff agencies and temporary staffing agencies appears to have bottomed out.
< Market Environment > < Market Environment >
< Sales > ¥9.78bn.< Sales > ¥9.78bn.
Sales from [en] Career Change Info rose for the first time in three periods, while sales from [en] Part-time Jobs and Education/Evaluation Business increased for the first time in two periods. Wall Street Associates, which became a consolidated subsidiary in the period ended December 2010, performed well.
< Operating Income > ¥1.54bn.< Operating Income > ¥1.54bn.
Operating income increased for the first time in three periods after the Company made efforts to cut costs, mainly labor costs and advertisement expenses, although it invested in a new business.
FY12/10 Operating Results Highlights FY12/10 Operating Results Highlights

-5-
FY2009(09.Jan-Dec)
FY2010(10.Jan-Dec)
(million yen) % of sales % YOY change (million yen) % of sales % YOY
change
Net Sales 10,209 100.0% -52.1% 9,991 100.0% -2.1%
Cost of Sales 1,804 17.7% -19.0% 1,636 16.4% -9.3%
Personnel 374 3.7% -53.9% 414 4.1% 10.5%
Other 1,429 14.0% 0.8% 1,222 12.2% -14.5%
Gross Profit 8,404 82.3% -56.0% 8,354 83.6% -0.6%
SGA(Sales,general
&administrative)7,144 70.0% -45.7% 6,579 65.9% -7.9%
Personnel 3,177 31.1% -35.3% 3,312 33.2% 4.2%
Advertising,sales promotion 1,979 19.4% -64.9% 1,765 17.7% -10.8%
Other 1,988 19.5% -23.7% 1,501 15.0% -24.5%
Operating income 1,259 12.3% -78.8% 1,774 17.8% 40.9%
Ordinary income 1,212 11.9% -79.5% 1,803 18.0% 48.7%
Net income 459 4.5% -85.1% 875 8.8% 90.5%
FY12/10 Income Statement (Companywide : Consolidated)FY12/10 Income Statement (Companywide : Consolidated)

-6-
[en] Career Change Info ・・・+¥240mn[en] Career Change Consultant ・・・ー¥500mn[en] Temporary Placement Info ・・・ー¥550mn[en] Part-time Jobs ・・・+¥ 70mn[en] Job Info for Students ・・・ー¥380mnEducation/Evaluation Business ・・・+¥110mnWSA ・・・+¥710mnOthers ・・・+¥ 50mn
(Yen)
FY12/10 Operating Results Changing Factor(Companywide : Consolidated)FY12/10 Operating Results Changing Factor(Companywide : Consolidated)
Net Sales decrease 2.1%YOY to ¥210mn.
Net Sales
Expenses
Operating Income
¥9.9bn.
¥8.9bn.
¥1.2bn. ¥1.7bn.
¥8.2bn.
¥10.2bn.
Expenses decrease 8.2%YOY to ¥730mn.
Rent expense ・・・- ¥310mnAd ,PR expenses ・・・- ¥210mn
Operating income increase 40.9%YOY to ¥510mn.
FY12/09 FY12/10

-7-
[reference] FY12/10 Revised Plan* vs. Actual[reference] FY12/10 Revised Plan* vs. Actual
* Nov 10, 2010 announcement
Net Sales
Expenses
Operating Income
¥9.9bn.
¥8.2bn.
¥1.5bn. ¥1.7bn.
¥8.2bn.
¥9.7bn.
Expenses almost as planned
Net Sales outperformed revised plans by ¥200mn. (+2.1%)
[en] Career Change Info ・・・+¥130mnWSA ・・・+¥ 50mn
Operating income outperformed revised plans by ¥230mn.(+15.2%)
FY12/10 FY12/10(Revised) (Actual)

-8-
FY12/10
Operating Results Summary
- Summary of Segment Information -
FY12/10
Operating Results Summary
- Summary of Segment Information -

-9-
8,3258,541
17,630
1,797
2,465
5,853
0
2,000
4,000
6,000
8,000
10,000
12,000
14,000
16,000
18,000
20,000
FY12/08 FY12/09 FY12/10
0
1,000
2,000
3,000
4,000
5,000
6,000
7,000
Sales
Operating Income
(Million Yen)
Mid Career Hiring BusinessMid Career Hiring Business
With the economy gradually recovering, needs for part-time and mid-career workers recovered.
The business environment remained severe for staff agencies except for major companies and specialized staff agencies.
There were signs that needs for temporary staff were recovering in the latter half of the year, mainly among major companies.
Sales from [en] Career Change Info increased for the first time in two periods with the number of job offers posted rising while the market is recovering.
Sales from [en] Part-time Jobs rose 9.9% due to a significant improvement in per-capita productivity.
WSA achieved solid results due to brisk recruitment needs among foreign companies and Japanese companies that are globalizing their business.
Market EnvironmentMarket Environment
FY12/10 OverviewFY12/10 Overview

-10-
10,558
4,066 4,170
3,568
2,3041,735
1,165
820
2,248
8351,346
746 670
0
5,000
10,000
15,000
20,000
FY12/08 FY12/09 FY12/10
WSA
[en]Part-t ime Jobs
[en]Temporary Placement Info
[en]Career Change Consultant
[en]Career Change Info
(Million Yen)
Mid Career Hiring Business –Sales Breakdown by Product-Mid Career Hiring Business –Sales Breakdown by Product-

-11-
FY12/08(09.Jan-Dec)
FY12/09(10.Jan-Dec)
(million yen) % of sales % YOY change (million yen) % of sales % YOY
change
Net Sales 8,541 100.0% -51.6% 8,522 100.0% -0.2%
Cost of Sales 957 11.2% -32.8% 948 11.1% -0.9%
Gross Profit 7,584 88.8% -53.2% 7,574 88.9% -0.1%
SGA(Sales,general
&administrative)5,786 67.7% -44.1% 4,937 57.9% -14.7%
Personnel 2,462 28.8% -31.2% 2,562 30.1% 4.0%
Advertising,sales promotion 1,780 20.8% -63.4% 1,236 14.5% -30.6%
Other 1,543 18.1% -18.8% 1,138 13.4% -26.2%
Operating income 1,797 21.0% -69.3% 2,636 30.9% 46.7%
*Non-consolidated performance for FY12/09 (WSA not included)
Mid-Career Hiring Business: [en] Career Change Info, [en] Career Change Consultant, [en] Temporary Placement Info, [en] Part-time Jobs, WSA,other mid-career hiring related
FY12/10 Term Income Statement -Mid-Career Hiring BusinessFY12/10 Term Income Statement -Mid-Career Hiring Business

-12-
10,558
4,066 4,170
0
3,000
6,000
9,000
12,000
FY12/08 FY12/09 FY12/10
(Million Yen)
Mid Career Hiring Business -Sales breakdown by Website-Mid Career Hiring Business -Sales breakdown by Website-
1,346835
2,248
0
500
1,000
1,500
2,000
2,500
FY12/08 FY12/09 FY12/10
3,568
2,3041,735
0
800
1600
2400
3200
4000
FY12/08 FY12/09 FY12/10
1,165
820746
0
300
600
900
1200
FY12/08 FY12/09 FY12/10
【[en]Career Change Info】 【[en]Career Change Consultant】
【[en]Temporary Placement Info】 【[en]Part-time Jobs】
+2.6%-38.0%
-24.7%
+9.9%

-13-
1,486
3,448
1,110
-545
-405
215
0
500
1,000
1,500
2,000
2,500
3,000
3,500
4,000
FY12/08 FY12/09 FY12/10
-700
-500
-300
-100
100
300
500
Sales
Operating Income
(Million Yen)
Companies were slightly more active in hiring, with the number of companies that will hire more new graduates in fiscal 2012 compared with fiscal 2011 increasing slightly.
The number of companies that increased their recruitment budget from the previous year rose.
Because of such factors as the low ratio of students receiving job offers for those scheduled to graduate in fiscal 2011, students are increasingly concerned about employment; thus, the ratio of those who don’t care much about the size of companies increased from the previous year.
Because the Company made its site one that specializes in second-tier, small and midsize, and venture companies, the number of companies posted decreased from the previous year and sales fell 25.3% from the previous period.
Sales of items to assist companies’recruitment activities were brisk, increasing % from the previous period.
Market EnvironmentMarket Environment
FY12/10 OverviewFY12/10 Overview
New Graduate Hiring Business New Graduate Hiring Business

-14-
FY12/08(09.Jan-Dec)
FY12/09(10.Jan-Dec)
(million yen) % of sales % YOY change
(million yen)
% of sales % YOY change
Net Sales 1,486 100.0% -56.9% 1,123 100.0% -24.5%
Cost of Sales 817 55.0% 10.0% 503 44.8% -38.4%
Gross Profit 669 45.0% -75.3% 619 55.2% -7.5%
SGA(Sales,general
&administrative)1,214 81.7% -51.2% 983 87.5% -19.1%
Personnel 630 42.4% -46.0% 531 47.3% -15.7%
Advertising,sales promotion 197 13.3% -72.4% 196 17.5% -0.4%
Other 386 26.0% -36.2% 254 22.7% -34.1%
Operating income -545 -36.7% - -363 -32.4% -
FY12/10 Term Income Statement -New Graduate Hiring BusinessFY12/10 Term Income Statement -New Graduate Hiring Business
New Graduate Hiring Business: [en] Job Info for Students, other new graduate hiring related

-15-
204
180
285
7
2
39
0
50
100
150
200
250
300
350
FY12/08 FY12/09 FY12/10
-5
5
15
25
35
45
55
Sales
Operating Income
(Million Yen)
The number of companies that strengthened their human resource development to invigorate themselves by improving the performance of existing employees increased.
The number of providers that entered the fix-rate education service business increased.
With companies tightening hiring criteria, there were higher corporate needs for aptitude tests.
The number of companies that are members of the fix-rate training service “En-College”and the total number of people who took the course increased steadily.
Thanks to government subsidies, orders for collective training courses were brisk.
Market EnvironmentMarket Environment
FY12/10 OverviewFY12/10 Overview
Education/Evaluation Business Education/Evaluation Business

-16-
FY12/08(09.Jan-Dec)
FY12/09(10.Jan-Dec)
(million yen) % of sales % YOY change (million yen) % of sales % YOY
change
Net Sales 180 100.0% -11.7% 291 100.0% 61.5%
Cost of Sales 29 16.4% 28.6% 75 25.9% 155.0%
Gross Profit 151 83.6% -16.8% 216 74.1% 43.1%
SGA(Sales,general
&administrative)143 79.3% 0.9% 210 72.0% 46.6%
Personnel 83 46.4% -6.8% 135 46.3% 60.9%
Advertising,sales promotion 1 0.8% -36.2% 4 1.5% 194.2%
Other 57 32.0% 16.5% 70 24.2% 22.1%
Operating income 7 4.3% -80.5% 6 2.1% -20.8%
FY12/10 Term Income Statement -Education/Evaluation BusinessFY12/10 Term Income Statement -Education/Evaluation Business

-17-
En-College - A number of the member companies changeEn-College - A number of the member companies change
0
30
60
90
120
150
180
210
240
270
Jan Feb Mar Apr May Jun Jul Aug Sep Oct Nov Dec
(Company)

-18-
50
-525
0
10
20
30
40
50
60
FY12/08 FY12/09 FY12/10
-700
-500
-300
-100
100
300
500
Sales
Operating Income
(Million Yen)
Other BusinessOther Business
Thanks to the promotion campaign, the number of members and number of companies posted steadily increased. Meanwhile, the unit price for posting was lower than the price initially estimated.
The number of inquiries is increasing and the number of companies that are considering introducing it looks certain to increase.
FY12/10 OverviewFY12/10 Overview
0
50
100
150
200
250
300
350
Dec Jan Feb Mar Apr May Jun Jul Aug Sep Oct Nov Dec
[en]Green Wedding
HR Outsourcing Business 「FINE」
【 A number of the publication wedding venues change】

-19-
FY12/08(09.Jan-Dec)
FY12/09(10.Jan-Dec)
(million yen) % of sales % YOY change
(million yen)
% of sales % YOY change
Net Sales - - - 53 100.0% -
Cost of Sales - - - 108 204.2% -
Gross Profit - - - -55 -104.2% -
SGA(Sales,general
&administrative)- - - 449 847.2% -
Personnel - - - 83 157.2% -
Advertising,sales promotion - - - 328 618.9% -
Other - - - 37 71.1% -
Operating income - - - -504 -951.4% -
FY12/10 Term Income Statement -Other Business FY12/10 Term Income Statement -Other Business
Other Business: [en] Green Wedding , FINE

-20-
Market Trends Market Trends

-21-
0
10
20
30
40
50
60
4 5 6 7 8 9 10 11 12 1 2 3 4 5 6 7 8 9 10 11 12 1 2 3 4 5 6 7 8 9 10 11 12 1 2 3 4 5 6 7 8 9 10 11 12 1 2 3 4 5 6 7 8 9 10 11 12 1 2 3 4 5 6 7 8 9 10 11 12
2005 2006 2007 2008 2009 2010
有効求人倍率と完全失業率
0.00
0 .20
0 .40
0 .60
0 .80
1 .00
1 .20
1 .40
1 .60
1985 1986 1987 1988 1989 1990 1991 1992 1993 1994 1995 1996 1997 1998 1999 2000 2001 2002 2003 2004 2005 2006 2007 2008 2009 20100.0
1.0
2.0
3.0
4.0
5.0
6.0
(Year)
The effective jobThe effective job--OffersOffers--toto--Applicants ratio in 2009 fell 0.41 points from a year earlier Applicants ratio in 2009 fell 0.41 points from a year earlier and the unemployment rate increased 1.1 points from the previousand the unemployment rate increased 1.1 points from the previous year.year.
The number of ads on employment Websites had been recording a moThe number of ads on employment Websites had been recording a monthly increase after hitting nthly increase after hitting bottom in May 2009, but started to drop recently.bottom in May 2009, but started to drop recently.
Market Trends –Mid-Career Employment Market (1)Market Trends –Mid-Career Employment Market (1)
Effective Job-Offers-to-Applicants Ratio and Unemployment Rate
Effective Job-Offers-to-Applicants Ratio (Yearly Avg.)
Unemployment Rate (Yearly Avg.)
Employment Advertisement Trends
Source: Association of Job Information of Japan "Employment Advertisements" (December 2008)
Employment Magazines +Free Newspapers(10,000 ads)Employment Websites

-22-
29.0 39.052.5 62.0 70.0
56.0
18.5 19.5
47.0
66.0
90.0
120.0
149.0
139.5
55.0 58.0
-
50
100
150
200
250
FY2003 FY2004 FY2005 FY2006 FY2007 FY2008 FY2009 FY2010
Recruitment Service
Employment Websites
After peaking in 2007, the market size shrank for two consecutivAfter peaking in 2007, the market size shrank for two consecutive years.e years.The market seems to have expanded slightly in 2010 compared withThe market seems to have expanded slightly in 2010 compared with the previous year,the previous year,
but its recovery is projected to slow down.but its recovery is projected to slow down.
(Billion Yen)
Market Trends –Mid-Career Employment Market (2)Market Trends –Mid-Career Employment Market (2)

-23-
World
Japan
China
USA
Asia
-6.0
-3.0
0.0
3.0
6.0
9.0
12.0
15.0
1998 1999 2000 2001 2002 2003 2004 2005 2006 2007 2008 2009
(%)
(Data)UN, National Accounts Main Aggregates Database
Market Trends –GDP growth of each countryMarket Trends –GDP growth of each country
Although the global economy affects the GDP growth of each countAlthough the global economy affects the GDP growth of each country, ry, China maintains rapid growth and the Asian region as a whole keeChina maintains rapid growth and the Asian region as a whole keeps showing positive growthps showing positive growth

-24-
Middle Term Management Plan Middle Term Management Plan

-25-
Mid-term Management PolicyMid-term Management Policy
Business PolicyBusiness Policy
Focus on the bond between the individual and the companyFocus on the bond between the individual and the company
I I Aiming to increase the added value of our Aiming to increase the added value of our services by focusing on workersservices by focusing on workers’’active active commitmentcommitment after they join a companyafter they join a company
IIII Launching a new business that could Launching a new business that could become the second pillar of the company become the second pillar of the company by utilizing enby utilizing en--japanjapan’’s accumulated assetss accumulated assets

Executive
High Class
Middle Class
The young, New College Grad.
Students, Housewife, Part-time Jobber, Senior
-26-
Human Resource Business Human Resource Business
Better services for more workersBetter services for more workers
[en]Career Change [en]Career Change ConsultantConsultant
[en]New Career [en]New Career ChallengesChallenges
[en]Temporary [en]Temporary Placement InfoPlacement Info
WALL STREET ASSOCIATESWALL STREET ASSOCIATES
Education/Education/EvaluationEvaluationEnEn--CollegeCollege
[en]Career Change [en]Career Change InfoInfo
Contingent Contingent feefee
[en]Job Info for [en]Job Info for StudentsStudents

-27-
Mid-term Management PolicyMid-term Management Policy
Developing the Wedding Business at an early dateDeveloping the Wedding Business at an early datePromoting several businesses based on our Promoting several businesses based on our
business principlesbusiness principles
IIII Fostering a new business that could Fostering a new business that could become the second pillar of the become the second pillar of the company by utilizing encompany by utilizing en--japanjapan’’s s accumulated assetsaccumulated assets

-28-
New development in human resource businessNew development in human resource business
FullFull--fledged business expansion in Asiafledged business expansion in AsiaJanuary 2011: Established joint venture in January 2011: Established joint venture in ShanghaiShanghaiZhiyuan Human Resource Management ServiceZhiyuan Human Resource Management Service
2011 and beyond: Business expansion by WALL 2011 and beyond: Business expansion by WALL STREET ASSOCIATES in AsiaSTREET ASSOCIATES in Asia
Shanghai: January 2011
Zhiyuan Human Resource Management Service

-29-
Numerical targets on a consolidated basisNumerical targets on a consolidated basis
12.52.0
17.3
3.0
23.0
4.2
FY12/11 FY12/12 FY12/13
Sales Operating Income
Aiming for Aiming for ¥¥23 billion in sales, 23 billion in sales, ¥¥4.2 billion 4.2 billion in operating income in fiscal 2013in operating income in fiscal 2013
(Billion Yen)

-30--30-
Sales target by productSales target by product(Billion Yen)
Ne
w B
us
ine
ss
Products FY12/11 % YOY change FY12/12 % YOY
change FY12/13 % YOY change
[en] Career Change Info 4.73 +9.8% 5.8 +22.6% 7.7 +32.8%
[en] Career Change Consultant 0.77 -8.8% 0.8 +3.9% 0.8 0.0%
[en] Temporary Placement Info 1.85 +6.0% 2.0 +8.1% 2.2 +10.0%
[en] New Career Challenges 1.2 +46.8% 1.95 +62.5% 2.9 +48.7%
[en] Job Info for Students 1.05 +4.3% 1.27 +21.0% 1.3 +2.4%
Education/Evaluation Business 0.13 -39.2% 0.25 +92.3% 0.3 +20.0%
En-College 0.16 +105.3% 0.36 +125.0% 0.72 +100.0%
[en] Green-Wedding 0.14 +163.8% 0.41 +192.9% 0.62 +51.2%
「FINE」 0.05 - 0.14 +180.0% 0.28 +100.0%
WSA 2.2 - 2.73 +24.1% 3.22 +17.9%
Asia Area 0.0 - 0.22 - 0.52 +136.4%
New Business 0.0 - 0.92 - 1.84 +100.0%
Total 12.57 +25.8% 17.3 +37.6% 23.0 +32.9%

-31--31-
Sales target by productSales target by product
0
5
10
15
20
25
FY12/11 FY12/12 FY12/13
New Business
WSA
FINE
Green Wedding
En-Colleges
Education/Evaluation
Job Info for Students
New CareerChallengesTemporary PlacementInfoCareer ChangeConsultantCareer Change Info
(Billion Yen)
Proportion of sales from
new business
20.0%
27.6%
31.3%

-32-
8,522
10,840
17,640
13,700
2,710
3,000
3,760
2,636
0
2,000
4,000
6,000
8,000
10,000
12,000
14,000
16,000
18,000
20,000
FY12/10 FY12/11(E) FY12/12(E) FY12/13(E)
2,000
2,200
2,400
2,600
2,800
3,000
3,200
3,400
3,600
3,800
4,000
Sales
Operating Income
Midterm business strategyMidterm business strategy
Activities in FY12/11Activities in FY12/11
(Million Yen)
Establishing a system to appropriately provide products and services that address market environment and changes in customer needs
Strengthening user and customer follow-up to enhance workers’ active commitment after joining a company
Actively promoting development of new revenue sources such as overseas operations
Aiming at expanding the company’s share in the recovering market by increasing contingent fee in [en]Career Change Info and sales of new products such as [en] New Career Challenges
Starting to prepare for overseas operations with an eye on launching business during the current or next period
Mid Career Hiring BusinessMid Career Hiring Business

-33-
[en] Career Change Info – Major product lineup -[en] Career Change Info – Major product lineup -
Charge timing Unit price Case
Job adsAt the time of posting the ads
¥280,000to
¥1.2 million
General employment case
Search-type hiring solution
At the time of joining a company
¥900,000Job type for which recruitment is difficult with only job ads
Contingent fee
When a predetermined number of applications are receivedAt the time of joining a company
Individual consultation
Several times a year, a large number of job offers

-34-
4,308 4,730 5,8007,700
1,745 1,8502,000817
1,950
2,900
717
2,200
3,220
844
800
800770
2,200
1,200
2,730
0
3,000
6,000
9,000
12,000
15,000
18,000
FY12/10 FY12/11(E) FY12/12(E) FY12/13(E)
WSA
[en]New Career Challenges
[en]Temporary Placement Info
[en]Career Change Consultant
[en]Career Change Info
(Million Yen)
Mid Career Hiring Business –Sales breakdown by productMid Career Hiring Business –Sales breakdown by product

-35-
770 800 800844
0
200
400
600
800
1,000
FY12/10 FY12/11(E) FY12/12(E) FY12/13(E)
4,308 4,7305,800
7,700
0
2,500
5,000
7,500
10,000
FY12/10 FY12/11(E) FY12/12(E) FY12/13(E)
(Million Yen)
Mid Career Hiring Business –Sales breakdown by WebsiteMid Career Hiring Business –Sales breakdown by Website
1,745 1,850 2,0002,200
0
500
1,000
1,500
2,000
2,500
FY12/10 FY12/11(E) FY12/12(E) FY12/13(E)
817
1,950
2,900
1,200
0
600
1,200
1,800
2,400
3,000
FY12/10 FY12/11(E) FY12/12(E) FY12/13(E)
【[en] Career Change Info】 【[en] Career Change Consultant】
【[en] Temporary Placement Info】 【[en] New Career Challenges】
+78.7%
+26.0% +254.7%

-36-
1,123
1,230
1,5201,600
-265
20
100
-363
0
200
400
600
800
1,000
1,200
1,400
1,600
1,800
FY12/10 FY12/11(E) FY12/12(E) FY12/13(E)
-500
-400
-300
-200
-100
0
100
200
300
400
500
Sales
Operating Income
(Million Yen) Midterm business strategyMidterm business strategy
Activities in FY12/11Activities in FY12/11
Strengthening sales of recruitment process products such as tests, recruitment tools, and screening process to improve the rate of successful recruitment of our customers, and thereby aiming at increasing profit
Maintaining close coordination with the Education/Evaluation Business Dept. to enhance workers’ active commitment after joining a company and promoting development and sales of education products for 1st to 3rd year employees
Strengthening sales of recruitment process products to address customers’ full-fledged recruitment activities
Actively carrying out promotion and providing user support by utilizing new tools such as Twitter and Ustream
Cultivating new customers by utilizing successful cases of customers in 12 sites
New Graduate Hiring Business New Graduate Hiring Business

-37-
291 305
610
1,020
-40
130
300
6
0
40
80
120
160
200
240
280
320
360
400
440
480
520
560
600
640
680
720
760
800
840
880
920
960
1,000
1,040
1,080
1,120
1,160
1,200
FY12/10 FY12/11(E) FY12/12(E) FY12/13(E)
-100
-50
0
50
100
150
200
250
300
350
400
Sales
Operating Income
(Million Yen) Midterm business strategyMidterm business strategy
Activities in FY12/11Activities in FY12/11
Strengthening coordination with each department and actively promoting product development to enhance workers’ active commitment after joining a company
Working on existing products in multiple languages to prepare for overseas operations of human resource business
Expanding “En-College” to areas other than the Kanto region
Making utmost efforts to acquire new “En-College” member companies, and reviewing programs to maintain satisfaction rating for courses at a high level
Developing products to immediately make hired new graduates effective workforce in the company in cooperation with the New Graduate Hiring Business
Education/Evaluation Business Education/Evaluation Business

-38-
53190
1,470
2,740
-400
-150
40
-504
0
500
1,000
1,500
2,000
2,500
3,000
FY12/10 FY12/11(E) FY12/12(E) FY12/13(E)
-600
-500
-400
-300
-200
-100
0
100
200
Sales
Operating Income
(Million Yen) Midterm business strategyMidterm business strategy
Activities in FY12/11Activities in FY12/11
Strengthening a system to make [en]Green Wedding and FINE profitable at an early date
Promoting development of a pillar for a new business by actively searching for a new business in areas other than human resources
Making utmost efforts to increase the number of halls posted and improve efficiency of posting for [en]Green Wedding
Explaining merits of introducing FINE at seminars and strengthening activities to win orders
Other BusinessOther Business

-39-
FY12/11
Full year Operating Results
Projections
FY12/11
Full year Operating Results
Projections

-40-
FY12/10(10.Jan-Dec)
FY12/11(11.Jan-Dec)
(million yen) % of sales % YOY change (million yen) % of sales % YOY
change
Net Sales 9,991 100.0% -2.1% 12,570 100.0% 25.8%
Cost of Sales 1,636 16.4% -9.3% 2,118 16.9% 29.5%
Personnel 414 4.1% 10.5% 874 7.0% 111.2%
Other 1,222 12.2% -14.5% 1,243 9.9% 1.8%
Gross Profit 8,354 83.6% -0.6% 10,451 83.1% 25.1%
SGA(Sales,general
&administrative)6,579 65.9% -7.9% 8,451 67.2% 28.4%
Personnel 3,312 33.2% 4.2% 4,696 37.4% 41.8%
Advertising,sales promotion 1,765 17.7% -10.8% 1,944 15.5% 10.1%
Other 1,501 15.0% -24.5% 1,810 14.4% 20.6%
Operating income 1,774 17.8% 40.9% 2,000 15.9% 12.7%
Ordinary income 1,803 18.0% 48.7% 1,924 15.3% 6.8%
Net income 875 8.8% 90.5% 960 7.6% 9.7%
FY12/11 Full year Operating Results Projections –(companywide : Consolidated)FY12/11 Full year Operating Results Projections –(companywide : Consolidated)

-41-
[en] Career Change Info ・・・+¥420mn[en] Career Change Consultant ・・・ー¥ 70mn[en] Temporary Placement Info ・・・ー¥100mn[en] New Career Challenges ・・・+¥370mn[en] Job Info for Students ・・・ー¥ 50mnEducation/Evaluation Business ・・・+¥ 10mnWSA ・・・+¥1.47bnOthers ・・・+¥130mn
¥12.57bn.
¥8.24bn.
¥1.6bn. ¥2.0bn.
FY12/10 Actual FY12/11 Projection
¥10.57bn.
¥9.99bn.
FY12/10 Actual vs. FY12/11 ProjectionFY12/10 Actual vs. FY12/11 Projection
Expenses
Net Sales
Operating Income
Net Sales increase 25.8%YOY to ¥2.57bn.
Expenses increase 28.6%YOY to ¥2.35bn.
Goodwill write-off ・・・+ ¥100mnPersonnel expenses ・・・+ ¥1.84bnAd ,PR expenses ・・・+ ¥170mn
Operating income increase 12.7%YOY to ¥220mn.

-42-
(Million Yen)
FY12/11 Operating Results Projections – (segment)FY12/11 Operating Results Projections – (segment)
FY12/11Projections
% YOYChange
FY12/10% YOYChange
Net Sales 10,840 27.2% 8,522 -0.2%
Operating Income 2,710 2.8% 2,636 46.7%Operating income rate(%) 25.0% 30.9%
660 562
FY12/11Projections
% YOYChange
FY12/10% YOYChange
Net Sales 1,230 9.8% 1,123 -24.5%
Operating Income -265 - -363 -Operating income rate(%) -21.5% -32.4%
91 106
FY12/11Projections
% YOYChange
FY12/10% YOYChange
Net Sales 305 4.1% 291 61.5%
Operating Income -40 - 6 -20.8%Operating income rate(%) -13.1% 2.1%
37 32
FY12/11Projections
% YOYChange
FY12/10% YOYChange
Net Sales 190 3 53 -
Operating Income -400 - -504 -Operating income rate(%) -210.5% -951.4%
27 14
Mid Career Hiring Business
New Graduate Hiring Business
Education/Evaluation Business
Other Buisiness
The Number of Employees
The Number of Employees
The Number of Employees
The Number of Employees

-43-
(Million Yen)
FY12/11 Full year Operating Results Projections – (websites)FY12/11 Full year Operating Results Projections – (websites)
FY12/11Projections
% YOYChange
FY12/10% YOYChange
[en]Career ChangeInfo 4,730 9.8% 4,308 6.0%
[en]Career ChangeConsultant 770 -8.8% 844 -37.3%
[en]TemporaryPlacement Info 1,850 6.0% 1,745 -24.3%[en]New CareerChallenges 1,200 46.9% 817 9.6%
FY12/11Projections
% YOYChange
FY12/10 YOYChange
[en]Job Info forStudents 1,050 4.4% 1,006 -27.9%
Sales
Mid CareerHiring Business
New GraduateHiring Business
Sales

-44-
Return to ShareholdersReturn to Shareholders

-45-
Dividends Projection ¥1,130
Payment Ratio (Projection) 30.1%
FY12/10
Basic Policy regarding Profit Distribution
The Company utilizes retained earnings for future growth and to maximize corporate
value. Our basic policy is to return profits to our shareholders as appropriate,
conducting dividend payouts targeting 30%, depending on fiscal period earnings.
Return to ShareholdersReturn to Shareholders

-46-
(Reference) Non-consolidated financial statements(Reference) Non-consolidated financial statements

-47-
FY12/09(09.Jan-Dec)
FY12/10(10.Jan-Dec)
(million yen) % of sales % YOY change (million yen) % of sales % YOY
change
Net Sales 10,209 100.0% -52.1% 9,276 100.0% -9.1%
Cost of Sales 1,804 17.7% -19.0% 1,513 16.3% -16.1%
Personnel 374 3.7% -53.9% 297 3.2% -20.5%
Other 1,429 14.0% 0.8% 1,215 13.1% -14.9%
Gross Profit 8,404 82.3% -56.0% 7,762 83.7% -7.6%
SGA(Sales,general
&administrative)7,144 70.0% -45.7% 6,120 66.0% -14.3%
Personnel 3,177 31.1% -35.3% 2,959 31.9% -6.9%
Advertising,sales promotion 1,979 19.4% -64.9% 1,761 19.0% -11.0%
Other 1,988 19.5% -23.7% 1,398 15.1% -29.7%
Operating income 1,259 12.3% -78.8% 1,642 17.7% 30.4%
Ordinary income 1,212 11.9% -79.5% 1,676 18.1% 38.2%
Net income 459 4.5% -85.1% 827 8.9% 80.1%
FY12/09 Income Statement (Companywide : Non-Consolidated)FY12/09 Income Statement
(Companywide : Non-Consolidated)

-48-
¥9.78bn.
¥8.94bn.
¥1.25bn. ¥1.54bn.FY12/09 FY12/10
¥8.24bn.
¥10.2bn.
FY12/10 Operating Results Changing Factor(Companywide : Non-Consolidated)FY12/10 Operating Results Changing Factor(Companywide : Non-Consolidated)
Expenses
Net Sales
Operating Income
Net Sales decrease 9.1%YOY to ¥930mn.
Expenses decrease 14.7%YOY to ¥1.31bn.
Operating income increase 30.4%YOY to ¥380mn.
[en] Career Change Info ・・・+¥240mn[en] Career Change Consultant ・・・ー¥500mn[en] Temporary Placement Info ・・・ー¥550mn[en] Part-time Jobs ・・・+¥ 70mn[en] Job Info for Students ・・・ー¥380mnEducation/Evaluation Business ・・・+¥110mnOthers ・・・+¥ 50mn
Rent expenses ・・・- ¥330mnPersonnel expenses ・・・- ¥290mnAd ,PR expenses ・・・- ¥210mn

-49-
[reference] FY12/10 Revised Plan* vs. Actual[reference] FY12/10 Revised Plan* vs. Actual* Nov 10, 2010 announcement
¥9.2bn.
¥7.6bn.
¥1.4bn ¥1.6bn.
¥7.6bn.
¥9.1bn.
Expenses
Net Sales
Operating Income
FY12/10 FY12/10(Revised) (Actual)
Net Sales outperformed revised plans by ¥150mn. (+1.7%)
[en] Career Change Info ・・・+¥130mn
Operating income outperformed revised plans by ¥190mn.(+13.3%)
Expenses almost as planned

-50-
FY12/09(09.Jan-Dec)
FY12/10(10.Jan-Dec)
(million yen) % of sales % YOY change (million yen) % of sales % YOY
change
Net Sales 8,541 100.0% -51.6% 7,808 100.0% -8.6%
Cost of Sales 957 11.2% -32.8% 826 10.6% -13.7%
Gross Profit 7,584 88.8% -53.2% 6,982 89.4% -7.9%
SGA(Sales,general
&administrative)5,786 67.7% -44.1% 4,477 57.3% -22.6%
Personnel 2,462 28.8% -31.2% 2,209 28.3% -10.3%
Advertising,sales promotion 1,780 20.8% -63.4% 1,232 15.8% -30.8%
Other 1,543 18.1% -18.8% 1,035 13.3% -32.9%
Operating income 1,797 21.0% -69.3% 2,504 32.1% 39.4%
FY12/10 Term Income Statement -Mid-Career Hiring BusinessFY12/10 Term Income Statement -Mid-Career Hiring Business
Mid-Career Hiring Business: [en] Career Change Info, [en] Career Change Consultant, [en] Temporary Placement Info, [en] Part-time Jobs, other mid-career hiring related

-51-
FY12/09(09.Jan-Dec)
FY12/10(10.Jan-Dec)
(million yen) % of sales % YOY change
(million yen)
% of sales % YOY change
Net Sales 1,486 100.0% -56.9% 1,123 100.0% -24.5%
Cost of Sales 817 55.0% 10.0% 503 44.8% -38.4%
Gross Profit 669 45.0% -75.3% 619 55.2% -7.5%
SGA(Sales,general
&administrative)1,214 81.7% -51.2% 983 87.5% -19.1%
Personnel 630 42.4% -46.0% 531 47.3% -15.7%
Advertising,sales promotion 197 13.3% -72.4% 196 17.5% -0.4%
Other 386 26.0% -36.2% 254 22.7% -34.1%
Operating income -545 -36.7% - -363 -32.4% -
FY12/10 Term Income Statement -New Graduate Hiring BusinessFY12/10 Term Income Statement -New Graduate Hiring Business
New Graduate Hiring Business: [en] Job Info for Students, other new graduate hiring related

-52-
FY12/09(09.Jan-Dec)
FY12/10(10.Jan-Dec)
(million yen) % of sales % YOY change (million yen) % of sales % YOY
change
Net Sales 180 100.0% -11.7% 291 100.0% 61.5%
Cost of Sales 29 16.4% 28.6% 75 25.9% 155.0%
Gross Profit 151 83.6% -16.8% 216 74.1% 43.1%
SGA(Sales,general
&administrative)143 79.3% 0.9% 210 72.0% 46.6%
Personnel 83 46.4% -6.8% 135 46.3% 60.9%
Advertising,sales promotion 1 0.8% -36.2% 4 1.5% 194.2%
Other 57 32.0% 16.5% 70 24.2% 22.1%
Operating income 7 4.3% -80.5% 6 2.1% -20.8%
FY12/10 Term Income Statement -Education/Evaluation BusinessFY12/10 Term Income Statement -Education/Evaluation Business

-53-
FY12/09(09.Jan-Dec)
FY12/10(10.Jan-Dec)
(million yen) % of sales % YOY change
(million yen)
% of sales % YOY change
Net Sales - - - 53 100.0% -
Cost of Sales - - - 108 204.2% -
Gross Profit - - - -55 -104.2% -
SGA(Sales,general
&administrative)- - - 449 847.2% -
Personnel - - - 83 157.2% -
Advertising,sales promotion - - - 328 618.9% -
Other - - - 37 71.1% -
Operating income - - - -504 -951.4% -
FY12/10 Term Income Statement -Other BusinessFY12/10 Term Income Statement -Other Business
Other Business: [en] Green Wedding , FINE

-54-
AppendixAppendix

-55-
【 Name 】 en-japan inc.
【 Establishment 】 January 14, 2000
【 Representatives 】 Michikatsu Ochi (Chairman) / Takatsugu Suzuki ( President )
【 Headquarters 】 Shinjuku I-land Tower, 6-5-1 Nishi-Shinjuku, Shinjuku-ku, Tokyo
【 Total Stockholder’s Equity 】
JPY 12,115 million (as of end of Dec. 2010)
【Stock Listing 】 Jasdaq
【Fiscal Year 】 January 1 – December 31
【 Number of Employees 】
Consolidated 714, Non-consolidated 617 (as of end of Dec. 2010)
【 Number of Outstanding Shares】 245,838 (as of end of Dec. 2010)
【 Business Description 】
(1) Internet job recruitment service (2) Consultation on recruitment, employee education and personnel evaluation system(3) Sales of personnel systems and personnel outsourcing services(4) Operation of online media offering comprehensive wedding facilities information
OverviewOverview

-56-
[en] Career Change Consultant
[en] Career Change Consultant
[en] Temporary Placement Info
[en] Temporary Placement Info
Planning, proposing, interviewing
and creating job advertisements
Recruitment information
Scouting
Providing recruitment information
ScoutingResume coaching
RegistrationApplication
Job Advertisementfee
Free of charge [en] Job Info for
Students
[en] Job Info for Students
[en] Part-time Jobs
Business ModelBusiness Model
[en] Part-time Jobs
[en] Career Change Info
[en] Career Change Info
< Clients >< Job seekers >
“Person who want to apply to companies
directly”
Internet site
“Person whowant to
register with recruiting
companies”
“Person whowant to
register with temporary dispatch
companies”
Temporary staffing
companies
Job placement agencies
General Companies

-57-
Bu
sin
ess
Our Main Business Contents - Sites We OperateOur Main Business Contents - Sites We Operate
Site Brand Sha-re
Contents Characteristics Users Clients
46%
Site forComprehensiveCareer Change Info
No.2 in industryAll information is provided through our reporting and photographing of each companyStraightforward,detailed Career Change Info from perspective of job seekersAll information has video(only en-japan)
70% are in their 20s-mid-30s70% are maleAll occupations
General Companies
9%
Collective site for job placement agencies
No.1 in industryInformation on job placement agencies and their Career Change Info5-level evaluation of job placement agencies(first in industry)High End Job Corner opened
60% are in their late 26-4080% are male
Job placement agencies
19%
Collective site for temporary staffing companies
No.2 in industryTemporary staffing company information and their Career Change InfoUnique search category “Insistence INDEX”
80% are in their 20s-mid 30s80% are female
Temporary staffing companies
General Part-Time Employment Info Site (2/25 Open!)First Membership Part-Time employment site in the industryCompanies award points based on work performanceMini-bonuses awarded based on points earned
High school studentUniversity studentsPart-timers
contractorTemporary staffing companiesGeneral Companies9
%
Comprehensive Part-time worker Career Change
Site for
Info
Site for part-time jobs that offer the potential to be hired as full-time employees [Goal! Full-time Employee」
#1 site in part-time Career Change Info Volume with unique contentClear merits from potential of full-time employment oppotunites
80% are in their 20s-mid 30s70% are Part-timers and NEETs
General Companies
11%
Site for student employment information
Unique job and company research type-siteLargest Japanese site with largest volume and highest quality of job informationSame characteristics as [en]Career Change Info“Professional Work Research,”a unique service of en-japan
University studentsGraduate studentsJunior college students
General Companies
Mid
-care
er
Hir
ing
Bu
sin
ess
[en] Career Change Consultant
[en] Temporary Placement Info
New
-Gra
du
ate
[en] Job Info for Students
* Sales breakdown are based on FY12/10 data
[en] Career Change Info
[en] Part-time Jobs

-58-
2,640 2,820
560630
630730
414500
0
1,000
2,000
3,000
4,000
5,000
FY12/05 FY12/06 FY12/07 FY12/08 FY12/09 FY12/10
[en]Career Change Info [en]Career Change Consultant
[en]Temporary Placement Info [en]New Career Challenges
The number of registered users (At the end of December, 2010)The number of registered users (At the end of December, 2010)
215 244
0
100
200
300
400
2007 2008 2009 2010 2011 2012
[en]Jon Info for Students
(Thousand)
(Thousand)

-59-
Sales Breakdown by Product (Non-consolidated) Sales Breakdown by Product (Non-consolidated)
[en] Career Change Info
Temporary Placement Jobs
[en] Career Change Consultant
[en] Job Info for Students
education/evaluation business[en] Part-time Jobs
other mid-career hiring related, other new graduate hiring related, new business
4,308 844 1,745 1,006817
291
261
4,066 1,346 2,304 1,396746
180
168
0% 20% 40% 60% 80% 100%
(百万円)
39.8% 13.2% 22.6% 13.7% 7.3%
1.6%
46.5% 9.1% 18.8% 10.9% 8.8%
3.1%
2.8%
1.8%
FY12/10 (10.1-12)
FY12/09 (09.1-12)

-60-
31.4%
15.7%
29.5%
0.0%
5.0%
10.0%
15.0%
20.0%
25.0%
30.0%
35.0%
40.0%
08.1Q 08.2Q 08.3Q 08.4Q 09.1Q 09.2Q 09.3Q 09.4Q 10.1Q 10.2Q 10.3Q 10.4Q
売上高人件費比率 売上高広宣・販促費比率 経常利益率
Labor costs relative sales and Advertising, sales promotion costs (Non-consolidated) Labor costs relative sales and Advertising, sales promotion costs (Non-consolidated)
Labor costs relative to sales Advertising, sales promotion costs relative to sales Ordinary Income rate08.2Q 08.3Q 08.4Q 09.1Q 09.2Q 09.3Q 09.4Q 10.1Q 10.2Q 10.3Q 10.4Q
Ordinary Income (million yen) 1,311 1,039 1,791 186 10 232 782 304 200 342 828
Ordinary Income rate 25.0% 21.1% 32.0% 6.3% 0.5% 10.3% 29.0% 14.4% 9.5% 15.3% 29.5%
Labor costs (million yen) 1,464 1,490 1,414 1,055 920 783 793 786 786 799 884 Labor costs relative to sales 28.0% 30.2% 25.3% 35.6% 40.2% 34.7% 29.4% 37.1% 37.4% 35.6% 31.4%Advertising,sales promotion costs(million yen) 1,479 1,420 1,286 696 470 408 404 336 523 460 441 Advertising, sales promotion costs relative to sales 28.2% 28.8% 23.0% 23.5% 20.6% 18.1% 15.0% 15.9% 24.9% 20.5% 15.7%
-61-
全
社
中途採用事業
新卒採用事業
教育・評価事業
※08.12期は、[en]高校生を含む
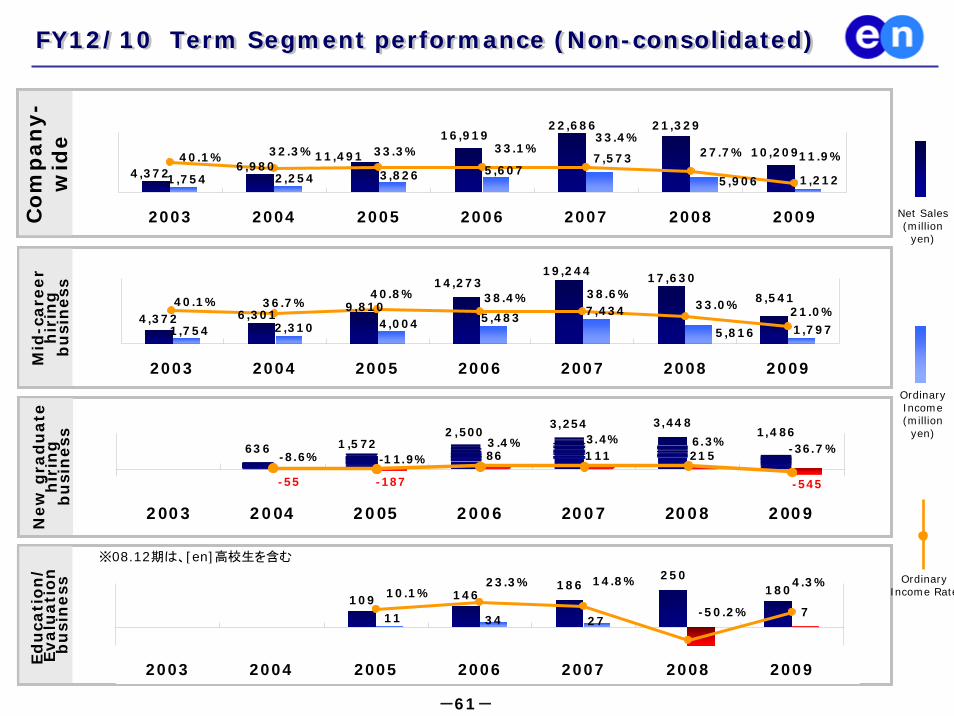
21,329
4,372 6,980
16,919
11,491
22,686
10,209
1,754 2,254 3,826 5,6077,573
5,906 1,212
40.1% 32.3% 33.3% 33.1%33.4%
27.7% 11.9%
2003 2004 2005 2006 2007 2008 2009
4,372
8,5416,301
9,810
14,27319,244 17,630
1,754 2,310 4,004 5,483 7,434
5,816 1,797
40.1% 36.7%40.8% 38.4% 38.6%
33.0% 21.0%
2003 2004 2005 2006 2007 2008 2009
109 146 180250
186
11 347
27
10.1%4.3%
-50.2%
14.8%23.3%
2003 2004 2005 2006 2007 2008 2009
6362,500
3,254 3,4481,486
1,572
-55
111
-187
215
-545
86-8.6%-36.7%6.3%3.4%3.4%
-11.9%
2003 2004 2005 2006 2007 2008 2009
FY12/10 Term Segment performance (Non-consolidated)FY12/10 Term Segment performance (Non-consolidated)C
om
pan
y-
wid
eM
id-c
are
er
hir
ing
b
usi
ness
New
gra
du
ate
h
irin
g
bu
sin
ess
Ed
uca
tio
n/
Evalu
ati
on
b
usi
ness
Net Sales (million
yen)
Ordinary Income (million
yen)
Ordinary Income Rate

-62-
中途採用事業
新卒採用事業
教育・評価事業
※08.12期は、[en]高校生を含む
全
社
5,557
2,6982,2602,286
5,6012,963
4,9325,082 5,2307,237
5,237
7822321,538 1,782 2,618 1,763 1,311 1,039 1,791
186 10
29.0%
0.5%10.3%
30.3% 34.1% 36.2% 31.7% 25.0% 21.1%32.0%
6.3%
07.2Q 07.3Q 07.4Q 08.1Q 08.2Q 08.3Q 08.4Q 09.1Q 09.2Q 09.3Q 09.4Q
4,3384,8394,808 5,298 4,7624,6493,690
2,5192,064
2,040 1,917
505
1,921 2,1331,658 1,875 1,776
1,328 835 479 338 473
24.7%24.8%
16.4%
41.3% 44.4%31.3%
38.7% 37.3%30.6% 22.6% 19.0%
07.2Q 07.3Q 07.4Q 08.1Q 08.2Q 08.3Q 08.4Q 09.1Q 09.2Q 09.3Q 09.4Q
371 407 1891,894
1555356593841,894
380734
-404 -347
963-78
-439 -250
983
-274 -350 -247
327
-108.9% -90.4% -130.7%-225.8%-67.3%52.5%
-46.7%-115.5%-11.8%
50.8% 44.6%
07.2Q 07.3Q 07.4Q 08.1Q 08.2Q 08.3Q 08.4Q 09.1Q 09.2Q 09.3Q 09.4Q
57 466138 44
9558
303967
36
-0.5-4-4-3 -7-27
19
-38
21
-25-33 -1.1%34.4%
-8.7% -9.1%-56.9% -26.3% -66.9% -69.2% -19.4%
28.4%-13.3%
07.2Q 07.3Q 07.4Q 08.1Q 08.2Q 08.3Q 08.4Q 09.1Q 09.2Q 09.3Q 09.4Q
Transition of Quarter Segment Performance(Non-consolidated)Transition of Quarter Segment Performance(Non-consolidated)
Co
mp
an
y-
wid
eM
id-c
are
er
hir
ing
b
usi
ness
New
gra
du
ate
h
irin
g
bu
sin
ess
Ed
uca
tio
n/
Evalu
ati
on
b
usi
ness
Net Sales (million
yen)
Ordinary Income (million
yen)
Ordinary Income Rate

-63-
0.2
0.4
0.6
0.8
1
1.2
2005.1 2.E+03 1.E+01
3.5
4.0
4.5
5.0
5.5
6.0
2005.1 11 9 7 5 3 2010.1 11
0.0
1.0
2.0
3.0
4.0
5.0
6.0
1985 1990 1995 2000 2005 20100.0
0.5
1.0
1.5
(times)(%)
5.1%
20100.52times 0.62times
4.9%
2010.12
2010.12
2010,
Effective Job Offers-to-Applicants Ratio ,Unemployment RateEffective Job Offers-to-Applicants Ratio ,Unemployment Rate
<Latest Unemployment Rate>
<Latest Effective Job Offers-to-Applicants Ratio >
Effective Job Offers-to-Applicants Ratio
Unemployment Rate
•Figures represent average yearly figures
•Source:Health, Labor and Welfare Ministry , Ministry of Public Management, Home Affairs, Posts and Telecommunications Statistics Bureau

-64-
0
10
20
30
40
50
60
4 5 6 7 8 9 10 11 12 1 2 3 4 5 6 7 8 9 10 11 12 1 2 3 4 5 6 7 8 9 10 11 12 1 2 3 4 5 6 7 8 9 10 11 12 1 2 3 4 5 6 7 8 9 10 11 12 1 2 3 4 5 6 7 8 9 10 11 12
2005 2006 2007 2008 2009 2010
有料求人情報誌 + フリーペーパー 求人サイト
YonY -2.3%
YonY +29.8%
Print Media Websites(# in ten thousand)
*Survey of 59 domestic companies
(Prior to March 2007, survey of 64 companies,
Apr 2007 to Mar 2008, survey of 66 companies,
Apr 2008 to Mar 2009, survey of 64 companies,
Apr 2009 to Mar 2010, survey of 62 companies,
Apr 2010 to Sep 2010, survey of 59 companies)
Source: Association of Job Information of Japan “Job Advertisement Numbers” (Dec. 2010)
Job Advertising Market TrendsJob Advertising Market Trends

-65-
■ en-japan inc. IR Corporate Planning DepartmentTEL:03-3342-4506 Mail: [email protected] URL:http://corp.en-japan.com
Cautionary StatementThis material is for informational purpose only. You are fully responsible for the final decision to invest in the company. The
statements included in these documents that are not historical facts are forward-looking statements which reflect management’s current views with respect to certain future events and financial performance of the company. The company makes no guarantee or promise as to the accuracy or completeness of the information provided here and shall not be liable for any errors or delays in
the content, or for any actions taken in reliance thereon. The content is subject to change without notice hereon.