mid day meal scheme
DESCRIPTION
Mid Day Meal Scheme. Ministry of HRD Government of India. MDM-PAB Meeting – Meghalaya on 08.05.2009. 1. Review of Implementation of MDMS in MEGHALAYA (Primary + Upper Primary) (1.4.2008 to 31.12.2008). Part-I. Ministry of HRD, Govt. of India. Appraisal of State’s Performance. 3. - PowerPoint PPT PresentationTRANSCRIPT

11
Mid Day Meal SchemeMinistry of HRD
Government of IndiaMDM-PAB Meeting – Meghalayaon 08.05.2009

2
Review of Implementation of
MDMS in MEGHALAYA(Primary + Upper Primary)
(1.4.2008 to 31.12.2008)
Part-I
Ministry of HRD, Govt. of India

3
Appraisal of State’s Performance
No. PARAMETERS BENCHMARK
1 No of Schools covered under MDM. 100%
2 No of Children covered/availing under MDM. 100%
3 No of Working days MDM served [APR-DEC] 100%4 No of meals served [APR-DEC] 84%
5 Availability of Foodgrains. [APR-DEC] 84%+10%
6 Utilisation of Foodgrains. [APR-DEC] 84%
7 Utilisation of Cooking Cost. [APR-DEC] 84%
8 Utilisation of M.M.E. 75%9 Expenditure on Transportation Assistance. 84%
10 Expenditure for Construction of Kitchen Sheds. 100%11 Procurement of Kitchen Devices. 100%
12 QPRs 03

4
No. of Schools Covered (PY + UP.PY)
10074
2259
7815
10074
2259
7815
0
2000
4000
6000
8000
10000
12000
P rim ary Upper P rim ary T otal (P Y + U P Y )
No. of Ins titutes No. of Ins titutes s erv ing MDM
100% covered
100% covered
100% covered

5
PAB Approval Vs State Performance (No. of children in
Q1+Q2+Q3)
4.00
1.40
2.60
4.00
1.40
2.60
0.00
0.50
1.00
1.50
2.00
2.50
3.00
3.50
4.00
4.50
P rim ary Upper P rim ary T otal (P Y + U P Y )
As per P AB Approv al As per S tate (Ac tuals )
Ministry of HRD, Govt. of India
100% Covered
100% Covered
100% Covered
6
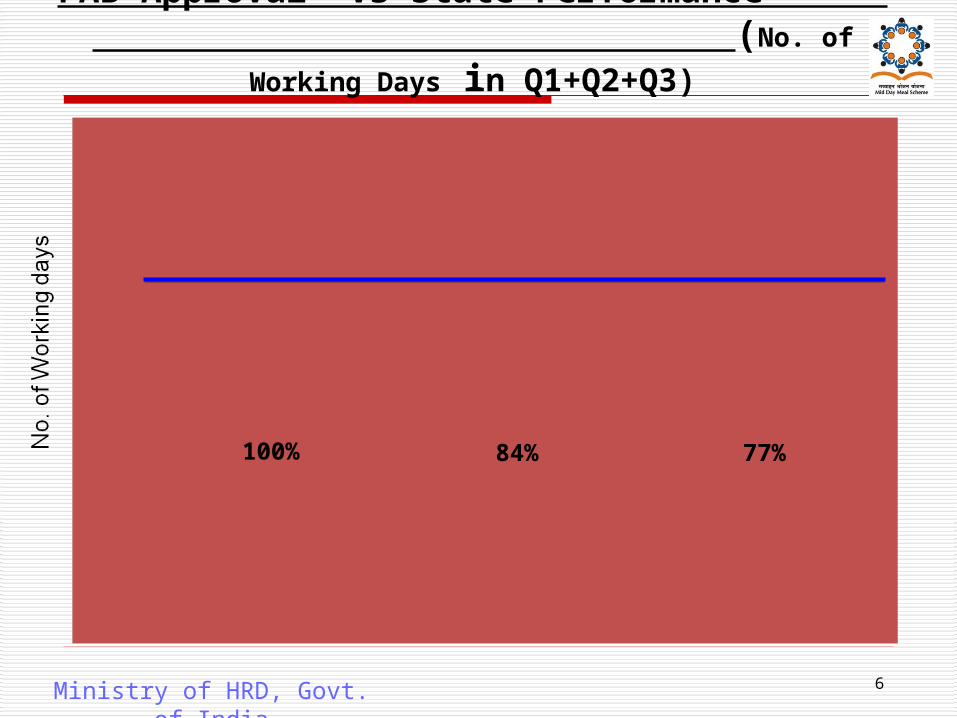
PAB Approval Vs State Performance (No. of Working Days in
Q1+Q2+Q3)
154167
200
0
50
100
150
200
250
P AB Approv al forF Y-2008-09
P AB Approv al forQ1, Q2, Q3
As per S tate(Ac tuals ) Q1, Q2, Q3
Ministry of HRD, Govt. of India
84% 77%100%

7
PAB Approval Vs State Performance
(No. of Meals in Q1+Q2+Q3)
6.166.68
8.00
0.00
1.00
2.00
3.00
4.00
5.00
6.00
7.00
8.00
9.00
As per P AB Approv alfor F Y-2008-09
As per P ABApprov al(Q1+Q2+Q3)
As per S tate(Q1+Q2+Q3)
meals served
meals to be served
100%
Benchmark 84 %
84% 71%

13% of Meals not served district wise( PY + U PY)
Sl. No.
Districts Target as per MDM-PAB
Approval for 08-09 ( In Cr.)
Meals actually served as on 31.12.2008
( Cr.)
Short-servedNo. of meals %
1
(S)Garo Hills 3750486 3121662 -62882417%
2
Jaintia Hills 9956874 8347080 -160979416%
3
(E)Khasi Hills 15664433 13600855 -206357813%
4
(W)Khasi Hills 10525509 9769030 -75647907%

9
Foodgrains Lifting as per GOI data(1.4.08 to 31.12.08)
10631
1022
9398
0
2000
4000
6000
8000
10000
12000
O pening balance(01-04-2008)
Allocation( as perrequirement)/P AB
L ifting B y thestate(Q 1+Q 2+Q 3)
100% 113%
Benchmark (84+10)%
*
*AS PER F.C.I. BILLS

10
Foodgrains Lifting as per AWP&B data (1.4.08 to 31.12.08)
10505
625
11043
0
2000
4000
6000
8000
10000
12000
O pening balance(01-04-2008)
Allocation( as perAWP &B )
L ifting B y thestate(Q 1+Q 2+Q 3)
100%
Ministry of HRD, Govt. of India
95%
Benchmark (84+10)%
11
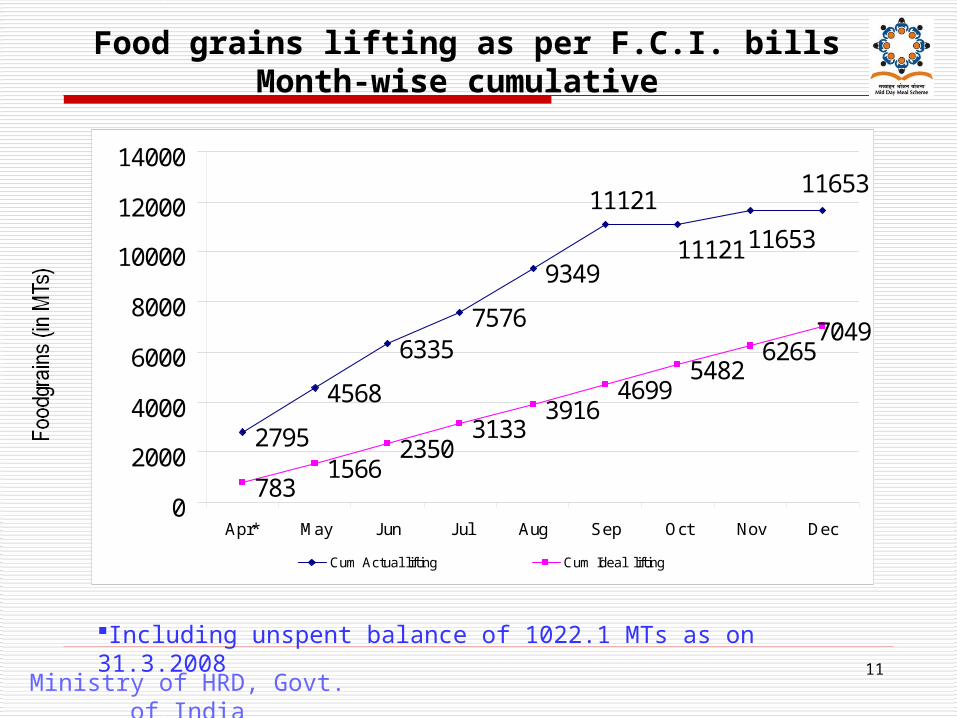
Food grains lifting as per F.C.I. billsMonth-wise cumulative
2795
4568
63357576
9349
7831566
23503133
39164699
54826265
7049
11653
1112111653
11121
0
2000
4000
6000
8000
10000
12000
14000
Apr* May J un J ul Aug S ep Oct Nov D ec
C um Ac tual lifting C um Ideal lifting
Ministry of HRD, Govt. of India
Including unspent balance of 1022.1 MTs as on 31.3.2008

12
Foodgrains Utilisation (Q1+Q2+Q3)
92369398
11653
0
2000
4000
6000
8000
10000
12000
14000
Allocation(P AB , G OIdata)
Availability(as perG OI,OB +L ifted)
Utilis ation(Q1+Q2+Q3)
98%
Ministry of HRD, Govt. of India
100%
Benchmark 84%
124%
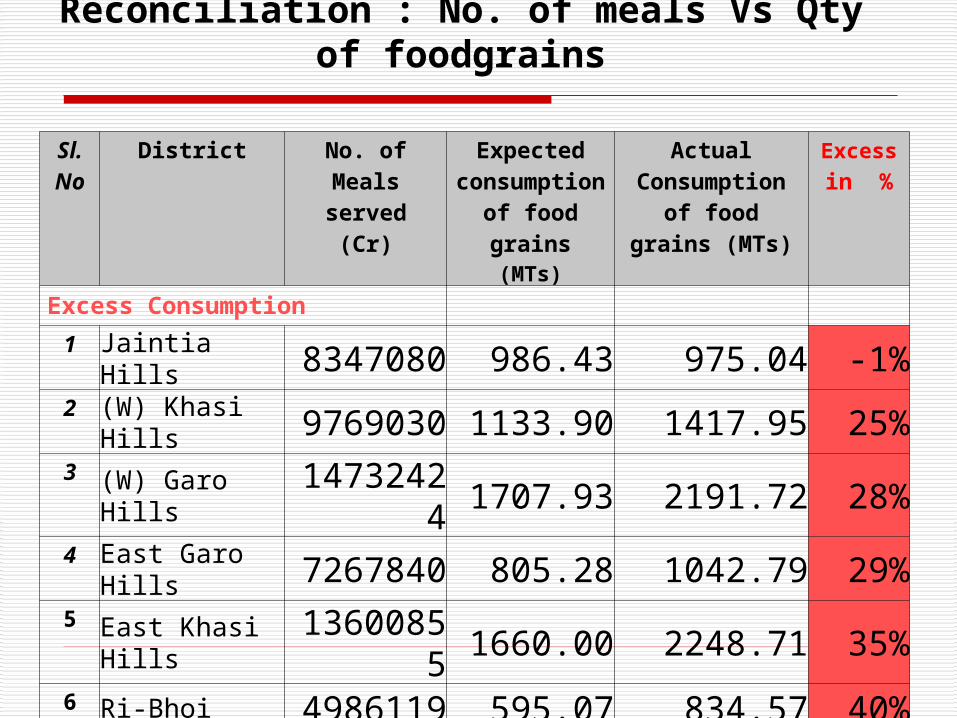
Reconciliation : No. of meals Vs Qty of foodgrains
Sl. No
District No. of Meals served
(Cr)
Expected consumption of
food grains (MTs)
Actual Consumption of
food grains (MTs)
Excess in %
Excess Consumption
1 Jaintia Hills 8347080 986.43 975.04 -1%2 (W) Khasi Hills 9769030 1133.90 1417.95 25%3 (W) Garo Hills 14732424 1707.93 2191.72 28%4 East Garo Hills 7267840 805.28 1042.79 29%5 East Khasi Hills 13600855 1660.00 2248.71 35%6 Ri-Bhoi 4986119 595.07 834.57 40%7 South Garo Hills 3121662 365.45 525.30 44%
Total 61825010 7254.07 9236.08 27%

14
Cooking Cost Utilisation(1.4.2008 to 31.12.2008)
1814.00
2676.77
0.00
500.00
1000.00
1500.00
2000.00
2500.00
3000.00
Allocation(requirement)Utilis ation(Q1+Q2+Q3) Un-utilizedCo
oki
ng
Co
st (
In L
akh
s)
148%
Ministry of HRD, Govt. of India
100%
Benchmark 84%
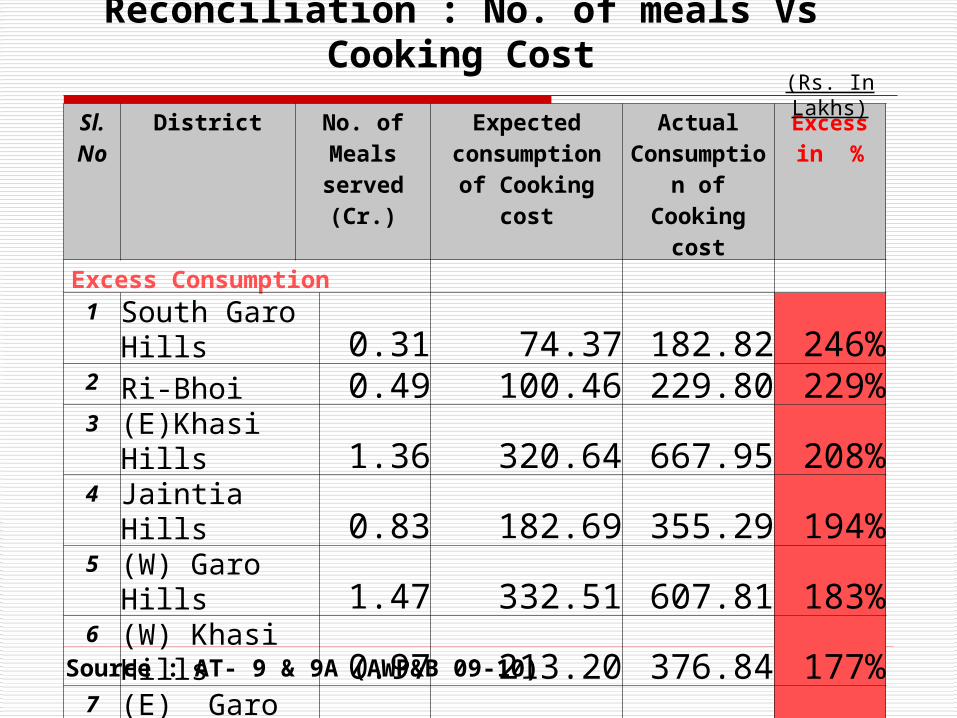
Reconciliation : No. of meals Vs Cooking Cost
Sl. No
District No. of Meals served (Cr.)
Expected consumption of
Cooking cost
Actual Consumption
of Cooking cost
Excess in %
Excess Consumption1 South Garo
Hills 0.31 74.37 182.82 246%2 Ri-Bhoi 0.49 100.46 229.80 229%3 (E)Khasi Hills 1.36 320.64 667.95 208%4 Jaintia Hills 0.83 182.69 355.29 194%5 (W) Garo Hills 1.47 332.51 607.81 183%6 (W) Khasi Hills 0.97 213.20 376.84 177%7 (E) Garo Hills 0.72 161.13 256.26 159%
Total 6.1 1385 2677 193%
(Rs. In Lakhs)
Source : AT- 9 & 9A (AWP&B 09-10)

16
Mismatch of Utilisation-AWP&B 09-10No of meals served, Foodgrains, Cooking Cost
(Q1+Q2+Q3)
98%
148%
71%
0%
20%
40%
60%
80%
100%
120%
140%
160%
1Meals F ood G rains C ooking C ost
Ministry of HRD, Govt. of India
Benchmark 84%

17
Mismatch in Utilisation of Foodgrains and Cooking cost (District-wise)
100%
69%
131%
180%
0%
20%
40%
60%
80%
100%
120%
140%
160%
180%
200%
J aintia Hills S outh G aro Hills
F oodgrains C ooking C ost
Ministry of HRD, Govt. of India
All districts are having over utilisation for cooking cost ranging from 26% to 80%.
62%
80%
Benchmark 84%

18
MME Utilisation (1.4.08 to 31.12.08)
30.94
41.26
10.32
0.00
5.00
10.00
15.00
20.00
25.00
30.00
35.00
40.00
45.00
Allocation E xpenditure Unspent B alance
MM
E (
In L
akh
s)
Ministry of HRD, Govt. of India
100% 25% 75%

19
Transport Assistance Utilisation (1.4.08 to 31.12.08)
117.46 119.55
0.00
20.00
40.00
60.00
80.00
100.00
120.00
140.00
Allocation( as perrequirement)
E xpenditure(Q 1+Q 2+Q 3) Unspent B alance
Tra
nsp
ort
Ass
ista
nce
(In
Lak
hs)
Ministry of HRD, Govt. of India
100% 102%

20
Achievement during 2008-09 (Kitchen Sheds)
2539
1523
2581
4301
P hys ical (units ) F inancial (L akhs)
Allocated Achievement(C )
Ministry of HRD, Govt. of India
59%
59%

21
Achievement during 2008-09 (Kitchen Devices)
150
3007
96
1911
P hys ical (units ) F inancial (L akhs)
Allocated Achievement (C )
Ministry of HRD, Govt. of India
64%
64%
22
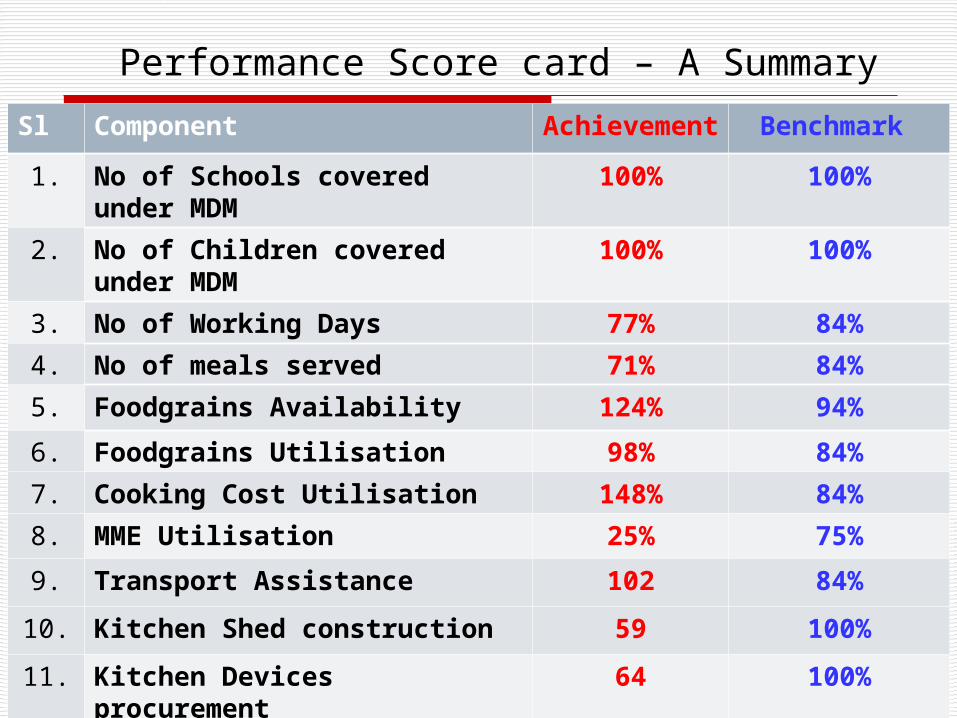
Performance Score card – A Summary
Sl Component Achievement
Benchmark
1. No of Schools covered under MDM
100% 100%
2. No of Children covered under MDM
100% 100%
3. No of Working Days 77% 84%
4. No of meals served 71% 84%
5. Foodgrains Availability 124% 94%
6. Foodgrains Utilisation 98% 84%
7. Cooking Cost Utilisation 148% 84%
8. MME Utilisation 25% 75%
9. Transport Assistance 102 84%
10. Kitchen Shed construction 59 100%
11. Kitchen Devices procurement
64 100%
12. QPRs 02 nos. 3 nos.

23
OBSERVATIONS OF MI
NORTH-EASTERN HILL UNIVERSITY Period -1ST AUGUST 2008 - 31st JANUARY, 2009 DISTRICTS COVERED- RI BHOI & JAINTIA HILLS
1)All schools reported that cooked food is being served to children but not daily, but twice or thrice a week .
Reasons for not serving MDM regularly are:
• Provision of Food grains are inadequate.
• In many Lower Primary School the allotment was only from classes I-IV whereas all of the schools are having Pre-Primary section attached to them also sharing the food with all the children in the school
.
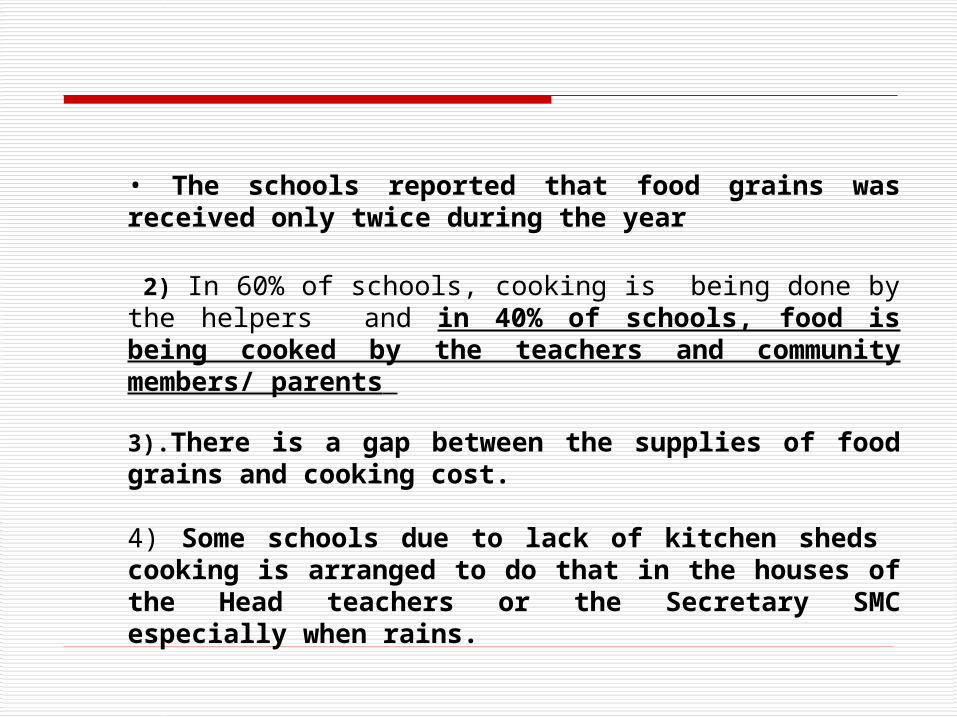
• The schools reported that food grains was received only twice during the year
2) In 60% of schools, cooking is being done by the helpers and in 40% of schools, food is being cooked by the teachers and community members/ parents
3).There is a gap between the supplies of food grains and cooking cost.
4) Some schools due to lack of kitchen sheds cooking is arranged to do that in the houses of the Head teachers or the Secretary SMC especially when rains.
25
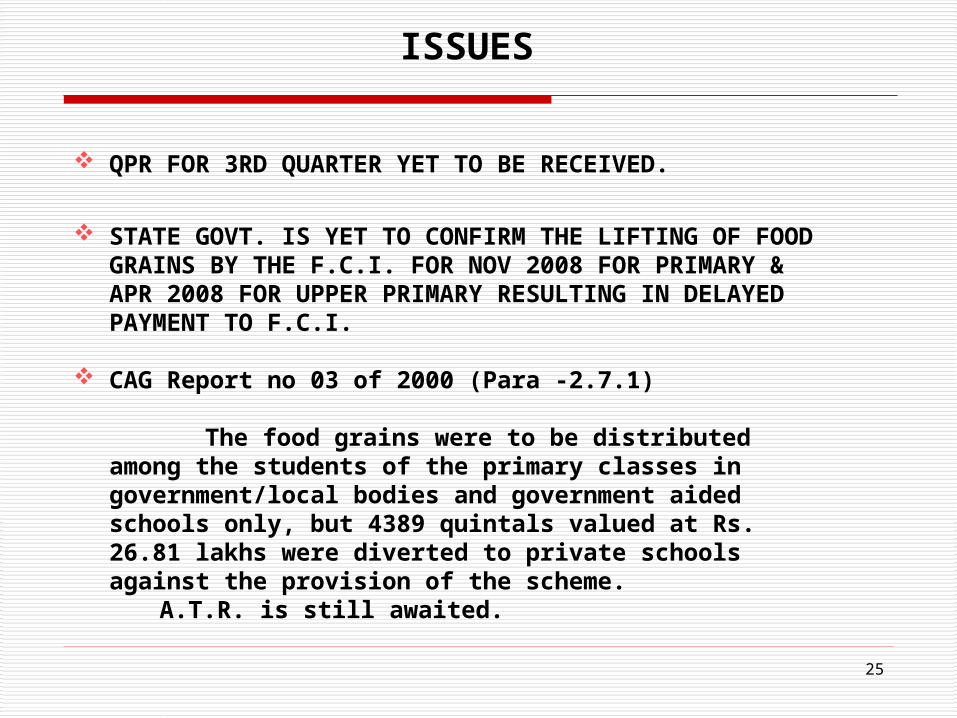
ISSUES
QPR FOR 3RD QUARTER YET TO BE RECEIVED.
STATE GOVT. IS YET TO CONFIRM THE LIFTING OF FOOD GRAINS BY THE F.C.I. FOR NOV 2008 FOR PRIMARY & APR 2008 FOR UPPER PRIMARY RESULTING IN DELAYED PAYMENT TO F.C.I.
CAG Report no 03 of 2000 (Para -2.7.1)
The food grains were to be distributed among the students of the primary classes in government/local bodies and government aided schools only, but 4389 quintals valued at Rs. 26.81 lakhs were diverted to private schools against the provision of the scheme.
A.T.R. is still awaited.

26
Analysis of State’s Proposal
for 2009-10
Ministry of HRD, Govt. of India

27
Time Series
2.60
7.37
6.28
2.60
5.33
2.49
0
1
2
3
4
5
6
7
8
Population MDM Enrolment Availing MDM
2007-08 2008-09
Ministry of HRD, Govt. of India
56%
04%
28%

No of Children (PRIMARY)
2.49
5.33
2.60 2.60
4.87
2.60
Ministry of HRD, Govt. of India
PO
PU
LA
TIO
N
(08
-09)
EN
RO
LM
EN
T (
08-0
9)
AV
AIL
ING
(08-
09)
SS
A (
07-0
8)
P
AB
200
8-09
AV
AIL
ING
MD
M A
S O
N
3
0-0
9-0
8

29
No of Children (UPPER PRIMARY)
1.66
1.42 1.40 1.40
1.03
1.40
Ministry of HRD, Govt. of India
PO
PU
LA
TIO
N
EN
RO
LM
EN
T
AV
AIL
ING
AV
AIL
ING
MD
M A
S O
N
30-
09
-08
SS
A
PA
B 0
8-0
9

30
No. of School days
No Source of Data No of Days
1 DISE/SSA data (07-08) 193
2 DISE/SSA data (08-09) NA
3 MDM approval (08-09) 200
4 Benchmark (Q1+Q2+Q3) 167
5 AVG.Performance(Q1+Q2+Q3) 154
6 State Demand ( 2009-10) 200

31
PAB’s Recommendations (2009-10)
No Details As per State Plan (Table No.16/16-A)
PAB approval for 2008-09
1 Children availing MDM Primary 2,60,116 2,60,116
Upper Primary 1,39,859 1,39,859
TOTAL (B) 3,99,975 3,99,975
2 Working Days Primary 200 200 Upper Primary 200 200

32
Thank You
Ministry of HRD, Govt. of India