microsoft final report: rwanda pilot
TRANSCRIPT

Microsoft
FinalReport:RwandaPilot
GCAP, UK Met Office and Atkins

Global Climate Adaptation Partnership UK Limited OCFI, Suite F7 New Road Oxford, OX1 1BY United Kingdom Point of contact: Paul Watkiss (+44 (0) 797 104 9682) [email protected]
This document is an output from a project funded by the UK Department for International
Development (DFID) and the Netherlands Directorate‐General for International Cooperation (DGIS)
for the benefit of developing countries. However, the views expressed and information contained in
it are not necessarily those of or endorsed by DFID, DGIS or the entities managing the delivery of the
Climate and Development Knowledge Network, which can accept no responsibility or liability for
such views, completeness or accuracy of the information or for any reliance placed on them

FCFA Rwanda Pilot Study: Summary
The Rwanda FCFA case study was undertaken by the Global Climate Adaptation Partnerships (GCAP),
working with the UK Met Office and Atkins. The case study undertook four major activities:
1. A literature review was undertaken to frame the context for adaptation applications. This identified
relevant decisions and support methods, particularly for medium to long‐term decisions.
2. A country background and policy assessment was undertaken to understand the adaptation context
in Rwanda. This included analysis of development plans, the DFID office portfolio, current
vulnerability, future climate projections, key future climate risks, and existing climate change /
adaptation activities.
3. An initial country visit was undertaken and a large number of bi‐lateral interviews (25) were held
with key stakeholders, to understand the decision context and end‐use applications for existing and
potential adaptation activities, and to explore the current/future use of climate information.
4. A number of practical and policy relevant medium‐long term adaptation case studies were selected
and assessed in detail, considering the problem area, decision processes, current use of climate
information, and the opportunities for medium‐ to long‐term policy making. New CMIP5 climate
projection information (focusing on relevant case study metrics) was developed, and a review of
climate‐hydrological information needs was made. The case studies were discussed in a second
country visit / interviews.
1. Literature Review
The literature review identified a number of key issues for framing the FCFA Rwanda pilot study.
For practical adaptation, there is a shift away from impact‐assessment (science‐first) to adaptation
assessment (policy‐first), implemented through mainstreaming. This involves a greater focus on
adaptation as the primary driver, and more understanding of the decision and policy context. As a
result, a detailed country assessment was undertaken to inform the case study.
There is recognition that adaptation involves a series of complementary actions, which address
current climate variability as well as future climate change. Three broad types of adaptation
decisions were identified: a) current decisions for addressing the existing adaptation deficit, i.e.
current climate variability; b) current decisions with long life‐times (e.g. mainstreaming/risk
screening for infrastructure, sector policy); and c) future decisions for future climate challenges. The
pilot focused on the medium‐long‐term, i.e. types b and c, to align to FCFA programme objectives.
The literature (e.g. IPCC AR5) recommends the use of iterative climate risk management for
adaptation, with decision making under uncertainty. These approaches have different climate
information needs to conventional decision support. The consideration of uncertainty, the potential
use of these new approaches, and the capacity/time/resource needed to apply them, were
considered in the case studies.
2. Country, Policy, Decision and End‐User Context Assessment
Rwanda is a small, land‐locked and mountainous country in East Africa (the ‘land of a thousand hills’).
The country is one of the most densely populated countries in Africa. The country context is summarised
below:
Development policy. The country has a long‐term Vision (2020), for achieving middle income status
with agricultural transformation, and a medium term plan (Economic Development and Poverty

Reduction Strategy, EDPRS), currently in phase II (2013‐ 2018). There are also sector development
plans and district development plans that flow from, and align with, the EDPRSII.
Climate policy. Rwanda has one of the most advanced climate policy frameworks in Africa. It
published a National Strategy for Climate Change and Low Carbon Development in 2011, and has an
operational climate fund (FONERWA). It is mainstreaming climate change into the EDPRSII, and into
sector and district development plans and climate resilience/mitigation indicators explicitly in the
budget.
Current vulnerability. Rwanda has a complex existing climate, with wide variations across the
country and with very strong seasonality. The country has relatively high current vulnerability to
climate variability and natural hazards, and is particularly affected by floods and landslides, though
also periodic droughts, and is affected by El Niño – Southern Oscillation (ENSO) events.
Projections of climate change. Projections of climate change in Rwanda are hampered by the high
heterogeneity (terrain, climate) and the lack of long‐term meteorological data. There are
observations of increasing temperature, but changes in precipitation are more uncertain, though
there are some indications of increasing variability. The CMIP3 climate change projections indicate
average temperature will increase, and higher average annual rainfall (under most models), with the
intensity / frequency of heavy rainfall extremes also increasing, but highly uncertain signals for dry
periods/drought.
Future climate change risks. The information base on the impacts/risks of future climate change is
low. Changes in rainfall variability and increases in flood/landslide/soil erosion risk are perceived as
the greatest risk, though increases in drought are also frequently cited (affecting agriculture and
hydro). There have been some studies indicating changes to vector‐borne disease (health), as well as
changes to rainfall regimes and water supply, availability and demand.
3. End‐User Discussion Output and Initial Findings
A country visit was undertaken in June. The aim was to identify and explore potential end‐use
applications, including a mix of policy applications/themes that covered strategic policy, sector
development mainstreaming, climate risk screening, and project appraisal, across a range of sectors. A
series of bi‐lateral interviews were held with Rwanda Environmental Management Authority (REMA);
Rwanda Meteorological Agency; Ministry of Agriculture (MINIAGRI); Ministry of Infrastructure; Ministry
of Natural Resources; Ministry of Disaster Management and Refugee Affairs; Ministry of Local
Development; DFID office staff; other development partners (World Bank, KfW, European Union, UNDP,
GIZ, GGGi) and other organisations including World Food Programme, Access to Finance Rwanda
(agricultural insurance) and FEWSNET. For each of the interviews, the current decision context and the
use of climate information was discussed, along with future risks and adaptation plans, then the future
end‐use decisions and the use/need for climate information was explored using the FCFA pilot questions.
To complement these interviews, the relevant documents for each end‐use application were reviewed to
provide complementary information on the decision context, adaptation, and the existing use of climate
information. The analysis identified a number of practical and relevant end‐user applications and
decision contexts for adaptation, including:
Mainstreaming of climate change into DFID office programmes;
Business case development in DFID ICF projects;
National climate change action plans (National Adaptation Plan development);
National climate change project appraisal (e.g. applications (to the Climate Fund);
Mainstreaming of climate change into national sector development plans (five year plans), as well as
master plans and long‐term strategy;
Infrastructure climate risk screening and appraisal;
4. Detailed Case Study Analysis
The study then focused in on a number of specific adaptation applications:
• The mainstreaming of climate change in the Social Protection programme (VuP);
• Project appraisal of adaptation projects, as part of FONERWA climate fund;
• Climate risk screening of infrastructure focusing on hydro‐electricity plants;
• Resilience mainstreaming into agricultural development plans;
• Green growth/resilience urbanisation plans.
The individual decision context for each is discussed below.
Social Protection (VuP). Rwanda has an existing social protection programme, the Vision 2020
Umurenge Programme [VUP]), which provides cash transfers and public works, as well as access to
finance. The programme prioritises extremely poor households, but does not target based on natural
hazard risk. However, the public works have a strong focus on natural hazard vulnerability reduction, with
terracing and small irrigation. While social protection is a form of adaptation, and builds the resilience of
vulnerable groups to future climate change, there is also the potential for climate change to impact on
the programme itself. Increases in variability and extremes from climate change (see later) could reduce
the effectiveness of the programme or increase the number of people who fall back into poverty due to
more frequent shocks. There is also an issue of whether public works (infrastructure) will be resilient to
future climate. Finally, there is a question of whether short‐term social protection might maintain
livelihoods in areas that will become unsustainable in the long‐term (e.g. locking in development to
extremely high risk areas under climate change). (Noting that as part of the field visits, the team went to
a site where the Government has recently relocated some communities in an area of very high current
climate hazard risk (landslides)).
This case study identified relevant entry points and then reviewed the existing and potential use of
climate information. The decision contexts were the mainstreaming of climate change into the
Government social protection programme, and the DFID support to the programme and office risk
screening (i.e. in the DFID project and business case cycle). The review found that the Social Protection
Strategy (2013‐2017) already has a mainstreaming objective, i.e. for improved sector response to climate‐
related risks, and an ambition to ensure the programme is climate proofed to minimise risks associated
with climate change. However, this objective has not been implemented through into an action plan, and
there has been no use of climate information as yet. In the DFID context, an earlier DFID Rwanda office
climate risk screening (in 2011) identified the need to investigate the risks of climate change on the
programme. However, this was omitted in the recent business case for the programme (i.e. the
recommendation was not implemented), with only the climate benefits of the programme included. The
latter assessment used qualitative climate information, based on secondary sources. The assessment also
considered potential adaptation options, and how these could be considered in a framework of
uncertainty, identifying a risk management approach, e.g. early low‐regret options and learning through
risk mapping, enhanced monitoring.
Hydro‐electricity risk screening (climate resilience/climate proofing). One of the major areas where
medium‐long‐term climate information is potentially important is in the resilience of infrastructure. A
case study on hydro‐electricity was chosen, due to the high capital costs, the high vulnerability to climate
change and the long life‐times. This focused on proposals for new hydro‐power developments. The key
risks are around changes in river flows (average / low flow) on generation output, as well as the risks of
peak (high) flows causing damage (and soil erosion and siltation). The main decision context is climate
risk screening, centred in sector entry points of strategic environment assessment (energy policy) and
environmental impact assessment (individual project/plant appraisal). The main need for end‐use
information is hydrological.

The risks of climate change on hydro are already recognised in the Energy Sector Strategic Plan and
National Energy Policy Plan [NEPP] (draft 2014) and there is a policy objective for integrating expected
rainfall and hydrological shifts into the planning, design, construction, and operations of Rwanda’s
hydroelectric power facilities and a statement that risk screening is needed for new developments. The
draft energy sector SEA identified the risks of climate change on hydro‐power, but did not include
quantitative climate information. A review of one EIA for a relatively large hydro power plant (Rukarara
II) found that analysis of climate risks had been omitted, though an earlier EIA of another plant (Rusumo
Falls) had included climate change projections and sampled uncertainty using two models. Discussion
with a design/engineering team working on the Rusumo project (currently) revealed that they were
including climate change projections to scope out the potential risk, and had even built in some over‐
design to cope with future changes (e.g. adding a 5% margin).
Further analysis revealed a much more complex decision architecture, and climate risk screening was
found not be relevant for all hydro‐plants. The key difference identified was between small (micro) and
large hydro, due to the lifetime, i.e. most small plants have an intended payback period of 5 to 10 years,
so it makes little economic sense to increase costs with over‐design. For larger plants, there are also
differences in risks for storage and run‐of‐river plants. A further issue arose over the risks from climate
change. The previous projections for Rwanda indicate an increase in average rainfall, along with
increasing extreme events, thus the risks are minor and can be accounted for by extra contingency in
design. However, for countries where there are risks of lower average or more extreme low flows,
climate change could be more important and would need different responses. Interestingly, the more
recent projections for Rwanda indicate a stronger pattern of dry spells, which would mean the current
climate risk screening is missing a major risk (and highlights the issues with changing climate information
over time). It was also noted that in many cases, considering climate risks in the EIA is probably the
wrong entry point, both in terms of the timing (coming too late to lead to major changes) and the wrong
actors (environmental experts not engineers). Finally, there were some interesting issues that emerged
over the public:private split in the sector. It is far more difficult to encourage the use of climate
information – and resilience – into the private sector for 5 to 40 year decisions. This arises because this
time‐scale is beyond the economic lifetime (e.g. Bank of Rwanda interest rates are usually 18%), and
discussion with Government highlighted they had much less leverage over the private sector for
encouraging risk planning over longer time‐frames.
A review was undertaken to identify potential adaptation options. There is more potential for adaptation
decision making under uncertainty, with sensitivity (range, agreement) as well as techniques such as
robust decision making and real options. However, in practice, even sensitivity testing is likely to only be
justified for large plants. Moreover, most of these assessments are made by engineers in hydrological
assessments, and this leads to a number of issues. First, the high resources needed to sample lots of
climate information in coupled hydrological models. Second, the barriers to using more complex
approaches (the tendency is for simple testing of central and worst case examples with probability‐based
engineering approaches).
FONERWA (adaptation project appraisal). In 2012, the Government of Rwanda established an
Environment and Climate Change Fund – FONERWA – a national basket fund through which climate
change finance is channelled, programmed, disbursed and monitored. The Fund is organised around four
thematic windows: conservation & sustainable management of natural resources; renewable energy,
R&D and technology transfer and implementation; environment & climate change mainstreaming; and
environmental Impact Assessment monitoring & enforcement. The FUND is being dispersed (initially)
through a project application process, from line ministries, Government agencies, Districts, civil society
organisations (CSOs) and the private sector. Three rounds of applications have been made and projects
are already operational. As this is a cross‐cutting fund, there are a large number of possible climate
change risks, though analysis of the existing applications indicates a high focus towards current climate

variability and extremes (e.g. rainfall variability, landslides, soil erosion and water availability/droughts)
and in turn, a focus on low‐regret adaptation options. In the context of medium‐long term decisions,
there are, however, issues about how climate extremes may change, and the fund is moving towards
sector mainstreaming (and the financing of the incremental costs of sector action) which will involve
longer‐term issues. The key decision context is on the appraisal process for adaptation projects, and the
inclusion of climate change information into project fund applications and the cost‐benefit analysis that
they are evaluated against. The pilot reviewed the use of climate information in project applications and
discussed with the management team. From a quantitative/analytical perspective, climate information
was identified as one of the most prominent gaps, with only one or two projects making a direct link to
climate related events with formal analysis, and most projects making only broad reference to climate
hazards with no grounding in meteorological records or modelling analysis (i.e. without a strong
analytical base). There were also only qualitative linkages to future climate change risks.
Agricultural mainstreaming (sector investment plans). Agriculture accounted for 33% of GDP in
Rwanda in 2013, generated 70% of export revenues and employed 80% of the population. Agricultural
development and transformation is a key part of the national development plan, and Rwanda is currently
launching a third phase of the Strategic Plan for the Transformation of Agriculture (PSTA), which is
accompanied by an Agriculture Sector Investment Plan (ASIP). There are many potential risks from
climate change for the agricultural sector, especially given the high levels of rain‐fed agriculture, starting
from the impact of current climate variability through to major long‐term changes (e.g. agro‐ecological
shifts), which could affect major export earnings, notably for coffee and tea, as these are climate
sensitive and have longer cycles than cereal crops. There are also issue of infrastructure centred on
irrigation and rural roads. There is a priority to mainstream climate change into existing sector plans in
Rwanda, and some early work is already underway. The Government sector development plan (PSTA III)
recognises the issue, and includes proposals for mainstreaming climate change, and a sub programme in
the ASIP, which outlines rural feeder roads need to be constructed to withstand extreme rainfall and
floods. Climate change is expected to generate more extreme events, including increased temperatures
producing droughts and high rainfall producing floods and landslides. It is therefore vital to plan for
adaptation measures to address the expected impact of climate change.
However, there has been no use of quantitative climate or impacts information. Moreover, the longer
term risks (e.g. agro‐ecological zones) are not included in the documents, and the consideration of the
impacts on irrigation are focused on the development and production benefits, with no consideration of
climate risks. Interestingly, the agriculture sector working group has commissioned a tool to allow
MINAGRI planners to evaluate the impact of programme spending decisions on the ability to adjust to
climate change (along with other environmental aspects) and the impact of those programme decisions
on climate change, which will be applied to the ASIP (sector sub programmes) to mitigate potential risks.
The current early draft of the tool includes climate projections from the World Bank climate portal.
Discussion with the team developing the tool found that these projections provided relatively simple and
understandable projections, noting the need to present succinct messages on future climate change to
policy makers (e.g.in Ministries), and that the tool at least has some consideration of uncertainty
(through 10% (low), 50% and 90% (high) ensemble information). However, they considered there was
insufficient information to interpret the information provided by the portal, or to fully understand the
caveats associated them, and that there was no historical information on extreme rainfall and dry spells,
which made interpretation difficult.
A review was undertaken to identify potential adaptation options, and consideration of these in decision
making under uncertainty. The short‐term focus is on addressing the current adaptation deficit, i.e.
current climate variability. The review also highlighted important issues around medium term issues, in
relation to the cross‐sectoral nature of responses, i.e. between agriculture and water, and the issues
around information harmonisation, socio‐institutional issues and responsibility. It also found an example
where meteorological information was being developed in two different institutions (the met office and

also the ministry of agriculture), exacerbating harmonisation issues. A potential case of mal‐adaptation
was identified in the road sector. Finally, some long‐term risks, especially agro‐ecological shifts for key
export crops, the potential for iterative risk management were identified and these could be addressed
with iterative programmes and monitoring for agro‐meteorological information and bio‐physical
parameters, noting the importance of possible temperature thresholds level for key crops such as coffee.
Urban/Land‐use planning. The final case study was focused on an emerging initiative to develop green
/resilient cities (Kigali and secondary cities). This recognises the high carbon emissions of urban areas and
the potential for locking‐in higher emissions (e.g. low density development) but also the potential
impacts of climate change. For the latter, the main risks in Rwanda are around urban flooding (riverine
and flash floods) and landslides, rather than increasing cooling degree days and energy demand. The
decision context is related to understanding future hazard risks (risk mapping) and building adaptation
through resilience (siting, infrastructure risk screening, low cost resilience building). The key climate
information needs relate to changes in extremes events and future hazard information (e.g. hazard
maps), leading to risk screening and some resilience building (with analysis of uncertainty).
Climate projections
Analysis of the case studies above revealed a very broad range of climate information needs, ranging
from average trends to changes in extremes. This finding is in itself important, i.e. it highlights that a
broad suite of metrics are important when planning adaptation, noting this contrasts with the existing
information base which is largely reported as annual average trends in temperature and precipitation.
There was also a much greater need for information on the current climate as well as future projections,
i.e. to help understand the current baseline (observed) as well as observational information on changing
trends. As part of the pilot study, an update of the climate information from CMIP 5 (IPCC AR5) for
Rwanda was undertaken by the UK Met Office. This focused on the relevant metrics of interest for the
various case studies. This included much more focus on hydrological (e.g. extreme rainfall) and agro‐
meteorological (e.g. dry spells, temperature thresholds) parameters. Examples are included below.
Frequency of the heaviest 5% of daily rainfall
events
Number of days in Kigali over 30°C
One issue that did emerge is that the new CMIP5/IPCC 5th AR data indicated slightly different results to
existing data (to the existing GCM, RCM and downscaled CSAG data). The CMIP3 information generally
shows increases in average rainfall. The new information indicates higher confidence in heavy rainfall
extremes (with high model agreement), little change in average rainfall, and some indication of increases
in drought relevant metrics (e.g. 5 day dry spells during the rainy season). While this change is subtle, it
has major influence on adaptation responses for the sectors considered, and highlights a key challenge,
perhaps re‐enforcing the need for more iterative approaches to reduce the chances of mal‐adaptation.

Hydrological information
For each of the case studies, a detailed analysis was made of the hydrological information needed by
Atkins, and the relevant outputs needed from the climate projections. An example is shown below for
water resource. This highlighted the importance of down‐stream data needs, and climate‐hydrological
linkages for end‐users.
Sensitivity End user
requirements
Processing Climate data requirements Non‐climate requirements
Historical Future Historical Future
Rainfall
including inter‐
annual
variability;
evaporation
(temperature).
Source yield
(average and
dry year)
Drought
frequency
Dry year
demand
Drought
monitoring and
management
Hydrological
modelling: rainfall‐
runoff; recharge;
groundwater
Resource
modelling
Demand
forecasting
(Supply‐demand
balance)
Long‐term daily
to monthly
rainfall
Variables for
calculation of PET
and open water
evaporation (for
large lakes)
Multiple
projections
of future
change in
monthly
rainfall and
PET/temp.;
change in
inter‐annual
variability*
Demand:
domestic,
industrial,
agricultural
Population
growth;
change in
industrial
demand;
cropping
changes
5. Findings and Recommendations
The initial interviews and analysis revealed a number of interesting findings. These are set out below.
Decision Processes: Understanding the broader socio‐political and institutional context
What types of development decisions are currently being made that have medium and/or long‐lived
implications (i.e. greater than 5 years)? Who are the key agents of change and what are the wider political
economy factors driving long‐term policy formation, plans and investments?
Rwanda has a large number of existing (real) adaptation end‐user applications in place, covering the
different building blocks for different adaptation decisions, i.e. current decisions, current decisions
(infrastructure) with long life‐times, and future long‐term risks. These include a wide range of decision
contexts related to policy appraisal and strategy, project appraisal, climate risk screening (e.g.
infrastructure), mainstreaming (in sector development plans, master plans, urban plans). These cover
different aggregation levels (national to local) and involve a broad range of sectors and risks, as well as a
large number of different actors (Government, development partners and civil society). This leads to a
high variation in decision context, e.g. decisions in the energy sector are made differently to the
agricultural sector and involve very different types of stakeholders. They also have different framing (e.g.
whether they adopt a strong economic framework or not) and have different existing guidance and
methods for appraisal. This leads to a very large and varied decision context for each specific ‘end‐use’
application. As examples, DFID business case cycle guidance, FONERWA project application guidelines,
REMA guidance on climate mainstreaming, national sector development plans, environmental impact
assessment guidance. An important finding is that the organisational context influences the decision
making approach and consideration of adaptation – and that this leads to different information needs.
A key conclusion is that there are a very large number of potential decision contexts and users, with
different objectives and baseline contexts and this leads to a very large and varied decision context and
different information needs, i.e. it depends.
The agricultural example also highlighted that even at a sector level, for a defined context (agricultural
mainstreaming) there are multiple decisions (for different risks over different time‐scales), which means
that multiple sets of climate information is needed. Furthermore, mainstreaming involves cross‐sectoral
responses, involving different actors (e.g. Ministries), and these cross‐sectoral responses require complex
sets of climate information, and in policy terms, are much harder to implement as they involve trade‐offs

with other objectives. As an example, to advance agricultural mainstreaming there are short, medium
and long term adaptation decisions, with strong interactions to land‐use planning, integrated water
management, environment, forestry, economic development and the planning commission. This makes
it much more difficult to advance harmonised adaptation. As an example, while the agricultural
investment plan outlined the need for climate mainstreaming, it did not pay particular attention to
irrigation, and the national water resources master plan – which extends out to 2040 – has not
considered climate change, thus this has not been included in the irrigation plan. This highlights that even
if capacity is strong in one particular area, there is a need for similar co‐ordinated capacity across all areas
to allow an integrated response.
Looking at the wider political economy factors, it is highlighted that the strong adoption of climate
change (and early adaptation) in Rwanda has been driven by the presence of a high level champion (the
President), a high level strategy (the low carbon, climate resilience strategy) and the recognition and
inclusion of climate change as a key cross‐cutting issue in national economic development planning (and
subsequently sector plans), thus there is a strong push from senior (powerful) Ministries. There is also an
emerging lever for implementation and M&E through the inclusion of mainstreaming indicators in the
budget circular. The push for adaptation has included strong institutional individuals (in the Environment
area) but also collaboration with key Ministries (Finance). The emergence of real climate finance (the
capitalisation of the national climate fund) has also been important in demonstrating the opportunities,
though this has required strong governance. However, even in Rwanda, climate change is often seen as
part of the environmental agenda, rather than as part of the development or planning agenda. As
examples, climate change is often considered as part of SEA or EIA, or combined with other
environmental aspects as a cross cutting theme. This is an important barrier to implementation, as
environmental issues are generally owned by weaker institutions, or have less influence, rather than as a
core development issue.
Use of science in decision making: science‐decision making interface,
What kinds of climate science outputs are available to decision makers who influence policy making: from what
sources and in what formats? How is climate science used (if at all) to inform decisions on long‐lived
timescales? How do decisions on long lived timescales inform the generation of climate‐related research
agendas? To what extent does the capacity to generate and/or interpret relevant climate information exist in‐
country? What are the pathways for the flow of climate information between vulnerable communities,
decision‐makers, and scientists?
The study reviewed each of the end‐use applications (interviews and documents), to see how they had
considered climate information (science) in the appraisal and decision making context. In nearly all cases,
the climate information used in the decision process was extremely basic, usually included as central,
qualitative narratives of future climate change, e.g. users highlighted that climate change would lead to
future increases in floods and droughts, and used this as the justification for adaptation. There was little
consideration of even alternative scenarios (e.g. an A1B vs B1/2), let alone quantitative model
information. This is partly due to capacity issues, but also because most projects focus on immediate
adaptation (vulnerability reduction).
In some important areas, it was also found that end‐use applications were ignoring climate change
information because they did not know how to incorporate it. As an example, the potential impact of
future climate change on the country’s social protection programme had not been included ‐ either in the
DFID office business case or the Government mainstreaming analysis. In the DFID office case, this was a
particular omission, as this issue had been highlighted as a risk in the climate risk screening of the DFID
office programme. This indicates there are barriers (capacity, time, information and support) which
prevent such analysis. Similarly, while the Ministry of Natural Resources had undertaken integrated water
resource management modelling out to 2040, they had not included climate change in their demand‐
supply projections, because they did not know how to.
There are a number of other explicit and implicit reasons for the low levels of climate information uptake
for adaptation. Most end‐users were taking information from a wide range of diverse sources (e.g.
previous studies, second national communication, etc.) rather than directly using climate modelling
information results. Most of these secondary sources are more accessible and can be easily summarised
to fit project appraisal forms, but they often include only basic information themselves. Furthermore, it
is clear there are major capacity gaps in the understanding of climate information and how to apply this
in end‐use applications, noting that in many cases climate change may be secondary to the primary
objectives, and thus climate change is one of a number of cross‐cutting issues to consider.
Where people were using climate information, there was an issue of which sources they used. The case
studies found people were sampling from very different areas, e.g. google searches, previous studies. In
one example (agriculture), information from the World Bank climate portal was taken, as this presented
relatively simple figures on key climate trends. However, the interviewee highlighted that there was
insufficient information to interpret this information, or to understand the caveats with it, and further
commented there was a lack of historical information for key metrics (e.g. extreme rainfall). This raises a
problem of harmonisation and whether up‐to‐date information is being used, but also the broader
question of who should have the mandate for providing information. The interviewees also identified it
was very challenging to present succinct messages on future climate change to policy makers, in
Ministries, i.e. the communication of complex information is difficult, especially when trying to trade‐off
the need for simple messages with the consideration of uncertainty. This highlights the need to help
support communication of climate information and uncertainty.
A key finding was the need for the interpretation of climate change information into local contexts, e.g.
with local expertise, along with observational information and sector context (i.e. to know what maters).
In most cases there was a poor understanding of current risks (noting the gaps in observational data for
many key metrics). This made it very difficult to understand future projections, as there was insufficient
information to ground the projected changes in current issues. This highlights the need for enhanced
current information and local expertise to ground this in key sector context.
One strong finding that came through in all the interviews was the lack of capacity and time/resources
among key staff to include detailed analysis of climate change in the decision/project cycle. This was
particularly the case when climate change was secondary to the primary decision (e.g. in sector
development plans, infrastructure) but was even true for dedicated adaptation projects.
A strong finding was that with one exception (hydro‐electricity), there was no consideration of
uncertainty in end‐user assessments. This was found to be the case even when users were using
information sources that included uncertainty analysis, i.e. they were actively ignoring uncertainty and
using central messages (re‐interpreting primary studies). As an example, a common theme in interviews
and documents was that climate change will increase droughts, even though the original sources cited
highlighted that future drought patterns were unclear. There was also little consideration of the
qualitative range of future trends, let alone the quantitative analysis. Interestingly it was found that any
positive effects of climate change (e.g. potential yield increases for agriculture) were ignored, i.e. end‐
users focused on pessimistic future outcomes for climate change.
When questioned why uncertainty was omitted, even relatively sophisticated end‐users highlighted
time/resource and capacity constraints, and stressed that including uncertainty was too complex.
Importantly they highlighted that uncertainty detracted from the central message (i.e. in the case for
action, or in communicating the need for early action to a non‐climate audience). This implies that end‐
users tend to use climate information opportunistically, e.g. when the project or programme is looking to

build a case for positive action in reducing climate risks with adaptation, the downside risks are
highlighted, however, the risks of climate change on the intervention (or uncertainty that might call into
question the need for the intervention) are ignored. This highlights a problem that highlighting
uncertainty weakens the case for action and the chance of a project/action get funded/approved. This is
an important socio‐institutional barrier. It was also found that the existing processes and guidelines
(whether the climate fund, SEA or EIA, business cases) do not mandate/encourage the analysis of
uncertainty, thus it is not surprising it is ignored.
The interviews and analysis also found that most users were primarily concerned with changes in
variability and extremes rather than average trends, whereas most of the current climate information for
Rwanda is focused on average trends (noting it is relatively easy to source future average changes, but
almost impossible to source changes in extremes). Indeed, in most cases they were most interested in
changes in bio‐physical metrics, risks or impacts of future climate change, as this is what was important
for adaptation decisions. As examples, they were interested in more complex metrics (e.g. End of the
season (EOS) WRSI (Water Requirements Satisfaction Index) for drought risks, or hazard information
(flood risk) rather than primary climate information. The assessment of climate change on these areas is
largely missing in Rwanda. This highlights that the success of updated scientific climate modelling
information needs to be progressed alongside relevant end‐user metrics (e.g. agro‐meteorological,
hydro‐meteorological, natural hazard information/maps) [though without going back to a science‐first
impact assessment driven approach].
Problem area: Clarifying the specific sector challenge/problem area
What is the sector challenge/problem identified? How sensitive is the sector challenge to medium‐term climate
change? What are the capabilities and limitations of climate science in overcoming the sector
challenge/problem: (how can climate science help)? What is the status of knowledge on medium‐ to long‐term
climate change relevant to this challenge? How could climate science be better integrated into decision‐making
processes to make policy and planning more robust to future climate? What are the implications for
adaptation? How would better communication and understanding of available climate information (and
uncertainty) affect the design of the policy/programme?
While all of the case studies potentially include aspects of relevance to the 5 – 40 year timescale of
interest to FCFA, the main area of activity (quite correctly) was found to be on early action to address the
existing adaptation deficit, focusing on capacity building and no‐ and low‐regret actions, e.g. enhancing
meteorological services, terracing (climate smart agriculture), rain water harvesting, and disaster risk
management. This makes sense, as it provides a more immediate focus provides the opportunity for no‐
and low‐regret actions, which will generate immediate economic benefits (see below). Indeed, the issue
of discounting future benefits was found to be a critical barrier to medium to long‐term adaptation.
As an example, for hydro‐electric schemes, the medium‐long‐term aspects were found to be much lower
for micro‐hydro, because the payback time for these plants is very short (e.g. 10 years). While there is
more potential for consideration in major schemes (>50MW) ‐ even here there is a trade‐off due to the
strong impacts of discounting in reducing future benefits (e.g. increasing the capital costs of a scheme
today versus discounted benefits in 2030 onwards). These future benefits will be towards the end of the
economic lifetime of the scheme (though they are well within the technical lifetime) and are also
hampered by the future uncertainty involved. The finding in this case was that it may be worth some
simple low or zero cost overdesign, where there is greater confidence in the changes, but this can be
achieved through sensitivity testing, rather than detailed analysis. The consideration of more complex
decision making under uncertainty (e.g. ROA or RDM) is not really justified or likely to be realistic [though
exceptions might be super‐large schemes, or where there are dramatic projections in rainfall reductions].
It also highlights that considering the medium to longer‐term is predominantly a public sector issue – and
due to the rate of return normally expected by private investors, it will be largely irrelevant for the
private sector.
It was also noted that in many cases, there are broader sector objectives or other trade‐offs that are
more important in the short‐term than climate change, or there maybe limits to the political capital
available to introduce climate change, i.e. it is not be top of the list of problems. As an example,
discussion with the DFID VuP (social protection) programme revealed that although climate change was
recognised as an issue, there was other more pressing issues to address first, to ensure the programme
was effective (and delivering), i.e. while climate change might be an issue, there is a limit to what can be
done at once, and there are other priorities for using the available scarce political capital for change
This does raise the question of whether the medium to long‐term time‐frame is relevant at all in
developing countries. The main conclusion is that it is, but for a relatively small number of cases only, and
the pilot study has revealed fewer applications that than originally anticipated by the team. The question
then arises of what these should be. From the economic perspective, where there is the opportunity to
implement low or no‐regret options that give immediate benefits, but also longer‐term benefits, then it is
rationale to invest in early adaptation. Similarly, it makes sense if there is the potential for zero cost or
very low cost increments to early development (e.g. low cost over‐design to build in some flexibility or
robustness). finally, it also applies where there is some opportunity to take low cost early analysis to
improve future decisions (e.g. learning).
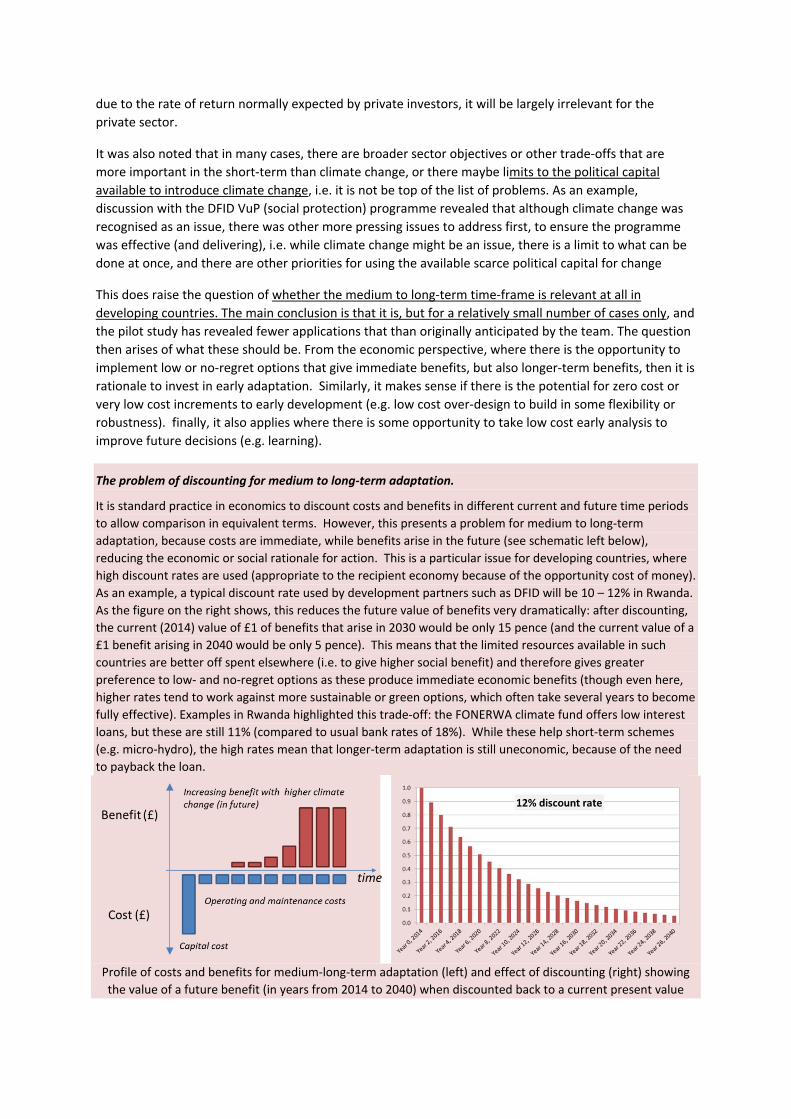
The problem of discounting for medium to long‐term adaptation.
It is standard practice in economics to discount costs and benefits in different current and future time periods
to allow comparison in equivalent terms. However, this presents a problem for medium to long‐term
adaptation, because costs are immediate, while benefits arise in the future (see schematic left below),
reducing the economic or social rationale for action. This is a particular issue for developing countries, where
high discount rates are used (appropriate to the recipient economy because of the opportunity cost of money).
As an example, a typical discount rate used by development partners such as DFID will be 10 – 12% in Rwanda.
As the figure on the right shows, this reduces the future value of benefits very dramatically: after discounting,
the current (2014) value of £1 of benefits that arise in 2030 would be only 15 pence (and the current value of a
£1 benefit arising in 2040 would be only 5 pence). This means that the limited resources available in such
countries are better off spent elsewhere (i.e. to give higher social benefit) and therefore gives greater
preference to low‐ and no‐regret options as these produce immediate economic benefits (though even here,
higher rates tend to work against more sustainable or green options, which often take several years to become
fully effective). Examples in Rwanda highlighted this trade‐off: the FONERWA climate fund offers low interest
loans, but these are still 11% (compared to usual bank rates of 18%). While these help short‐term schemes
(e.g. micro‐hydro), the high rates mean that longer‐term adaptation is still uneconomic, because of the need
to payback the loan.
Profile of costs and benefits for medium‐long‐term adaptation (left) and effect of discounting (right) showing
the value of a future benefit (in years from 2014 to 2040) when discounted back to a current present value
There is also the potential for early action from a precautionary perspective where there are very large
risks (either high annual level, exceedance of thresholds, or large‐scale or irreversible major effects)
and/or where a lack of short‐term action could lock in this future (systemic) damage. This could arise for
land‐use planning/siting issues, especially around coastal (not relevant in Rwanda) or major floods.
Overall, of the five case studies, the potential for medium‐long term adaptation was considered most
important for urban land‐use planning for the secondary city plans. However, this was also found to be
one of the most challenging applications, due to the dominant objectives of economic development, and
also the trade‐off with the opportunity costs of land‐use change in urban areas (e.g. the costs of buffer
zone, set‐back zones, exclusion zones in a country with limited land available).
Moreover, the analysis did identify the potential risk of mal‐adaptation by focusing on the medium‐long
term. This can arise from economic mal‐adaptation (rather than other forms of mal‐adaptation such as
shifting vulnerability). One such example was identified. This involved a commitment to climate proof
rural feeder roads in the agricultural development strategy (as part of the climate change mainstreaming
actions) to future climate change. It was not possible to find out exactly what this commitment involved,
but future proofing roads with short‐lifetimes to long‐term changes would imply a high cost penalty,
which would reduce the coverage of the rural road programme (this is already an issue: the proposed
rural road standards were considered excessive by development partners ‐ who fund the rural feeder
road programme ‐ as the available funds and higher design standards results in a smaller number of
wider roads). It is noted that siting roads to avoid current high risk areas is sensible, and it may be cost‐
effective to ensure some degree of current resilience (noting this will have a cost penalty) or allowing
some flexibility for later upgrades. However, any early moves for future proofing to long‐term (mid‐
century) are likely to be highly mal‐adaptive, especially given the short lifetime of these roads.
Finally, an additional issue that emerged was over the importance of adaptation windows or intervention
points, i.e. the opportunities when decisions could be influenced. As an example, for agricultural
development policy, there are only a few windows to raise the major resilience issues in sector
development, and if these are missed, only minor changes are possible. Similarly, considering climate
change in hydro‐plant EIA is really too late, thus there is a need for input at the overall energy policy
development (for strategic decisions, such as which river catchments to develop) or during the
engineering design phase (when developing the scheme).
Opportunities in supporting uptake of climate science within the sector challenge/problem
What tools and processes can be used to bring science generators and science users together for more
effective and meaningful dialogue? How can the pathways for two‐way information flow between scientists
and policy‐makers be optimised? What steps can be taken to make climate science more actionable? How can
climate science support more effective design and delivery of development policy, planning and
implementation (up to the point of financeable projects) and vice versa? What are the key barriers to the
uptake of climate services in this sector challenge/problem, and development planning in‐country more
broadly?
Looking forward, there was a very positive response for the development of additional climate
information, but interviewees did not specifically know what information would be most useful, i.e. to
help them in assessing climate change adaptation/resilience.
As an example, discussion with the FONERWA management team identified a key issue around the use of
harmonised information, and guidance on which information sources to use, noting this needs to be in a
form that applicants can access and understand. In terms of future information, the management team
reported that improved information on a) current climate variability and b) future climate change would
be useful. The issue of how to consider uncertainty, given the low levels of climate expertise among most
applicants, was also raised. The need for sector and sub‐national level information and knowledge
products (for climate information and services) was highlighted as a future need. The availability of this
information to potential project applicants (public and private) would potentially enhance applicants’
understanding of linkages between resilience and development activities, and inform more evidence‐
based applications/investment.
Across all the case study, it was also clear that the consideration of uncertainty was problematic. Based
on the interviews with end‐users, it is clear that more complex approaches will not be not appropriate for
most cases (e.g. robust decision making or real option analysis), with the possible exception of very large
projects funded by development partners, where the DPs can undertake such an analysis. More
realistically, simple sensitivity testing is perhaps the easiest application of uncertainty (e.g. with a central
and worst case scenario), noting that even here the application of qualitative (simple) robustness or
options principles (as recommended in the DFID topic guidance on uncertainty) is likely to be too
challenging (or time consuming) for most end‐user interviewed as these still require knowledge that is
beyond non‐climate specialists.
One important aspect that did emerge is that the development of iterative plans for the longer‐term will
require additional information sources on key risk indicators, i.e. enhanced monitoring. The end‐users
interviewed were not aware of the literature on iterative risk management and were not even able to
identify the key indicators of concern (i.e. what to measure, why it would be useful to generate
information for future decisions), and in some cases, not even aware of the long‐term risks (e.g. the risks
of climate change on coffee production were not even mentioned in the agricultural mainstreaming
analysis, nor the increase in temperatures on higher cooling demand in sector development/master plans
for energy). This highlights a potential need to identify key indicators for long‐term change, then
investing in regional programmes to help compile and monitor this information.
Looking across the pilot, the following observations on future needs was made.
An obvious priority is for more comprehensive downscaled multi‐model climate model projections,
combined with strengthening the capacity of local meteorological organisations. Furthermore, there is
an obvious priority to support meteorological, agro‐meteorological and hydro‐meteorological
information, capacity and co‐ordination/communication. With respect to the latter, in Rwanda there are
also major gaps in the historic data sets, especially across the geographical range of the country – which
is important given the high climate heterogeneity. This is also likely to be an issue for most countries,
thus there is a need to enhance these historic data sets, e.g. through the use of satellite information, to
build up more comprehensive information.
In general, end‐users were much more interested in the next 10 – 20 years than the typical time‐slices
produced from climate models (i.e. 2041‐2070). It is recognised that in these early years the climate
change signal is lost in the noise of variability, but information on changing trends and some indicative
analysis on how current conditions might change in the near future would be highly relevant to end‐
users, alongside enhanced information on historic baselines .
As highlighted above, the interviews and analysis also found that many users are primarily concerned in
changes in variability and extremes rather than average trends. This indicates that should be more
attention on these aspects than average trends (noting the greater complexity and uncertainty) and also
tailored outputs for these – and other relevant sector metrics – could be a more routine output of
modelling results. Even information on what we know, and what we don’t know on these metrics is
useful (e.g. it was extremely useful to know that for Rwanda, there is high confidence in increasing
extreme precipitation, even if there is lower confidence in the change in drought related indicators). End‐
users were also more interested in agro‐meteorological and hydro‐meteorological information, and bio‐
physical and vulnerability indicators. This raises a question of whether to include additional scientific
analysis alongside advances in climate modelling, i.e. in hydrological modelling, extreme value analysis,

etc. This includes a focus on key thresholds, e.g. related to impact categories, which can also provide a
strong link to existing hazard or vulnerability maps.
While downscaled climate information and enhanced capacity is a major gap, the case study identified
that a critical gap for end‐use application was around the science‐practice interface, i.e. on the
translation of complex climate information to a form that is usable by end‐users. A focus on new climate
modelling and science alone is therefore unlikely to advance the use of climate information in
adaptation/resilience. To address this requires boundary organisation activities, e.g. similar to the role of
UKCIP in the UK, to translate primary climate information into adaptation‐ready information, to provide
information and guidance to users (e.g. through communities of practice, good practice, training, etc.).
There are difficult issues in developing these activities at the continental or regional scale (because
context is critical) but the potential for helping to bridge the science‐practice gap will be critical to
advancing climate information use in adaptation, and is thus a priority area of focus.
It is also clear that different end‐users are currently using a diversity of (inconsistent) climate information
sources. They are primarily relying on secondary data sources (e.g. national communications) and they
are often over‐simplifying the information available, focusing on qualitative narratives, and ignoring
uncertainty. This highlights the need for consistent and standardised climate projections, which include a
range of outputs that match the capacity of different end‐users, i.e. multi‐modal/scenario outputs, but
also more simple messages on key changes and uncertainty that can be easily understood. Again a good
example is the UK Met Office – UKCIP projections. It is recognised that the development of common
projections are challenging, but in the absence of such information there is currently high inconsistency.
It is also stressed that the capacity in many individual countries (such as Rwanda) is not sufficient to
provide these standardised scenarios and messaging, so there is a potential role in helping to enhance
local capacity to build standardised scenarios and a suite of climate information products reflecting
different end‐user capacity (at the country/regional level), linked to the boundary roles identified above.
In addition to the primary climate information, it is clear from the Rwanda case study that end‐users
need guidance on how to apply climate information in end‐use applications, i.e. to incorporate climate in
decision contexts, whether this is for quantitative analysis (e.g. linking to water modelling) or more
generally (in guidance for mainstreaming). This could be advanced with good practice case studies, as
well as guidance. In general, the end‐users interviewed in the Rwanda case study were extremely keen
to learn about practical case studies in other countries.
In terms of medium‐long‐term decisions, a number of lessons emerged of relevance.
Clearly multi‐model information that allows consideration of uncertainty, i.e. downscaled multi‐model
ensembles, will be needed, but a critical factor will be on presenting the uncertainty information in a
usable form that aligns to the use in decision making, i.e. with simple ranges, envelopes of possible
change (for temperature and precipitation), discussion of the agreement of models, and possibly analysis
of robustness. A key issue is that it would be useful if the climate modelling community could produce
these, i.e. in terms of range, envelopes and robustness, rather than leaving this step to end‐users, who do
not have the capacity/time to do this. There is thus a need for uncertainty information (regional or
country) that presents information in usable formats. This moves beyond the production of regional
modelling runs to the interpretation of outputs, e.g. recommending which models provide a suitable
spread in a particular country (e.g. across temperature and precipitation). It is recognised that this will be
difficult, but such outputs would provide higher value added for end‐users.
Where multi‐model information is produced, it is critical to move away from the current tradition of
running lots of models for one scenario (e.g. A1B or RCP4.5) and instead ensure that multiple scenarios
and multiple models are equally covered (e.g. ensembles for RCP2.6 and 8.5). This leads on to a critical
issue: most climate model uncertainty is projected for a single RCP at a time. However, for adaptation,

there is a need to sample across all futures (i.e. all RCPs) and all climate models to address the question
of what the envelope of future change includes. While it is recognised this is extremely difficult, it is
critical for the analysis of adaptation for end‐users ‐ otherwise they will just use a central scenario.
Alongside this uncertainty information, there will be a need for guidance/support on how to consider
uncertainty in decisions, with good practice and guidance. A key focus will be on a set of different
methods for different applications and end‐users (the latter reflecting capacity). While some users may
be able to use detailed uncertainty analysis, in most cases simple approaches (sensitivity, traffic light
systems, etc.) will be more appropriate. Perhaps more importantly, three will a need to ensure that
climate information outputs are tailored to align with these different decision support tools. This will
require climate information to be produced with uncertainty methods in mind (e.g. as above, to provide
range/spread, advice on what models to use to consider robustness, etc.).
There will also be a need to work on socio‐institutional aspects, e.g. to address the barriers on why
people ignore uncertainty. This involves difficult issues (e.g. helping people understand that uncertainty
need not reduce the justification for their business case or adaptation proposal application, trying to
include uncertainty guidance in SEA, business cases, etc.). The challenge of this should not be
underestimated, especially due to the increasing focus on target driven outcome indicators and value for
money. There are also critical issue over the need to identify adaptation intervention points, i.e. on when
to use the information to influence decision making.
Finally, in relation to longer‐term challenges, and iterative risk management, there is a potential
opportunity for identifying potential key indicators of major future climate change, then investing in
programmes to help compile and monitor this information, e.g. using satellite observations to track key
agro‐meteorological changes, or satellite/local site information to provide reports of regional sea level
rise, etc. It is highlighted that many of these indicators are common to many countries, even if they vary
by sector. This could also extend to more bio‐physical indicators, e.g. pest and disease monitoring, agro‐
ecological zones shifts. While there is still a need to understand these in the local context, a focus on the
key metrics of concern would be extremely useful in advancing longer–term decision perspectives.

Introduction
The Rwanda FCFA case study was undertaken by the Global Climate Adaptation Partnerships (GCAP),
working with the UK Met Office and Atkins. The case study undertook four major activities:
1. A literature review was undertaken to frame the context for adaptation applications. This
identified relevant decisions and support methods, particularly for medium to long‐term decisions.
2. A country background and policy assessment was undertaken to understand the adaptation
context in Rwanda. This included analysis of development plans, the DFID office portfolio, current
vulnerability, future climate projections, key future climate risks, and existing climate change /
adaptation activities.
3. An initial country visit was undertaken and a large number of bi‐lateral interviews (25) were
held with key stakeholders, to understand the decision context and end‐use applications for existing
and potential adaptation activities, and to explore the current/future use of climate information.
4. A number of practical and policy relevant medium‐long term adaptation case studies were
selected and assessed in detail, considering the problem area, decision processes, current use of
climate information, and the opportunities for medium‐ to long‐term policy making. New CMIP5
climate projection information (focusing on relevant case study metrics) was developed, and a
review of climate‐hydrological information needs was made. The case studies were discussed in a
second country visit / interviews.
These are presented in the following chapters.

Part 1: Background to Adaptation Decisions
The case study first undertook a review of the context for adaptation decisions, and the use of
climate information. This drew on recent work for DFID on Early Value‐for‐Money Adaptation:
Delivering VfM Adaptation using Iterative Frameworks and Low‐Regret Options. The review
identified a number of key elements. These issues – and their relevance for the FCFA case study –
are discussed briefly below.
Adaptation Assessment and Policy First Approaches
A number of approaches have been used to consider climate change, which can be broadly split into
impact, vulnerability and adaptation studies (Carter et al, 2007).
Impact assessment studies generally adopt a sequential approach, starting with climate model and
socio‐economic projections, and then assessing impacts. The analysis then goes on to consider the
potential adaptation options (and sometimes costs and benefits) in reducing these future damages.
These approaches apply a predict‐then‐optimize approach (if‐then) assuming perfect foresight – i.e.
normally an individual scenario is assessed and the adaptation response is identified and costed
(Watkiss and Hunt, 2011), and such studies typically focus on technical adaptation options (e.g. dikes
for coastal protection, irrigation for agriculture).
These impact‐assessment methods use a science first approach (Dessai and Hulme, 2007:Ranger et
al, 2010: Wilby and Dessai, 2010). Such an approach is typically deterministic; beginning with climate
change projections and ending with a wide range of impacts that are used to frame adaptation
options ‐ uncertainty is compounded at each stage of the analysis and is never fully characterised.
Climate models (and information) therefore frame the overall process. This has led to a supply
driven process where climate modellers produce outputs, which is fed to impact modellers/experts,
and then finally to adaptation decision makers, who have to make use of the available information
provided.
A large body of theoretical and practical literature (e.g. Füssel and Klein, 2006: UNFCCC, 2009) have
identified that these impact‐assessment based approaches are useful for raising awareness, but
concluded they are not useful for practical adaptation. This is because such studies have:
Insufficient consideration of more pressing immediate and short term policy issues;
Insufficient consideration of wider (non‐climatic) drivers;
Insufficient knowledge of future climate conditions(and the dynamic nature of climate
change) on the scale relevant for adaptation decisions;
Insufficient consideration of the full diversity of adaptation options in most climate impact
models;
Insufficient consideration of the factors determining the adaptation process itself, including
adaptive capacity;
Insufficient consideration of uncertainty;
Insufficient consideration of the key actors and of the policy context for adaptation.

As a result, there is now a greater focus towards adaptation assessments for practical adaptation.
These assessments have a greater focus on the processes of adaptation and practical actions. They
also tend to have a greater bottom‐up focus.
The broad set of steps in an adaptation assessment have been identified, and summarised in
guidance such as the PROVIA and Mediation projects1. These outline a broad policy cycle for
adaptation, summarised around five steps.
i) identifying vulnerability and impacts;
ii) identifying adaptation measures;
iii) appraising adaptation options;
iv) planning and implementing adaptation; and
v) monitoring and evaluation.
The Adaptation Policy Cycle: Source Hinkel and Bisaro, 2013.
In the practical context, the application of these frameworks also move away from a science‐first
approach to a policy‐first approach, which starts with adaptation and the grounds analysis in the
decision and policy problem (Dessai and Hulme, 2007:Ranger et al, 2010: Wilby and Dessai, 2010):
the policy first approach may begin with a suite of adaptation options that may be socially,
economically and technically feasible, then evaluate their performance using quantitative sensitivity
testing or narrative scenarios. It may also begin (Watkiss and Hunt, 2012) with a more policy
orientated analysis that grounds analysis in existing sector objectives and contexts.
The move towards adaptation assessment and more policy orientated analysis involves a change in
the focus and the role of climate services and climate model information. Such studies still require
information from climate models, vulnerability or impact assessment, but adaptation plays a much
more central role in the objectives and analysis. Indeed, these studies are focused around the
1 Programme of Research on Climate Change Vulnerability, Impacts and Adaptation (PROVIA) is a global initiative which
aims to provide direction and coherence at the international level for research on vulnerability, impacts and adaptation (VIA). http://www.unep.org/provia/ Provia was supported by the Mediation Project (Methodology for Effective Decision‐making on Impacts and AdaptaTION). This project provided scientific and technical information about climate change impacts, vulnerability and adaptation options, including the adaptation learning cycle, methods, decision support and information. http://mediation‐project.eu/

identification and implementation of real adaptation, within the context of existing policy and
development, and have a much immediate time focus. Therefore, while climate services and models
still have a critical role, their input needs to be in a form that matches the policy problem and
decision method, i.e. to help inform specific adaptation decisions.
ImplicationfortheFCFAcasestudy
The review findings above highlighted that the FCFA case study in Rwanda should be based around
practical adaptation assessment methods, and adopt a policy first approach, grounded in the
decision context of adaptation decisions in real organisations.
The implications of this are a strong need to understand the policy context and process of decision
making in the case study. This was advanced with a detailed country and policy context review for
the case study (section 2).
Dynamic Climate Change and Iterative Adaptive Management
In moving towards adaptation policy and appraisal, for advancing adaptation (i.e. for the here and
now) a number of pressing key concerns have emerged that are changing the framing of adaptation
(Watkiss and Hunt, 2011: Watkiss et al, 2014).
First, climate model projections and impact‐driven studies have typically focused on the longer‐term
future, as the rate of temperature change increases and major climate shifts emerge. Indeed, most
climate change modelling has focused on the middle of the century (2050s) and beyond, because
this is the time period when a clear climate change signal emerges, relative to the noise of
underlying variability. As impacts arise in the future, e.g. towards 2050 or beyond, the benefits of
adaptation also arise (predominantly) in this time period. This means that the costs of early
adaptation action (today) are high when compared to future discounted benefits. It also means that
the information provided does not align with short‐term decisions, i.e. where to focus ‘early’
adaptation, e.g. over the next decade or so. Furthermore, in this context, it is important to balance
resource allocations for adaptation against other policy areas.
For practical adaptation, there is also more focus on the mainstreaming of adaptation into general
national and sectoral policy. This generally has a relatively short‐time frame, e.g. a future 5 ‐ 10 year
policy window for policy implementation (e.g. 5 year development plans), or to align adaptation with
development Vision time‐scales to 2025‐2030.
In response, climate change is now viewed as a more dynamic process, which starts with current
climate variability and the existing adaptation deficit (broadly defined as the failure to adapt
adequately to existing climate risks) and then considers future climate change over longer time‐
periods. Addressing this current adaptation deficit provides immediate economic and livelihood
benefits and also enhances resilience to future climate change. It is also recognised that adaptation
(to future climate change) will be less effective if current adaptation deficits have not been
addressed (Burton, 2004).
Second, there is recognition that adaptation involves a set of responses, addressing different
problems, and moves beyond a technical response (adaptation as a process). This includes activities
such as addressing current climate variability, a focus on building adaptive capacity, the need to
mainstream (integrate) climate change into policy, and the issues with preparing for and tackling
longer‐term challenges (McGray et al, 2007: Klein and Persson, 2008), as shown in the figure. This
also implies different actions associated with building resilience in existing activities (e.g.

mainstreaming or risk screening) as well as specifically targeted options to address climate
challenges.
Finally, previous impact‐assessment driven studies largely ignore the issue of uncertainty2, which
represents the key methodological challenge for adaptation (UNFCCC, 2009; Hallegatte, 2009; Wilby
and Dessai, 2010). As there is high uncertainty over future impacts, this affects the future benefits
of adaptation. An early adaptation response has the potential to waste resources by over‐investing
against risks that do not emerge, or implementing measures that are insufficient to cope with more
extreme outcomes. This can also lead to the risks of lock‐in and stranded assets.
The main focus has been on the uncertainty associated with future climate projections. These arise
for two key reasons. First, future greenhouse gas emissions – and thus the level of climate change
that will occur over time ‐ are uncertain. It is currently not clear whether the world will implement
the emission reductions (mitigation) needed to limit global warming to 2 degrees relative to pre‐
industrial levels (the 2C goal) and many commentators consider higher emission scenarios towards
a 3 or 4C warmer world are more likely. The future emission path makes a large difference to future
warming and changes in other climate parameters, such as precipitation. Second, even when a
future emission scenario is defined, there are still large variations projected from different climate
models. This arises because of structure and sensitivity of the models, the regional and seasonal
changes associated with global temperature, and the difficulty in projecting complex effects such as
rainfall. As a result, different climate models often give very different results even for the same
scenario and same location.
The focus on uncertainty has led to a shift in adaptation away from long‐term optimized solutions to
more flexible frameworks, which allow learning and iteration through adaptive management (a cycle
of monitoring, research, evaluation and learning process to improve future management
strategies/decisions.
These aspects can be presented in an iterative framework, illustrated in the Figure below. The
framework starts with climate change (top), which is split into a number of linked risks, each related
to different policy problems and time‐scales. This starts with current climate variability and
extremes (top left), i.e. the adaptation deficit. Over time, climate change will affect these existing
impacts, and lead to major new risks (top right), though often with high uncertainty. In response, an
adaptive management framework is recommended for adaptation (bottom), also known as iterative
climate risk management (IPCC, 2014) or adaptation pathways (Downing et al, 2012).
These involve a shift away from a classical optimisation framework (i.e. a predict‐and‐optimise
approach where future climate is predicted, then an optimised adaptation response is advanced)
towards a more dynamic view of climate change, and an iterative approach for adaptation.
2 There are many definitions of uncertainty. We adopt an economic definition of uncertainty, where it is impossible to attach probabilities to outcomes, as differentiated from risk, where probability is defined.

An iterative climate risk management framework for adaptation. Watkiss et al 2014.
The adaptation response involves complementary responses that cover different challenges across
the time‐periods and climate challenges. Three broad sets of complementary activities are
identified:
1) Addressing current risks;
2) Mainstreaming climate into policy and infrastructure (e.g. to address future exposure); and
3) Building iterative responses to address future long‐term risks.
In many cases, a strategic adaptation programme will comprise of a portfolio of interventions that
cover all of these different aspects. However, the three involve different activities.
1. The first area targets the current adaptation deficit, to reduce the impacts of climate
variability, and also build resilience for the future. This often includes interventions termed
no‐ or low‐regret measures, which are good to do anyway (even without climate change).
The focus is on short‐term action to address short‐term decisions.

2. The second area targets short‐term decisions with long life‐times, i.e. which will be exposed
to climate change in the future (e.g. infrastructure, development planning decisions). This
can be addressed using risk screening and mainstreaming, with early priorities around low‐
cost robustness and flexibility.
3. The final area addresses the long‐term (and uncertain) risks of future climate change, i.e.
future decisions for future problems, building iterative response pathways using a
framework of decision making under uncertainty and identifying early action to allow
learning for future decisions. This allows responses to evolve over time (with a learning and
review cycle) so that appropriate decisions can be taken at the right time, allowing for action
to be brought forward or delayed as the evidence and observations (of climate change)
emerge.
The focus for the FCFA pilot, which is concerned with the medium‐long‐term, should be on areas 2
and 3.
Importantly these new frameworks change the climate information needs. To expand:
Each of these policy problems requires different types of climate information, necessitating a
mix of tailored outputs.
There is a greater need for more information on current climate variability and extremes
(compared to classical studies), as this provides the analysis of the current adaptation deficit, i.e.
the starting point for adaptation. This is likely to focus on variability and extreme indices, and
historical information sets.
Information on recent trends and early changes (the next decade or two) are much more
relevant, rather than projections of long‐term changes towards mid‐century. This moves away
from 30 year time‐slices to consider future trends.
Where climate models are used, there is a greater demand for information on variability and
extremes, rather than average trends (slow onset), noting the greater challenge and uncertainty
involved with these.
For future climate model projections, there is a much greater need for information on
uncertainty, i.e. across scenarios and climate models. This can be assessed qualitatively with
narratives, or quantitatively using analysis of climate model uncertainty (e.g. climate envelopes,
statistical analysis of ensembles), noting that there are a number of different tools for
adaptation decision making under uncertainty and these involve different information inputs
(e.g. large numbers of runs, multi‐model ensemble information, probabilistic like information,
uncertainty envelopes, etc.).
For long‐term iterative pathways, the focus is likely to be less around general average trends
(temperature, precipitation) and more on defined indices and threshold levels. This may well
involve more complex meteorological parameters/temporal disaggregation or have a strong
climate‐bio‐physical component which may involve additional analysis or interpretation (e.g.
extreme urban temperature, peak temperature during the plant maturation season, etc.).
It is also stressed that all of this requires more interpretation and is likely to put more demands on
climate interpretation.
In the context of Africa, these challenges are often exacerbated by the lack of current information on
current climate variability, and a lack of future projections or multi‐model runs. There are also data
gaps on many key areas, e.g. on extremes, on the coastal and marine environment (sea surface
temperature, temperatures profiles and sea level rise (regional), etc. which hampers adaptation
decisions and investment.
ImplicationfortheFCFAcasestudy
The review findings above highlighted that the FCFA case study in Rwanda should consider a broad
set of complementary adaptation activities, investigating the climate information needs for each.
These could potentially involve current climate variability as well as future climate change, and
involve mainstreaming / risk screening activities in addition to specific adaptation responses.
However, as the FCFA programme is focused on medium‐long‐term decisions, this indicated a
greater focus on short‐term decisions with long life‐times, or iterative decisions to address future
climate change challenges (including the value of information and learning). This was used to
prioritise the focus areas for discussion and the subsequent selection in the pilot.
Adaptation Decision Making Under Uncertainty
The development of policy – and the selection and appraisal of options ‐ is a standard part of policy
and project analysis, and there are existing guidelines and decision support tools to help in the
selection, prioritisation and ranking of options, many of which are focused on economic assessment
for implementation.
The most commonly used include:
Social Cost‐Benefit Analysis (CBA) is the method of choice in most development partner
economic appraisal or impact assessment. It values all relevant costs and benefits to society of
all options, and then estimates a net present value or a benefit:cost ratio. In this regard, CBA is
an absolute measure providing the justification for intervention, though it is often difficult to
value all the costs and benefits of a particular project or policy.
Cost‐Effectiveness Analysis (CEA) is a widely used decision support tool. It compares alternative
options for achieving similar outputs (or objectives). In this regard it is a relative measure,
providing comparative information between choices (unlike CBA, which provides an absolute
measure). It has been widely used in environmental policy analysis, because it avoids monetary
valuation of benefits, and instead quantifies benefits in physical terms. CEA can be used to
compare and rank alternative options. At the project, policy or programme level, CEA can be
used to identify the most cost‐effective order of options, and identify the least‐cost path for
achieving pre‐defined policy targets with the use of marginal abatement cost (MAC) curves. It
has become the main decision support tool for the analysis of mitigation.
Multi‐Criteria Analysis (MCA) is a decision support tool that allows consideration of quantitative
and qualitative data together in ranking alternative options. The approach provides a systematic
method for assessing and scoring options against a range of decision criteria, some of which are
expressed in physical or monetary units, and some which are qualitative. The various criteria
can then be weighted to provide an overall ranking of options. MCA was the primary method
used in the National Adaptation Programme of Action (NAPA) process, for the selection of
priority early adaptation options ().

However, the appraisal of adaptation options involves several methodological challenges (UNFCCC,
2009), related to the varied spatial and sector contexts, as well as the timing of adaptation, which
raises questions such as how much adaptation is needed (if any) and when action is most
appropriate. As highlighted earlier, one of the most important of these challenges is uncertainty.
The three techniques above have major limitations in considering uncertainty (e.g. see Hunt and
Watkiss, 2011: Watkiss et al, 2013). While it is possible to include sensitivity testing in CBA and CEA,
and to include uncertainty elements in MCA attributes, these are not sufficient.
There is therefore a growing consensus that the appraisal of climate change adaptation should
incorporate uncertainty, and that this requires extended analysis within existing elements in existing
tools or new decision methods that more fully capture uncertainty. A number of alternative decision
support tools are therefore being suggested.
Real Option Analysis (ROA) is an economic decision support tool that quantifies the investment
risk associated with uncertain future outcomes. The approach can be used to consider the value
of flexibility and new information (learning). The approach can assess whether it is better to
invest now or to wait ‐ or whether it is better to invest in options that offer greater flexibility in
the future. A key strength for adaptation is the economic analysis is in identifying whether the
marginal cost (lower initial benefits) of added flexibility is offset by the option value for future
learning. ROA investment rules favour adaptation projects that have substantial near‐term
benefits (where there is an adaptation deficit), relatively small variance in outcome scenarios,
and/or the need to wait for long periods of time before new information arises that affects the
investment decision. The approach is most relevant to large, capital intensive investments such
as flood protection or water storage. There are applications of ROA to adaptation (See Watkiss
et al, in review for a review). Most of these focus on sea level rise, which lends itself to ROA due
to the high capital investments and the nature of single, directionally bounded, gradual change.
However, Jeuland and Whittington (2013) applied ROA to water investment planning on the Blue
Nile to identify flexibility in design and operating decisions for a series of large dams. Other
examples include applications to agricultural irrigation in Mexico (World Bank, 2009) and
Gersonius et al (2013) on urban drainage infrastructure. However, while the technique can be
conceptually consistent with iterative adaptation, data constraints may be a barrier to use,
especially since key inputs are probabilistic climate information and quantitative impact data
(Watkiss et al, submitted), and the complexity of the approach is likely to require expert
application which will constrain widespread up‐take.
Robust Decision Making (RDM) is a decision support tool that is used in situations of deep
uncertainty, i.e. in the absence of probabilistic information on scenarios and outcomes. The key
aim of RDM is to seek strategies that are robust over many future outcomes, i.e. that are ‘good
enough’ and minimize regret. It therefore offers an alternative to a conventional cost‐benefit
analysis and the identification of optimal options on the basis of economic efficiency. The
formal application uses quantitative models, or scenario generators, with data mining
algorithms, to evaluate how different strategies perform under large ensembles of scenarios
reflecting different plausible future conditions. A simpler version is to limit the robustness
analysis to future climate uncertainty. RDM has many attributes that align with the concept of
adaptive management and the approach has been widely recommended for adaptation. There
have been a number of applications, especially for water management (for a review, see Watkiss
et al, submitted), though also some applications for flood management and dams. These
suggest that when future uncertainties are poorly characterised or probabilistic information is

limited/unavailable, RDM is a useful tool. However, the formal application has a high demand
for quantitative information and expert resources.
Adaptive Management (Iterative Risk Management) is a long established approach that uses a
monitoring, research, evaluation and learning process to improve future management
strategies. The approach has been widely recommended for adaptation, including in the latest
SREX (IPCC, 2012) and the 5th Assessment Report (IPCC, 2014). The approach is not formalised
but the focus is on the management of uncertainty, allowing adaptation to work within a
process of learning and iteration. The most recent applications (see Watkiss et al, accepted)
identify possible risk or impact thresholds (and accompanying indicators) and assess options (or
portfolios of options) that can respond to these threshold levels. These are accompanied by
monitoring plans that track key indicators, and through a cycle of evaluation and learning, allows
the adjustment of plans over time. Adaptation applications include the Thames Estuary 2100
project (EA, 2009: 2011), sea level rise in the Netherlands (see Haasnoot et al, 2013) and the
application in national sector policy for agriculture in Ethiopia (Watkiss et al, 2013). The key
advantage is that rather than taking an irreversible decision now– which may or may not be
needed ‐ decisions are adjusted over time with evidence (Reeder and Ranger, 2011). This helps
ensure that appropriate decisions are taken at the right time, ideally with reference to the risk
preferences for the given context. The disadvantages of the approach are in the identification
of risk thresholds. As a result, the principle application to date has been for (directionally
bounded, gradual) SLR. Other studies show the challenges in applying to other sectors (Watkiss
et al, submitted) such as agriculture, due to the combination of several climatic parameters,
multiple impact risks (with different thresholds), and complex socio‐economic and institutional
baselines.
Portfolio Analysis (PA) is a decision support tool that helps in developing portfolios of options,
rather than single options. It aims to spread investments over a range of asset types to spread
risks at the same time, thereby reducing the dependence on a single asset (by estimating the
variance (standard deviation) of the portfolio return and matching to risk preferences). The
principles have high relevance for adaptation. In the climate change context, the trade‐off is
between the possibility of a high degree of effectiveness in reducing climate risks, and the risk
that the adaptation options will fail to be effective over a certain range of climate change. PA
allows the selection a set of options that, together, are effective over the range of possible
projected future climates, rather than one option that is best suited to one possible future
climate. The main strength of the approach is that it provides a structured way of accounting for
uncertainty using combinations (portfolios) of options, which individual adaptation options do
not allow. The disadvantages include that it is resource intensive, requires a high degree of
expert knowledge, and relies on the availability of quantitative data. There are few applications
to the adaptation context (see Watkiss et al, submitted), though existing applications include
forest restoration/regeneration and local flood management.
Some additional methods / adjustments are also being considered (UKCIP, 2004) including maximin
or minimax criterion, expected value‐risk analysis and expected utility criterion, etc.
The application to adaptation is reviewed elsewhere (Watkiss et al, submitted). While there are no
hard‐or‐fast rules on which tool to use, it is clear that certain tools lend themselves more to specific
contexts or sectors. Furthermore, the level of time and resources available, and the size of the
investment decisions, will determine the level of detail needed, and also which support tool might
be justified.

Attributes of the Decision Support Tools.
Decision Support Tool
Strengths Input requirements Benefits analysis Weaknesses
Cost‐Benefit Analysis
Well known and widely applied.
Individual scenario and climate model outputs. Baseline damage costs from scenario‐based IA.
Reduction in baseline costs (benefits). Benefits expressed in monetary terms.
‐Difficulty of monetary valuation for non‐market sectors and non‐technical options. ‐Consideration of uncertainty limited to probabilistic risks.
Cost‐Effectiveness Analysis
Analysis of benefits in non‐monetary terms.
Scenario and climate model outputs and often baseline damage costs. Effectiveness as reduction in impacts (unit / total).
Benefits expressed in quantitative (but not monetary) terms.
‐Single headline effectiveness metric difficult to identify ‐Common metric makes less suitable for complex or cross‐sectoral adaptation. ‐Consideration of uncertainty
Real Options Analysis
Value of flexibility, information.
Probability or probabilistic assumptions for climate (multiple scenarios). Decision points. Baseline damage costs.
Analysis of benefits of options expressed in monetary terms
‐Requires probabilities ‐Requires decision points ‐Most relevant where adaptation deficit. ‐Challenge of valuation‐for non‐market sectors.
Robust Decision Making
Robustness rather than optimisation.
Multi‐model scenario and climate model outputs (more the better). Formal approach requires uncertainty information for all parameters.
Benefits expressed in quantitative or economic terms.
‐Often qualitative inputs (stakeholder) ‐High computational analysis (formal) and large number of runs ‐Large numbers IA assessment (CC)
Portfolio Analysis
Analysis of portfolios rather than individual options
Probability or probabilistic assumptions for climate (multiple scenarios). Variance and covariance of each option.
Benefits, expressed as physical or monetary inputs / NPV outputs
‐Requires probabilities ‐Issues of inter‐dependence between options
Economic Iterative Risk Assessment
Iterative analysis incorporating monitoring, evaluation and learning.
Sets of scenario and climate model outputs, but flexible. Threshold levels for risks.
Benefits expressed in quantitative or economic terms.
‐Challenging when multiple risks acting together. ‐Thresholds are not easy to identify.
Source Watkiss et al, accepted.
For the FCFA case study, it is highlighted that a number of the methods require probabilistic inputs,
but climate uncertainties are rarely characterised in such terms. Even when probabilistic‐like
projections exist, these provide a probability distribution for individual emission scenarios, rather

than a composite probability distribution for all scenario futures and all models together. This is a
critical issue, especially for techniques that require probability/expected value (ROA and PA). This
tends to favour RDM and IRM tools.
Applicability of the Different Decision Support Tools.
Tool Applicability Usefulness & limitations in climate adaptation context
Potential uses of approach
Cost‐Benefit Analysis
Short‐term assessment, particularly for market sectors.
Most useful when:‐Climate risk probabilities known. ‐Climate sensitivity small compared to total costs/benefits. ‐Good data exists for major cost/benefit components.
Low and no regret option appraisal (short‐term). As a decision support tool within iterative risk management.
Cost‐Effectiveness Analysis
Short‐term assessment, for market and non‐market sectors. Particularly relevant where clear headline indicator and dominant impact (less applicable cross sectoral and complex risks).
Most useful when:‐As for CBA, but for non‐monetary metrics (e.g. ecosystems, health). ‐Agreement on sectoral social objective (e.g. acceptable risks of flooding).
Low and no regret option appraisal (short‐term). As a decision support tool within iterative risk management.
Real Options Analysis
Project based analysis Large irreversible capital investment, particularly where existing adaptation deficit. Comparing flexible vs. non flexible options.
Most useful when:‐Large irreversible capital decisions ‐Climate risk probabilities known or good information ‐Good quality data exists for major cost/benefit components
Economic analysis of major investment decisions, notably major flood defences, water storage. Potential for justifying flexibility within major projects.
Robust Decision Making
Project and strategy analysis. Conditions of high uncertainty. Near‐term investment with long life times (e.g. infrastructure).
Most useful when:‐High uncertainty in direction of climate change signal. Mix of quantitative and qualitative information. ‐Non‐monetary areas (e.g. ecosystems, health)
Identifying low and no regret options. Testing near ‐term options or strategies across number of futures or projections (robustness). Comparing technical and non‐technical sets of options.
Portfolio Analysis
Analysing combinations of options, including potential for project and strategy formulation.
Most useful when:‐A number of adaptation actions likely to be complementary in reducing climate risks. ‐Climate risk probabilities known or good information.
Project based analysis for future combinations for future scenarios. Designing portfolio mixes as part of iterative pathways.
Economic Iterative Risk Assessment
Project level. Strategy level for framework for planning.
Most useful when:‐Clear risk thresholds. ‐Mix of quantitative and qualitative information. ‐For non‐monetary areas (e.g. ecosystems, health).
Flexible, though very relevant for medium‐long‐term where potential to learn and react. Applicable as a general framework for adaptation policy development.
Source Watkiss et al, submitted.
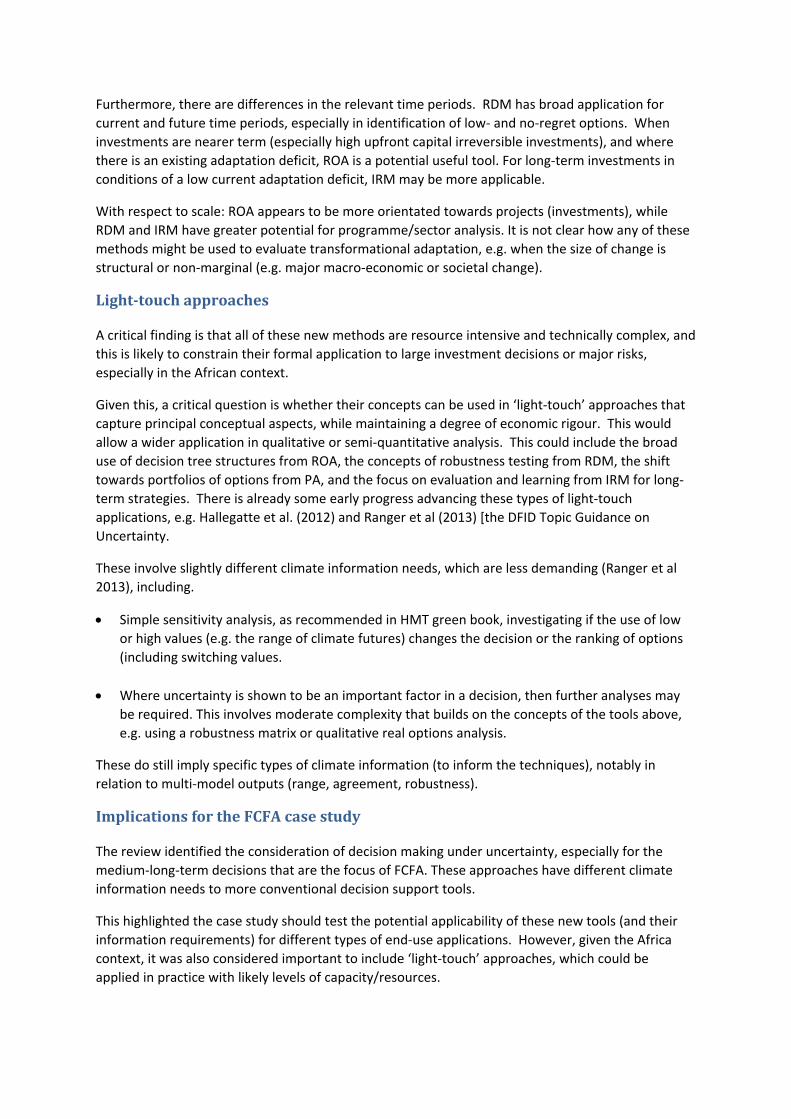
Furthermore, there are differences in the relevant time periods. RDM has broad application for
current and future time periods, especially in identification of low‐ and no‐regret options. When
investments are nearer term (especially high upfront capital irreversible investments), and where
there is an existing adaptation deficit, ROA is a potential useful tool. For long‐term investments in
conditions of a low current adaptation deficit, IRM may be more applicable.
With respect to scale: ROA appears to be more orientated towards projects (investments), while
RDM and IRM have greater potential for programme/sector analysis. It is not clear how any of these
methods might be used to evaluate transformational adaptation, e.g. when the size of change is
structural or non‐marginal (e.g. major macro‐economic or societal change).
Light‐touchapproaches
A critical finding is that all of these new methods are resource intensive and technically complex, and
this is likely to constrain their formal application to large investment decisions or major risks,
especially in the African context.
Given this, a critical question is whether their concepts can be used in ‘light‐touch’ approaches that
capture principal conceptual aspects, while maintaining a degree of economic rigour. This would
allow a wider application in qualitative or semi‐quantitative analysis. This could include the broad
use of decision tree structures from ROA, the concepts of robustness testing from RDM, the shift
towards portfolios of options from PA, and the focus on evaluation and learning from IRM for long‐
term strategies. There is already some early progress advancing these types of light‐touch
applications, e.g. Hallegatte et al. (2012) and Ranger et al (2013) [the DFID Topic Guidance on
Uncertainty.
These involve slightly different climate information needs, which are less demanding (Ranger et al
2013), including.
Simple sensitivity analysis, as recommended in HMT green book, investigating if the use of low
or high values (e.g. the range of climate futures) changes the decision or the ranking of options
(including switching values.
Where uncertainty is shown to be an important factor in a decision, then further analyses may
be required. This involves moderate complexity that builds on the concepts of the tools above,
e.g. using a robustness matrix or qualitative real options analysis.
These do still imply specific types of climate information (to inform the techniques), notably in
relation to multi‐model outputs (range, agreement, robustness).
ImplicationsfortheFCFAcasestudy
The review identified the consideration of decision making under uncertainty, especially for the
medium‐long‐term decisions that are the focus of FCFA. These approaches have different climate
information needs to more conventional decision support tools.
This highlighted the case study should test the potential applicability of these new tools (and their
information requirements) for different types of end‐use applications. However, given the Africa
context, it was also considered important to include ‘light‐touch’ approaches, which could be
applied in practice with likely levels of capacity/resources.
Part 2: Background Rwanda Review
This section reviews the existing country context. It assesses current climate variability and future
climate change information, reviews national development policy and climate change policy, and
reports
Country Context
Rwanda is a small, land‐locked country in East Africa. It is a mountainous country (and is known as
the “land of a thousand hills”) with an average altitude of 900 m in south‐west, 1500 to 2000 m in
the south and the centre of the country, 1800 to 3000 m in the highlands of the north and the west
and 3000 to 4500 m in the regions of Congo‐Nile Crest and the chain of volcanoes. However, due to
its temperature climate it is fertile.
The country has a population of 10.5 million people, but as there is an average of 415 inhabitants
per square kilometre (RoR RPHC4, 2012), Rwanda is one of the most densely populated countries in
Africa. The population is largely rural, with 83% living in rural areas, though urbanisation is
happening quickly. The population is also young, and is growing at average annual growth rate of
2.6%. Poverty and inequality are high.
Rwanda has experienced high economic growth over most recent years, and GDP per capita is
increasing (RoR, 2013). Over the last 5 years, poverty has fallen significantly from 57 percent to 45
percent, GDP per capita has risen to $600pp, and there have been reductions in maternal and child
mortality (though these are still above the MDG targets).Agriculture comprises 32% of GPD, though
much of this is rain‐fed, with services (tertiary sector) dominating at 46%, which includes tourism.
A high proportion of recent economic growth has arisen from agricultural sector growth, not least
due to the increasing productivity of the sector, though land expansion has also been a factor.

Country Development Plans
Vision(2020)
The future economic and development strategy for Rwanda is set out in the Vision 2020 document.
Vision 2020 aims to transform Rwanda from a subsistence agriculture economy to a knowledge
based society earning 900 USD per capita, making Rwanda a middle income country by 2020. The
Vision sets out a future where Rwanda is transformed through:
Reconstruction of the nation and its social capital anchored on good governance, underpinned
by a capable state;
Transformation of agriculture into a productive, high value, market oriented sector, with
forward linkages to other sectors;
Development of an efficient private sector spearheaded by competitiveness and
entrepreneurship;
Comprehensive human resources development, encompassing education, health, and ICT skills.
aimed at public sector, private sector and civil society. To be integrated with demographic,
health and gender issues;
Infrastructural development, entailing improved transport links, energy and water supplies and
ICT networks;
Promotion of regional economic integration and cooperation.
There are also cross cutting visions of:
Gender equality,
Protection of the natural environment and sustainable natural resource management and
Science and technology, including ICT.
The Vision 2020 sets out the transformation of the agricultural sector into a high value/high
productivity sector, accompanied by an exit strategy from reliance on agriculture into secondary and
tertiary sectors.
As a climate sensitive sector, the dominance of agriculture in the future vision is an area of potential
future vulnerability/risk from climate change, although if the sector can achieve high productivity,
the baseline vulnerability could actually be lower than today (i.e. from higher adaptive capacity,
improved production efficiency and farm management, reducing the impact of shocks).
EconomicDevelopmentandPovertyReductionStrategy(EDPRS)
The Economic Development and Poverty Reduction Strategy (EDPRS) is the framework for achieving
Vision 2020 and the Millennium Development Goals (MDGs), i.e. the medium term development
plan. The first EDPRS (2007) covered the period 2008 to 2012. The strategy promoted three flagship
programmes:
Sustainable Growth for Jobs and Exports, driven by an ambitious, high quality public investment
programme aimed at systematically reducing the operational costs of business, increasing the
capacity to innovate, and widening and strengthening the Financial Sector. This included heavy
investment in “hard infrastructure” by the GoR to create strong incentives for the Private Sector
to increase its investment rate in subsequent years.
Vision 2020 Umurenge, to accelerate the rate of poverty reduction by promoting pro‐poor
components of the national growth agenda. The aim was to release the productive capacity of
the poor in rural areas through a combination of public works, promotion of cooperatives, credit
packages and direct support.
Governance provides an anchor for pro‐poor growth by building on Rwanda’s reputation as a
country with a low incidence of corruption and a regional comparative advantage in “soft
infrastructure”.
Sustained economic growth (8% average), poverty reduction (12% points) and a reduction in income
inequality were achieved over the EDPRS 1 period.
The second EDPRS (RoR EDPRS, 2013) has the following thematic objectives:
Economic transformation: towards accelerated economic growth and restructuring of the
economy towards more services and industry. The main targets relate to: strategic
infrastructure investment for exports, increased private sector financing for increased exports
coverage of imports, urbanisation and green economy approach for sustainability. Five priority
areas will spearhead this thematic strategy.
Rural transformation: to reduce poverty down to 30% by 2018, through increased productivity of
agriculture, and enhanced linkages of social protection programmes.
Productivity and Youth Employment: to ensure growth and rural development are underpinned
by appropriate skills and productive employment, especially for the growing youth cohort.
Accountable Governance: to improve the overall level of service delivery and ensure citizen
satisfaction above 80%.
Foundational Issues: continued focus for the nation in order to lay a firm foundation for the
emerging priorities, e.g. for macro‐economic stability, sustainable population growth, food
security, education, health care, rule of law, public financial management, consolidating
decentralisation.
EDPRS2 has a number of cross cutting issues are also included, which are mainstreamed in sector
and district plans in the document:
a) Capacity building: through prioritising institutional and individual capacity development within
sectors and Districts to deliver under each of the thematic areas and foundational issues.
b) Environment and climate change: major areas of attention will be mainstreaming
environmental sustainability into productive and social sectors and reducing vulnerability to
climate change.
c) Gender and family: The main issues include reducing poverty levels among men and women,
malnutrition, reducing gender based violence and other related conflicts at both family and
community level.
d) Regional integration: This will be explored for increased access to trade, finance, legislation,
health regulation, agricultural standards, environmental safeguards and education qualifications.
e) HIV/AIDS and NCDs through regular sensitisation regarding HIV, voluntary counselling, testing,
prevention of mother to child transmission, condom distribution.

f) Disaster management includes investment in rapid response disaster management equipment,
early warning systems and awareness campaigns.
g) Disability & Social Inclusion include accessible infrastructure and information, media practitioners
will develop standards for reporting news accessible to people with disabilities.
Note the highlighted areas, which are of particular relevance.
Looking at the document, a number of areas are highlighted in relation to medium‐long term climate
change adaptation including:
Investment in infrastructure (energy, road and rail transport, airport)
Facilitating urbanisation and promoting secondary cities (6)
Pursuing a ‘green economy’ approach to economic transformation (including green
urbanisation)
Increasing the Productivity of Agriculture by building on the sector’s comparative advantage,
with a focus on irrigation and land husbandry.
Improved Rural Infrastructure with interventions that include a feeder roads programme.
Country Climate Policy
Rwanda has one of the most ambitious climate change policy frameworks in Africa. It has a green
growth/climate resilience national strategy, an operational climate fund, and has mainstreamed
climate change into many development and sector plans (see above discussion on the EDPRSII).
The following key documents are highlighted.
The Rwanda National Adaptation Programme of Action (NAPA) (RoR, 2006);
The DFID funded Economics of Climate Change in Rwanda for GoR (Watkiss et al, 2010);
The Green Growth and Climate Resilience: National Strategy for Climate Change and Low Carbon
Development (RoR, 2011);
The Rwanda 2nd National Communication (RoR, 2012);
The FONERWA fund (Operational 2013).
Some additional information is outlined below.
Rwanda’sNationalStrategyonClimateChangeandLowCarbon
Rwanda’s Green Growth and Climate Resilience: National Strategy for Climate Change and Low
Carbon Development (RoR, 2011) set out the Vision for Rwanda to be a developed climate‐resilient,
low‐carbon economy by 2050.
This Strategy aims to guide the process of mainstreaming climate resilience and low carbon
development into key sectors of the economy. It provides a strategic framework (below) which
includes a vision for 2050, guiding principles, strategic objectives, programmes of action, enabling
pillars and a roadmap for implementation. Each Programme of Action has three to five focussed
actions with a number of sub‐actions.

The drive towards climate resilience is driven by the high vulnerability of the country. The drive
towards a green growth strategy is influenced by Rwanda’s position as a landlocked country, and the
fact that the country is entirely dependent on imports for all of its oil‐based products. High oil prices
in recent years have led to a high trade deficit and inflationary spikes.
In order to achieve the strategic vision, 14 Programmes of Action are proposed, along with 5
Enabling Pillars, ‘Big Wins’ and ‘Quick Wins’, detailed below, and reorganised according to the
Strategy’s priority sectors.

Climate Resilience and Green Growth Strategy recommendations summary
Sector Sub‐Sector Programmes of Action (PoA); Big Wins (BW; Quick Wins (QW)
ENR Land PoA: Sustainable land management
Water PoA: Integrated Water Resource Management (IWRM)
Environment &
Climate Change
PoA: Ecotourism, conservation and PES (note tourism is under RDB)
QW: 1. Establish online Climate Portal to communicate the
National Strategy, 2. Operationalise FONERWA
Forestry PoA: Sustainable forestry, agro forestry & biomass
BW: Agro forestry
Mines PoA: Climate compatible mining
Agriculture PoA: Sustainable intensification of small‐scale farming
BW: Integrated soil fertility management
BW: Irrigation infrastructure
Infrastructure Energy PoA: Low‐carbon energy grid
BW: Geothermal power generation
Transport PoA: Resilient transport systems
BW: Robust road network
Habitat & urbanism PoA: Low‐carbon urban systems
BW: High‐density, walkable cities
QW: Resource efficient design in Special Economic Zone (SEZ) in
Kigali
Water & sanitation ‐‐
Meteorology PoA: Climate date and projections
BW: Centre for Climate Knowledge for Development
Trade & Industry PoA: Green industry and private sector development
Local
government
QW: Use the Integrated Development Programme (IDP) and Vision
2020 Umurenge Programme (VUP) to facilitate climate resilient,
low‐carbon development in rural areas.
Disaster mgt. PoA: Disaster management and disease prevention
Health Above.
Education QW: Expand Technical and Vocational Educational and Training
(TVET) for Strategy implementation.
Programmes of Action (PoA);
Big Wins (BW;
Quick Wins (QW)
The study also sets out a road map, presented below.

While a roadmap towards implementation was identified, there are not specific sector strategies or
budget allocations for any of the 14 areas above, nor programmes of action in place: though there is
some potential for sectors to apply to the climate fund for finance.
FONERWAfund
In 2012, the Government established an Environment and Climate Change Fund – FONERWA – a
national basket fund through which environment and climate change finance is channelled,
programmed, disbursed and monitored. The Fund was organised around four thematic windows:
1. Conservation & sustainable management of natural resources;
2. Renewable energy, R&D and technology transfer and implementation;
3. Environment & climate change mainstreaming;
4. Environmental Impact Assessment (EIA) monitoring & enforcement.
DFID funded a 2‐year operational period for the fund (2012‐2014), during which time a Fund
Management Team, based in Government, established Fund resource facilities and management
systems. DFID also provided the initial capitalisation for the Fund.
The FUND is being dispersed (initially) through a project application process. Applications are made
by line ministries, Government agencies, Districts, civil society organisations (CSOs) (including
academic institutions) and the private sector.
Existing Climate and Current Vulnerability
Currentclimate
Rwanda has a complex existing climate, with wide variations across the country and with very strong
seasonality. It is primarily a mountainous country, with average altitude of 900 m in south‐west,
1500 to 2000 m in the south and the centre of the country, 1800 to 3000 m in the highlands of the
north and the west and 3000 to 4500 m in the regions of Congo‐Nile Crest and the chain of
volcanoes. The equatorial climate is modified by this widely varying altitude across the country. It
leads to a more temperate climate than much of the rest of East Africa. Average annual
temperature in Rwanda range between 16ºC and 20ºC though they are much lower than this in the
higher mountains.
The country has a particularly variable and complex pattern of rainfall, within large differences at the
micro‐scale. Average rainfall is around 1,250 mm per annum. In broad terms, the annual cycle is
bimodal, with two wet seasons: the long rains from mid‐September to mid‐December and from
March to May. The two wet seasons arise from the Inter‐Tropical Convergence Zone (ITCZ) moving
northwards and retreating southwards respectively. Overall, there are significant inter‐annual and
spatial variation in the strength and timing of these rains.
There are complex patterns of climate variability, which are due to many factors, notably the El Niño
– Southern Oscillation (ENSO) events s. El Niño is associated with anomalously wet conditions during
the short rains and some El Niño events, such as 1997, lead to extreme flooding. La Niña conditions
are associated with unusually dry conditions such as during the year 2000 drought.

Information is hampered by the lack of long‐term statistical meteorological data, as most of the
meteorological records were interpreted during the genocide. The main long‐term data set is for
Kigali airport.
Institutional capacity in the Rwanda Meteorological Service is also low, though there is an ongoing
capacity project with the UK Met Office, and investment in equipment to address the loss of
infrastructure.
CurrentVulnerability
Rwanda is affected by natural climate hazards. Flooding is common during the wet seasons (river
flooding, especially in the south, and flash floods in the north and west due to the steep terrain).
Rwanda is affected by complex patterns of climate variability, including due to El Niño – Southern
Oscillation (ENSO) events, which lead to periodic floods, landslides and droughts.
Major recent flood events occurred in 1997, 2006, 2007, 2008, 2009 and 2011, where rainfall
resulted in infrastructure damage, fatalities and injuries, landslides, loss and damage to agricultural
crops, soil erosion and environmental degradation. The 2007 floods were particularly large, and led
to fatalities, agricultural losses, building and infrastructure damage and population displacement.
Watkiss et al (2009) estimated that the direct measurable economic costs of the 2007 flood event
was $22 million (equivalent to around 0.6% of GDP) for two districts alone, and this does not include
indirect impacts (infrastructure damage, including loss of transport infrastructure, water system
damage and contamination, soil erosion and direct and indirect effects to individuals).
Recent work (RoR, 2012b) has undertaken a mapping exercise of high risk areas for floods and
landslides.
Source: RoR, 2012.
There are also often storms during the wet seasons, which increase the risks of damage to property
from windstorms, the risk of landslides, and lightning strikes.

In some regions of the country, there have also been periodic droughts, for example in 1999/2000
and 2005/6. In some regions of the country there have also been periodic droughts, for example in
1999/2000 and 2005/6. Indeed, there was a poor season last year and already early indications are
for a drought this year3. These events have high agricultural, health and livelihood impacts, though
can also impact on hydro‐electriciyt.
These risks are now rising up the agenda, with the establishment of a Ministry of Disaster
Management and Refugee Affairs (MIDIMAR) and a National Disaster Management Policy (Revision
of the 2009 National Disaster Management Policy). There is a new multi‐hazard disaster risk
mapping exercise currently underway, which is included floods, droughts, landslides (and fires and
earthquakes), though only the drought maps are completed, see below.
Source RoR, 2014.4
As well as these extreme events, there are also wider impacts from the climate variability. The inter‐
annual variability affects rain‐fed agriculture, which dominates the sector. This also affects key
agricultural exports (tea and coffee).
The strong rains, and hilly terrain, are a factor in soil erosion, which is high in Rwanda (field studies
report 35 and 246 t/ha per year, Olson and Berry and recent GIS monitoring estimates one‐half of
the country experiencing soil erosion rates of 50 tonnes per hectare per annum, and a third
3 http://www.fews.net/east‐africa/rwanda 4 To evaluate drought hazard in Rwanda, the analysis defines occurrence of drought relative to a crop specific water requirements. The approach compares the water supplied by rainfall (or irrigation) against the water requirements of a particular crop as both components vary throughout the season. The lengths of growing seasons A and B were considered for key crops normally grown in Rwanda. At the end of the season (EOS), a numerical index is computed, the WRSI (Water Requirements Satisfaction Index) which is 100 in case the crop water requirements are fully satisfied throughout the season and increasingly below this value the more the rainfall is unable to satisfy crop water needs. Decadal rainfall data for the period of March 2001 to February 2014 were processed. Maize was used as a proxy crop, for the two rainy seasons, A and B.

experiences losses of 100 tonnes per hectare per annum, REMA). These losses reduce land
productivity.
Variability also has a role in hydropower, which is a major source (50%) of power generation ‐ with
the low rains in 2004 affecting generation (and requiring diesel back‐up) (RoR, 2011).
Recent Trends and Future Climate Projections
A review has been undertaken of the existing climate change information in Rwanda, by considering
a number of key documents and reports.
The Rwanda National Adaptation Programme of Action (NAPA) (RoR, 2006).
The DFID funded Economics of Climate Change in Rwanda (Watkiss et al, 2010).
The Green Growth and Climate Resilience: National Strategy for Climate Change and Low Carbon
Development (RoR, 2011).
The DFID Office Climate Risk Screening Review (Dyszynski et al, 2011).
Rwanda Country Situational Analysis (Mutabazi, 2011).
The Rwanda 2nd National Communication (RoR, 2012).
RecentTrends
Recent records (annual mean temperature) show a significant increase from 1970, at around 0.35C per decade (for four met stations), very slightly higher than the global average (RoR, 2011). The
Green Growth and Climate Resilience Strategy (RoR, 2011) reports no significant trend found for
rainfall, but it is difficult to pick up robust signals because of the high inter‐annual and inter‐decadal
variability.
Annual mean anomaly for temperature and precipitation for Rwanda. Source RoR, 2011.
Rwanda’s Second National Communication reports that monthly and annual total rainfalls recorded
between 2004 and 2010 were generally lower than the average recorded between 1961 and 1990. It
also reported that rainfall in April, the month with the highest rainfall, has dramatically reduced
(27%, 48%, 88%, 70% and 52% of the average rainfall recorded for this month between 1961 and
1990 respectively in 2000, 2001, 2002, 2003 and 2005), though the months of July, September,
November and December had higher rainfalls than normal with the percentages respectively of
1441% (in 2001), 189% (in 2003), 165% (in 2006) and 153% (in 2006).

Mutabazi (2011) reports that recent analysis of rainfall trends for Rwanda show that rainy seasons
are tending to become shorter with higher intensity leading to decreases in agricultural production
and events such as droughts in dry areas and floods or landslides in areas experiencing heavy rains.
While these periods (e.g. 2004 – 2011) are too short to suggest a firm trend, they do indicate
increasing variability might be occuring.
Futureclimateprojections
Given the high complexity and heterogeneity, projections of future climate change are very
uncertain at the global scale. Even with regional downscaling techniques, it is very challenging to
make predictions of climate futures with the present state of knowledge. For Rwanda, this is
hampered by the lack of long‐term statistical meteorological data.
The Economics of Climate Change Study (Watkiss et al, 2009) use statistically downscaled data from
the Climate Systems Analysis Group (CSAG), based at the University of Cape Town, which provides
meteorological station level responses to global climate forcings.
Projected changes in average monthly precipitation and minimum temperature anomalies across
nine GCM models for period 2046‐2065 (A2 scenario), statistically downscaled to Kigali. Climate
Change Explorer tool, Climate Systems Analysis Group and SEI, 2009.

Unfortunately, due to the lack of historic records, there is only sufficient data for one downscale
station in Rwanda, for Kigali. The data are shown below for change in monthly average temperature
and rainfall. The top figure shows the increase in temperature. There is a clear and consistent trend
across the months of the year, though the level of increase varies with the models, from 1.6 to 2.8C by mid‐century (from control period).Changes in precipitation are more uncertain. Although the
intensity, frequency and spatial distribution of precipitation are unknown, all the climate model
scenarios show that average rainfall regimes will change. The majority of the projections indicate
that average annual rainfall will actually increase, particularly in some seasons, indicating a potential
strengthening of the rains. However, some models show reductions in rainfall in some months. The
range of model results highlights the considerable uncertainty in predicting future rainfall changes.
The Green Growth and Climate Resilience Strategy took projections from 19 GCMs from the CMP3
for the A1B scenario, reporting temperature increases of up to 2.5C by the 2050s and 4C by the 2080s. It also highlighted the high uncertainty for future rainfall, with a large spread, though with
central values of 20% by the 2050s and 30% by the 2080s.
Projected annual change in temperature and precipitation for Rwanda. A1B 19 GCM CMIP3. Source
RoR, 2011.
The Second National Communication also presents information, focusing on 3 GCM models,
selecting models that represented the climate of Rwanda well.
Changesinextremes
The projection of future changes to meteorological extreme events (and associated floods and
droughts) is much more challenging for the climate models, especially in East Africa, because of the
influence of ENSO events.
At the global level, there is an anticipation of an increase in the intensity of high rainfall events (Allan
et al, 2010), as a warmer atmosphere will be able to hold more water. This has implications for flood
risks. The 5th Assessment report (IPCC, 2013) reports that extreme precipitation events over most
of the mid‐latitude land masses and over wet tropical regions will very likely become more intense
and more frequent by the end of this century, as global mean surface temperature increases. It also
reports that due to the increase in moisture availability, ENSO‐related precipitation variability on
regional scales will likely intensify. However, natural variations of the amplitude and spatial pattern
of ENSO are large and thus confidence in any specific projected change remains low.

A more detailed review of model projections (GCMs) for East Africa (Shongwe et al, 2009) looking at
the longer term (where the climate signals are clearer) also found that many models indicate the
intensity and frequency of heavy rainfall extremes may increase in the wet seasons. In general, a
positive shift in the whole rainfall distribution is simulated by the models over most of east Africa
during both rainy seasons. This can be shown below, though it is noted one of the models projects a
drying trend.
The projections of future meteorological drought is even more challenging, and projections vary
widely. It is also stressed that droughts are complex phenomena that are typically classified in four
types: meteorological, hydrological, agricultural and socioeconomic, and there are many drought
indicators associated with each type. Meteorological drought is commonly defined as anomalous
low rainfall, however, even a relatively small rainfall deficit can have a large impact and vice versa.
However, there is a large range of projected changes in the models, as below from Shongwe.
Projected changes (%)in 10‐year wettest events. Source Shongwe et al, 2009.
Projected changes (%) in 10 year driest events. Source Shongwe et al, 2009.
Whilst periodic droughts are likely to continue, associated with the current ENSO and affecting some
parts of the country, there is wide model variation in terms of the potential change in the frequency,
intensity or duration.
Future Risks of Climate Change
Watkiss et al (2009) undertook an analysis of the potential threats and opportunities of climate
change in Rwanda.
This highlighted that the future impacts and future economic costs of climate change are very
uncertain. However, aggregate models indicate that the additional net economic costs (on top of
existing climate variability) could be equivalent to a loss of almost 1% of GDP each year5 by 2030 in
Rwanda, though this excludes the future effects of floods and other extremes.
In terms of key sector effects (summarising Watkiss et al, 2009):
There are potentially large increases in the health burden of malaria in Rwanda. This arises
because a large part of the rural population lives at higher elevations, where the disease is
currently restricted by temperature. A new malaria risk model, based on altitude, found that
climate change could increase the rural population at risk for malaria by 150% by the 2050s.
There are also other vector borne human and livestock disease which are climate sensitive (e.g.
tick borne disease). Changes in water borne disease, especially linked to extremes, are also
highlighted.
The impacts of climate change on agriculture in Rwanda are uncertain. Under some futures and
with certain models, there are potentially important impacts on agriculture, but under other
scenarios, there are modest effects or even benefits. However, the literature is primarily based
on crop models, and thus does not take account of extreme events fully, or the effects of
changing prevalence and range of pests and diseases (though they also do not take account of
farm level adaptation or agricultural development). The green growth strategy cites Liu et al
(2008) which projects that Rwanda could be a hotspot for food security, but this finding should
be interpreted with caution, i.e. compared to other East African countries, the effects on the
sector in Rwanda are likely to be more modest. The analysis of future drought risks are highly
uncertain, and many models project relative decreases in event frequency/severity with climate
change, though the risk of more negative changes, especially from changes to ENSO cycles, is
potentially possible.
There are potential impacts to some of the major agricultural crop exports (coffee and tea) as
these are both temperature sensitive crops. The areas currently suitable for tea and coffee are
likely to shift with climate change. This implies reducing productivity/quality or else shifting
production to higher elevations (though there are obvious issues around land and soil suitability
from doing this). Sugar cane is also a major export crop (by land area), and has some potential
vulnerability through water demand.
There are cross‐sectoral impacts from the changes in extreme events. As highlighted in the
climate section, there are indications of increased heavy precipitation for the region (e.g. which
could increase the intensity of 1 in 10 year events by 10 to 50%), which would translate into
5 Central net values (sum of positive and negative) for market and non‐market effects. The results exclude future extremes (floods & droughts) and do not capture a large range of potential effects including all ecosystem services.
increased flood, landslips and soil erosion risks. They would also mean a reduction in the return
period of larger events, i.e. more significant floods would occur more frequently. Vulnerability is
likely to be heavily affected by socio‐economic trends, notably the high population increases.
There are risks to electricity supply, given the relatively high level of hydro generation in the
future Rwandan electricity mix. This might primarily arise from increased flows (rather than
droughts or low flows, though under some futures these could arise as well). Higher
temperatures will also affect energy demand, though Rwanda’s climate is temperate, and
combined with low per capita income levels, the increased demand for cooling is likely to be
modest.
There are potentially large impacts on biodiversity and ecosystem services. Rwanda has
exceptional biodiversity and ecosystem services are integral to the Rwandan economy,
underpinning over 50% of GDP, as well as sustaining a very large proportion of the population.
There are many stresses on these systems already and climate change will add to these
pressures.
Climate change is likely to have cross‐sectoral effects on water. These could be to availability of
supply (precipitation), water catchment and flow management (ecosystems) or demand (higher
temperatures). These changes could be important, but are likely to be modest (in the immediate
future) when compared to short‐term socio‐economic pressures and trends, e.g. rising water
demand, population and socio‐economic growth, land‐use change.
Review of DFID Rwanda Country Programme
DFIDOfficeprogramme
DIFD Rwanda is active in the areas of poverty reduction (social protection), agricultural
development, education, wealth creation, climate change and governance, through a combination of
sector budget support and programmes.
DFIDOfficeClimateRiskscreening(2011)
DFID Rwanda commissioned a Climate Change Strategic Evaluation of the DFID Rwanda Programme,
to evaluate its current office programme of support (Dyszynski et al, 2011). This undertook a climate
risk screening of DFID Rwanda Office Programmes, and also Bi‐lateral Aid Review (BAR) documents.
However, as DFID’s funding in Rwanda was primarily through budget support, both general and
sector, a high‐level screening was also undertaken, noting the latter is much more challenging to do.

The evaluation is based around a set of questions:
whether climate change related hazards have the potential to prevent or undermine the
achievement of specified programme/policy outputs, posing a direct risk to the PP
whether climate change related hazards might make the achievement of outcomes associated
with a PP more difficult, even if a PP’s outputs are delivered (for example, outputs intended to
increase access to credit may succeed, but this credit might be used addressing the impacts of
intensified climate risks, meaning that household incomes do not increase)
whether opportunities presented by a PP to promote measures that increase resilience and
facilitate adaptation to evolving climate risks, and innovation to help deliver low‐carbon
development (LCD).
To do this, the screening process assigns a programme or project (PP) a score of 0‐3 for one set of
questions relating to climate change risks, and one set of questions relating to climate change
opportunities.
A total of 10 initiatives were screened. Five of these were on‐going. Another five were separately
included in the BAR Offer.
The majority of initiatives scored as moderate to high priority in terms of the need for further
integration/mainstreaming to address climate change risks and/or opportunities. None of the
initiatives examined were systemically, or existentially, threatened by climate change, and in all
cases ways of addressing risks and opportunities could be identified, although such responses
general require further elaboration in the context of project design or implementation.

Programme or Project Budget (£) Time‐frame Priority
(risks)
Priority
(Opps.)
Existing Initiatives
Access to Finance 10,000,000 09/10‐12/13 2 2
Land Tenure Regularisation 20,000,000 09/10‐13/14 2 3
PPIMA 1,596,660 01/10‐01/13 2 2
Trade Mark East Africa Rwanda 16,000,000 10/11‐14/15 2 1
Vision Umerenge Programme 20,000,000 08/09‐12/13 2 1
BAR Initiatives
BAR Education 42,820,000 2 3
BAR Food, Nutrition & Vulnerability 18,400,000 2 1
BAR Governance & Security 45,970,000 3 3
BAR Health 19,100,000 3 3
BAR Wealth Creation 99,670,000 2 2
For the Advanced Market Commitment (AMC) which was classified as urgent in terms of risks, the
key issue is around new energy‐related infrastructure to be damaged by climate extremes, and
changes in stream‐flow associated with climate change to affect hydro power. These risks can be
addressed by ensuring physical risks to infrastructure are assessed and addressed and the
implications of climate change for the economic viability of hydro power are assessed.
For social protection and agriculture, risks are associated with the potential for climate change to
undermine intended outcomes, through impacts on livelihoods, incomes, and expenditure (e.g. on
food) which might mean that additional financial resources from cash transfers, credit or income
from public works is simply absorbed by higher household costs. Climate change has the potential
to affect production and food/nutrition, as well as investments in agriculture and related businesses.
Finally, it has the potential to affect transport networks. There are some risks for trade‐mark, as
climate change has the potential to affect local production, as well as global and regional patterns of
trade, commodity prices, and to interrupt trade via its impacts on transport networks within or
outside Rwanda. Note that there is potential for resilience building and adaptation, ensuring that
public works address issues related to adaptation and resilience (e.g. flood management systems,
soil and water conservation, development of novel agricultural techniques to confront new
conditions, etc.).
For education, risks were associated with potential physical damage to school buildings from climate
extremes, and potential climate change impacts on enrolment and attendance, particularly of girls,
for example through impacts on sanitation (e.g. during droughts and periods of water scarcity), and
on changing labour demands as climate change impacts on livelihoods.
For health, risks identified included potential physical damage to health centres from climate
extremes, disproportionate impacts of phenomena such as drought on women and girls, and less
efficient management of malaria through the bed net initiative due to shifting patterns of
endemicity and epidemic risk.
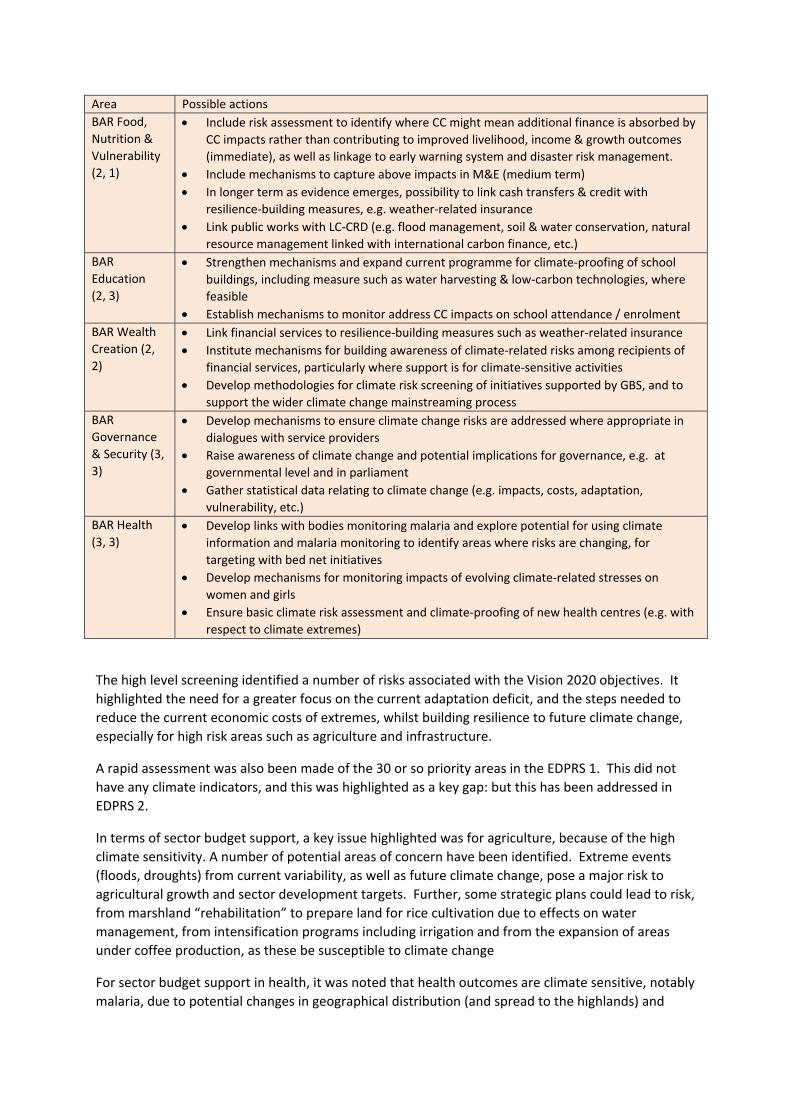
Area Possible actions
BAR Food,
Nutrition &
Vulnerability
(2, 1)
Include risk assessment to identify where CC might mean additional finance is absorbed by
CC impacts rather than contributing to improved livelihood, income & growth outcomes
(immediate), as well as linkage to early warning system and disaster risk management.
Include mechanisms to capture above impacts in M&E (medium term)
In longer term as evidence emerges, possibility to link cash transfers & credit with
resilience‐building measures, e.g. weather‐related insurance
Link public works with LC‐CRD (e.g. flood management, soil & water conservation, natural
resource management linked with international carbon finance, etc.)
BAR
Education
(2, 3)
Strengthen mechanisms and expand current programme for climate‐proofing of school
buildings, including measure such as water harvesting & low‐carbon technologies, where
feasible
Establish mechanisms to monitor address CC impacts on school attendance / enrolment
BAR Wealth
Creation (2,
2)
Link financial services to resilience‐building measures such as weather‐related insurance
Institute mechanisms for building awareness of climate‐related risks among recipients of
financial services, particularly where support is for climate‐sensitive activities
Develop methodologies for climate risk screening of initiatives supported by GBS, and to
support the wider climate change mainstreaming process
BAR
Governance
& Security (3,
3)
Develop mechanisms to ensure climate change risks are addressed where appropriate in
dialogues with service providers
Raise awareness of climate change and potential implications for governance, e.g. at
governmental level and in parliament
Gather statistical data relating to climate change (e.g. impacts, costs, adaptation,
vulnerability, etc.)
BAR Health
(3, 3) Develop links with bodies monitoring malaria and explore potential for using climate
information and malaria monitoring to identify areas where risks are changing, for
targeting with bed net initiatives
Develop mechanisms for monitoring impacts of evolving climate‐related stresses on
women and girls
Ensure basic climate risk assessment and climate‐proofing of new health centres (e.g. with
respect to climate extremes)
The high level screening identified a number of risks associated with the Vision 2020 objectives. It
highlighted the need for a greater focus on the current adaptation deficit, and the steps needed to
reduce the current economic costs of extremes, whilst building resilience to future climate change,
especially for high risk areas such as agriculture and infrastructure.
A rapid assessment was also been made of the 30 or so priority areas in the EDPRS 1. This did not
have any climate indicators, and this was highlighted as a key gap: but this has been addressed in
EDPRS 2.
In terms of sector budget support, a key issue highlighted was for agriculture, because of the high
climate sensitivity. A number of potential areas of concern have been identified. Extreme events
(floods, droughts) from current variability, as well as future climate change, pose a major risk to
agricultural growth and sector development targets. Further, some strategic plans could lead to risk,
from marshland “rehabilitation” to prepare land for rice cultivation due to effects on water
management, from intensification programs including irrigation and from the expansion of areas
under coffee production, as these be susceptible to climate change
For sector budget support in health, it was noted that health outcomes are climate sensitive, notably
malaria, due to potential changes in geographical distribution (and spread to the highlands) and

diarrhoea, which is a climate sensitive disease. There are also a number of indirect health outcomes
associated with climate variability (notably floods, droughts and malnutrition). It was highlighted
that the existing sector strategy does not include any discussion of climate change, and an initial
screening was needed.
Note that since the review, the nature of funding has changed in DFID Rwanda. Current Rwanda
DFID supports progress towards the MDGs, focusing on education, health, agriculture and social
protection. DFID is also stepping up support to the private sector. This includes boosting regional
trade, supporting economic growth and wealth creation, and supporting the government of Rwanda
to protect the poorest and the economy from the effects of a changing climate.
The uptake of these recommendations was reviewed in the country visit.
Identification of Potential End-Use Applications
Based on the context and review above, the study has considered a number of possible end‐use
applications.
Analysis of national development plans, i.e. EDPRS II, to investigate areas of climate resilience
highlighted, and to examine the adaptation decisions and information needs to support these
for future plans.
Analysis of Sector Strategic Plans, to investigate areas of climate resilience highlighted, and to
examine the adaptation decisions and information needs to support these for future plans.
Analysis of the adaptation options proposed in Rwanda’s Green Growth and Climate Resilience
National Strategy for Climate Change and Low Carbon Development, and to examine the
decisions involved for these options, and decision support needs.
Analysis of the use of climate information for the preparation and appraisal of projects for the
Rwandan National Climate Change Fund FONERWA, and future improvements to this for
resilience activities;
Analysis of the DFID office programmes, updating the climate risk screening, and investigating
the potential actions and supporting decision support and information needs.
These are discussed below.
EDPRS2
EDPRS II includes a number of areas that are particularly relevant in relation to medium‐long term
climate change adaptation including:
Investment in infrastructure (energy, road and rail transport, airport).
Facilitating urbanisation and promoting secondary cities.
Pursuing a ‘green economy’ approach to economic transformation (including green
urbanisation).
Increasing the Productivity of Agriculture by building on the sector’s comparative advantage,
with a focus on irrigation and land husbandry.
Improved Rural Infrastructure with interventions that include a feeder roads programme.

SectorStrategicPlans
There are a large number of SSPs, thus the key focus areas need to be identified.
The Energy Sector Strategic Plan (2012/2017, Ministry of infrastructure) is a priority, because of
the forthcoming hydro development schemes, and large overall projections in supply.
The Strategic Plan the Transformation of Agriculture in Rwanda – Phase III is also a priority.
There are also cross‐cutting SSPs that are relevant, with the five‐year strategic plan for the
Environment and Natural Resources Sector, the Meteo Rwanda sector strategic plan and DRM plans.
OptionsintheGreenGrowthandClimateResilienceNationalStrategyforClimateChangeandLowCarbonDevelopment
The list of key early interventions in the Green Growth and Climate Resilience Strategy do include
some interesting case studies, to look at adaptation decision making and information needs.
However, it is not clear that most of these are being operationalised, thus there is a question over
whether this is a priority area of focus.
FONERWA(NationalClimateFund)
The practical implementation of adaptation is progressing through the FONERWA fund and this
therefore represents a priority area.
DFIDofficeprogrammesandsectorbudgetsupport
The previous office climate screening (Climate Change Strategic Evaluation of the DFID Rwanda
Programme and Sector Budget support – see separate brief) identified the key areas to be social
protection, agriculture sector support, health sector support, hydro‐electricity and transport
infrastructure (via other programmes), and the infrastructure component of education. These
provide key focus areas, and have a strong overlap with the SSPs above.
Discussion
Many of the areas above have common risk elements, which then feed through to different
applications (geographically, or by sector). Starting with these risks provides an opportunity to look
at cross‐cutting issue, and then to drop down to a selection of end‐use applications and end‐users in
a number of areas, rather than focusing on single application. Such an approach is useful because it
provides coverage of different decisions and decision‐makers, and allows some analysis of the
differences in decision support and climate information needs (recognising that there is not a one‐
size‐fits‐all approach). The future risks of climate change in Rwanda can be very generically split into
changing trends (where there is more confidence in the direction of change) and changes in
extremes (which are highly uncertain).
In terms of changing trends, the key risks are likely to include:
Shifts to agro‐ecological zones and production, crop production, agricultural development and
export crops (tea and coffee);
Changes to water supply availability (implications for water availability for irrigation, etc.)
Changes in water run‐off and river flow for hydro‐electricity generation.

Shifts in disease prevalence, e.g. malaria areas, especially at higher altitudes.
Shifts to ecological zones, and effects on biodiversity and ecosystem services.
In terms of changes in extremes, the key risks are likely to include:
Changes to flood and drought risk hazards (severity and intensity)
Associated risks to infrastructure, particularly energy (hydro), transport and urban areas;
Risks to disaster risk management and social protection from changing extremes;
Changes in soil erosion rates and agricultural productivity from heavy precipitation.
Changes to water supply and demand, affecting rural development and integrated water
management.
A number of possible case studies have been selected.
Decision Context/Application 1. Analysis of decisions/options to address the adaptation deficit
(DRM‐Adaptation linkages) including the need to take account of current climate variability and
future climate change. This would look at the decision analysis supporting the identification and
implementation of ‘low‐regret’ options such as terracing, ecosystem based adaptation, climate‐
smart agriculture, early warning systems. The practical application / stakeholder group will be
based around the FONERWA climate fund, as the operational modality for many near‐term
options. This option will also provide valuable information of relevance for National Adaptation
Plans and information for developing and implementing such plans.
Decision Context/Application 2. Building adaptation into existing programmes, e.g. early
mainstreaming. This would look at the decision support for building resilience into existing
development activities. The practical application / stakeholder group will be DFID social
protection VUP programmes, and the emerging agricultural development plan sector budget
support.
Decision Context/Application 3. Climate risk screening and resilience building in infrastructure –
decision making under uncertainty (hydro, roads, irrigation, urban). This focuses on near‐term
decisions that will be exposed to climate change in the future. This would have a strong focus
on decision making under uncertainty. The practical application / stakeholder group will align to
the Sector Strategic Plans (Energy and potentially other sectors) and key end‐users would be
Government, and Development Partners through sector budget and programme support.
Decision Context/Application 4. Iterative risk management, focusing on long‐term future trends
and major risks. This will focus on future major risks (which do not yet exist) and examine the
potential for iterative risk management. The practical application / stakeholder group will align
to a more generic group (e.g. researchers, government, DPs). Possible examples being
considered are the long‐term shift in major cash crops (tea and coffee), or the emergence of
new malaria areas at altitude.
This involves a large number of areas. However, the proposal is not to undertake quantitative
analysis for these, but to highlight ‘what‐if’ scenarios in relation to risks, to examine the context for
the adaptation decision, to review the potential decision support tools that could be used for this
(working with stakeholders), and to then identify the climate information that is required.

Part 3: End-User Discussion Output
This section presents the end‐user discussion output (the first deliverable), detailing the key
applications and decisions, and results of qualitative (e.g. interviews and focus groups) and
quantitative (e.g. surveys and questionnaires) data collected before, during and after the in‐country
studies;
Interviews
A country visit was undertaken in June. A series of bi‐lateral meetings and interviews were held with:
Rwanda Environmental Management Authority (REMA) lead on climate fund / mainstreaming;
Rwanda Meteorological Agency;
Ministry of Agriculture;
Ministry of Infrastructure;
Ministry of Natural Resources;
Ministry of Disaster Management and Refugee Affairs;
Ministry of Local Development;
DFID office staff including climate, social protection, economic growth and agricultural
development advisors.
Other development partners including World Bank, KfW, European Union, UNDP, GIZ, GGGi.
Other organisations including World Food Programme, Access to Finance Rwanda (agricultural
insurance) and FEWSNET.
A full agenda is attached in the appendix.
Interview protocol
The interviews used the Case‐study guiding questions issued by CDKN, amending these to fit the
particular contexts.
To complement these interviews, the relevant documents for each end‐use application were
reviewed (i.e. the project appraisals, business cases, sector development plans), to provide
complementary information on the decision context, adaptation, and the use of climate information.
This explicitly reviewed the type of climate information being currently used, and reported in
relevant documentation.
Adaptation applications (end-use case studies)
The information was summarised into a set of adaptation applications (end‐uses). These were:
Mainstreaming of climate change in DFID office programme design and the consideration of
climate change information and adaptation in the DFID business case cycle (scoping, appraisal,
evaluation). This focused on key areas of DFID sector support, including social protection.
Applications to the National Climate Fund (FONERWA) and the appraisal and evaluation process,
i.e. the decision making context for project level adaptation appraisal.

Mainstreaming of climate change into national sector development plans – both at the co‐
ordinated cross‐Government level (mainstreaming guidelines) and in individual line ministries
(including inclusion of climate information and adaptation decisions in strategic environmental
assessment). These included in‐depth analysis on social protection, disaster management,
economic development, agricultural development, and energy.
National level climate change policy (and the emerging National Adaptation Plan), with the focus
on the decision making around strategic level adaptation appraisal.
Infrastructure appraisal (focused on the application of climate risk screening), with an in‐depth
analysis of hydro‐electricity and roads, and considering the use of climate information and
adaptation decisions in environmental impact assessment).
Inclusion of climate change in long‐term planning, with in‐depth analysis of green urbanisation
plans, agricultural land‐use and transformation plans, and long‐term water management plans.
For each of the interviews, the current decision context and the use of climate information was
discussed, along with future risks and adaptation plans, then future end‐use decisions and the
use/need for climate information was explored. This was complemented with a literature and
document review. The information is summarised below.
DFIDclimateofficemainstreaming
The first application explored was in the DFID Rwanda officer (interview with the climate advisor,
Sarah Love). The current major programmes are:
FONERWA
Social Protection (VuP);
Trade Mark East Africa (TMEA);
Education sector support (including education innovation fund, which has funded a number of
projects under a climate window.
The document analysis compared the DFID Rwanda Office climate risk screening undertaken in 2011,
and evaluated whether the risks identified had been translated through into the office programmes.
This found that while TMEA had undertaken some research to investigate climate issues (risks and
opportunities), VuP had not incorporated the recommendations.
The future programmes – and the application in terms of future business cases ‐ were:
Economic growth strategy
Increased TMEA
Agricultural development programme support
Climate Innovation Centre
Key results of the interview and document analysis are summarised below.
Decision Context
There are two places where the process of climate adaptation mainstreaming is formally included:
During the business case process – as part of the climate and environment assessment of the BC,
to consider risks and opportunities and any mitigating actions (normally prepared by the BC

analysts and forwarded to climate advisor to check, though in practice, support from climate
advisor);
As part of the annual review process, climate advisors are more involved and look at the section
on environment and climate risks, and can note recommendations.
Current use of climate information
The information for mainstreaming draws on existing information (e.g. Economics of CC in Rwanda,
office risk screening, Green Growth and Climate Resilience Strategy), with some information on
current risks from Maplecroft country profile. An analysis of existing climate information in business
cases (document review) found that the information was high level (focused on vulnerability and
impacts, not climate information).
While current climate variability and information is a priority, the main focus is on vulnerability
(hazards) rather than climate information. There are some sources (e.g. flood and landslide hazard
mapping).
The interview revealed that a key issue is that there is a need to rely on these existing information
because of time pressures, e.g. there is not sufficient time to re‐interpret. If condensed information
were available that had more succinct but relevant information then DFID would like to use this.
The information in the BC was also focused on single future projection, i.e. increasing floods and
droughts, i.e. there was no uncertainty. The reason for this was explored: due to the problem of
losing the message when communicating uncertainty, i.e. that it was important to get strong
message to government (so disregard uncertainty). It was also noted that the BC wants to present a
strong case, so a focus on uncertainty is not helpful in highlighting the positives of proposal. In
terms of information needs, the key indicators of relevance would be those that focus on possible
shocks to households – so flood risks, socio‐economic drought. This has implications for the
information needs.
Medium – long‐term elements and future information
A number of longer‐term aspects were identified in the VuP and agricultural programmes (see later).
FONERWA is short‐term but there is an issue of longer term sustainability of projects.
It was highlighted that the Government is already doing some relocation, i.e. from high risk areas
(the team visited one such site on a mountain in the north), so there is an issue of what information
could help government respond to future risks, to prevent long‐term threats.
There was a question of whether uncertainty could be included in future business cases. It was
highlighted that the BC on environment and CC does not do monetary valuation, but that there
should be a role for analysing evidence to see if alternatives are needed. However, it was
highlighted that there is not the time to do something more complicated, i.e. a pragmatic approach
to climate analysis and uncertainty is needed.
Case Study Analysis
For the DFID office, the key decision context is the mainstreaming of climate change risks and
adaptation into office programmes and sector budget support (this includes a number of the areas
where DFID provides development partner support), and thus the incorporation of these aspects
into the business case section on environment and climate change and in annual reviews (either
qualitatively, or quantitative to feed into the cost‐benefit analysis and value‐for‐money assessment).

To advance this there is a need for DFID Rwanda to have better climate information (at the moment
they rely on secondary sources) and to have some information that might allow consideration of
uncertainty (e.g. for sensitivity testing, for information to implement the Topic Centre guidance on
uncertainty) for medium to longer term risks.
SocialProtectionCase(Vision2020UmurengeProgramme[VUP])
DFID supports poor communities directly through its contribution to the Government of Rwanda’s
social protection programme, VUP (Interview Emmeline Skinner, social advisor). This large scale,
government led, social protection programme comprises four components (cash transfers (for those
unable to work, or for the poorest); public works (for those that can); financial services; underpinned
by community training and sensitisation) which are expected to provide a "staircase out of
poverty". The programme prioritises poor geographical areas and extremely poor households within
these.
Through its second phase of support (2013‐2016) DFID is providing £36.7m in financial aid and
technical assistance to strengthen social protection systems and increase coverage of the (extreme)
poor and vulnerable in Rwanda. The programme, managed by the Ministry of Local Government
(MINALOC) is also supported by EU (SBS) and World Bank (GBS), with TA contributions from UNICEF.
DFID’s support will contribute deliver:
1. Increased coverage of beneficiaries by VUP
2. Enhanced management of VUP by LODA and oversight by MINALOC
3. Strengthened social protection sector and updated policy framework
4. Improved measurement and visibility of social protection results and impact
The programme currently reaches 240 sectors, and intends to reach national scale for cash transfers
by 2015/16. In the July 2013‐June 2014 year of the programme it is expected that 57,000
households will benefit from direct support in 240 sectors. 33,000 households will benefit from cash
transfers from public works in 180 sectors. In previous years, DFID support has helped VUP to deliver
the results below.
No of beneficiaries 2009/10 2010/11 2011/12
Direct Support (hhs) 9,692 18,879 27,631
Public Works (hhs) 61,335 71,484 77,469
Financial services (individual loans) 55,675 53,228 55,326
The programme is strengthening its monitoring system, including sex disaggregation, to support
delivery of results for the extreme poor. A study on gender and poverty impact has been completed,
to advise the programme on how it can accelerate results for women, and female headed
households. Discussion is underway on the design and scope of a robust impact assessment to
understand the causal links between VUP and reductions in extreme poverty.
Key results of the interview and document analysis are summarised below.
Decision Context
The programme is not explicitly targeted at climate vulnerable areas, i.e. it is driven by poverty.

The public works provides around 40 days of paid work on average, but the payment (50000RS) is
lower than the estimated costs to a family of a major shock (250000RS). The public works includes
terracing (radical which involve major earthworks, is expensive and involves opportunity costs from
time lost and progressive which involves trees and ditches). It is not clear if one option has greater
resilience (in practice radical can cope with more extreme gradients). There are also some irrigation
channels (connecting communities with water) and feeder roads. Within the terraces, people are
told what to grow, so some mono‐cropping which reduces diversity and hedging. There has been no
investigation of whether existing public works are resilient to future climate, e.g. terraces.
The business case for VuP DFID support outlines the benefits of the programme in reducing current
vulnerability to climate variability. However, it does not account for the risks of climate change on
the programme itself, i.e. how changing variability might affect the outcomes and effectiveness of
the programme (e.g. negatively under increasing extremes). This was an issue picked up in the 2011
climate risk screening. The focus only on upsides is understandable, but highlights a challenge in BC
and government evaluation. Similarly, the targeting is not based on climate hazards, but there is geo
mapping which could be used, and there has been some discussion around targeted mapping – this
might be an issue for the future, i.e. targeting current or future risk areas. It was noted that the
Government is very target driven and anything that is a barrier to hitting targets is an issue.
Current and future climate information
It was highlighted that geo‐referenced current risks and future vulnerability mapping would be
useful – noting for the latter there is an issue of how to present uncertainty. The key aspect is to be
focus on something concrete to show government, noting the lack of information currently and the
need to simplify messages. It was also highlighted that better historic variability was also useful, and
that there is a need for enhanced monitoring. However, a key issue was over the interpretation of
data, i.e. they don’t want primary climate information; they want relevant indicator data to take to
government.
In the longer‐term, the key issue is for longer‐term social protection and graduation – and
government wants support here – and this could be an area for future decisions related to climate
change
In response, if there are more shocks due to climate, then the social protection response might need
more flexibility, e.g. as people are hit. The current system does not allow changes to provide cash
transfers to those at higher income levels, but what might be useful is flexibility to scale up after
shocks. Related to this, information is needed on what the future risks are, and how this might
affect medium‐long term social protection (i.e. graduation), i.e. what are the changes in trends and
potential impact on shocks. This might also cascade through to a greater focus on public works that
target resilience.
Case Study Analysis
For the social protection (VuP), the key risks are around possible changes (increases) in future
climate hazards (shocks), and how these might affect income levels and the level of social protection
needed (continuous and reactive), although with an additional issue of whether public works are
taking future climate change into account. In the medium‐long term, assuming continued socio‐
economic development, this may move to the consideration of the effects of climate change on
graduation. The adaptation decision context is related to the mainstreaming of climate risks into
sectoral development plans (and the link back to DFID through programme support). There is an
obvious need for climate change information on future changes in extremes, but also a linkage to

vulnerability and hazard / risk analysis to capture direct and indirect risks from these changes. The
case study will also draw on the analysis of Conway and Schipper (2011), who looked at social
protection and climate change in Ethiopia.
EconomicDevelopmentStrategy
A new economic development strategy is being prepared for Rwanda. The aim is to address current
challenges, i.e. low productivity, the need for commercialisation, more export growth , logistics,
urbanisation, population growth (interview Hashm Wasswa mulangwa DFID, private sector advisor).
The Government wants to achieve lot of this development with private sector.
There are some areas that are particularly relevant in terms of long‐term resilient, notably the
transport infrastructure plans which will help deliver the strategy (including major rail links ($5 Bill))
and a northern transport corridor. There is also a high push for green growth (low carbon), but an
issue that in practice the push is for exports and jobs.
A key issue is to get better information on the costs and benefits of climate change, noting the
economic focus is needed to make sure the discussion is in the same terms as the economic
development agenda, and to also include in the cost‐benefit analysis. It was highlighted that there
was some need for information here – but this might be even the early stage considerations to think
about climate risks and opportunities.
Case Study Analysis
For the economic growth strategy, a number of major risks are associated with the risks of climate
change in relation to key parts of the plan. These include the risks to major infrastructure, such as
new transport networks (decision context risk screening), the risk to key outcomes, such as
agricultural transformation and growth, and the potential for major lock‐in to future risks e.g.
through structural change, urbanisation plans, etc. The main focus is on economic climate impact
information, with the decision context around climate policy screening.
FONERWA
This end use application relates to the Rwanda climate and environment fund (FONERWA)
(Interviews Alex Mulisa and Jill Dynzynski).
Rwanda has an operational Environment and Climate Change Fund – FONERWA – a national basket
fund through which environment and climate change finance is channelled, programmed, disbursed
and monitored. The fund has been capitalised by DFID (for £22 million) along with funding provided
for the fund management team. The fund/team sit in REMA.
Funding rounds are held and applications progress through a project/ programme proposal
screening process (see figure below). The 6 key steps of the proposed screening process include:
(1) Submission of a Project Profile Document (PPD),
(2) Review for Eligibility Criteria,
(3) Preparation and Submission of Full Project Document (PD),
(4) Technical Appraisal and Short‐listing of PDs,
(5) Appraisal Review and
(6) Decision Making.

The first FONERWA round (in 2013) led to a large number of applications (hundreds) but only a small
number of these passed the screening process
A large number of the initial project applications were focused on resilience building. However,
most of these were focused on addressing current climate variability. Some of the strongest
applications included sustainable livelihoods considerations (with lasting income generation
potential), which contributed to the overall VFM and desirability through ensuring community
interest after the project‐funding period. An indicative list of the most popular proposed
interventions in applications to date included6:
• Riverbank and lakeshore protection/restoration
• Rooftop rainwater harvesting
• Erosion control and prevention (e.g. terracing, bamboo planting)
• Community conservation/capacity building programs for national parks
• Integrated land and water management
• Agroforestry and tree planting (plantation establishment and fruit trees)
• Ecosystem rehabilitation and watershed protection
• Community capacity building and awareness raising activities (targeting women/girls)
• Disaster management and relocation of communities in high‐risk zones
• Sustainable alternative livelihoods and non‐timber products.
• Radio programs (env./CC)
• Integrated agricultural systems
• Organic fertilizers
6 Source: FONERWA management team, survey results.

• Remote sensing surveys and use of other ICT for env/CC assessment
• Education programs for youth through school programs
• Rehabilitation and protection of dams
• Integrated ‘Green Villages’ for District demonstration
• Participatory forestry management programs
The first 5 approved projects (2013) were:
Rooftop Rainwater Harvesting in high density areas of Nyarugenge, Gasabo, Kicukiro, Musanze,
Nyabihu and Rubavu Districts (RWH)
Integrated Land and Water Management Project in Musanze
Sustainable Land Management and Environmental Rehabilitation for Poverty Reduction
Vulnerable ecosystem recovery programme towards climate change resilience
National e‐waste management strategy for Rwanda to support the establishment of sustainable
recycling industries
There is also a fund commitment to additional 8 projects (2014).
Akanyaru Watershed Protection Project
Karongi District integrated green village project
Construction and generation of biogas in 15 private schools
Supporting the Integration of Greening District Development Plans
Strengthening Meteo Rwanda's Weather and Climate Services to Support Development
Technical & Structural Studies For Incorporating Resource efficient and Environmentally friendly
Features into Family Homes at CACTUS GREEN PARK (CGP), Gasabo District, Kigali City.
Gaseke Mini‐Hydro Power Plant
Sustainable biodiversity: mapping and domesticating the mycological riches of Rwanda’s forests.
The project on strengthening Meteo Rwanda's Weather and Climate Services to Support
Development is particularly relevant. The aim of the project is to inform decision making at all levels
in Rwanda, and promote its understanding and application. It will achieve this by involving users in
the development of new services, making investments in improved observations, forecasting and
analysis, and introducing new communications channels. Aspects of delivery will be decentralised to
develop closer links with users at district, sub‐district and community levels.
Current use of information
Discussion with the FONERWA management team reviewed the use of existing climate information
in the broad applications – both in the management team and applications.
From a quantitative/analytical perspective, this was identified as one of the most prominent gap
areas in both PPD and PD applications. To date, the RNRA rooftop rainwater harvesting application
makes the strongest attempt to directly link climate related events (flash floods) to the proposed
intervention (RWH systems on roof tops in densely populated urban areas) through formal analysis.
The basis of this linkage and potential resilience benefits are supported by data from peer‐reviewed
research, and the on‐going work of a PhD student. More commonly, applications will draw
reference to national strategies (e.g. GGCRS, NAPA) that broadly highlight Rwanda’s vulnerability to
climate change and extreme events. Higher‐quality applications get more specific in citing trends
towards increased vulnerability in proposed intervention areas (e.g. increased flood‐drought cycles
in a particular District); however, analysis is usually not grounded in meteorological records or other
modelling analysis/reanalysis. Moreover, perceived increases to current climate variability are

characterised without a strong analytical evidence base, accompanied by qualitative linkages to
future climate change risks. There is some information available including a Rwanda Country
Situational Analysis (Alphonse Mutabazi, 2011).
Future information
Discussion with the FONERWA management team asked the question of what climate information
on a) current climate variability and b) future climate change would be useful for future fund
applications – at project level and extending to more sector based assessments from government.
The team responded that sector and sub‐national level information and knowledge products (for
climate information and services represent an area of future need. While seasonal forecasting work
tailored for some of these stakeholders (e.g. in agriculture) is available, more strategic analysis
would be useful to guide medium to long‐term development investment decision. The availability of
this information to potential project applicants (public and private) would potentially enhance
applicants’ understanding of linkages between resilience and development activities, and inform
more evidence‐based applications/investment.
The team responded that this intervention area is currently being looked at by Meteo Rwanda in
partnership with the UK Met Office, among other partners. Rwanda’s meteorological network of
automatic weather stations has been significantly strengthened in recent years to improve this and
other infrastructure destroyed after 1994. However, sector and sub‐national level information and
knowledge products represent an area of future need. There is currently a FONERWA supported
proposal that has been funded (See above). While seasonal forecasting work tailored for some of
these stakeholders (e.g. in agriculture) is available (Rwanda and the East African region), more
strategic analysis would be useful to guide medium to long‐term development investment decision.
Availing such information to potential project applicants (public and private) would potentially
enhance applicants’ understanding of linkages between resilience and development activities, and
inform more evidence‐based applications/investment.
Medium‐term applications
An additional issue is that FONERWA is designed so that it can consider the financing of the
additionality component of development projects, i.e. it is possible to apply for a fund to finance the
additional resilience aspects into baseline development projects. This would have a strong element
in looking at future resilience and would provide a key application for medium‐long‐term adaptation.
However, to date, there have been no such applications from the Ministries.
Case Study Analysis
For the FONERWA climate fund, the key decision context is on the appraisal process for adaptation
projects, and the inclusion of climate change information into project fund applications and the cost‐
benefit analysis that they are evaluated against. The analysis has shown the use of climate
projection information in recent applications is poor. A key issue is therefore around better climate
projection information (in a form that applicants can access and understand) – and it would also be
useful if this included uncertainty with guidance on how this should be considered in applications. As
this is a cross‐cutting fund, with competitive rounds, there are a large number of possible climate
change risks, though analysis of the existing applications indicates a high focus towards current
climate variability and extremes (e.g. rainfall variability, landslides, soil erosion and water
availability/droughts) and in turn, this leads to a focus on low‐regret adaptation options. There is
therefore a related information needs for how changes in extremes might affect future

hazards/risks/vulnerability. In the context of medium‐long term decisions, there are, however,
issues about how climate extremes may change (climate information) which should be considered in
current projects, e.g. in relation to the need for enhanced design (e.g. for terracing) or future major
risk areas.
ClimateResilienceMainstreaminginSectorDevelopmentPolicy
Rwanda has one of the most advanced climate mainstreaming processes in LDC government
(Interview Rose Mukankomeje). The future economic and development strategy for Rwanda is set
out in the Vision 2020 document. Vision 2020 aims to transform Rwanda from a subsistence
agriculture economy to a knowledge based society earning 900 USD per capita, making Rwanda a
middle income country by 2020. It is also highlighted that Rwanda has recently updated Vision 2020
to incorporate climate change, recognising that some adjustments were needed to ensure the Vision
could be delivered and aligned to the green growth and climate resilience vision (as outlined in
Rwanda’s Green Growth and Climate Resilience: National Strategy for Climate Change and Low
Carbon Development, 2011).
The Economic Development and Poverty Reduction Strategy (EDPRS) is the framework for achieving
Vision 2020. The first EDPRS (2007) covered the period 2008 to 2012. The strategy promoted three
flagship programmes: Sustainable Growth for Jobs and Exports, Vision 2020 Umurenge to release
the productive capacity of the poor in rural areas, and governance. The second EDPRS (RoR EDPRS,
2013) has thematic objectives of economic transformation; rural transformation; productivity and
youth employment; accountable governance; foundational issues (e.g. for macro‐economic stability,
sustainable population growth, food security, education, health care, rule of law, public financial
management, consolidating decentralisation).
EDPRS2 also has a number of cross cutting issues are also included, which are mainstreamed in
sector and district plans. These include these include seven areas. These include capacity building,
gender, regional integration, HIV,/AIDS, disability and social inclusion, and two areas that are
particularly relevant
Environment and climate change: major areas of attention will be mainstreaming environmental
sustainability into productive and social sectors and reducing vulnerability to climate change.
Disaster management includes investment in rapid response disaster management equipment,
early warning systems and awareness campaigns.
These objectives and cross‐cutting themes also cascade into the sector development plans and
master plans. This therefore leads to a key end‐user application around mainstreaming climate
change in sector development plans.
The mainstreaming process is advanced by the individual sectors, following guidance that has been
issued by the responsible authority for climate change (REMA) [with the Directorate for
Mainstreaming], and working through dedicated staff (interns) in each of the sector ministries.
Following this, there has also been an initiative to mainstream these aspects within the budgeting
process and the Ministry of Finance. This has included environment and climate mainstreaming in
the budget circular, as Annex 19 through the use of guidance. This provides a key entry point for
mainstreaming, aligning the mainstreaming activities to budget lines.
The mainstreaming guidance documents have therefore been reviewed, to look at the current
process for including adaptation and also in relation to the use of climate information.

Annex 19 provides guidelines, which can serve as tools to guide planning and budgeting processes in
order to ensure that national sustainable development goals are achieved. The use of these
guidelines is expected to benefit sectors and districts towards improved planning and
implementation of development plans in three major ways:
‐ Firstly, the regular review and update of the checklists offer a unique opportunity to central
and decentralized institutions to successfully integrate Environment and Climate change as a cross‐
cutting issue
‐ Secondly, these guidelines will take central and decentralized institutions through a
continuous process of harmonizing baseline data and national targets and therefore improve
progress monitoring towards the implementation of EDPRS II, as a whole.
‐ Thirdly, these guidelines lead to the creation of opportunities for institutions to access
flexible and sustainable financing through FONERWA; an operational fund that promotes
environmental sustainability, climate resilience and green growth.
The overall objective is to develop sustainable capacities to ensure that environment, climate
change and natural resources are utilized and managed productively in support of national
sustainable development.
The guidance is around 60 pages long, covering all sectors. An example is givn below.
Sectorial Climate change and Environmental issues
Strategic Program Sub-program/ MTEF. (To be updated at sector level)
Climate change and Environmental Outcome/Output indicators
Current data (To be updated at sector level)
Targets (To be updated at sector level)
Data Source
Frequency of data collection
Responsible institution
EDPRS Strategic outcome: 2.4.1, Vision 2020 indicator 38: % of population
with access to clean drinking water (within 500 m in rural areas and 200 m in
urban areas).
MININFRA
Districts
Reports
Annually MININFRA
EWSA
Districts
Rwanda has a good rainfall and a
dense hydrographical network.
However, the distribution of
drinkable water is still inadequate.
The rate of drinking water access
in the country is estimated at 7%,
but does not exceed 70% in the
rural areas. Water also constitutes
one of the limiting factors of
agricultural output and
productivity. Furthermore, it is
important to state that
unsustainable water use has
negative affected the energy
supply in the country.
This is for a great part the result of
the degradation of the wetlands as
a direct result of uncontrolled use
of water by other sectors, such as
the agricultural sector.
Water and
sanitation/
Access to
drinking water
and sanitation
% of water supply
projects having
included EIA in
their feasibility
studies
MININFRA
Districts
Annually MININFRA
EWSA
Districts
% of water supply
projects having
included
mitigation
measures for
negative
environmental
impacts in their
feasibility studies.
MININFRA
Districts
Annually MININFRA
EWSA
Districts
A review of the document identifies the targets are more explicit for the mitigation green growth
aspects: for adaptation there are still many gaps left for sectors to complete. A discussion with the
climate expert within REMA highlighted the need for downscaled multi‐model ensembles for
Rwanda, and ideally training on use of different models. This also revealed the important indicators,
e.g. high rainfall extremes (an example was where of 3 days of rain and 120 mm fell in July, usually
the dry season).
Case Study Analysis
This area involves the mainstreaming of climate change into development plans. The example
highlights an overarching framework to do this. More detailed sector programme areas are assessed
in other areas.
Otherrelevantactivities(NAPA,AF,NAP)
A number of other projects were highlighted as relevant. There is s NAPA project (for around $2
million) which is putting in place 22 automatic stations, and has an EWS component. Rwanda also
has a $10 million adaptation project with the adaptation fund on ‘Reducing Vulnerability to Climate
Change in North West Rwanda through Community Based Adaptation’.
Rwanda is in the process of developing a series of costed sector plans for green energy, agriculture
and integrated water resource management. These will form the main part of a National Adaptation
Plan (Interview Rose Mukankomeje).
In the absence of an example, the study reviewed the existing technical guidance on National
Adaptation Plans. The primary current policy focus in LDCs – as part of the UNFCCCC process ‐ is
around the development of National Adaptation Plans (NAPS).
The national adaptation plan (NAP) process was established under the Cancun Adaptation
Framework (CAF). It enables Parties to formulate and implement national adaptation plans (NAPs) as
a means of identifying medium‐ and long‐term adaptation needs and developing and implementing
strategies and programmes to address those needs. It is a continuous, progressive and iterative
process which follows a country‐driven, gender‐sensitive, participatory and fully transparent
approach (UNFCCC7). Through decision 1/CP.16, the Conference of the Parties (COP) has established
the NAP process for least developed country (LDC) Parties. Under it, LDC Parties are invited to
identify their medium‐ and long‐term adaptation needs and develop and implement strategies and
programmes to address these needs, building upon their experience in preparing and implementing
national adaptation programmes of action (NAPAs).
The NAPs represent a major extension beyond the NAPAs, the latter being associated with a process
for the LDCs to identify priority activities that respond to their urgent and immediate needs with
regard to adaptation to climate change ‐ those needs for which further delay could increase
vulnerability or lead to increased costs at a later stage (UNFCCC8). The NAPAs have focused on the
use of vulnerability assessment, and are project based and small‐scale, with most countries listing a
priority list of projects that total around £10 million (see the NAPA priority database9).
7 http://unfccc.int/adaptation/workstreams/national_adaptation_plans/items/6057.php 8 http://unfccc.int/adaptation/workstreams/national_adaptation_programmes_of_action/items/7567.php 9 http://unfccc.int/adaptation/workstreams/national_adaptation_programmes_of_action/items/4583.php

There are overview and technical guidelines for the NAP process, prepared by the Least Developed
Countries Expert Group (LEG), and based on the initial guidelines adopted at COP1810. The agreed
objectives of the national adaptation plan process are (LDC expert group, 2012a, b):
(a) To reduce vulnerability to the impacts of climate change, by building adaptive capacity and
resilience;
(b) To facilitate the integration of climate change adaptation, in a coherent manner, into relevant
new and existing policies, programmes and activities, in particular development planning processes
and strategies, within all relevant sectors and at different levels, as appropriate.
The guidance is framed around a cycle of adaptation that is similar to the PROVIA outline above.The
NAP process and the technical guidance (LEC, 2012) is based around four steps.
A. Lay the groundwork and address gaps. This step involves stocktaking on available information
and addressing capacity gaps, as well as understanding needs.
B. Preparatory elements. This step centres on the analysis of current and future climate change
scenarios and vulnerabilities, as well as identification, review and appraisal of adaptation options
at various aggregation levels. It also involves integrating climate change into national and
sectoral planning.
C. Implementation Strategies. This step in involves prioritisation of climate change adaptation in
national planning, and development of long‐term national adaptation implementation strategy.
It also includes enhancing capacity.
D. Reporting, monitoring and review.
While there is a section (in B) on climate information, this has a low focus on uncertainty and does
not provide specific information on data needs and interpretation.
It does, however, have a useful focus on focus on trends and indices that support planning and
decision making. It is highlighted that a major demand for climate information in Africa in the next
few years will be for NAPs.
10 http://unfccc.int/adaptation/workstreams/national_adaptation_programmes_of_action/items/7279.php
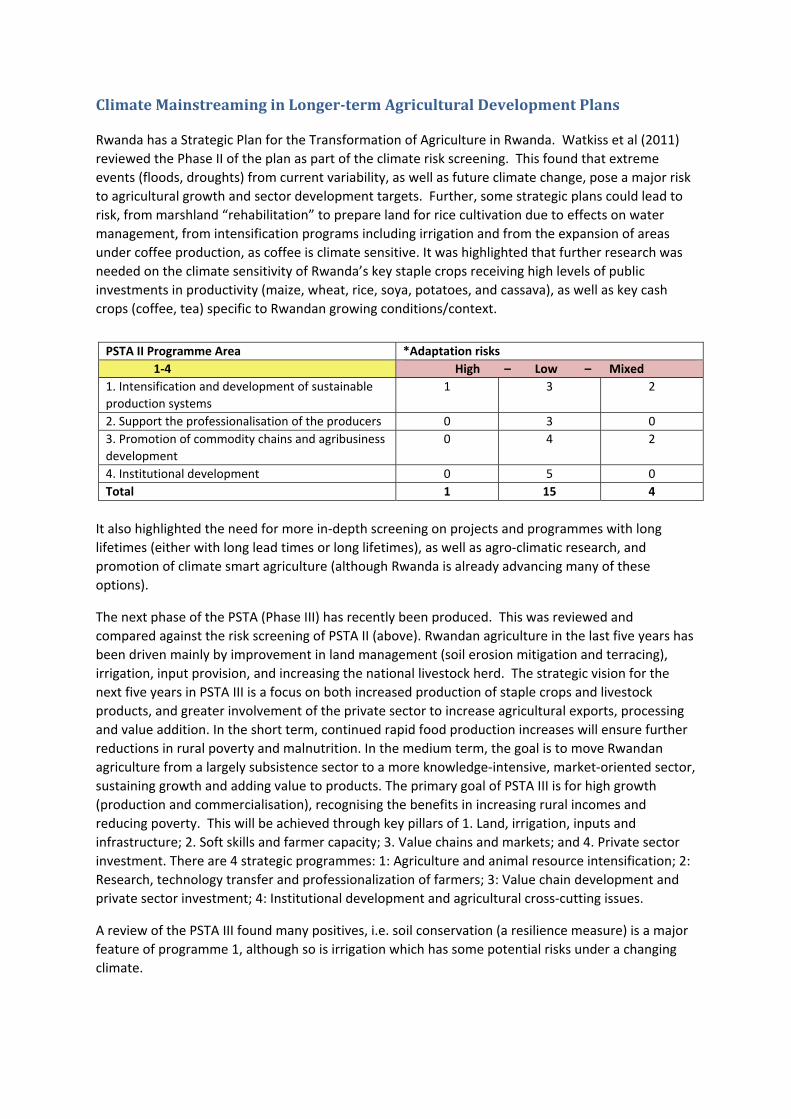
ClimateMainstreaminginLonger‐termAgriculturalDevelopmentPlans
Rwanda has a Strategic Plan for the Transformation of Agriculture in Rwanda. Watkiss et al (2011)
reviewed the Phase II of the plan as part of the climate risk screening. This found that extreme
events (floods, droughts) from current variability, as well as future climate change, pose a major risk
to agricultural growth and sector development targets. Further, some strategic plans could lead to
risk, from marshland “rehabilitation” to prepare land for rice cultivation due to effects on water
management, from intensification programs including irrigation and from the expansion of areas
under coffee production, as coffee is climate sensitive. It was highlighted that further research was
needed on the climate sensitivity of Rwanda’s key staple crops receiving high levels of public
investments in productivity (maize, wheat, rice, soya, potatoes, and cassava), as well as key cash
crops (coffee, tea) specific to Rwandan growing conditions/context.
It also highlighted the need for more in‐depth screening on projects and programmes with long
lifetimes (either with long lead times or long lifetimes), as well as agro‐climatic research, and
promotion of climate smart agriculture (although Rwanda is already advancing many of these
options).
The next phase of the PSTA (Phase III) has recently been produced. This was reviewed and
compared against the risk screening of PSTA II (above). Rwandan agriculture in the last five years has
been driven mainly by improvement in land management (soil erosion mitigation and terracing),
irrigation, input provision, and increasing the national livestock herd. The strategic vision for the
next five years in PSTA III is a focus on both increased production of staple crops and livestock
products, and greater involvement of the private sector to increase agricultural exports, processing
and value addition. In the short term, continued rapid food production increases will ensure further
reductions in rural poverty and malnutrition. In the medium term, the goal is to move Rwandan
agriculture from a largely subsistence sector to a more knowledge‐intensive, market‐oriented sector,
sustaining growth and adding value to products. The primary goal of PSTA III is for high growth
(production and commercialisation), recognising the benefits in increasing rural incomes and
reducing poverty. This will be achieved through key pillars of 1. Land, irrigation, inputs and
infrastructure; 2. Soft skills and farmer capacity; 3. Value chains and markets; and 4. Private sector
investment. There are 4 strategic programmes: 1: Agriculture and animal resource intensification; 2:
Research, technology transfer and professionalization of farmers; 3: Value chain development and
private sector investment; 4: Institutional development and agricultural cross‐cutting issues.
A review of the PSTA III found many positives, i.e. soil conservation (a resilience measure) is a major
feature of programme 1, although so is irrigation which has some potential risks under a changing
climate.
PSTA II Programme Area *Adaptation risks
1‐4 High – Low – Mixed
1. Intensification and development of sustainable
production systems
1 3 2
2. Support the professionalisation of the producers 0 3 0
3. Promotion of commodity chains and agribusiness
development
0 4 2
4. Institutional development 0 5 0
Total 1 15 4
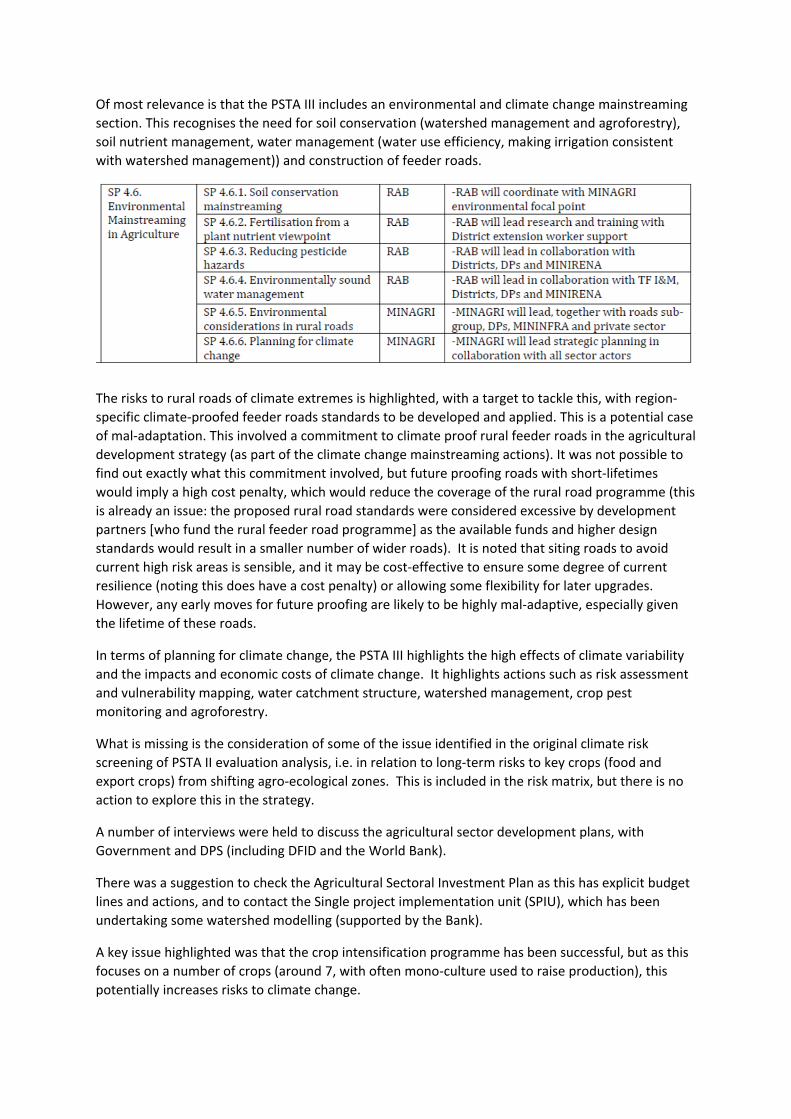
Of most relevance is that the PSTA III includes an environmental and climate change mainstreaming
section. This recognises the need for soil conservation (watershed management and agroforestry),
soil nutrient management, water management (water use efficiency, making irrigation consistent
with watershed management)) and construction of feeder roads.
The risks to rural roads of climate extremes is highlighted, with a target to tackle this, with region‐
specific climate‐proofed feeder roads standards to be developed and applied. This is a potential case
of mal‐adaptation. This involved a commitment to climate proof rural feeder roads in the agricultural
development strategy (as part of the climate change mainstreaming actions). It was not possible to
find out exactly what this commitment involved, but future proofing roads with short‐lifetimes
would imply a high cost penalty, which would reduce the coverage of the rural road programme (this
is already an issue: the proposed rural road standards were considered excessive by development
partners [who fund the rural feeder road programme] as the available funds and higher design
standards would result in a smaller number of wider roads). It is noted that siting roads to avoid
current high risk areas is sensible, and it may be cost‐effective to ensure some degree of current
resilience (noting this does have a cost penalty) or allowing some flexibility for later upgrades.
However, any early moves for future proofing are likely to be highly mal‐adaptive, especially given
the lifetime of these roads.
In terms of planning for climate change, the PSTA III highlights the high effects of climate variability
and the impacts and economic costs of climate change. It highlights actions such as risk assessment
and vulnerability mapping, water catchment structure, watershed management, crop pest
monitoring and agroforestry.
What is missing is the consideration of some of the issue identified in the original climate risk
screening of PSTA II evaluation analysis, i.e. in relation to long‐term risks to key crops (food and
export crops) from shifting agro‐ecological zones. This is included in the risk matrix, but there is no
action to explore this in the strategy.
A number of interviews were held to discuss the agricultural sector development plans, with
Government and DPS (including DFID and the World Bank).
There was a suggestion to check the Agricultural Sectoral Investment Plan as this has explicit budget
lines and actions, and to contact the Single project implementation unit (SPIU), which has been
undertaking some watershed modelling (supported by the Bank).
A key issue highlighted was that the crop intensification programme has been successful, but as this
focuses on a number of crops (around 7, with often mono‐culture used to raise production), this
potentially increases risks to climate change.

Case Study Analysis
For agricultural futures and development plans the key risk is from long‐term agro‐ecological shifts
from climate change and potential impacts on crop and export potential (coffee and tea). The
decision context is primarily based around future risks (long‐term, i.e. after 2030), thus is more
concerned with iterative climate risk management (risks of long‐term change, lock‐in, etc.). The
decision context is related to understanding these risks and preparing iterative programmes and
monitoring. The key climate information needs relate to future climatic shifts, especially related to
agro‐meteorological parameters, and possible thresholds for key crops (e.g. temperature tolerance
levels for coffee), with a high focus on uncertainty and information for iterative planning
(uncertainty information).
DisasterRiskReduction/Adaptation/RiskMapping
A number of meetings were held with the Disaster Risk Community, including UNDP and the
Government. An initiative is underway for multi‐hazard risk assessment ‐ covering drought, flood,
landslides, fire, earthquakes. At the moment this does not include future climate change
projections, but this is an obvious area to explore, i.e. linking climate information to existing multi‐
hazard risk assessment.
ClimateResilienceMainstreaminginDistrictDevelopmentPlans
The EDPRS also cascades down to local level through the District Development Plans. The interviews
explored this (interview Jon McCcartney, CDKN, leading Capacity Building for Climate Resilient for
Districts). There is a CDKN project that is looking at increasing climate resilience to these plans (with
3 districts as case studies), with the aim that in turn, these districts will apply to FONERWA for the
funds to help do this mainstreaming. A key issue is that capacity is very low, and there is a need to
consider how to simplify climate information.
Energy–NationalEnergyPolicy
There is an Energy Sector Strategic Plan (2012 – 2017) and a National Energy Policy Plan has just
been produced (draft 2014). This includes plans to increase generation (significantly) and with more
diversification focused primarily on green sources. This aligns to the green growth strategy, but also
is a diversification policy – partly related to over‐reliance on diesel (and to a lesser extent hydro –
and problems with previous drought years). As with all sector plans in Rwanda, this includes analysis
of the environmental and climate change. This includes a number of relevant issues, particularly for
hydro, as below.
Integrating expected rainfall and hydrological shifts into the planning, design, construction, and operations of Rwanda’s hydroelectric power facilities. As the dominant modern energy source in the country; hydropower generation, is likely to be the most directly affected by climate change, because it is sensitive to the amount, timing and geographical pattern of precipitation and temperature.11
MININFRA will ensure that major new energy investments and programs do not materially damage
the environment and natural habitats and take into account climate risks and adaptation strategies.
The main way that these issues are being incorporated is:
11 During 2004 and 2005, Rwanda suffered from a prolonged drought, drying up the seasonal rivers which were its primary
source of electric power. According to a UNECA report, the immediate impact of the situation was a doubling of electricity prices in the country.

At the policy level, through the consideration in the strategic environmental assessment being
undertaken of the energy policy (ongoing).
At the project level, for all projects undertaken by private developers of energy resources must
undertake an Environment and Social Impact Assessment.
The energy policy outlines a priority action to introduce controls and systems in energy infrastructure
planning and design processes to robustly address climate change and disaster risk management.
A number of interviews were held to discuss energy, and an analysis was made of the draft SEA and
some former EIAs. The draft SEA highlights the supply side risks from climate change (to biomass,
hydroelectricity) but only in qualitative terms.
A major omission is the consideration on the demand side (i.e. higher cooling and electricity demand
from higher temperatures, and increased water demand, which involves additional energy for
pumping and transfer for domestic supply and irrigation). The potential impacts of climate change
on thermal generation from temperature and cooling water availability are also omitted, as are
effects of higher temperatures and other risks on efficiency of transmission or some thermal station
efficiency.
A more detailed (older) environmental impact assessment does include quantitative analysis. This
was undertaken as part of a regional analysis (East Africa) as part of the Nile Basin Initiative (SNC and
Stratus, 2006). This assesses the impacts of climate change on hydro‐electricity stations from a
combination of changes in precipitation, run‐off and river flow, surface water evaporation, various
impacts from changes in variability (reduced run‐off due to droughts and increased run‐off due to
floods) and secondary effects such as impacts of siltration deposits and sedimentation. It considers
these impacts with storage based projects (dams) and run‐of‐river scheme (noting the impacts on
the two are different). In Rwanda, this included the 62 MW proposed (2012) Rusumo Falls project
on the Kagera river Burundi/Rwanda/Tanzania) and the 82 MW proposed (2014) Ruzizi III on the
Ruzizi river Rwanda/DRC.
The study looked at run‐off and storage‐yield. The analysis used a hydrological model and
considered two future scenarios, to represent a central and high projection, based on an analysis of
a large number of GCM outputs. The study highlights that while all models show warming, there is a
wide range of model projections of precipitation, including projected increases and decreases across
the models (with annual and seasonal variations) though for most of the study areas, the models
generally reported increases in precipitation and run‐off. The study looked at storage‐yield curves
(as well as run‐off), to show the amount of water storage necessary to provide a reliable amount of
water in each time period. Note that the wettest and driest models were selected, not the hottest
and coolest, for the analysis.
For the Rwanda/Uganda scheme, both models projected an increase in precipitation, even in dry
months, though it was noted that was less agreement among the models about seasonal changes
than annual changes in precipitation. The study also looked at the “signal to noise” (SNR) ratio for
precipitation to consider agreement.
For the Rwanda/Burundi scheme, the study found increased variability. It also suggested that larger
reservoir capacity schemes could better cope with increased variability (which was important as
under some scenarios, the shape of the storage yield curve changed. However, overall with a risk
analysis, the study considered that the level of change (especially in early years) was minimal. Note
that for other regions studied (notably in Tanzania) the dry models did indicate run‐off was reduced
to the point where the scheme viability could be affected. Alongside this, the study highlighted the
potential for increased flood flows in all regions. thus designs for flood discharge during construction
and over a permanent spillway should take this into account (noting this would increase project
costs).
The analysis highlights the need for detailed data as an input to the hydrological analysis (e.g.
seasonal or monthly data), and the need for detailed hydrological modelling analysis.
Case Study Analysis
For the hydro‐electricity sector, the key risks are around changes in river flows, affecting generation
output (or optimised output) as well as the risks of peak (high) flows causing damage. There are also
some secondary risks from soil erosion and siltation. The main decision context is around climate
risks screening, though this is centred in sector practice with strategic environment assessment
(overall energy policy and strategic) and environmental impact assessment (individual project/plant
appraisal). The main need for information is hydrological (and climate change – hydrological
output). There is more potential for adaptation decision making under uncertainty, with sensitivity
(range, agreement) as well as techniques such as robust decision making, real options, iterative
planning.
UrbanGreenGrowthandResilience
There is an ongoing initiative to develop Rwandan secondary cities as model green cities with green
economic opportunities.
The early work focused on two initiatives i) National Spatial Vision and Strategy for Green Growth
(focusing on development of secondary cities) and ii) Energy Efficient and Affordable Housing
(including a prototype housing design and the “passive design” in the Rwandan context and energy
efficiency measures in buildings and guideline for the future Green Building Code in Rwanda).
This recognises that land‐use and spatial development are critical in achieving low‐carbon growth, as
once cities grow and define their urban form, it is almost impossible to retrofit them as the built
environment is largely irreversible and very costly to modify. The project therefore aims to be an act
first project (rather than develop first and clean up later. The plan is to develop a roadmap for 6
secondary cities as model green cities. This includes low carbon and climate resilient planning, green
infrastructure, a local green economy, and integrated urban governance. However, the project is at
an early stage (especially with regard to the resilience elements).
Case Study Analysis
For green urbanisation (low carbon, climate resilient planning) the key risks are the potential
changes in the urban environment, notably around cooling degree days and temperature peaks, and
also hazard risk from urban flooding (riverine and flash floods) and landslides. The decision context
for natural hazards is related to understanding future hazard risks (risk mapping) and building
adaptation through resilience (siting, infrastructure risk screening, low cost resilience building). The
key climate information needs relate to changes in extremes events and future hazard information
(e.g. hazard maps), leading to risk screening and some resilience building (requiring analysis of
uncertainty). The heat context centres on changes in climate (notably cooling demand) and peak
temperatures (heat health thresholds), which involves changes in average and extremes, with
uncertainty also important and a high focus on uncertainty and information for iterative planning.

Mapping decision types to Iterative Adaptation
The type of longer‐term decisions and mapped below.
Case study Decision context Risk Timing Information needs
DFID office Programme and sector
support
(mainstreaming)
Business case
Annual review
CBA/VFM.
Multiple. Multiple. Harmonized projections
including uncertainty
information (and guide on how
to use).
FONERWA
climate fund
Project appraisal (low‐
regrets)
Project application
guidance including
CBA/VFM.
Multiple but
focus on
climate
extreme.
Primarily short‐
term though
some longer‐
term aspects.
Harmonized projections
including uncertainty
information (& guide on how to
use in project applications).
Hazard/vulnerability
information.
Social
protection
(VuP)
Programme
mainstreaming
(some infrastructure
through public works).
Mainstreaming indicators,
DFID analysis (see above).
Climate
extremes
(shocks).
Changing trends
(current) but
also possible
effects post
2020.
Harmonized projections
including uncertainty
information (and guide on how
to use).
Hazard/vulnerability
information.
Hydro‐
electricity
Climate risk screening
(infrastructure) – energy
policy to individual
projects.
Inclusion in EIA and SEA.
Changes in
river flow
(peak flows,
low season
flows,
variability)
Changing trends
through to
project lifetime
(primarily next
20 – 30 years,
but for major
plant,
potentially
longer).
Harmonized projections
hydrological analysis (stream
flow, extremes). Uncertainty
information on flows. Decision
making under uncertainty.
Green
urbanisation
plans
Risk mapping.
Infrastructure climate risk
screening.
Iterative climate risk
management.
Cooling
degree days
and peak
temperatures.
Climate
extremes
(flooding,
landslides).
Medium and
long‐term term.
Harmonized projections and
uncertainty analysis.
Monitoring. Thresholds. Risk
hazard information. Decision
making under uncertainty.
Long‐term
agriculture
planning
Iterative climate risk
management
Agro‐
ecological
shifts and
other shifts
(variability,
pest and
disease, etc.).
Longer‐term
(2030 and
beyond).
Harmonized projections and
uncertainty analysis. Threshold
levels. Monitoring. Agro‐
meteorological information.
Decision making under
uncertainty.

Part 4: End-User Analysis
Hydrological analysis
Initial review of user needs of climate information
An initial review of user need for climate information has been undertaken. The assessment builds
on international project experience, especially in Africa, as well as findings from the initial interviews
in Rwanda.
The initial interviews demonstrate a requirement for different types of information, as well as
specific requests. Currently available climate data is limited, but the requirement for raw climate
information is also limited, with users generally preferring processed information (e.g. downscaled,
indicators) or the output of vulnerability and impact assessments (including mapping). However, the
former is used in producing the latter, and therefore there is a need to check the availability of such
data. The use of multi‐model ensemble projections is more robust but single projections can be
preferred as it is perceived that the latter facilitates the promotion of a particular view or business
case; this can be a legitimate approach (e.g. if adopting a risk adverse stance) but requires a view or
analysis of a fuller set of projections. Related to this, interviewees stated that including uncertainty
would require a pragmatic approach as users have limited time (and guidance would also be
required). Sector and sub‐national information is preferred, including downscaled data. A number
of specific themes were identified including in relation to agriculture, flood risk, drought and energy
demand and generation. Extremes were highlighted by many users as being important.
Climate information requirements from case studies
Type of requirement Requirement
Products Future changes in extremes
Downscaled multi‐model ensembles
Key indicators
Vulnerability and impacts including mapping (for present and future)
Availability Better availability (existing / available sources limited)
Uncertainty Multi‐model projections (as a starting point)
Uncertainty information (supported by a pragmatic, time‐efficient approach)
Domain Sector and sub‐national level information
Specifics Sensitivity and thresholds for key staple and cash crops
Landslides
High rainfall extremes
Detailed hydrological analysis for flood risk and drought assessment supported by
detailed input data
Climate‐related water demand
Climate impacts on power generation including hydro‐electric (reservoir storage yield;
low river flows) and distribution (water availability/variability, direct temperature,
cooling water availability, electricity distribution, generation efficiency)
Cooling degree days and temperature peaks (heat health thresholds)
Other Training on climate models
Guidance on managing uncertainty
The table beow illustrates the climate data requirements by theme, as elucidated from the
sensitivity, end user requirements and any processing required (e.g. modelling). This extends the

analysis above to look at specific data requirements as well as processing needs. Non‐climate data
needs are also identified.

Table Y Climate and non‐climate data requirements for key themes [does not include seasonal forecasting]
Theme Sensitivity End user
requirements
Processing Climate data requirements Non‐climate data requirements
Historical Future Historical Future
Water
resources
Rainfall including
inter‐annual
variability;
evaporation
(temperature).
Source yield
(average and dry
year)
Drought frequency
Dry year demand
Drought monitoring
and management
Hydrological
modelling: rainfall‐
runoff; recharge;
groundwater
Resource modelling
Demand forecasting
(Supply‐demand
balance)
Long‐term daily to
monthly rainfall
Variables for
calculation of PET
and open water
evaporation (for
large lakes)
Multiple
projections of
future change in
monthly rainfall
and PET/temp.;
change in inter‐
annual variability*
Demand:
domestic,
industrial,
agricultural
Population
growth; change in
industrial
demand;
cropping changes
Irrigation Rainfall; evapo‐
transpiration
Crop demand
Water resource
availability
Crop modelling Long‐term daily to
monthly rainfall
Variables for PET
calculation
Multiple
projections of
future change in
monthly rainfall
and PET/temp.;
change in inter‐
annual variability*
Historical crop
regime
Cropping changes
Hydro‐
generation
Rainfall amount and
variability;
evaporation
(temperature)
Sedimentation
Source (reservoir)
yield
Low river flows
(run‐of‐river)
Rainfall‐runoff
modelling
Storage‐yield
relationships
Sediment modelling
Long‐term
historical monthly
rainfall
Variables for
calculation of PET
and open water
evaporation
Multiple
projections of
future change in
monthly rainfall
and PET/temp.;
change in inter‐
annual variability*
Other demands Other demands;
land‐use change
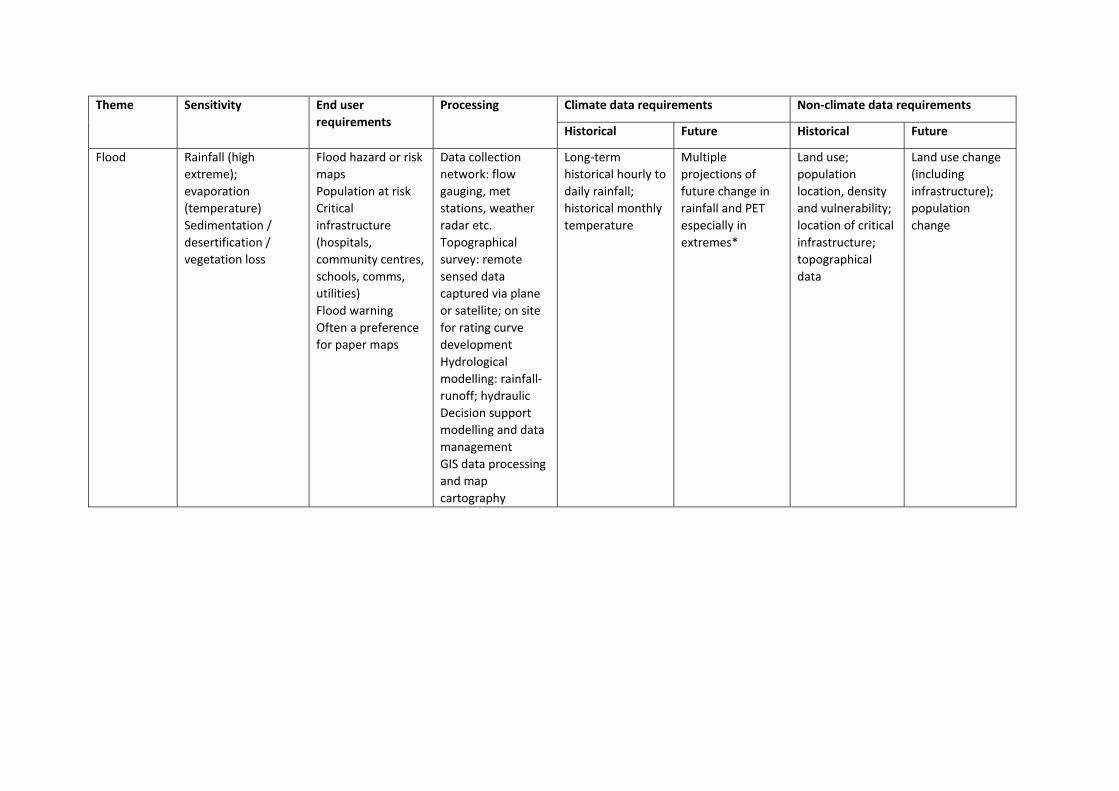
Theme Sensitivity End user
requirements
Processing Climate data requirements Non‐climate data requirements
Historical Future Historical Future
Flood Rainfall (high
extreme);
evaporation
(temperature)
Sedimentation /
desertification /
vegetation loss
Flood hazard or risk
maps
Population at risk
Critical
infrastructure
(hospitals,
community centres,
schools, comms,
utilities)
Flood warning
Often a preference
for paper maps
Data collection
network: flow
gauging, met
stations, weather
radar etc.
Topographical
survey: remote
sensed data
captured via plane
or satellite; on site
for rating curve
development
Hydrological
modelling: rainfall‐
runoff; hydraulic
Decision support
modelling and data
management
GIS data processing
and map
cartography
Long‐term
historical hourly to
daily rainfall;
historical monthly
temperature
Multiple
projections of
future change in
rainfall and PET
especially in
extremes*
Land use;
population
location, density
and vulnerability;
location of critical
infrastructure;
topographical
data
Land use change
(including
infrastructure);
population
change

Theme Sensitivity End user
requirements
Processing Climate data requirements Non‐climate data requirements
Historical Future Historical Future
Landslide Rainfall; storm
events; temperature;
evapotranspiration
Slope drainage
conditions
River levels and
potential for erosion
of river banks and
side slopes
Geology and
geomorphology of
the landslide and
surrounding slopes
Land use and
vegetation cover
Geomorphological
and geological
mapping of known
landslides
Assessment of
landslide activity;
assessment of
vulnerability to
landslide activity;
assessment of
landslide
susceptibility,
hazard and risk
Slope monitoring
Communication to
vulnerable
communities
Design of landslide
mitigation or
remedial measures
Geomorphological
and geological field
mapping of the
landslides and
surrounding area
Interpretation of
aerial photography
and/or satellite
imagery
Monitoring of the
landslide and
surrounding slopes
Intrusive ground
investigation
Slope stability
analysis
Numerical
modelling
Long‐term
historical daily
rainfall records
Groundwater
levels
Multiple
projections of
future change in
rainfall and PET
especially in
extremes*
Land use;
population
location, density
and vulnerability;
location of critical
infrastructure;
topographical
data
Land use change
(including
infrastructure);
population
change

Theme Sensitivity End user
requirements
Processing Climate data requirements Non‐climate data requirements
Historical Future Historical Future
Soil erosion Rainfall; storm
events; temperature;
evapotranspiration
Slope drainage
conditions
River levels and
potential for erosion
of river banks and
side slopes
Soils and
geomorphology of
the area and
surrounding slopes
Land use and
vegetation cover
Soils and
geomorphological
mapping of affected
areas
Assessment of
erosion
Slope monitoring;
Soils and
geomorphological
field mapping of the
affected areas and
surrounding area
Interpretation of
aerial photography
and/or satellite
imagery
Monitoring of the
affected areas and
surrounding slopes
Intrusive ground
investigation
Numerical
modelling
Rainfall‐runoff
modelling
Long‐term
historical daily
rainfall records
Groundwater
levels
Multiple
projections of
future change in
rainfall and PET
especially in
extremes*
Land use;
topographical
data
Land use change
Urban
resilience
Temperature
(cooling; heating)
Extreme short‐
duration rainfall
(flash floods)
(River floods;
landslides – see
above)
Heating degree
days; cooling
degree days; days
over infrastructure‐
related thresholds
Flood and landslide
hazard or risk maps
Thermal comfort
survey / modelling;
threshold
identification (e.g.
design or
operational)
Flood modelling
(see above) and
sewer modelling;
high runoff
coefficients
Historical daily
minimum and
maximum
temperature;
hourly rainfall
Multiple
projections of
future change in
temperature
especially
extremes*;
stochastic
information useful
Land use; land‐
use policies;
building
standards;
sewer/drain
maps/models
Land use change;
population
change

Theme Sensitivity End user
requirements
Processing Climate data requirements Non‐climate data requirements
Historical Future Historical Future
Roads Temperature
extremes
Soil moisture deficit
Fire
Extreme short‐
duration rainfall
(flash floods)
(River floods;
landslides – see
above)
Damage costs;
delay costs;
number, location of
closures
Flood and landslide
hazard or risk maps
Threshold
identification (e.g.
design or
operational)
Soil moisture
modelling
Fire risk modelling
Flood modelling
(see above); high
runoff coefficients
Historical daily
minimum and
maximum
temperature;
historical hourly
and daily rainfall
Multiple
projections of
future change in
temperature and
rainfall, especially
extremes
including
persistent events*
Average and peak
traffic densities,
including HGVs;
maintenance and
damage costs;
economic cost of
delays or
closures; land use
Traffic
projections; land
use change
*Climate model limitations
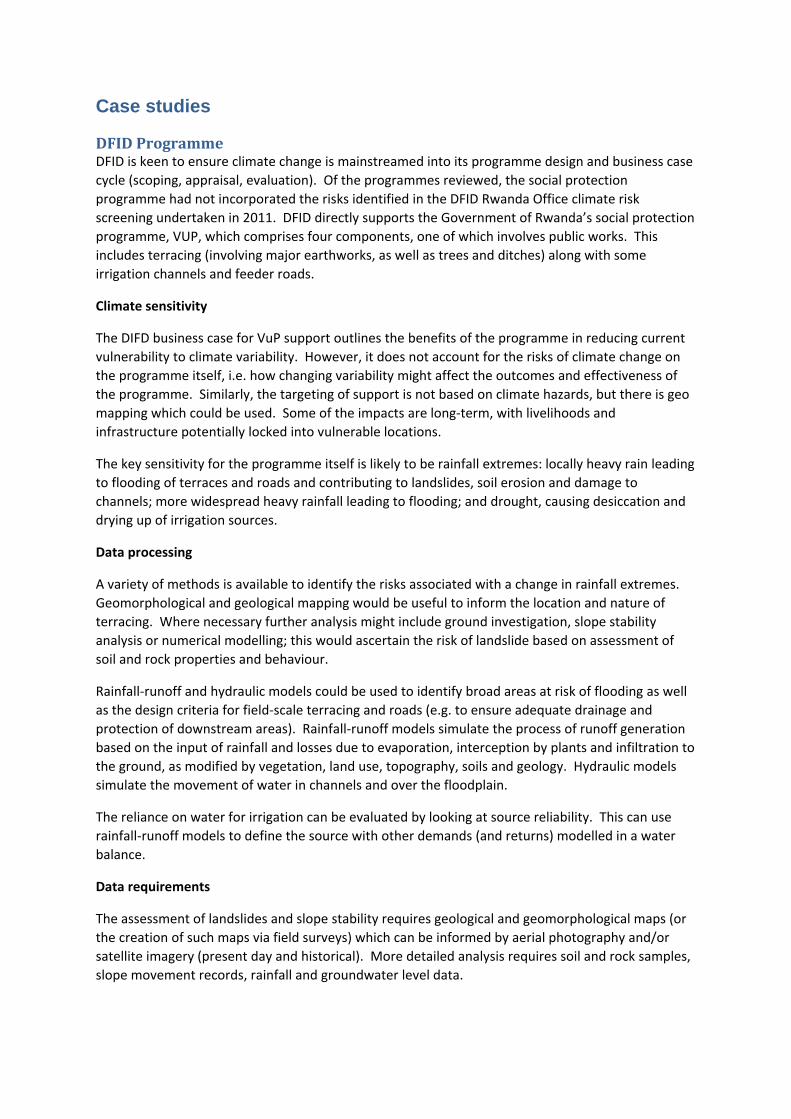
Case studies
DFIDProgrammeDFID is keen to ensure climate change is mainstreamed into its programme design and business case
cycle (scoping, appraisal, evaluation). Of the programmes reviewed, the social protection
programme had not incorporated the risks identified in the DFID Rwanda Office climate risk
screening undertaken in 2011. DFID directly supports the Government of Rwanda’s social protection
programme, VUP, which comprises four components, one of which involves public works. This
includes terracing (involving major earthworks, as well as trees and ditches) along with some
irrigation channels and feeder roads.
Climate sensitivity
The DIFD business case for VuP support outlines the benefits of the programme in reducing current
vulnerability to climate variability. However, it does not account for the risks of climate change on
the programme itself, i.e. how changing variability might affect the outcomes and effectiveness of
the programme. Similarly, the targeting of support is not based on climate hazards, but there is geo
mapping which could be used. Some of the impacts are long‐term, with livelihoods and
infrastructure potentially locked into vulnerable locations.
The key sensitivity for the programme itself is likely to be rainfall extremes: locally heavy rain leading
to flooding of terraces and roads and contributing to landslides, soil erosion and damage to
channels; more widespread heavy rainfall leading to flooding; and drought, causing desiccation and
drying up of irrigation sources.
Data processing
A variety of methods is available to identify the risks associated with a change in rainfall extremes.
Geomorphological and geological mapping would be useful to inform the location and nature of
terracing. Where necessary further analysis might include ground investigation, slope stability
analysis or numerical modelling; this would ascertain the risk of landslide based on assessment of
soil and rock properties and behaviour.
Rainfall‐runoff and hydraulic models could be used to identify broad areas at risk of flooding as well
as the design criteria for field‐scale terracing and roads (e.g. to ensure adequate drainage and
protection of downstream areas). Rainfall‐runoff models simulate the process of runoff generation
based on the input of rainfall and losses due to evaporation, interception by plants and infiltration to
the ground, as modified by vegetation, land use, topography, soils and geology. Hydraulic models
simulate the movement of water in channels and over the floodplain.
The reliance on water for irrigation can be evaluated by looking at source reliability. This can use
rainfall‐runoff models to define the source with other demands (and returns) modelled in a water
balance.
Data requirements
The assessment of landslides and slope stability requires geological and geomorphological maps (or
the creation of such maps via field surveys) which can be informed by aerial photography and/or
satellite imagery (present day and historical). More detailed analysis requires soil and rock samples,
slope movement records, rainfall and groundwater level data.
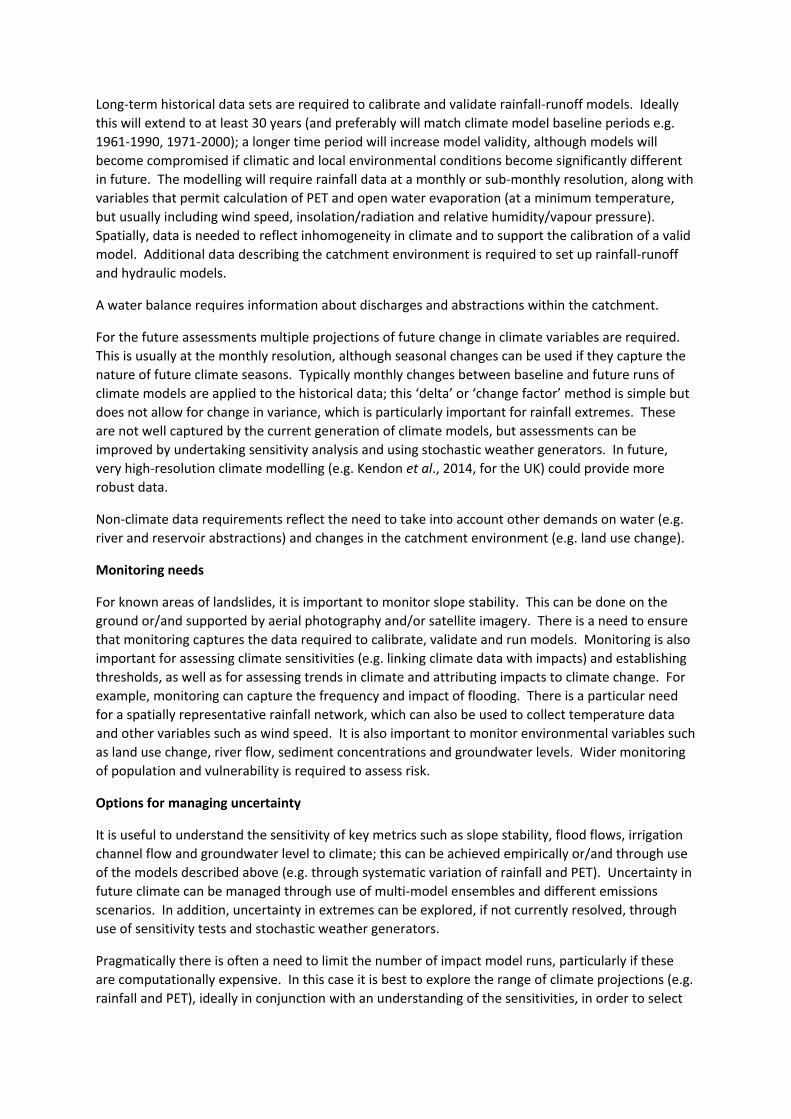
Long‐term historical data sets are required to calibrate and validate rainfall‐runoff models. Ideally
this will extend to at least 30 years (and preferably will match climate model baseline periods e.g.
1961‐1990, 1971‐2000); a longer time period will increase model validity, although models will
become compromised if climatic and local environmental conditions become significantly different
in future. The modelling will require rainfall data at a monthly or sub‐monthly resolution, along with
variables that permit calculation of PET and open water evaporation (at a minimum temperature,
but usually including wind speed, insolation/radiation and relative humidity/vapour pressure).
Spatially, data is needed to reflect inhomogeneity in climate and to support the calibration of a valid
model. Additional data describing the catchment environment is required to set up rainfall‐runoff
and hydraulic models.
A water balance requires information about discharges and abstractions within the catchment.
For the future assessments multiple projections of future change in climate variables are required.
This is usually at the monthly resolution, although seasonal changes can be used if they capture the
nature of future climate seasons. Typically monthly changes between baseline and future runs of
climate models are applied to the historical data; this ‘delta’ or ‘change factor’ method is simple but
does not allow for change in variance, which is particularly important for rainfall extremes. These
are not well captured by the current generation of climate models, but assessments can be
improved by undertaking sensitivity analysis and using stochastic weather generators. In future,
very high‐resolution climate modelling (e.g. Kendon et al., 2014, for the UK) could provide more
robust data.
Non‐climate data requirements reflect the need to take into account other demands on water (e.g.
river and reservoir abstractions) and changes in the catchment environment (e.g. land use change).
Monitoring needs
For known areas of landslides, it is important to monitor slope stability. This can be done on the
ground or/and supported by aerial photography and/or satellite imagery. There is a need to ensure
that monitoring captures the data required to calibrate, validate and run models. Monitoring is also
important for assessing climate sensitivities (e.g. linking climate data with impacts) and establishing
thresholds, as well as for assessing trends in climate and attributing impacts to climate change. For
example, monitoring can capture the frequency and impact of flooding. There is a particular need
for a spatially representative rainfall network, which can also be used to collect temperature data
and other variables such as wind speed. It is also important to monitor environmental variables such
as land use change, river flow, sediment concentrations and groundwater levels. Wider monitoring
of population and vulnerability is required to assess risk.
Options for managing uncertainty
It is useful to understand the sensitivity of key metrics such as slope stability, flood flows, irrigation
channel flow and groundwater level to climate; this can be achieved empirically or/and through use
of the models described above (e.g. through systematic variation of rainfall and PET). Uncertainty in
future climate can be managed through use of multi‐model ensembles and different emissions
scenarios. In addition, uncertainty in extremes can be explored, if not currently resolved, through
use of sensitivity tests and stochastic weather generators.
Pragmatically there is often a need to limit the number of impact model runs, particularly if these
are computationally expensive. In this case it is best to explore the range of climate projections (e.g.
rainfall and PET), ideally in conjunction with an understanding of the sensitivities, in order to select

specific climate projections for analysis. Additionally, historical data series are often short and more
recent than climate model baseline periods, requiring assumptions or adjustments to change
factors; in this case it is useful to compare the climate model baseline period with the available
observed model.
ProjectappraisalProject appraisal applies both at the generic and specific level.
At the generic level, Rwanda has an operational Environment and Climate Change Fund – FONERWA
– a national basket fund through which environment and climate change finance is channelled,
programmed, disbursed and monitored. Funding rounds are held and applications progress through
an appraisal and evaluation process. FONERWA is also designed so that it can consider the financing
of the additionality component of development projects, i.e. it is possible to apply for a fund to
finance the additional resilience aspects into baseline development projects. However, to date,
there have been no such applications from the Ministries.
At the more specific level, infrastructure projects require appraisal of climate risks in relation to
planning and design. In this case study we focus on road infrastructure (the next case study
examines hydro‐electric power).
Climate sensitivity
Many of the projects proposed for funding under FONERWA are focussed on climate resilience, and
some of these – and others – are climate sensitive. However, analyses in support of proposals are
usually not grounded in meteorological records or other modelling analysis. Sensitivities vary in
relation to the project, but based on previous proposals usually relate to rainfall extremes and
impacts of flooding, drought, landslide and soil erosion.
Paved roads are sensitive to temperature extremes (high extremes can ‘melt’ roads), soil moisture
deficit (which causes subsidence and pavement cracking), fire (which restricts access) and extreme
short‐duration rainfall (which causes inundation). Roads, like other infrastructure, are also sensitive
to landslides, floods and erosion (which can bury or wash them away).
Data processing
Project appraisal is likely to require a variety of information products in order to evaluate potential
climate risks. Checklists can be useful to ensure relevant hazards are considered (e.g. EC, 2011).
These can be supported by downscaled climate projections as well as a variety of impact data e.g.
flood risk maps, landslide risk maps. Ultimately, and in proportion to the project investment, a
detailed risk assessment may be required.
In terms of infrastructure such as roads, it is useful to establish climate‐related thresholds that
describe the design or operational tolerances. For example, the temperature above which road
surfaces ‘melt’ or the rainfall storms which roads can cope with; for example in England road
drainage balancing ponds must cope with a 1 in 100 storm (plus a climate change allowance of 20%).
Specific modelling can be used to assess the future risk or frequency of exceeding such thresholds. It
is also possible to construct empirical or physical models of soil moisture, which can be related to
road subsidence, as well as empirical models of fire risk.
Data requirements
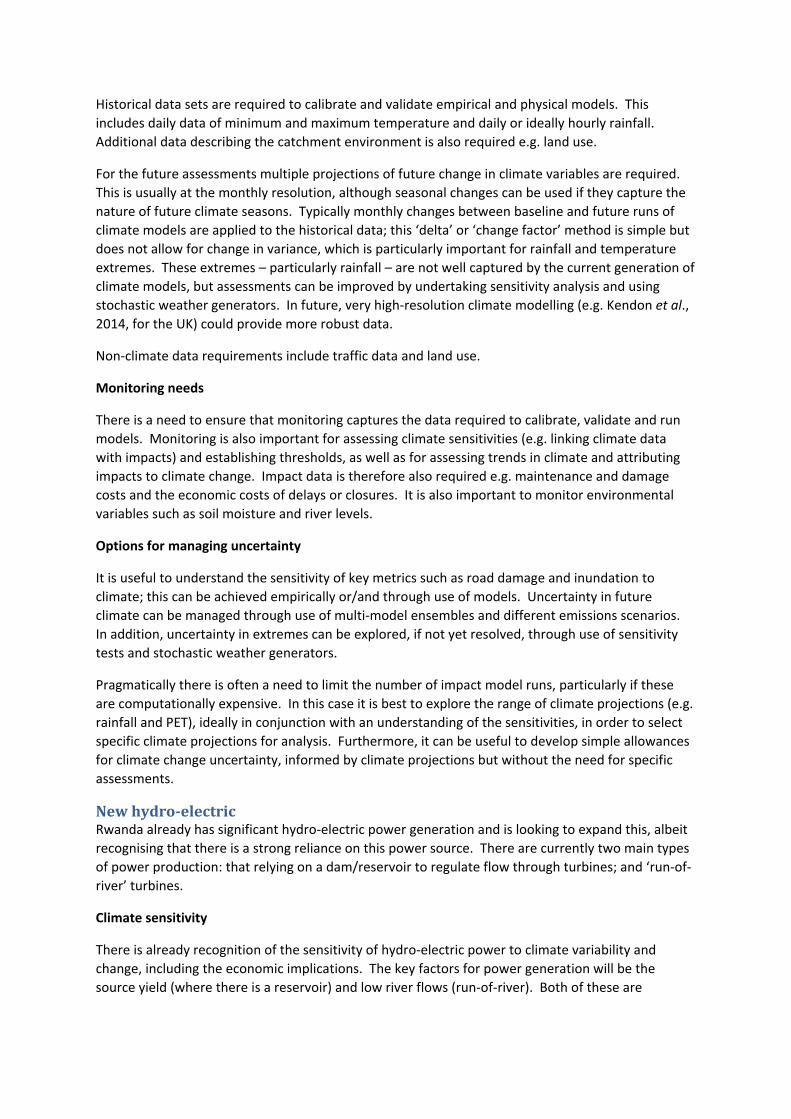
Historical data sets are required to calibrate and validate empirical and physical models. This
includes daily data of minimum and maximum temperature and daily or ideally hourly rainfall.
Additional data describing the catchment environment is also required e.g. land use.
For the future assessments multiple projections of future change in climate variables are required.
This is usually at the monthly resolution, although seasonal changes can be used if they capture the
nature of future climate seasons. Typically monthly changes between baseline and future runs of
climate models are applied to the historical data; this ‘delta’ or ‘change factor’ method is simple but
does not allow for change in variance, which is particularly important for rainfall and temperature
extremes. These extremes – particularly rainfall – are not well captured by the current generation of
climate models, but assessments can be improved by undertaking sensitivity analysis and using
stochastic weather generators. In future, very high‐resolution climate modelling (e.g. Kendon et al.,
2014, for the UK) could provide more robust data.
Non‐climate data requirements include traffic data and land use.
Monitoring needs
There is a need to ensure that monitoring captures the data required to calibrate, validate and run
models. Monitoring is also important for assessing climate sensitivities (e.g. linking climate data
with impacts) and establishing thresholds, as well as for assessing trends in climate and attributing
impacts to climate change. Impact data is therefore also required e.g. maintenance and damage
costs and the economic costs of delays or closures. It is also important to monitor environmental
variables such as soil moisture and river levels.
Options for managing uncertainty
It is useful to understand the sensitivity of key metrics such as road damage and inundation to
climate; this can be achieved empirically or/and through use of models. Uncertainty in future
climate can be managed through use of multi‐model ensembles and different emissions scenarios.
In addition, uncertainty in extremes can be explored, if not yet resolved, through use of sensitivity
tests and stochastic weather generators.
Pragmatically there is often a need to limit the number of impact model runs, particularly if these
are computationally expensive. In this case it is best to explore the range of climate projections (e.g.
rainfall and PET), ideally in conjunction with an understanding of the sensitivities, in order to select
specific climate projections for analysis. Furthermore, it can be useful to develop simple allowances
for climate change uncertainty, informed by climate projections but without the need for specific
assessments.
Newhydro‐electricRwanda already has significant hydro‐electric power generation and is looking to expand this, albeit
recognising that there is a strong reliance on this power source. There are currently two main types
of power production: that relying on a dam/reservoir to regulate flow through turbines; and ‘run‐of‐
river’ turbines.
Climate sensitivity
There is already recognition of the sensitivity of hydro‐electric power to climate variability and
change, including the economic implications. The key factors for power generation will be the
source yield (where there is a reservoir) and low river flows (run‐of‐river). Both of these are
dependent on rainfall amount and variability, and also to evaporation within the catchment and
directly from reservoirs.
In addition, both types are potentially sensitive to flooding, which can damage in‐stream and
broader infrastructure, especially if the flood waters contain significant sediment and boulders.
Sedimentation (from routine runoff and floods) is a major problem for hydro‐electric power in
Rwanda and more generally, decreasing the capacity of reservoirs as well as affecting the operation
of turbines.
Data processing
In order to produce quantitative estimates of source yield and river flows (historically and for the
future), modelling is required. This is primarily achieved through rainfall‐runoff modelling, which
simulates the process of runoff generation based on the input of rainfall and losses due to
evaporation, interception by plants and infiltration to the ground, as modified by vegetation, land
use, topography, soils and geology. Rainfall‐runoff models range from coarse resolution regional
models, with simplified descriptions of vegetation etc, through to more detailed catchment models
(and for other applications to field or site scale models).
Storage‐yield relationships are established for reservoirs that describe the reliable yield (outflow) of
a reservoir over different time periods based on the storage capacity. Reservoirs are generally
designed to be full, based on analysis of their inflows and the need to maintain a certain
downstream flow.
Sediment models simulate the processes that result in delivery of sediment to watercourses and its
movement downstream. There are often linked to rainfall‐runoff models as rainfall (or/and runoff)
is often the cause of erosion, entrainment and transport of sediment to watercourses, although
other processes can be important e.g. human activity, fire, wind.
Data requirements
Long‐term historical data sets are required to calibrate and validate rainfall‐runoff and sediment
models. Ideally this will extend to at least 30 years (and preferably will match climate model
baseline periods e.g. 1961‐1990, 1971‐2000); a longer time period will increase model validity,
although models will become compromised if climatic and local environmental conditions become
significantly different in future. The modelling will require rainfall data at a monthly or sub‐monthly
resolution, along with variables that permit calculation of PET and open water evaporation (at a
minimum temperature, but usually including wind speed, insolation/radiation and relative
humidity/vapour pressure). Spatially, data is needed to reflect inhomogeneity in climate and to
support the calibration of a valid model. Additional data describing the catchment environment is
required to set up rainfall‐runoff and sediment models.
For the future assessments multiple projections of future change in climate variables are required.
This is usually at the monthly resolution, although seasonal changes can be used if they capture the
nature of future climate seasons. Typically, monthly changes between baseline and future runs of
climate models are applied to the historical data; this ‘delta’ or ‘change factor’ method is simple but
does not allow for change in variance. For this application, change in inter‐annual variability is
particularly important. This is not well captured by the current generation of climate models, but
assessments can be improved by also using transient climate models runs and through the use of
stochastic weather generators.

Non‐climate data requirements reflect the need to take into account other demands on water (e.g.
river and reservoir abstractions) and changes in the catchment environment (e.g. land use change).
Monitoring needs
There is a need to ensure that monitoring captures the data required to calibrate, validate and run
models. Monitoring is also important for assessing climate sensitivities (e.g. linking climate data
with impacts) and establishing thresholds, as well as for assessing trends in climate and attributing
impacts to climate change. There is a particular need for a spatially representative rainfall network,
which can also be used to collect temperature data and other variables such as wind speed. It is also
important to monitor environmental variables such as land use change, sediment delivery /
sedimentation rates, river flow and reservoir inflows and outflow.
Options for managing uncertainty
It is useful to understand the sensitivity of key metrics such as source yield and low river flows to
climate; this can be achieved empirically or/and through use of the models described above (e.g.
through systematic variation of rainfall and PET). Uncertainty in future climate can be managed
through use of multi‐model ensembles and different emissions scenarios. In addition, uncertainty in
inter‐annual variability (which is important for understanding the reliability of yield) can be explored,
if not resolved, through use of simulations which provide alternative plausible variations in baseline
or/and future climate variability e.g. transient climate model runs, stochastic weather generators.
Pragmatically there is often a need to limit the number of impact model runs, particularly if these
are computationally expensive. In this case it is best to explore the range of climate projections (e.g.
rainfall and PET), ideally in conjunction with an understanding of the sensitivities, in order to select
specific climate projections for analysis. Additionally, historical data series are often short and more
recent than climate model baseline periods, requiring assumptions or adjustments to change
factors; in this case it is useful to compare the climate model baseline period with the available
observed model.
Longer‐termagriculturaldevelopmentpolicyThe third Strategic Plan for the Transformation of Agriculture (PSTA III) includes an environmental
and climate change mainstreaming section. This recognises the need for soil conservation
(watershed management and agroforestry), soil nutrient management, water management (water
use efficiency, making irrigation consistent with watershed management) and construction of feeder
roads.
In terms of planning for climate change, the PSTA III highlights the effects of climate variability and
the impacts and economic costs of climate change. Actions include risk assessment and vulnerability
mapping, watershed management, crop pest monitoring and agroforestry. However, although
included in the risk matrix, there is no action to explore long‐term risks to key crops (food and export
crops) from shifting agro‐ecological zones.
Climate sensitivity
The climate risk screening of PSTA II (Watkiss et al., 2011) highlighted that further research was
needed on the climate sensitivity of Rwanda’s key staple crops receiving high levels of public
investments in productivity (maize, wheat, rice, soya, potatoes, and cassava), as well as key cash
crops (coffee, tea) specific to Rwandan growing conditions/context. Key climate variables will
include temperature (e.g. maxima, growing degree days), rainfall (average and variability) and PET.
Climate thresholds are complicated due to the different requirements of crops during maturation,

and the ‘derived’ nature of variables which requires processing of meteorological data. The impact
of climate change on pests and diseases will also be important and thresholds will vary for these too.
There may also be indirect sensitivities associated with land stability, soil erosion and dependency
on irrigation.
Data processing
A variety of data outputs could assist decision making. For example maps of temperature
thresholds, or by combining climate variables, crop suitability maps. At a more detailed level
empirical models could provide an indication of impacts. Similar models can examine the potential
for pests and diseases. Crop models can define water demand and rainfall‐runoff models can be
used to inform assessments of water availability.
Data requirements
Historical data sets are required to calibrate and validate any empirical or physical models. Required
variables include daily minimum and maximum temperature, rainfall and other variables that permit
calculation of PET (these can be at a monthly resolution and usually include wind speed,
insolation/radiation and relative humidity/vapour pressure). Spatially, data is needed to reflect
inhomogeneity in climate, which can be significant for plants at the local scale.
For the future assessments multiple projections of future change in climate variables are required.
This is usually at the monthly resolution, although seasonal changes can be used if they capture the
nature of future climate seasons. Typically, monthly changes between baseline and future runs of
climate models are applied to the historical data; this ‘delta’ or ‘change factor’ method is simple but
does not allow for change in variance, which is important for climate extremes. These are not well
captured by the current generation of climate models, but assessments can be improved by also
using sensitivity tests or stochastic weather generators (widely used in agricultural applications).
Non‐climate data requirements reflect the need to understand plant sensitivity (see monitoring
needs below), wider environmental factors (soil moisture, groundwater levels, river flows) and land
use change.
Monitoring needs
Given the uncertainties, monitoring is a key adaptive response for agriculture in the long‐term.
Monitoring is important for assessing climate sensitivities (e.g. linking climate data with impacts) and
establishing thresholds, as well as for assessing trends in climate and attributing impacts to climate
change. Monitoring needs to encompass relevant climate variables (rainfall, temperature, PET),
plant physiological effects (yield, stress), pests and disease, phenology, environmental factors (soil
moisture, groundwater levels, river flows) and other dependencies (e.g. related to irrigation).
Options for managing uncertainty
The uncertainties associated with climate change impact on agriculture are significant. Whilst
agriculture can be adaptive e.g. changing cropping regimes on an annual basis, some crops require
long‐term establishment. Furthermore, there are risks associated with dependency on irrigation,
which may be affected by climate change and related competition for water.
Understanding sensitivities and supply chain risks is a useful starting point for managing uncertainty.
This can be coupled with scenario analysis and planning, which can include review of climate change
projections and the development of robust pathways for adaptation, including key decision points.
Monitoring can be used to provide an ongoing assessment of climate impact and to improve the
understanding of climate‐impact response, as well as the effectiveness of adaptation measures.
GreenurbanisationRwanda is urbanising rapidly and there is a need and desire to ensure this urbanisation is ‘green’ i.e.
is environmentally sustainable: low carbon, climate resilient, including green infrastructure and with
a local green economy. There is an ongoing initiative led by the Global Green Growth Institute to
develop Rwandan secondary cities (Huye, Muhanga, Musanze, Nyagatare, Rubavu and Rusizias) as
model green cities with green economic opportunities.
Climate sensitivity
Urban areas are generally sensitive to overheating, a lack of water (for drinking and industry), or too
much water (causing floods). In Rwanda, overheating is not a significant problem in terms of
comfort and need for cooling. However, the variable topography (in the ‘land of a thousand hills’)
makes landslides an important factor. Rainfall (particularly extreme short‐duration rainfall) is the
most important climate variable.
Data processing
Planners looking to develop urban areas need to understand the long‐term risk of landslides, river
floods and surface water floods (which also relate to drainage and the sewer system). Furthermore,
there is a need to ensure that buildings are resilient to potential climate hazards, particularly in
relation to drainage.
There is a need for geomorphological and geological mapping of landslides and surrounding areas,
supported by field surveys and interpretation of aerial photography and/or satellite imagery. More
detailed assessments (e.g. for building consent) might require ground investigation, slope stability
analysis and numerical modelling.
Flood risk assessments are underpinned by the use of rainfall‐runoff and hydraulic models. Rainfall‐
runoff models simulate the process of runoff generation based on the input of rainfall and losses due
to evaporation, interception by plants and infiltration to the ground, as modified by vegetation, land
use, topography, soils and geology. Hydraulic models simulate the movement of water in channels
or sewers and over the floodplain or urban areas. There will be a need to assess flood risk from
rivers flowing into the city, as well as the risk of surface water flooding within the city itself; the
latter should incorporate sewer modelling, particularly where there are combined foul and surface
drainage systems (although separated systems can be installed in new developments to reduce the
potential for sewer overflows and related pollution).
Full risk assessments (for landslides and flooding) should take into account the nature of the hazard
as well as the probability of an event. In addition to a general understanding of hazards in terms of
different land uses and activities, this requires assessment of the vulnerability of specific exposed
areas, for example in terms of population, their adaptive capacity and resilience measures
employed.
Data requirements
The assessment of landslides and slope stability requires geological and geomorphological maps (or
the creation of such maps via field surveys) which can be informed by aerial photography and/or
satellite imagery (present day and historical). More detailed analysis requires soil and rock samples,
slope movement records, rainfall and groundwater level data.
Long‐term historical data sets are required to calibrate and validate rainfall‐runoff models. Ideally
this will extend to at least 30 years (and preferably will match climate model baseline periods e.g.
1961‐1990, 1971‐2000); a longer time period will increase model validity, although models will
become compromised if climatic and local environmental conditions become significantly different
in future. The modelling will require rainfall data at a monthly or sub‐monthly resolution, along with
variables that permit calculation of PET (at a minimum temperature, but usually including wind
speed, insolation/radiation and relative humidity/vapour pressure). Spatially, data is needed to
reflect inhomogeneity in climate and to support the calibration of a valid model. Additional data
describing the catchment / urban environment, including detailed topographical data for urban
areas, is required to set up rainfall‐runoff and hydraulic models.
For the future assessments multiple projections of future change in climate variables are required.
This is usually at the monthly resolution, although seasonal changes can be used if they capture the
nature of future climate seasons. Typically, monthly changes between baseline and future runs of
climate models are applied to the historical data; this ‘delta’ or ‘change factor’ method is simple but
does not allow for change in variance, which is for this application is particularly important for
rainfall extremes. These are not well captured by the current generation of climate models, but
assessments can be improved by undertaking sensitivity analysis and using stochastic weather
generators. In future, very high‐resolution climate modelling (e.g. Kendon et al., 2014, for the UK)
could provide more robust data.
Non‐climate data requirements reflect the need to take into account current and future exposure
(population location, density and vulnerability; location of critical infrastructure) and changes in the
catchment environment (e.g. land use change including urban creep).
Monitoring needs
For known areas of landslides, it is important to monitor slope stability. This can be done on the
ground or/and supported by aerial photography and/or satellite imagery. There is a need to ensure
that monitoring captures the data required to calibrate, validate and run models that support flood
risk assessments, including rainfall (ideally hourly within urban areas) and flow in rivers, drainage
channels and sewers. Monitoring is also important for assessing climate sensitivities (e.g. linking
climate data with impacts) and establishing thresholds, as well as for assessing trends in climate and
attributing impacts to climate change. It is also important to monitor environmental variables such
as land use change and groundwater levels. Wider monitoring of population, vulnerability and urban
creep is important for assessing risk.
Options for managing uncertainty
It is useful to understand the sensitivity of key metrics such as slope stability and flood flows to
climate; this can be achieved empirically (using a wide range of historical evidence) or/and through
use of the models described above (e.g. through systematic variation of rainfall and PET).
Uncertainty in future climate can be managed through use of multi‐model ensembles and different
emissions scenarios. In addition, uncertainty in extremes can be explored, if not currently resolved,
through use of sensitivity tests and stochastic weather generators.
Pragmatically there is often a need to limit the number of impact model runs, particularly if these
are computationally expensive. In this case it is best to explore the range of climate projections (e.g.
rainfall and PET), ideally in conjunction with an understanding of the sensitivities, in order to select
specific climate projections for analysis. Additionally, historical data series are often short and more
recent than climate model baseline periods, requiring assumptions or adjustments to change

factors; in this case it is useful to compare the climate model baseline period with the available
observed model.
It is also possible to manage predictive uncertainty by building in resilience and adaptive capacity.
Resilience can be built into urban development planning through appropriate land use zoning for
high risk areas such as floodplains and the protection of watercourses from encroachment. In many
cases such areas provide opportunities for recreation or wildlife zones or corridors, or green
transport routes. Good building standards can also promote resilience e.g. through adequate
drainage and maintenance of slope stability. Additionally, measures to increase adaptive capacity of
institutions and the population can reduce the risk from hazards if they do occur.

Social Protection
Integrating climate into Social Protection in RwandaOutline of the case study
Rwanda has an existing social protection programme, Vision 2020 Umurenge Programme [VUP]). This large scale, government led, protection programme comprises a number of components ‐cash transfers (for those unable to work, or for the poorest); ‐public works; ‐ financial services; underpinned by community training and sensitisation These provide a "staircase out of poverty". The programme prioritises poor geographical areas and extremely poor households within these. At the current time, the programme does not target areas based on natural hazard risk, though it is recognised this is a factor in poverty. However, the public works do have a strong focus on vulnerability reduction with terracing and small irrigation. While social protection is a form of adaptation, and should help build the resilience of vulnerable groups to future climate change, there is also the potential for climate change to impact on the programme. Changes in variability and extremes could decrease the effectiveness of the programme or even increase the number of people who fall back into poverty. This is also an issue of whether public works are building in resilience to future climate. Finally, there is a long‐term issue of whether in some locations, the social protection programme might be encouraging livelihoods to remain in areas that will be unsustainable (due to climate change) in the long‐term. Against this background there is a need to consider the risks of climate change, and mainstream climate change/resilience into the programme. This case study looks at these issues – covering both short and longer‐term social protection and graduation, but also public works components.
Definition of problem (risks)
Rwanda is currently affected by natural climate hazards. Flooding is common during the wet seasons (river flooding, especially in the south, and flash floods and landslides in the north and west due to the steep terrain). There are also often storms during the wet seasons, which increase the risks of damage to property from windstorms, the risk of landslides, and lightning strikes. In some regions of the country, there have also been periodic droughts. However, unlike many other countries, Rwanda’s disasters have tended to be localised and relatively small in scale. As well as these extreme events, there are also wider impacts from the climate variability. The inter‐annual variability affects rain‐fed agriculture, which dominates the sector. The strong rains, and hilly terrain, are a factor in soil erosion, which is high in Rwanda, affecting productivity as well as affecting downstream sectors (e.g. hydro). For the social protection (VuP), the key risks are around possible changes (increases) in future climate hazards (shocks) from climate change, and how these
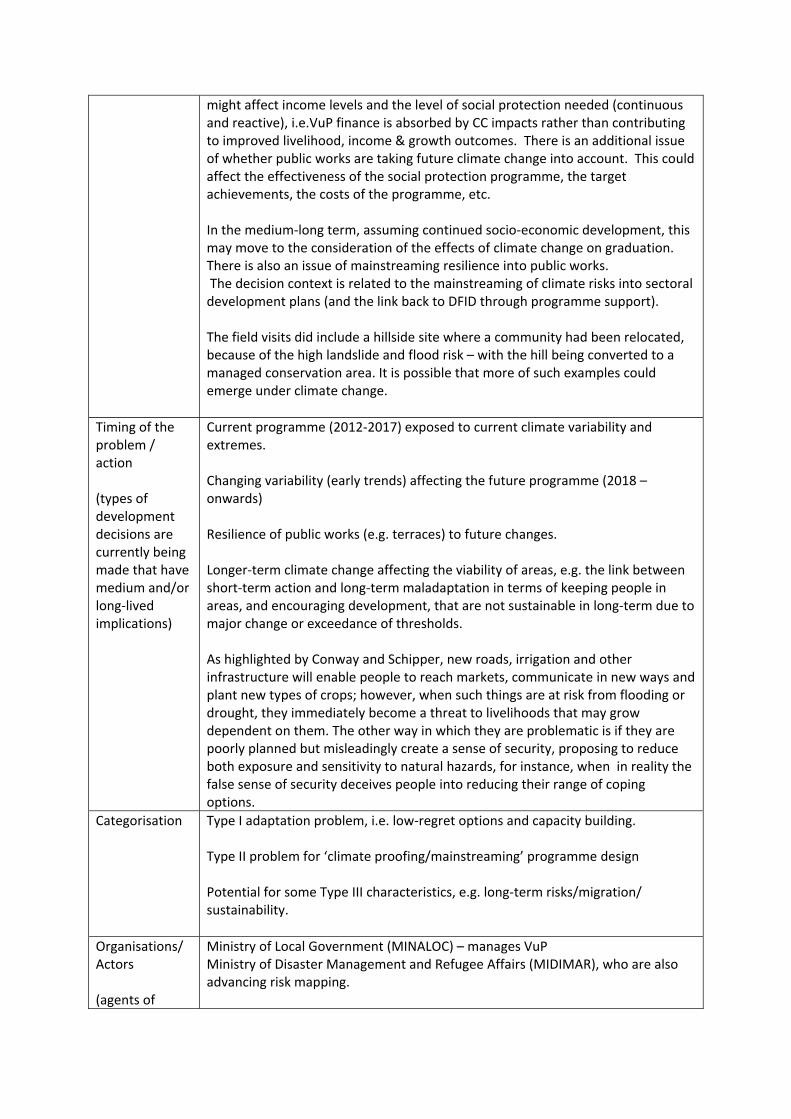
might affect income levels and the level of social protection needed (continuous and reactive), i.e.VuP finance is absorbed by CC impacts rather than contributing to improved livelihood, income & growth outcomes. There is an additional issue of whether public works are taking future climate change into account. This could affect the effectiveness of the social protection programme, the target achievements, the costs of the programme, etc. In the medium‐long term, assuming continued socio‐economic development, this may move to the consideration of the effects of climate change on graduation. There is also an issue of mainstreaming resilience into public works. The decision context is related to the mainstreaming of climate risks into sectoral development plans (and the link back to DFID through programme support). The field visits did include a hillside site where a community had been relocated, because of the high landslide and flood risk – with the hill being converted to a managed conservation area. It is possible that more of such examples could emerge under climate change.
Timing of the problem / action (types of development decisions are currently being made that have medium and/or long‐lived implications)
Current programme (2012‐2017) exposed to current climate variability and extremes. Changing variability (early trends) affecting the future programme (2018 – onwards) Resilience of public works (e.g. terraces) to future changes. Longer‐term climate change affecting the viability of areas, e.g. the link between short‐term action and long‐term maladaptation in terms of keeping people in areas, and encouraging development, that are not sustainable in long‐term due to major change or exceedance of thresholds. As highlighted by Conway and Schipper, new roads, irrigation and other infrastructure will enable people to reach markets, communicate in new ways and plant new types of crops; however, when such things are at risk from flooding or drought, they immediately become a threat to livelihoods that may grow dependent on them. The other way in which they are problematic is if they are poorly planned but misleadingly create a sense of security, proposing to reduce both exposure and sensitivity to natural hazards, for instance, when in reality the false sense of security deceives people into reducing their range of coping options.
Categorisation Type I adaptation problem, i.e. low‐regret options and capacity building. Type II problem for ‘climate proofing/mainstreaming’ programme design Potential for some Type III characteristics, e.g. long‐term risks/migration/ sustainability.
Organisations/ Actors (agents of
Ministry of Local Government (MINALOC) – manages VuP Ministry of Disaster Management and Refugee Affairs (MIDIMAR), who are also advancing risk mapping.

change) DFID (lead development partner for the social protection programme). Through its second phase of support (2013‐2016) DFID is providing £36.7m in financial aid and technical assistance to strengthen social protection systems and increase coverage of the (extreme) poor and vulnerable in Rwanda. Support to VuP comes from DFID, EU (SBS) and World Bank (GBS), with TA contributions from UNICEF. UNDP/ WBank / EC is supporting the multi‐hazard risk assessment.
Entry points National level The national medium term plan (Economic Development and Poverty Reduction Strategy, EDPRS), currently in phase II (2013‐ 2018), includes a number of cross cutting issues, which are considered alongside the main thematic areas, including ‐Disaster management includes investment in rapid response disaster management equipment, early warning systems and awareness campaigns. ‐ Environment and climate change: major areas of attention will be mainstreaming environmental sustainability into productive and social sectors and reducing vulnerability to climate change. Strategic level: The sector development plans have to consider the EDPRS cross cutting issues, thus this mainstreams climate change into sector policy, i.e. into the Social Protection Strategy (RoR, 2013b). Sector Development Plans are also subject to the Checklists and Guidelines for Environment and Climate Change (CC) Mainstreaming into Sectors and District Development Plans (DDPs (Annex 19 budget circular) DFID There are a number of potential entry points for DFID, in relation to business case for social protection support. Annual review. Office climate risk screening.
Is the problem recognised?
Yes The EDPRS identifies the issues and highlights priority areas are (i) mainstreaming environmental sustainability into productive and social sectors; (ii) reducing vulnerability to climate change. The social protection strategy recognises the link between social protection and disasters (and thus Disaster Risk Reduction) – though there is not an explicit geographical focus related to hazard risk in the programme (and the main link is with poverty as reliant on rural farm wage labour). The targeting in VuP is not based on climate hazards, but there is geo mapping which could be used, and there has been some discussion around targeted mapping – this might be an issue for the future, i.e. targeting current or future risk areas. The strategy does recognise climate change Priority /Outcome six: Improved sector response to climate‐related risks(continued, adapted priority)

Link social protection more explicitly with risk management and disaster mitigation. A major problem faced by poor rural people is the way that their quality of life is threatened by the risk of adverse climatic events, as well as other risks, such as ill‐health and food price changes. Based on an analysis of the context of risk and vulnerability, the sector will ensure that: � social protection programmes are designed in a way that helps poor people better adapt to, manage and cope with these risks � the programmes themselves are climate proofed to minimise risks associated with climate change. Outcome 6: Improved sector response to climate‐related risks We will seek to strengthen dialogue and data exchange on climate related risks with key institutions involved in disaster risk management. An initiative by MINALOC to establish a cross Ministry technical working group on Social Protection and Early Warning Systems will be enhanced to enable timely and good quality information flow to the sector. This will help to inform sector programming and enable improved risk management. The sector will also develop policy guidelines for social protection actors, including District and Sector staff, on how social protection programmes will respond to emergencies and disasters that are commonly experienced in Rwanda e.g. floods, landslides, droughts, heavy rains and any others We will also identify key risks and vulnerabilities, based on analyses conducted to date (eg CFSVA and the Environment Sector Vulnerability Assessment), in order to „climate proof‟ social protection programmes and ensure that their implementation mitigates climate related risk There is a new multi‐hazard disaster risk mapping exercise currently underway, which is included floods, droughts, landslides (and fires and earthquakes), though only the drought maps are completed, but this will provide some more quantitative information. There are also now a set of climate resilient and disaster responsive social protection policy guidelines from the Government (2013). The guidelines are intended to inform the social protection sector’s contribution to the reduction and management of climate related risks; both current risks and unknown, future risks that might result from climate change. This highlights shocks from severe climatic events are widespread and can have devastating impacts on the well‐being of poor households; severe climate‐related shocks, resulting in reduced food consumption and asset depletion, were reported by 17% of all households in 2011/12, thus climate related hazards are clearly a dimension of risk that the sector cannot afford to neglect. This highlights there is scope to further strengthen this contribution through identifying new types of public works project that will contribute to disaster risk management and climate resilience. Further improving geographical targeting to take more account of patterns of vulnerability will also improve effectiveness. The VUP programme could make an enhanced contribution to medium‐term recovery (from two to three months after the shock). It also highlights that Joined up

support for disaster‐affected households will require active collaboration between the social protection, disaster risk management and climate resilience sectors. Finally, on the DFID side, the previous Climate Risk Screening of the DFID Office (GCAP, 2011) picked up that changing variability might affect the outcomes and effectiveness of the VuP programme (e.g. negatively under increasing extremes). The current business case recognises that shocks such as natural disasters e.g. floods and landslides (which will be exacerbated by climate change effects on Rwanda) which have direct effects on poor people’s production, food security and nutrition. However, the business case for VuP DFID support outlines the benefits of the programme in reducing current vulnerability to climate variability. It does not account for the risks of climate change on the programme itself, i.e. how changing variability might affect the outcomes and effectiveness of the programme (e.g. negatively under increasing extremes), because it was not clear how to do this. The focus only on upsides is understandable, but highlights that the Risk Screening recommendations have not been implemented. This indicates there must be significant barriers (capacity, time, information and support) which prevent this Under the climate change review 57. The PW component of VUP is likely to have significant positive impacts on the environment and provide opportunities for climate variability risk management, since a significant proportion of the assets created through the programme relate to natural resource management (notably soil and water conservation activities). In the West and South of Rwanda in particular terracing, better irrigation and anti‐erosion ditches are used to support current agricultural policies to increase productivity through crop intensification and environmental management . 58. However, there are potential environmental risks associated with some of the assets created under the PW, linked to broader national policy directives on increasing food availability. For example, international evidence shows that the shift to mono‐cropping, which is associated with PW terracing activities in the VUP, can result in increased risk within agricultural households and food security. 59. It is likely that the DS component of the programme will reduce the need for households to engage in adverse coping mechanisms, which may harm the environment or make them more vulnerable to weather shocks. Exploitation of local resources as a result of increased micro‐enterprise activity – such as charcoal making or mineral extraction – could potentially have negative implications for the environment. 60. These issues should be monitored as part of on‐going programme appraisal (there is scope for strengthening the environmental appraisals of all PW interventions) and could be potentially addressed by linking the programme to FONERWA . 61. Table 1 categorises the environmental risks and opportunities of the two

feasible options. Categories are: A high potential risk/opportunity; B medium/manageable potential risk/opportunity; C low or no risk/opportunity; or D core contribution to a multilateral organisation.
Is climate information currently used Does the capacity exist to generate /interpret climate information in‐country
No, most analysis to date has been qualitative The future assessments of climate change have also not used climate information to project future changes in hazards and impacts. However, there are now some multi‐hazard risk mapping which is addressing current risks. No, in that there are low levels of climate modelling expertise in‐country, thus any capacity for analysis would have to come from outside (e.g. as part of technical assistance from DPs or through contracted assessment).
Potential types of adaptation response and consideration of uncertainty
There are a wide range of options that cover the aspects of current climate variability, mainstreaming of the programme and public works components, and long‐term iterative risk management. These include options such as ‐Capacity building (e.g. enhanced meteorological systems, risk mapping and projections) ‐Disaster risk reduction options (emergency response, early warning systems) ‐ ‐Low cost over‐design on public works ‐Iterative risk management (e.g. enhanced monitoring programme with later set of potential adaptation options). There is an obvious need for climate change information on future changes in extremes, but also a linkage to vulnerability and hazard / risk analysis to capture direct and indirect risks from these changes Some specific early options were identified in the risk screening GCAP (2011), including • Include risk assessment to identify where CC might mean additional finance is absorbed by CC impacts rather than contributing to improved livelihood, income & growth outcomes (immediate), as well as linkage to early warning system and disaster risk management. • Include mechanisms to capture above impacts in M&E (medium term) • In longer term as evidence emerges, possibility to link cash transfers & credit with resilience‐building measures, e.g. weather‐related insurance • Link public works with LC‐CRD (e.g. flood management, soil & water conservation, natural resource management linked with international carbon finance, etc.) Discussion with Government highlighted that the social protection response might need more flexibility under climate change, e.g. as people are hit. The current
Option Climate change and environment risks and impacts, Category (A, B, C, D)
Climate change and environment opportunities, Category (A, B, C, D)
1 B B 2 C A 3 B B

system does not allow changes to provide cash transfers to those at higher income levels, but what might be useful is flexibility to scale up after shocks. Related to this, information is needed on what the future risks are, and how this might affect medium‐long term social protection (i.e. graduation), i.e. what are the changes in trends and potential impact on shocks. This might also cascade through to a greater focus on public works that target resilience.
Key Trade‐Off There are some direct trade‐off within the programme in relation to whether options are worth paying for now, especially as they lead to increases in programme costs today (and thus reduce down the coverage of the existing programme), when benefits will arise in future periods and may be uncertain.
Other ancillary issues or policy aspects
There are strong linkages to the economic and rural themes of EDPRS, as well as wider environmental aspects (see earlier DFID business case points)
Existing studies in Rwanda
The Economics of Climate Change in Rwanda (Watkiss et al, 2010) did some preliminary analysis of historical impacts and some indicative projections of future flood related hazards.
Other potentially relevant studies
There has been the application of iterative thinking and uncertainty in the context of Ethiopia’s social protection programme (Conway and Schipper, 2011).
Climate analysis Projections of rainfall (and thus run‐off and stream flow) for Rwanda are under climate change show high uncertainty. Although the intensity, frequency and spatial distribution of precipitation are unknown, all the climate model scenarios show that average rainfall regimes will change. The majority of the projections indicate that average annual rainfall will actually increase, particularly in some seasons, indicating a potential strengthening of the rains. However, some models show reductions in rainfall in some months. The range of model results highlights the considerable uncertainty in predicting future rainfall changes. Examples of projection data (from main report) are shown below. A more detailed review of model projections (GCMs) for East Africa (Shongwe et al, 2009) looking at the longer term (where the climate signals are clearer) also found that many models indicate the intensity and frequency of heavy rainfall extremes may increase in the wet seasons. The projections of future meteorological drought are much more uncertain, with large variations between models.

Risk / Impact analysis
The focus here would be future hazard risks, assessing the potential change in extremes. The analysis of the impacts of these events is challenging, as it usually involves complex casual chains (especially for drought). There is also a need to take account of changing vulnerability (e.g. from development). Nonetheless, there is some potential, especially with more sophisticated risk mapping, which could build on the existing multi‐hazards assessment. It would also be interesting to explore thresholds for long‐term challenges, i.e. the maladaptation aspects from short‐term social protection in maintaining livelihoods in highly vulnerable areas. One metric that could be used is the frequency of flooding (generally groups migrate when flooding occurs every year or two). There is also the potential for some similar aspects in relation to high land‐slide risks, though these are likely to be very site specific. While not thought to be a major issue, it is also possible there could be high drought risk areas that develop.
Uncertainty Conway and Schipper highlight that uncertainty in climate projections and impacts needs to be recognised and communicated to users carefully: its magnitude underscores the need for planning and management responses that are ‘robust to uncertainty’, i.e. measures that are appropriate to a range of rainfall conditions, or that have at least had contingency or risk assessment components in their design phase. However, the country visits and interviews highlighted that the consideration of uncertainty in natural hazard projections was extremely poor. Most decisions were justified on the basis of central qualitative storylines of future climate change, e.g. the typical discussion referred to current vulnerability then highlighted climate change would lead to future increases in floods and droughts, using this narrative as the justification for adaptation action. There was little consideration of even alternative scenarios (e.g. an A1B vs B1/2 scenario), let alone climate model uncertainty. In almost all cases, end‐user applications had completely ignored uncertainty, both scenario uncertainty and climate model uncertainty. What is interesting is that even when end‐users were using secondary sources for climate information

(e.g. previous studies) that highlighted uncertainty in relation to the range of temperature, the range of average rainfall, the uncertainty with extremes, end‐users were ignoring this. In most cases, end‐users just took the central messages or even re‐interpreted, i.e. a common theme in interviews and documents was that climate change would increase droughts, even though the original sources highlighted that future drought patterns were unclear. There was also little consideration of the qualitative range of future trends, let alone the quantitative range and agreement of the results. It was also found that any positive effects of climate change (e.g. potential yield increases for agriculture) were ignored, i.e. end‐users focused on pessimistic future outcomes for climate change. This implies that end‐users are using climate information opportunistically, e.g. when the project or programme is looking to build a case for positive action in reducing climate risks with adaptation, the downside risks are highlighted, however, any risks of climate change on the intervention itself (or uncertainty that might question the intervention) are ignored. When questioned why uncertainty was omitted, even for relatively sophisticated end‐users, interviewees highlighted time/resource and capacity constraints, and stressed that including uncertainty was too complex. Importantly they often highlighted that uncertainty detracted from the central message (i.e. in the case for action, or in communicating the need for early action to non‐climate ministries or non‐specialists).
Adaptation analysis
The more advanced analysis for Ethiopia’s social protection programme (Conway and Schipper, 2011) identified short‐term activities and targets that will be the most sensitive to climate variability now, along with longer‐term activities and targets for which policies, institutions and infrastructure will be designed and established in the near term. However, their primary recommendation was for improved monitoring and periodic reassessment of emerging changes in climate hazards and vulnerability.
Capacity levels Capacity levels are generally low, especially in relation to the more complex analysis of extreme events, i.e. with the probabilistic nature of extremes, and complex causal chains.
Climate information needs
Climate projection [regional] multi‐model. Precipitation, particularly extremes Drought related metrics – as linked to the multi‐hazard mapping End of the season (EOS) WRSI (Water Requirements Satisfaction Index Uncertainty critical for precipitation and extremes.
Hydrological information needs
See earlier tables
Other information needs
Population and development futures
Key conclusion Does it make a difference?
There is a need to start considering the issues, with an enhanced monitoring programme and analysis and to understand current risks and potential changes, e.g. linked to the multi‐hazard mapping.

Climate change is likely to make a difference, and given the livelihood component, this is likely to be more pressing than for a standard market‐sector cost benefit analysis. However, it was interesting to note that DFID, while recognising these potential risks, consider climate change a secondary issue, as there are more pressing needs to address other immediate problems with the programme, i.e. while climate change might be an issue, it is not at the top of the list of things to consider. This highlights that in terms of the potential for change, climate change may not be the most important issue in terms of using scarce political capital.
How would better communication and understanding of available climate information (and uncertainty) affect the design of the policy/ programme?
The analysis showed that end‐users ignored the primary meteorological (climate projection) information and instead focused on vulnerability, risk or impact metrics in their adaptation decision case. The key information used in project applications, business cases and mainstreaming indicators, centred on changes in land‐slides, levels of soil erosion, etc. For most of these indicators, there was no quantitative information provided in the existing Rwandan literature (i.e. a lack of impact/risk studies) and accordingly no analysis of uncertainty, thus qualitative discussion was being used. This highlights a need to consider the broader set of outcome metrics used by most end‐users, i.e. there is perhaps more interest in bio‐physical metrics and vulnerability indicators than there is primary climate information. The success of updated scientific climate modelling information is therefore likely to rely on whether this is converted into more useful metrics for specific end‐users (e.g. agro‐meteorological, hydro‐meteorological, natural hazard information/maps) [though without going back to a science‐first impact assessment driven approach]. It was highlighted that geo‐referenced current risks and future vulnerability mapping would be useful – noting for the latter there is an issue of how to present uncertainty. The key aspect is to be focus on something concrete to show government, noting the lack of information currently and the need to simplify messages. It was also highlighted that better historic variability was also useful, and that there is a need for enhanced monitoring. However, a key issue was over the interpretation of data, i.e. they don’t want primary climate information; they want relevant indicator data to take to government.
How could climate science be better integrated into decision‐making processes to make policy and planning more robust to future climate?
The low level of existing climate science information was considered. There are a number of other explicit and implicit reasons, including in adaptation decisions. First, there are no Government or standard projections of climate change, and most end‐users were taking information from a wide range of diverse sources (e.g. previous studies, second national communication, grey literature, etc.) rather than directly using climate modelling information results. Most of these secondary sources are more accessible and can be easily summarised to fit project appraisal forms. [It is noted that in the Rwanda, the secondary sources cite global climate models, due to the lack of regional climate model runs, which is highlighted as a major gap: only one study had used downscaled data, using statistically downscaled data for 10 GCMs]. Second, it is clear there are major capacity gaps in the understanding of climate information and how to apply this in end‐use applications, noting that in many cases the climate element may be

secondary to the primary objectives (e.g. of the development policy) thus the individual actors has low levels of climate expertise. The interviews and analysis also found that most users are primarily concerned with changes in variability and extremes rather than average trends, whereas most available information is the reverse (i.e. it is relatively easy to source future changes in temperature as a non‐expert, but almost impossible to source changes in extreme precipitation). This indicates that the climate science modelling work in FCFA probably needs to give due attention to these more complex parameters, noting the greater challenge and higher uncertainty.
An obvious priority is for more comprehensive downscaled multi‐model climate model projections, strengthening the capacity of local meteorological organisations. Furthermore, there is an obvious priority to support meteorological, agro‐meteorological and hydro‐meteorological information, capacity and co‐ordination/communication. With respect to the latter, in Rwanda there are also major gaps in the historic data sets, especially across the geographical range of the country – which is a critical gap given the high climate heterogeneity. Satellite information might helo to help build up more comprehensive information. In general, end‐users were much more interested in the next 10 – 20 years than the typical time‐slices produced from climate models (i.e. 2041‐2070). It is recognised that in these early years the climate change signal is lost in the noise of variability, but information on changing trends and some indicative analysis on how current conditions might change in the near future would be highly relevant to end‐users. As highlighted above, the interviews and analysis also found that many users are primarily concerned in changes in variability and extremes rather than average trends. This indicates more attention on these aspects (noting the greater complexity and uncertainty) and also tailored key outputs for these as a more routine output of modelling results. Even information on what we know, and what we don’t know is also useful (e.g. if there is high confidence in increasing extreme precipitation this is useful to know, even if we have low confidence in the change in drought related indicators). End‐users were also more interested in agro‐meteorological and hydro‐meteorological information, and bio‐physical and vulnerability indicators. This raises a question of whether to invest in additional scientific analysis, i.e. in hydrological modelling, extreme value analysis, etc. This includes a focus on key thresholds, e.g. related to impact categories, which can also provide a strong link to existing hazard or vulnerability maps. However, while downscaled climate information and enhanced capacity is a major gap, the case study identified that a critical gap for end‐use application was around the science‐practice interface, i.e. on the translation of complex climate information to a form usable by end‐users. A focus on new climate modelling and science alone is therefore unlikely to advance the use of climate information in adaptation/resilience. To address this requires boundary organisation activities, e.g. similar to the role of UKCIP in the UK, to translate primary climate information into adaptation‐ready information, to provide information and guidance, etc. There are difficult issues in developing these activities at the continental or regional scale (because context is critical) but the potential for helping to bridge the science‐practice gap would be highly influential to advancing climate information use in adaptation. It is also clear that different end‐users are currently using a diversity of

(inconsistent) climate information sources. They are primarily relying on secondary data sources (e.g. national communications) and they are often over‐simplifying the information available, focusing on qualitative narratives, and ignoring uncertainty. This highlights the need for consistent and standardised climate projections, which include a range of outputs that match the capacity of different end‐users, i.e. multi‐modal/scenario outputs, but also more simple messages on key changes and uncertainty that can be easily understood by end‐users. It is recognised that the development of common projection is challenging and raises additional issues, but in the absence of such information there is currently high inconsistency. It is also stressed that the capacity in many individual countries (such as Rwanda) is not sufficient to provide these standardised scenarios and messaging, so there is a potential role in helping to enhance local capacity to build standardised scenarios and a suite of climate information products reflecting different end‐user capacity (at the country/regional level), linked to the boundary roles identified above. In addition to the primary climate information, it is clear from the Rwanda case study that end‐users need guidance on how to apply climate information in end‐use applications, i.e. to incorporate climate in decision contexts, whether this is for quantitative analysis or more generally (in guidance for mainstreaming). This could be advanced with good practice case studies, as well as guidance. In general, the end‐users interviewed in the Rwanda case study were extremely keen to learn about practical case studies in other countries. In terms of medium‐long‐term decisions, a number of lessons emerged. Clearly multi‐model information that allows consideration of uncertainty, i.e. downscaled multi‐model ensembles, will be needed, but a critical factor will be on presenting the information in a usable form, i.e. with simple ranges, envelopes of possible change (for temperature and precipitation), discussion of the agreement of models, and possibly analysis of robustness. A key issue is that it would be useful if the climate modelling community could produce these, i.e. in terms of range, envelopes and robustness, rather than leaving this step to end‐users, who do not have the capacity/time to do this. There is thus a role in providing uncertainty information (regional or country) that presents information in usable formats. This moves beyond the production of regional modelling runs to the interpretation of outputs, e.g. recommending which models provide a suitable spread in a particular country (e.g. across temperature and precipitation). It is recognised that this will be difficult, but such outputs would provide higher value added for end‐users. Where multi‐model information is produced, it is critical to move away from the current tradition of running lots of models for one scenario (e.g. A1B or RCP4.5) and instead ensure that multiple scenarios are equally covered (e.g. RCP2.6 and 8.5), with multiple model for each. This leads on to a critical issue: most climate model uncertainty is projected for a single RCP at a time. However, for adaptation, there is a need to sample across all futures (i.e. all RCPs) and all climate models to address the question of what the envelope of future change includes. While it is recognised this is extremely difficult, it is critical for the analysis of adaptation for end‐users (otherwise they will just use a central scenario). Alongside this uncertainty information, there will be a need for guidance/support on how to consider this uncertainty in decisions, with good practice and guidance. A key focus will be on a set of different methods for different applications and

end‐users (the latter reflecting capacity). While some users may be able to use detailed uncertainty analysis, in most cases simple approaches (sensitivity, traffic light systems, etc.) will be more appropriate. Perhaps more importantly, three will a need to ensure that climate information outputs are tailored to align with these different decision support tools. This will require climate information to be produced with uncertainty methods in mind (e.g. as above, to provide range/spread, advice on what models to use to consider robustness, etc.). There will also be a need to work on socio‐institutional aspects, e.g. to address the barriers on why people ignore uncertainty. This involves difficult issues (e.g. helping people understand that uncertainty need not reduce the justification for their business case or adaptation proposal application, trying to include uncertainty guidance in SEA, business cases, etc.). The challenge of this should not be underestimated, especially due to the increasing focus on target driven outcome indicators and value for money. Finally, in relation to longer‐term challenges, and iterative risk management, there is a potential opportunity in identifying potential key indicators of major future climate change, then investing in regional programmes to help compile and monitor this information, e.g. using satellite observations to track key agro‐meteorological changes, or satellite/local site information to provide reports of regional sea level rise, etc. It is highlighted that many of these indicators are common to many countries, even if they vary by sector. This could also extend to more bio‐physical indicators, e.g. pest and disease monitoring, agro‐ecological zones shifts.
For social protection and agriculture, risks are associated with the potential for climate change to
undermine intended outcomes, through impacts on livelihoods, incomes, and expenditure (e.g. on
food) which might mean that additional financial resources from cash transfers, credit or income
from public works is simply absorbed by higher household costs. Climate change has the potential
to affect production and food/nutrition, as well as investments in agriculture and related businesses.
Finally, it has the potential to affect transport networks. There are some risks for trade‐mark, as
climate change has the potential to affect local production, as well as global and regional patterns of
trade, commodity prices, and to interrupt trade via its impacts on transport networks within or
outside Rwanda. Note that there is potential for resilience building and adaptation, ensuring that
public works address issues related to adaptation and resilience (e.g. flood management systems,
soil and water conservation, development of novel agricultural techniques to confront new
conditions, etc.).
Background
Major recent flood events occurred in 1997, 2006, 2007, 2008, 2009 and 2011, where rainfall
resulted in infrastructure damage, fatalities and injuries, landslides, loss and damage to agricultural
crops, soil erosion and environmental degradation. Recent work (RoR, 2012b) has undertaken a
mapping exercise of high risk areas for floods and landslides.
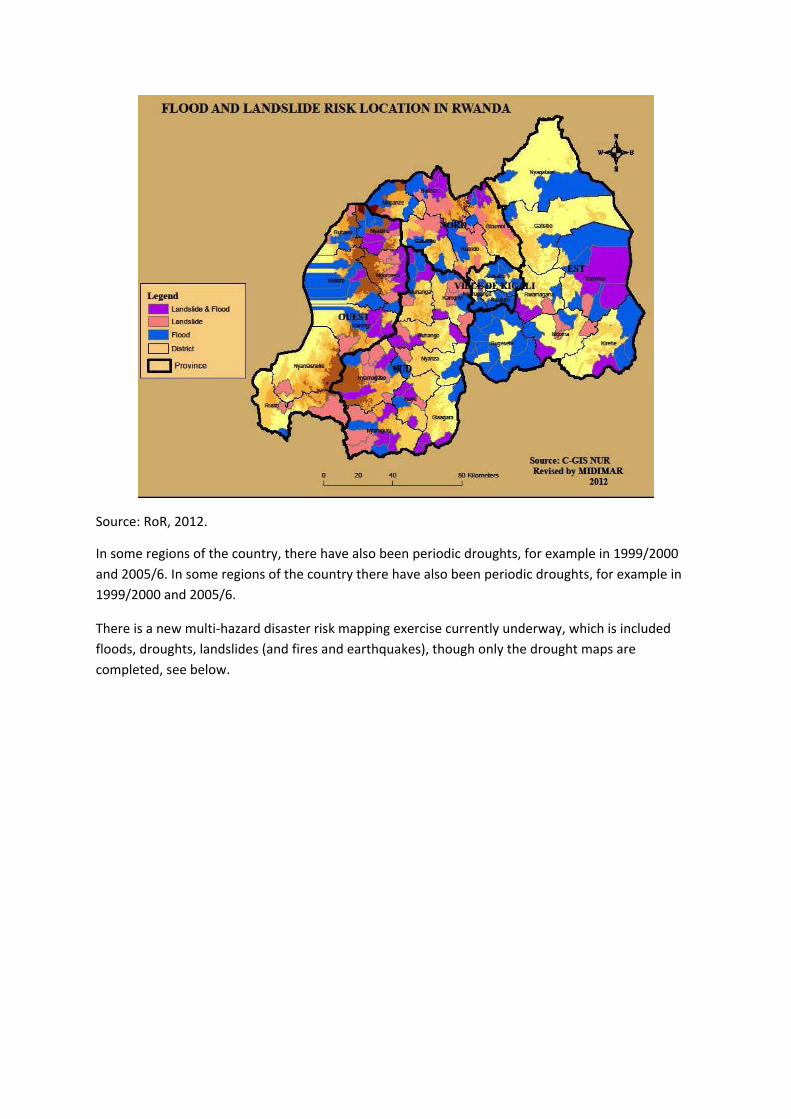
Source: RoR, 2012.
In some regions of the country, there have also been periodic droughts, for example in 1999/2000
and 2005/6. In some regions of the country there have also been periodic droughts, for example in
1999/2000 and 2005/6.
There is a new multi‐hazard disaster risk mapping exercise currently underway, which is included
floods, droughts, landslides (and fires and earthquakes), though only the drought maps are
completed, see below.

Source RoR, 2014.12
The strong rains, and hilly terrain, are a factor in soil erosion, which is high in Rwanda (field studies
report 35 and 246 t/ha per year, Olson and Berry and recent GIS monitoring estimates one‐half of
the country experiencing soil erosion rates of 50 tonnes per hectare per annum, and a third
experiences losses of 100 tonnes per hectare per annum, REMA). These losses reduce land
productivity.
12 To evaluate drought hazard in Rwanda, the analysis defines occurrence of drought relative to a crop specific water requirements. The approach compares the water supplied by rainfall (or irrigation) against the water requirements of a particular crop as both components vary throughout the season. The lengths of growing seasons A and B were considered for key crops normally grown in Rwanda. At the end of the season (EOS), a numerical index is computed, the WRSI (Water Requirements Satisfaction Index) which is 100 in case the crop water requirements are fully satisfied throughout the season and increasingly below this value the more the rainfall is unable to satisfy crop water needs. Decadal rainfall data for the period of March 2001 to February 2014 were processed. Maize was used as a proxy crop, for the two rainy seasons, A and B.

Social Protection and Livelihoods, Programme Exit and Graduation

From the climate resilient and disaster responsive social protection policy guidelines
References
Conway, D. and Schipper, E.L.F., 2011. Adaptation to climate change in Africa: Challenges and
opportunities identified from Ethiopia. Global Environmental Change, 21(1), pp.227‐237.
DFID. Social Protection Support to the Poorest in Rwanda (SPSPR). Business Case and Intervention
Summary
GCAP (2011). Jillian Dyszynski, Paul Watkiss, and Nick Brooks (2011). Climate Change Strategic
Evaluation of the DFID Rwanda Programme. Report to DFID Rwanda. March 2011.

MINAGRI NISR and World Food Programme (2012). Comprehensive Food Security and Vulnerability
Analysis and Nutrition Survey.
Republic of Rwanda (2012). Disaster High Risk Zones on Floods and Landslides. Republic of Rwanda,
Ministry of Disaster Management and Refugee Affairs, March 2012
RoR EDPRS (2013). Economic Development and Poverty Reduction Strategy 2013 – 2018: Shaping
Our Development. Republic of Rwanda.
RoR (2013) EDPRS2. SOCIAL PROTECTION STRATEGY.JULY 2013
FoF (2013c). climate resilient and disaster responsive social protection policy guidelines (2013).

Agriculture
Integrating climate into Agriculture in RwandaOutline of the case study
Rwanda is strongly reliant on agriculture. The sector accounted for 33% of GDP in 2013, generates 70% of export revenues and employs 80% of the population. Staple foods include bananas, plantains, cassava, beans, maize, sweet potatoes, wheat, rice and irish potatoes. Tea and coffee exports (and to a lesser extent pyrethrum) are also important in terms of export earnings. Although Rwanda has the potential to be food secure, and productivity has been increasing in recent years, the sector is heavily affected by variable rainfall patterns and high levels of rain‐fed agriculture, as well as poor infrastructure, transport and post‐harvest storage losses, coupled with underlying low agricultural development levels, lack of access to finance, etc. Recent years have seen strong growth in agriculture, largely from government investment in land management (soil erosion mitigation and terracing), irrigation, input provision, and increasing the national livestock herd. Productivity and production for a number of crops, mostly food staples, have sharply increased and improved rural incomes. However, Rwanda has one of the highest population densities in Africa (10.5 million people, and 415 per square kilometre) and as a result farmer’s landholdings are generally small. The terrain is also hilly, a factor in soil erosion. Agricultural development and transformation is a key part of the national development plan, and Rwanda is currently launching a third phase of the Strategic Plan for the Transformation of Agriculture (PSTA), which is accompanied by an agricultural investment plan. There is a priority to mainstream climate change into these plans, and some early work is already underway. This case study looks at the adaptation aspects of this mainstreaming task. This involves short‐term aspects associated with current climate variability, but also longer‐term issues around land‐use planning and agro‐ecological zones, as well as supporting actions such as rural roads and irrigation infrastructure.
Definition of problem (risks)
Rwanda is currently affected by natural climate hazards. Flooding is common during the wet seasons (river flooding, especially in the south, and flash floods and landslides in the north and west due to the steep terrain), all affecting agriculture. In some regions of the country, there have also been periodic droughts. As well as these extreme events, there are also wider impacts from the climate variability. The inter‐annual variability affects rain‐fed agriculture. The strong rains, and hilly terrain, are a factor in soil erosion, which is high in Rwanda, affecting agricultural productivity. Despite large scale programmes of soil conservation (terrace) a significant proportion of land is cultivated without protection against erosion. Soil erosion rates vary tremendously depending on

slope, degree of protection and the crop cultivated but on steep slopes without protection erosion has been estimated at between 300 and 550 tonnes/ha/yr. These extreme events will be affected by climate change, and there is the potential for higher risks to agriculture as a result. However, there is high uncertainty over changes in these extremes. Alongside these changes in extremes, in the medium‐longer term, the shifts in climate will affect the suitability of current agro‐ecological zones for current crop types. This has the potential for positive as well as negative impacts, but is a particular issue for crops which are more temperature sensitive, and also ones which have longer growing cycles, and thus this is a particular issue for coffee and tea (which are extremely important for exports). Alongside these risks, there are a wider set of impacts, such as the changes in pests and diseases (prevalence and range), as well as impacts on livestock and even major societal risks in terms of socially contingent effects, as shown in the Table below.
Finally, there are also some cross‐sectoral risks, notably the link to water (from irrigation) in terms of water supply, quality and demand, and to rural roads, which involve some infrastructure components. There are also linkages to the natural environment and ecosystem services. All of this makes the mainstreaming of climate change into agriculture development plans very complex, as there is a need to consider multiple risks against multiple objectives, and to assess where to focus (limited) resources for adaptation.
Sector Potential Impacts Agriculture including cereals, cash crops, etc.
Productivity changes: potentially positive as well as negative, from CO2 fertilization, higher temperatures, changes in rainfall and rainfall variability, evapo-transpiration, changes in frequency and intensity of extremes including heavy precipitation and drought, involving many climate variables and impacting on many aspects of crop production, e.g. growth rates, development and flowering, maturity periods, etc.
Changes in length or timing of seasons. Direct and indirect losses from extremes, e.g. direct loss of crops, damage and
disruption to infrastructure. Changes in pests and diseases (range of species and prevalence/incidence). Changes in soil erosion (from changes in climate parameters, i.e. wind and water
notably heavy precipitation) Changes in soil conditions, hydrology, fertility and soil and land degradation (including
desertification) Changes across the value chain, effects on farm incomes, commodities, growth etc.
and to livelihoods (e.g. health). Changes in water availability (irrigation, supply and demand balance, etc.)
Livestock including poultry
Productivity changes from climate variables (temperature, humidity, etc.) affecting animal health, growth, quality, reproduction, value, etc.
Increases in animal mortality, injury, reduced health or increased stress from extreme events (heat, drought, floods) including risks to housed animals (poultry).
Change in water availability. Change in livestock feed availability / forage crops and feed quality. Changes in disease and pests (range of species and prevalence/incidence). Changes across the value chain, effects on farm incomes, commodities, growth etc.
and to livelihoods (e.g. health) Socially contingent
Changes in suitability and sustainability of current agro-ecological zones, and livelihood zones / livelihoods, such as pastoralists.
Changes to food security, likelihood of famine. Changes in livelihoods, society, increasing pressure, potential conflict, etc.

There risks need to be seen against underlying factors in the sector (e.g. the issue of land pressure and small plot size), low mechanisation, low levels of inputs, lack of access to finance, high post‐harvest losses (estimated at 20 – 40%) and the poor quality/extent of rural (feeder) roads.
Timing of the problem / action (types of development decisions are currently being made that have medium and/or long‐lived implications)
There are immediate, medium and long‐term issues involved in this case study. The current programme PSTA III (2012‐2017) will be exposed to current climate variability and extremes, as well as changing variability (early trends) from climate change, and there is a need to ensure adaptation is built into the plans. There are already plans for climate smart agriculture in the plan, but a key factor will be to ensure resilience is built into key areas, such as land protection and agroforestry. In the medium‐term there are issues around crop suitability (and the potential need for crop switching in the plans) as well as resilience issues around public works (e.g. terraces), rural roads, and the linkages to water (irrigation in the context of rising multi‐sector demand, and the water balance). There are also some longer‐term aspects around long‐term agriculture suitability and agro‐ecological zones, particularly for coffee and tea. This can involve important threshold temperatures, either for optimal production or at levels where crop production suffers significantly. Some of these thresholds are included in the annex. All of these have the potential to be linked, i.e. there maybe some important issues between short‐term action and long‐term maladaptation in terms of encouraging development patterns that are not sustainable in long‐term.
Categorisation Type I adaptation problem, i.e. low‐regret options and capacity building. Type II problem for ‘climate proofing/mainstreaming’ agricultural investment plan, including infrastructure (irrigation, roads). Type III characteristics, e.g. long‐term risks/migration/ sustainability in relation to agro‐ecological zone and risks to coffee / tea and forestry.
Organisations/ Actors (agents of change)
Agriculture is the key sector in the national development plan and thus important in terms of the delivery of the Poverty Reduction Strategy. The Ministry of Agriculture and Animal Resources (MINAGRI) is the key sector lead. It has four component, MINAGRI Central, Single Project Implementation Units (SPIUs) which drive large programmes (DP), Rwanda Agricultural Board (RAB) and National Agricultural Export Board (NAEB). There are also important linkages to Rwanda Environmental Management Authority (REMA) (on the climate adaptation side) and Ministry of Disaster Management and Refugee Affairs (MIDIMAR), who are also advancing risk

mapping. Given the local nature of agriculture, local development plans are also important. The Ministry of Local Government (MINILOC) is responsible for 30 Districts which are in turn responsible for local level service delivery. The Ministry of Natural Resources (MINIRENA) is responsible for state forests around the country, although MINAGRI is responsible for on‐farm agroforestry. MINIRENA is also responsible for environmental protection and in this capacity has its own programmes of hillside terrace construction, which reinforce the land conservation terracing that MINAGRI undertakes. In terms of the private sector, The Private Sector Federation (PSF) and The Rwanda Cooperative Agency (RCA) are both important for agriculture. The Agriculture Sector Working (ASWG) established in 2004 is the standing Committee for CAADP that has representation from each line Ministry, DPs and key stakeholders that is co‐chaired by the Minister/PS of Agriculture and representative of a lead Donor Agency which is currently the World Bank. The Donor Partners have a coordinated approach in engaging with the ASWG through the Sector‐wide Approach (SWAp). The SWAp serves as a platform for coordinating aid, providing financial resources in support of action plans and policies aligned with PSTA‐II, harmonizing M&E and performance monitoring systems and strengthening national capacities. World Bank is the lead development partner for agriculture, though DFID is also important, and given the range of potential aspects, most development partners have some linkages (e.g. USAID, EC, Netherlands).
Entry points National level The national medium term plan (Economic Development and Poverty Reduction Strategy, EDPRS), currently in phase II (2013‐ 2018), includes a number of cross cutting issues, which are considered alongside the main thematic areas, including ‐Disaster management includes investment in rapid response disaster management equipment, early warning systems and awareness campaigns. ‐ Environment and climate change: major areas of attention will be mainstreaming environmental sustainability into productive and social sectors and reducing vulnerability to climate change. EDPRS 2 sees agriculture as having a crucial role in the economy to both provide the base for sustained economic growth and make the greatest contribution to poverty reduction. The most important objectives for the sector are to increase rural household incomes, to provide incomes from diversified sources, and increase food security. Public sector investments will create an enabling environment for business growth and encourage private sector investment. Strategic level: The sector development plans have to consider the EDPRS cross cutting issues, thus this mainstreams climate change into sector policy. The strategic vision for the next five years in PSTA III is a focus on both increased production of staple crops and livestock products, and greater involvement of the

private sector to increase agricultural exports, processing and value addition. In the short term, continued rapid food production increases will ensure further reductions in rural poverty and malnutrition. In the medium term, the goal is to move Rwandan agriculture from a largely subsistence sector to a more knowledge‐intensive, market‐oriented sector, sustaining growth and adding value to products. The primary goal of PSTA III is for high growth (production and commercialisation), recognising the benefits in increasing rural incomes and reducing poverty. This will be achieved through key pillars of 1. Land, irrigation, inputs and infrastructure; 2. Soft skills and farmer capacity; 3. Value chains and markets; and 4. Private sector investment. The PSTA III outlines that growth will be driven by ‐Continued investment in land husbandry, irrigation and inputs. ‐Expanding CIP to further increase the productivity of staple crops. ‐Expanding the livestock sector, particularly small stock and fisheries. ‐Investing in mechanisation, processing and post‐harvest facilities to modernise production. ‐Extension targeted at producers to develop a skill‐based sector. ‐Research that responds to farmers’ needs and identifies optimal crop varieties. ‐Aggregating smallholder production to provide sufficient quantities for markets. ‐Improving the quality of traditional export crops to generate higher premiums. ‐Increasing production of emerging export crops including horticulture. ‐Value chain development to strengthen supply and develop market demand. ‐Encouraging entrepreneurship through agricultural financing and insurance to reduce risk. ‐Attracting investment through soft and hard market infrastructure. ‐Building institutional capacity across the sector. ‐Facilitating a participatory approach, including women and youth, for inclusive growth. ‐Environmental sustainability and climate change adaptation for long term prosperity of the sector. There are 4 strategic programmes: 1: Agriculture and animal resource intensification; 2: Research, technology transfer and professionalization of farmers; 3: Value chain development and private sector investment; 4: Institutional development and agricultural cross‐cutting issues. A review of the PSTA III found many positives, i.e. soil conservation (a resilience measure) is a major feature of programme 1, although so is irrigation which has some potential risks under a changing climate. The PSTA III is supported by an Agriculture Sector Investment Plan (ASIP), which sets the framework for medium term public and private investment in the agriculture sector over the period 2013/14 to 2017/18. This provide the key entry point (aligned to budgets) to progress mainstreaming, as a medium term investment plan. The ASIP has a number of strategic themes including

Private sector involvement Poverty targeting and alleviation Research and extension Environmental protection Food security Decentralisation MINAGRI has the following structure of four programmes with twenty four sub‐programmes clustered under them as set out below. Programme 1: Agriculture and animal resource intensification Sub‐programme 1.1: Soil conservation and land husbandry Sub‐programme 1.2: Irrigation and Water Management Sub‐programme 1.3: Agriculture mechanisation Sub‐programme 1.4: Inputs to improve Soil Fertility and Management Sub‐programme 1.5: Seed development Sub‐programme 1.6: Livestock development Programme 2: Research and Technology Transfer, Advisory Services and Professionalisation of Farmers Sub‐programme 2.1: Research and technology transfer Sub‐programme 2.2: Extension and proximity services for producers Sub‐programme 2.3: Farmer’s cooperatives and farmer’s organisations Programme 3: Value Chain Development and Private Sector Investment Sub‐programme 3.1: Creating an environment to attract private sector investment, encourage entrepreneurship and facilitate market access Sub‐programme 3.2: Development of priority value chain: Food Crops Sub‐programme 3.3: Development of priority value chains: Export Crops Sub‐programme 3.4: Development of priority value chains: Dairy and Meat Sub‐programme 3.5: Development of priority value chains: Fisheries Sub‐programme 3.6: Development of priority value chains: Apiculture Sub‐programme 3.7: Agricultural finance Sub‐programme 3.8: Market‐Oriented Infrastructure Programme 4: Institutional Development and Agricultural Cross‐Cutting Issues Sub‐programme 4.1: Institutional capacity building Sub‐programme 4.2: Decentralisation in agriculture Sub‐programme 4.3: Legal and regulatory framework Sub‐programme 4.4: Agricultural communication and management information systems, monitoring and evaluation and agricultural statistics Sub‐programme 4.5: Gender and youth in agriculture Sub‐programme 4.6: Environmental mainstreaming in agriculture Sub‐programme 4.7: Food and nutrition security and household vulnerability 4.6 is considered a medium priority. For example, under the high investment scenario, the budget allocation is low ($340 000) out of US$ 1,907 million) over the five year ASIP period. However, many of the other programmes are low regret adaptation options ‐ 80% of all costs are accounted for by programme 1, reflecting the very high cost of programmes in land conservation, irrigation, inputs supply and agricultural mechanisation.

Just over 75% of ASIP high scenario public sector costs are in capital investment, reflecting the very high costs of programmes in soil conservation, irrigation, agricultural mechanisation, post‐harvest storage and rural feeder roads. This indicates that the infrastructure resilience aspects may be more important than first appears. There is an agricultural sector working group, ASWG, which is looking at Responses to Climate Change in Rwanda Agriculture. This WG is currently funding a project to build a tool to allow Minagri planners to evaluate the impact of programme spending decisions on the ability to adjust to climate change and the impact of those programme decisions on climate change, i.e. as part of the ASIP. Sector Development Plans are also subject to the Checklists and Guidelines for Environment and Climate Change (CC) Mainstreaming into Sectors and District Development Plans (DDPs (Annex 19 budget circular) DFID There are a number of potential entry points for DFID, in relation to business case for social protection support. Annual review. Office climate risk screening. There is a SEA of the agricultural sector (EC, 2012). The overall objective of the SEA is to ensure that environmental concerns are appropriately integrated in all sector (agriculture) and sub‐sector (rural feeder roads) decision‐making, implementation and monitoring processes. There is also a Environmental and Social Systems Assessment (ESSA) of the PSTA III (undertaken by the World Bank, 2014.) This highlights the need to ensure the investments are selected and implemented to ensure for climate change risks are incorporated into the technical designs. It also states it is vital to plan for adaptation measures to address the expected impacts of climate variability in all development investments.
Is the problem recognised?
Yes The EDPRS identifies the issues and highlights priority areas are (i) mainstreaming environmental sustainability into productive and social sectors; (ii) reducing vulnerability to climate change. The PSTA III highlights agricultural growth will be driven by a number of key factors, one of which is Environmental sustainability and climate change adaptation for long term prosperity of the sector It recognises the current risks Rwanda’s climate is complex, varying across the country and with a strong seasonality. Climate variability gives rise to disasters, such as flooding, landslides and droughts, resulting in decreased agricultural productivity or crop failure. The impacts and economic costs of current climate variability and events are already significant for food production, and likely to increase with climate change, with predicted increasing temperatures and rainfall. It is therefore essential to implement adaptation activities

It also includes an environmental and climate change mainstreaming section. This recognises the need for soil conservation (watershed management and agroforestry), soil nutrient management, water management (water use efficiency, making irrigation consistent with watershed management)) and construction of feeder roads.
The risks to rural roads of climate extremes is highlighted, with a target to tackle this, with region‐specific climate‐proofed feeder roads standards to be developed and applied. This is a potential case of mal‐adaptation. This involved a commitment to climate proof rural feeder roads in the agricultural development strategy (as part of the climate change mainstreaming actions). It was not possible to find out exactly what this commitment involved, but future proofing roads with short‐lifetimes would imply a high cost penalty, which would reduce the coverage of the rural road programme (this is already an issue: the proposed rural road standards were considered excessive by development partners [who fund the rural feeder road programme] as the available funds and higher design standards would result in a smaller number of wider roads). It is noted that siting roads to avoid current high risk areas is sensible, and it may be cost‐effective to ensure some degree of current resilience (noting this does have a cost penalty) or allowing some flexibility for later upgrades. However, any early moves for future proofing are likely to be highly mal‐adaptive, especially given the lifetime of these roads. In terms of planning for climate change, the PSTA III highlights the high effects of climate variability and the impacts and economic costs of climate change. It highlights actions such as risk assessment and vulnerability mapping, water catchment structure, watershed management, crop pest monitoring and agroforestry. What is missing is the consideration of some of the issue identified in the original climate risk screening of PSTA II evaluation analysis, i.e. in relation to long‐term risks to key crops (food and export crops) from shifting agro‐ecological zones. This is included in the risk matrix, but there is no action to explore this in the strategy. There is a mention of the need for Adaptive research on coffee varieties in PSTA III but no details are provided.
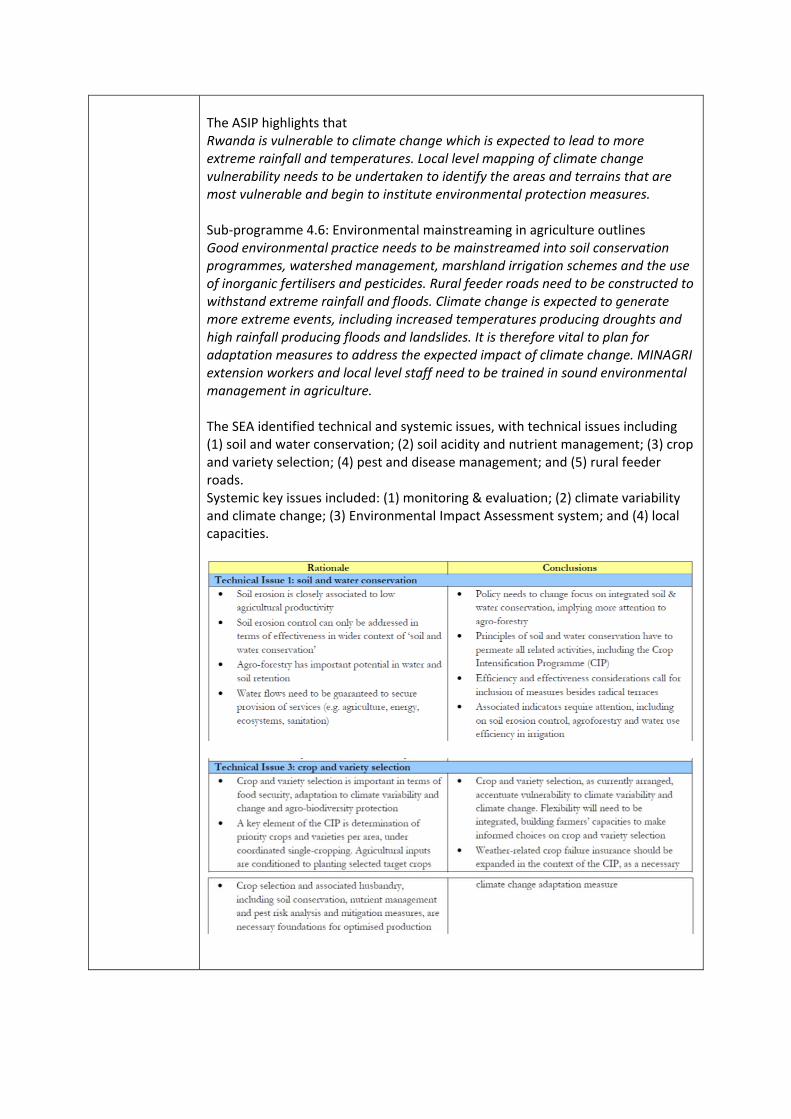
The ASIP highlights that Rwanda is vulnerable to climate change which is expected to lead to more extreme rainfall and temperatures. Local level mapping of climate change vulnerability needs to be undertaken to identify the areas and terrains that are most vulnerable and begin to institute environmental protection measures. Sub‐programme 4.6: Environmental mainstreaming in agriculture outlines Good environmental practice needs to be mainstreamed into soil conservation programmes, watershed management, marshland irrigation schemes and the use of inorganic fertilisers and pesticides. Rural feeder roads need to be constructed to withstand extreme rainfall and floods. Climate change is expected to generate more extreme events, including increased temperatures producing droughts and high rainfall producing floods and landslides. It is therefore vital to plan for adaptation measures to address the expected impact of climate change. MINAGRI extension workers and local level staff need to be trained in sound environmental management in agriculture. The SEA identified technical and systemic issues, with technical issues including (1) soil and water conservation; (2) soil acidity and nutrient management; (3) crop and variety selection; (4) pest and disease management; and (5) rural feeder roads. Systemic key issues included: (1) monitoring & evaluation; (2) climate variability and climate change; (3) Environmental Impact Assessment system; and (4) local capacities.

These were linked to recommendations, e.g. technical area 1 ‐PSTA III should promote soil and water conservation as an integrating policy focus, and it should be effectively implemented as an integrated approach. ‐water use efficiency should be incorporated into the irrigation subsector ‐ Focus should be on activities that are the most cost‐effective (e.g. in relation to less resource intensive soil erosion control), and serving a purpose (e.g. species and varieties for agro‐forestry must be selected based on the choice purpose and technical area 3 ‐ Choice of crops and varieties is central to CIP, but various aspects of the focus currently given to the CIP are increasingly being questioned e.g. climate resilience ‐ build flexibility for decision‐making of crops and varieties by farmers, developing farmers’ knowhow and skills to make informed choices – flexibility is important for adaptation to climate variability and climate change ‐ build adaptation capacities to climate variability and climate change by requiring all CIP schemes to be accompanied by weather insurance – important in a farming system that increases farmers’ vulnerability to climatic shocks. Are 5 MINAGRI can contribute to enhance effectiveness in this sub‐sector by providing guidelines to District Development Committees on criteria for prioritising feeder roads, Climate variability and climate change (Systemic Issue 2) ‐Many of the strategies and activities promoted in the agriculture sector have benefits in terms of climate change adaptation. However there are some approaches that may be reducing adaptation capacities (e.g. in relation to CIP

crop and variety selection, see above), and there are also further opportunities to enhance climate change adaptation and the contributions to climate change mitigation (e.g. in relation to rationalisation in use of fertilisers, increased weather crop insurance). ‐ The NSCCLCD sets the way forward to Rwanda’s green growth. Importantly, two of the strategy’s Programmes (on ‘sustainable intensification of agriculture’ and on ‘agricultural diversity in local and export markets’) are to be led by MINAGRI, and thus mainstreamed into SPTA3. ‐ MINAGRI should make climate change one of its key concerns; for this it will need to generate knowledge and capacities to better understand how the agriculture sector in Rwanda relates to climate change. Activities should include modelling of crop yields under different climate change scenarios, contributions to upgrade and use the EWS, favour climate resilient crops and farming methods (including the protection of agro‐biodiversity) and further promote farmers’ weather insurance. Many of the issues identified in the sectoral SEA have been included as part of PSTA 3. The SEA also highlighted from the time the EDPRS was written, the institutional level of awareness on climate change, and the corresponding policy focus have matured; climate change adaptation is now rightly recognised as an important aspect to address, especially due to the high level of vulnerability to climate change of the agriculture sector Recommendations in the context of the SPSP to rural feeder roads Minimum road specifications applied to the respective implementation would require climate‐proofing road design, so that roads and associated structures would be capable of sustaining greater intensity of rainfall as indicated by officially recorded trends The Rwanda Environmental Management Authority (REMA) published Guidelines for Mainstreaming Climate Change Adaptation and Mitigation in the Agricultural Sector. The graphic, taken from the Guidelines, demonstrates the impact that climatic changes may have agriculture and, subsequently, development in Rwanda is shown in the annex
Is climate information currently used Does the capacity exist to generate /interpret climate information in‐
No, most analysis to date has been qualitative The future assessments of climate change have also not used climate information to project future changes in hazards and impacts. However, draft tool is including some projections (e.g. world bank portal) No, in that there are low levels of climate modelling expertise in‐country, thus any capacity for analysis would have to come from outside (e.g. as part of technical assistance from DPs or through contracted assessment). Even in the SEA, which is the most detailed document, the analysis is highly

country qualitative, and cites secondary references i.e. Global Circulation Models (GCM) predict an increase in rainfall as well as increase in temperatures Expected outcomes of climate change in Rwanda include increased rainfall3 (up to 20% by the 2050s and 30% by the 2080s), increases in mean annual temperature (up to 3.25ºC for the region by 2100) (Byamukama et al, 2011) prolonged periods without rain and an extension of the dry season (UNEP, 2011) This is a problem as these rather generic findings are used as the basis for rather firm recommendations.
Potential types of adaptation response and consideration of uncertainty
There are a wide range of options that cover the aspects of current and future climate change on agriculture, which runs to hundreds of potential options (see Watkiss, 2013). These vary on the risk and context of the country or policy background, but generally include the following.
General agricultural adaptation (e.g. crop switching)
Sustainable agriculture and land management (e.g. climate smart agriculture)
Capacity building (e.g. ews)
Resilient infrastructure (roads)
Disaster risk management
Water management (either sustainable or irrigation)
Pest and disease management
Knowledge and information There have been some studies on adaptation for the sector in Rwanda. The DFID screening of PSTA II highlighted the need for more in‐depth screening on projects and programmes with long lifetimes (either with long lead times or long lifetimes), as well as agro‐climatic research, and promotion of climate smart agriculture (although Rwanda is already advancing many of these options). The Rwanda low carbon climate resilient strategy identified three areas of immediate focus. PoA: Sustainable intensification of small‐scale farming BW: Integrated soil fertility management BW: Irrigation infrastructure As well as key actions for 1. Risk assessment and vulnerability mapping 2. Constructing water catchment structures, to reduce flood damage and provide water in drought 3. Increased emphasis to watershed management and soil retention measures, 4. Monitoring pest incidence and crop yields to advise farmers on cropping adaptation 5. With MINIRENA, exploring agroforestry and forestry projects for carbon credit markets The ASIP (4.6) outlines ASIP activities include • Mainstream good environmental practice into soil conservation and terracing programmes, including watershed protection, living barriers, inter‐

cropping and agro‐forestry.. • Training farmers in integrated pest and crop management through FFS. • Develop hydrological information systems, including water balances. • Water use efficiency should be considered in planning and operating irrigation systems. • Irrigation design should ensure marshland development is consistent with watershed hydrology to ensure the marshland’s flood mitigation properties are not compromised. • Develop and apply climate‐proofed rural feeder road standards and specifications. • Conduct risk assessments and vulnerability mapping of the local level impact of climate change. • Construct water catchment structures to reduce flood damage and provide water in drought. • Train district and sector staff and extension workers in sound environmental management. • Strengthen the MINAGRI environmental focal point to improve environmental management and planning.
Key Trade‐Off There are many potential direct trade‐offs with other sectors and objectives (e.g. water and land‐use, conservation, etc). and for specific options (e.g. environmental, GHG, etc.).
Other ancillary issues or policy aspects
There are strong linkages to economic and rural themes, and the issue of underlying vulnerability, development and growth.
Existing studies in Rwanda
The Economics of Climate Change in Rwanda (Watkiss et al, 2010) did some preliminary analysis on the agricultural sector, and there is some summary in formation in the low carbon climate resilience plan (ROR, 2011). Watkiss et al (2011) reviewed the Phase II PSTA as part of the climate risk screening. This found that extreme events (floods, droughts) from current variability, as well as future climate change, pose a major risk to agricultural growth and sector development targets. Further, some strategic plans could lead to risk, from marshland “rehabilitation” to prepare land for rice cultivation due to effects on water management, from intensification programs including irrigation and from the expansion of areas under coffee production, as coffee is climate sensitive. It was highlighted that further research was needed on the climate sensitivity of Rwanda’s key staple crops receiving high levels of public investments in productivity (maize, wheat, rice, soya, potatoes, and cassava), as well as key cash crops (coffee, tea) specific to Rwandan growing conditions/context.
It also highlighted the need for more in‐depth screening on projects and programmes with long lifetimes (either with long lead times or long lifetimes), as
PSTA II Programme Area *Adaptation risks
1‐4 High – Low – Mixed
1. Intensification and development of sustainable
production systems
1 3 2
2. Support the professionalisation of the producers 0 3 0
3. Promotion of commodity chains and agribusiness
development
0 4 2
4. Institutional development 0 5 0
Total 1 15 4

well as agro‐climatic research, and promotion of climate smart agriculture (although Rwanda is already advancing many of these options).
Other potentially relevant studies
There are a number of other regional countries that have advanced mainstreaming in agricultural development plans. The Ethiopia CRGE strategy (Watkiss et al, 2013) applied an iterative climate risk management approach to develop short, medium and long‐term priorities for the sector. This prioritised around 40 action, that were needed to mainstream adaptation, and undertook an investment and financial flow analysis to look at the estimated costs for mainstreaming. Tanzania has produced a sector adaptation action plan (2014). – the Tanzania Agriculture Climate Resilience Plan, 2014–2019, which also provides accost plan to address the most urgent impacts posed by climate variability and climate change to the crop sub‐sector and mainstream climate change within agricultural policies, strategic initiatives and plans. This focuses on four key themes: Action 1: Improve agricultural water and land management; Action 2: Accelerate uptake of climate smart agriculture; Action 3: Reduce impacts of climate‐related shocks through improved risk management; Action 4: Strengthen knowledge and systems to target climate action.
Climate analysis Projections of rainfall (and thus run‐off and stream flow) for Rwanda are under climate change show high uncertainty. Although the intensity, frequency and spatial distribution of precipitation are unknown, all the climate model scenarios show that average rainfall regimes will change. The majority of the projections indicate that average annual rainfall will actually increase, particularly in some seasons, indicating a potential strengthening of the rains. However, some models show reductions in rainfall in some months. The range of model results highlights the considerable uncertainty in predicting future rainfall changes. Examples of projection data (from main report) are shown below. A more detailed review of model projections (GCMs) for East Africa (Shongwe et al, 2009) looking at the longer term (where the climate signals are clearer) also found that many models indicate the intensity and frequency of heavy rainfall extremes may increase in the wet seasons. The projections of future meteorological drought are much more uncertain, with large variations between models.
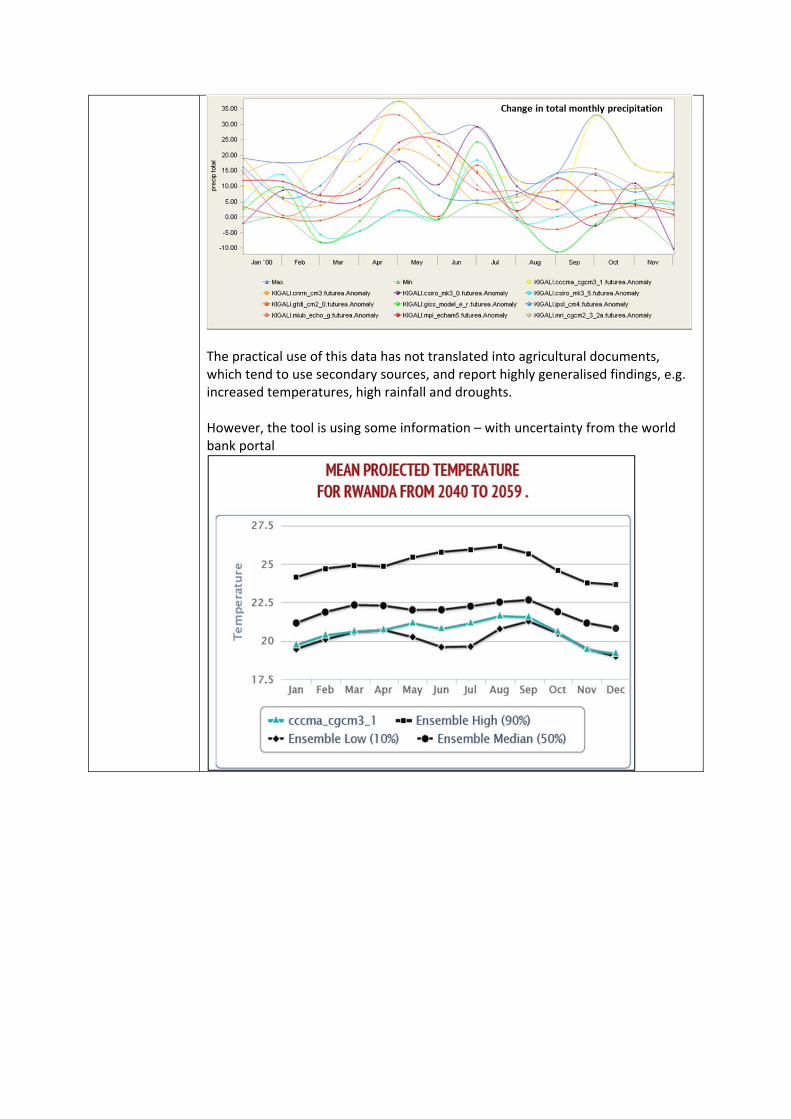
The practical use of this data has not translated into agricultural documents, which tend to use secondary sources, and report highly generalised findings, e.g. increased temperatures, high rainfall and droughts. However, the tool is using some information – with uncertainty from the world bank portal
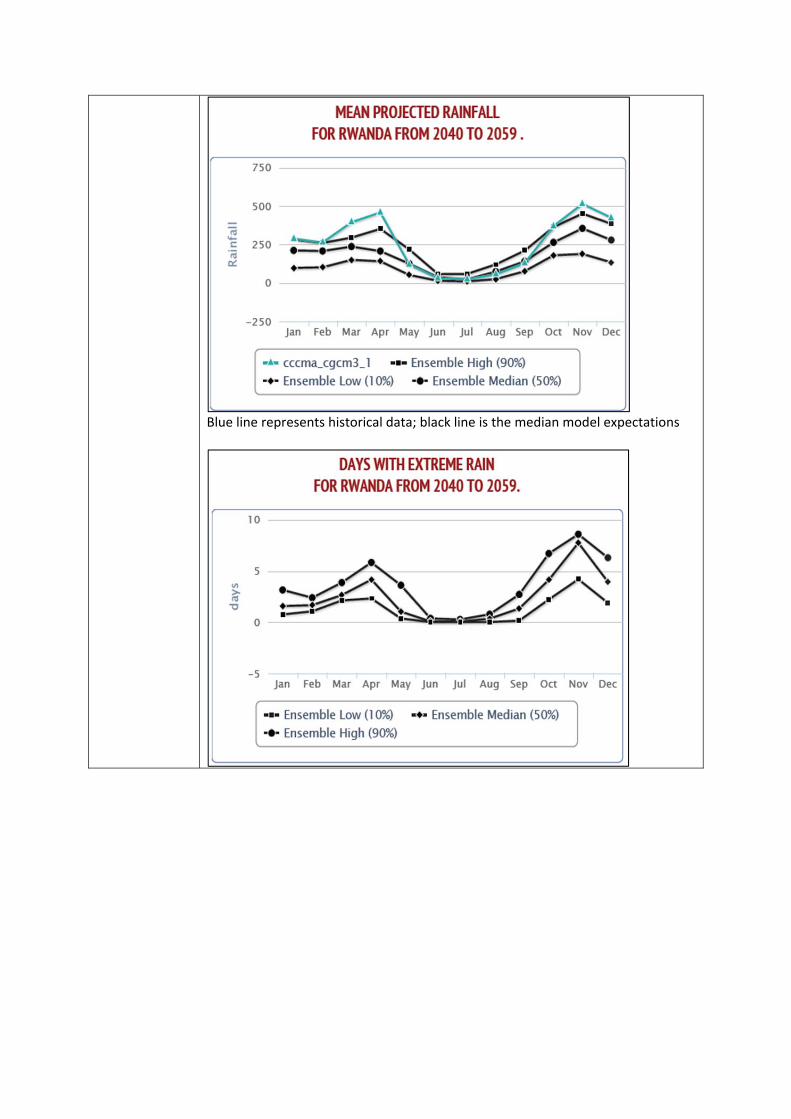
Blue line represents historical data; black line is the median model expectations

Risk / Impact analysis
There is a multi‐hazard risk mapping exercise underway, which will start looking at flood, landslide and droughts (see annex). The impacts of climate change on agriculture in Rwanda are uncertain (Watkiss et al, 2010). Under some futures and with certain models, there are potentially important impacts on agriculture, but under other scenarios, there are modest effects or even benefits. However, the literature is primarily based on crop models, and thus does not take account of extreme events fully, or the effects of changing prevalence and range of pests and diseases (though they also do not take account of farm level adaptation or agricultural development). The green growth strategy cites Liu et al (2008) which projects that Rwanda could be a hotspot for food security, but this finding should be interpreted with caution, i.e. compared to other East African countries, the effects on the sector in Rwanda are likely to be more modest. The analysis of future drought risks are highly uncertain, and many models project relative decreases in event frequency/severity with climate change, though the risk of more negative changes, especially from changes to ENSO cycles, is potentially possible. There is little information on agro‐ecological zone shifts, though regional studies indicate potential issue for coffee (Davies et al, 2013). The analysis of the impacts of future extreme events is not advanced, though this is very challenging, as it usually involves complex casual chains (especially for drought). There is also a need to take account of changing vulnerability (e.g. from development). Nonetheless, there is some potential, especially with more sophisticated risk mapping, which could build on the existing multi‐hazards assessment.
Uncertainty There is no consideration of uncertainty, other than some vague general statements which are mostly focused on the effects on yields (e.g. in the SEA).

Adaptation analysis
The short‐term focus is on addressing the current adaptation deficit, i.e. current climate variability. There are some medium term aspects in relation to irrigation and roads, in relation to resilience versus lock‐in. For agricultural futures and development plans the key risk is from long‐term agro‐ecological shifts from climate change and potential impacts on crop and export potential (coffee and tea). The decision context is primarily based around future risks (long‐term, i.e. after 2030), thus is more concerned with iterative climate risk management (risks of long‐term change, lock‐in, etc.). The decision context is related to understanding these risks and preparing iterative programmes and monitoring. The key climate information needs relate to future climatic shifts, especially related to agro‐meteorological parameters, and possible thresholds for key crops (e.g. temperature tolerance levels for coffee), with a high focus on uncertainty and information for iterative planning (uncertainty information).
Capacity levels Capacity levels are generally low.
Climate information needs
Climate projection [regional] multi‐model. Precipitation, particularly extremes Drought related metrics – as linked to the multi‐hazard mapping End of the season (EOS) WRSI (Water Requirements Satisfaction Index Uncertainty critical for precipitation and extremes.
Hydrological information needs
See earlier tables in annex
Other information needs
Population, urbanisation Agricultural future and and development It would also be interesting to explore thresholds for long‐term challenges, i.e. the maladaptation aspects from
Key conclusion Does it make a difference?
Current climate variability is clearly a major issue for Rwanda. The effects of future climate change are unclear, though there are potentially important risks, e.g. to agricultural investment, and for long‐term risks. In policy terms, the translation of these risks has been recognised in the documents, and there are already mainstreaming activities going on. However, these are based on qualitative information, with no consideration of uncertainty, and this raises the potential issue of mal‐adaptation, especially as this generic information is used to make firm policy recommendations. The focus is – quite rightly – on the short‐term with a focus on climate variability. However, the consideration of mainstreaming into infrastructure is also included.

The consideration of long‐term aspects are currently ignored.
Source REMA
The Rwanda Environmental Management Authority (REMA) published Guidelines for Mainstreaming
Climate Change Adaptation and Mitigation in the Agricultural Sector. The below graphic, taken from
the Guidelines, demonstrates the impact that climatic changes may have agriculture and,
subsequently, development in Rwanda
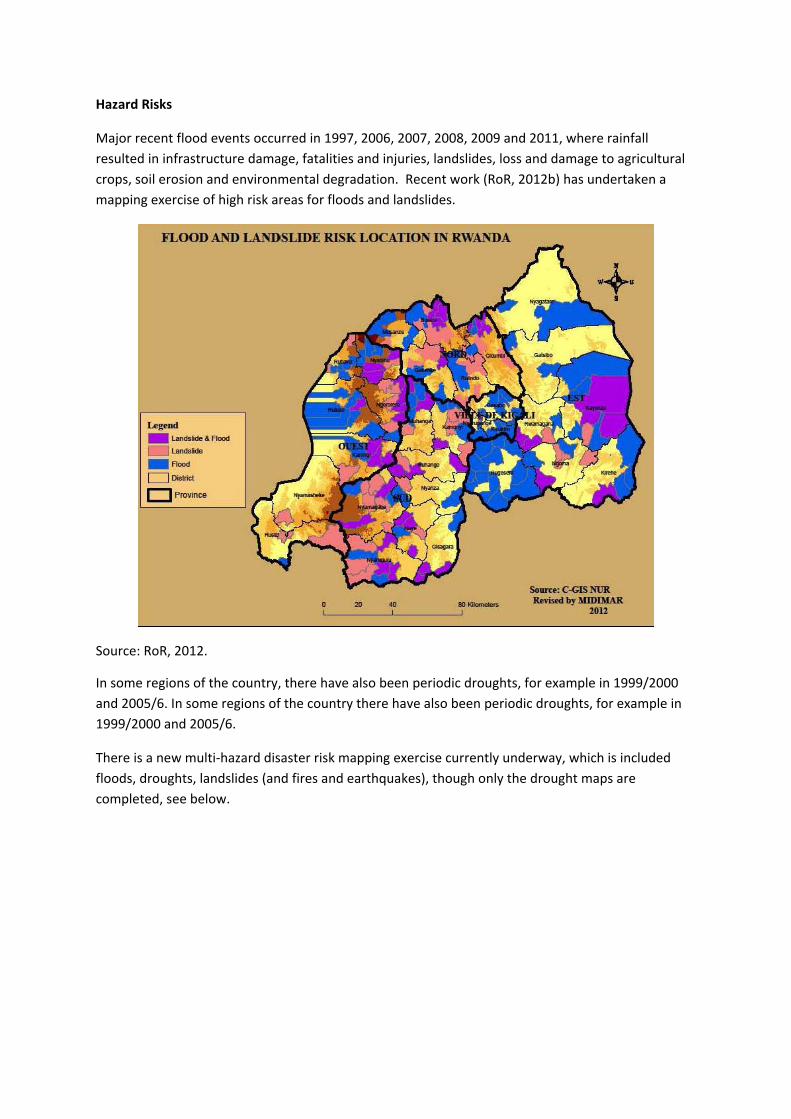
Hazard Risks
Major recent flood events occurred in 1997, 2006, 2007, 2008, 2009 and 2011, where rainfall
resulted in infrastructure damage, fatalities and injuries, landslides, loss and damage to agricultural
crops, soil erosion and environmental degradation. Recent work (RoR, 2012b) has undertaken a
mapping exercise of high risk areas for floods and landslides.
Source: RoR, 2012.
In some regions of the country, there have also been periodic droughts, for example in 1999/2000
and 2005/6. In some regions of the country there have also been periodic droughts, for example in
1999/2000 and 2005/6.
There is a new multi‐hazard disaster risk mapping exercise currently underway, which is included
floods, droughts, landslides (and fires and earthquakes), though only the drought maps are
completed, see below.

Source RoR, 2014.13
The strong rains, and hilly terrain, are a factor in soil erosion, which is high in Rwanda (field studies
report 35 and 246 t/ha per year, Olson and Berry and recent GIS monitoring estimates one‐half of
the country experiencing soil erosion rates of 50 tonnes per hectare per annum, and a third
experiences losses of 100 tonnes per hectare per annum, REMA). These losses reduce land
productivity.
13 To evaluate drought hazard in Rwanda, the analysis defines occurrence of drought relative to a crop specific water requirements. The approach compares the water supplied by rainfall (or irrigation) against the water requirements of a particular crop as both components vary throughout the season. The lengths of growing seasons A and B were considered for key crops normally grown in Rwanda. At the end of the season (EOS), a numerical index is computed, the WRSI (Water Requirements Satisfaction Index) which is 100 in case the crop water requirements are fully satisfied throughout the season and increasingly below this value the more the rainfall is unable to satisfy crop water needs. Decadal rainfall data for the period of March 2001 to February 2014 were processed. Maize was used as a proxy crop, for the two rainy seasons, A and B.
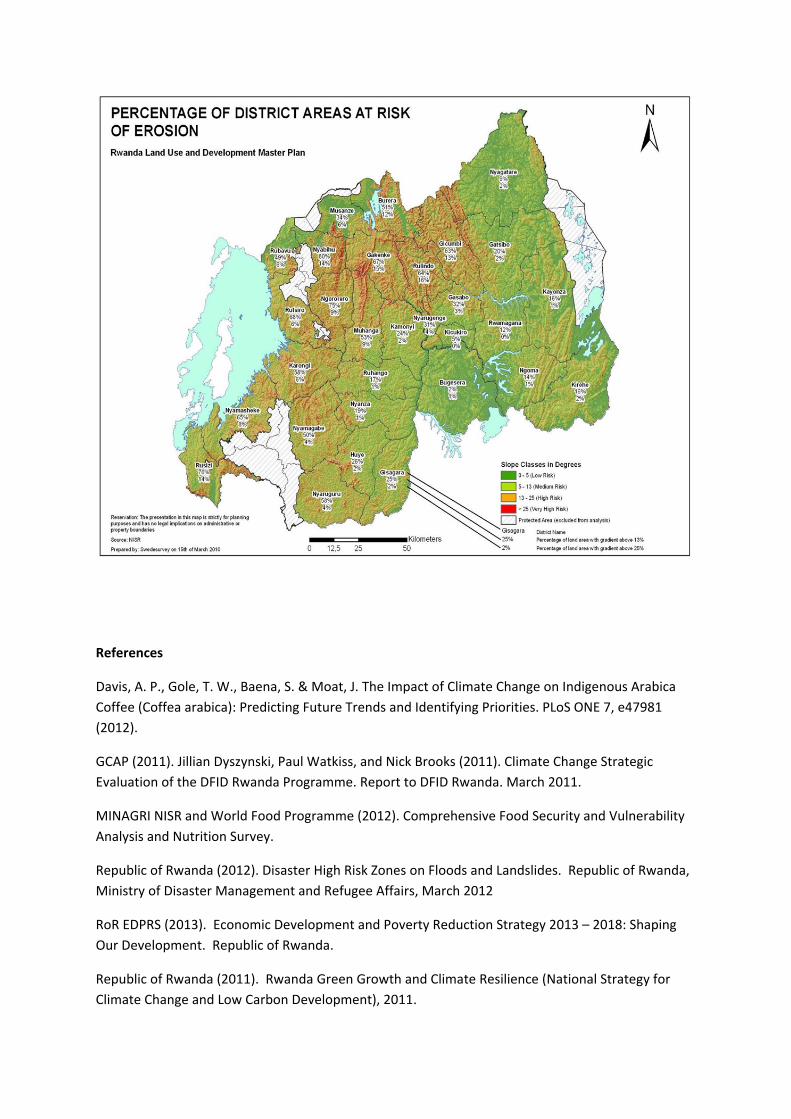
References
Davis, A. P., Gole, T. W., Baena, S. & Moat, J. The Impact of Climate Change on Indigenous Arabica
Coffee (Coffea arabica): Predicting Future Trends and Identifying Priorities. PLoS ONE 7, e47981
(2012).
GCAP (2011). Jillian Dyszynski, Paul Watkiss, and Nick Brooks (2011). Climate Change Strategic
Evaluation of the DFID Rwanda Programme. Report to DFID Rwanda. March 2011.
MINAGRI NISR and World Food Programme (2012). Comprehensive Food Security and Vulnerability
Analysis and Nutrition Survey.
Republic of Rwanda (2012). Disaster High Risk Zones on Floods and Landslides. Republic of Rwanda,
Ministry of Disaster Management and Refugee Affairs, March 2012
RoR EDPRS (2013). Economic Development and Poverty Reduction Strategy 2013 – 2018: Shaping
Our Development. Republic of Rwanda.
Republic of Rwanda (2011). Rwanda Green Growth and Climate Resilience (National Strategy for
Climate Change and Low Carbon Development), 2011.

Republic of Rwanda (2012). Second National Communication Under The United Nations Framework
Convention On Climate Change (U.N.F.C.C.C). Ministry Of Natural Resources. June 2012.
Republic of Rwanda (2012b). Disaster High Risk Zones on Floods and Landslides. Republic of
Rwanda, Ministry of Disaster Management and Refugee Affairs, March 2012.
Watkiss, P, Downing, T., Dyszynski, J., Butterfield, R., Devisscher, T., Pye, S., Olwoch, J., Harding, B.,
M., Hunt, A., Taylor, T., Bouma, M. Kovats, S., Maitima, J., Mugatha, S., Kariuki, P., Chambwera, M.,
Birch, T., Lager, B., Suazo, J., Rwamuhizi, F., Nyberg, Y., Bizimana, J. P., Mugiraneza, T., Ford, R.,
Nduwamungu, J. Twarabamenye, E., Christine M., Simbizi, D., Mwesigye. E., and Habineza, F.
(2009). The Economics of Climate Change in Rwanda. Final Report to DFID. Led by the Stockholm
Environment Institute, Oxford. Available at
http://rwanda.cceconomics.org/rwdo/Final%20Report.pdf

Hydro-electricity
Climate resilience for new Hydro‐electricity projects in Rwanda Outline of the case study
Rwanda has ambitious plans for electricity generation expansion, as set out in the Energy Sector Strategic Plan (2012 – 2017) and the draft National Energy Policy Plan (draft 2014). This includes plans to increase generation capacity (significantly) focused primarily on green sources. There are several planned or potential hydro‐electricity schemes in these plans, which could be potentially affected by climate change. These will be assessed further in the planned Least Cost Power Development Plan (LCPDP). Given the long life‐time of these plants, and the high up‐front capital investment, there is an issue of whether to increase their resilience to future climate change (i.e. to climate proof them), balancing this against the cost penalty. The analysis of this forms the basis for the case study.
Definition of problem (risks)
Changing climate risks can affect hydro‐electricity schemes in numerous ways, affecting river flows, river siltation volumes, extreme river flows, evaporation, risk of damage, etc. These have the potential to affect run‐of‐river and storage (reservoir) schemes (though in different ways).
It can potentially change the annual and seasonal generation (kWh) or guaranteed power, or the maintenance regimes and costs, and thus affecting future project profitability / revenues / loan repayments. The key factors are the source yield (where there is a reservoir) and low river flows (run‐of‐river). Both of these are dependent on rainfall amount and variability, and also to evaporation within the catchment and directly from reservoirs.
There are also potential changes to the risks of damage to plant components or infrastructure from changing extremes and high river flow/flood (design discharge), with damage in‐stream and broader infrastructure, especially if the flood waters contain significant sediment and boulders.
Heavy precipitation and increased soil erosion can result in higher sediment flows in the river, which can reduce the capacity (generation) and also the lifetime of storage projects. It can also damage run‐of‐river projects, as the desanding basins (sediment traps), provided to control the sedimentation may not be able to control sediment flow passing through, leading to increased wear and tear of the turbine blades. This results in increased down‐time for more frequent maintenance.
Climate change can also change the overall water supply and demand, thus affecting the ancillary benefits of schemes, e.g. in relation to local irrigation availability. While run‐of‐river plants are not consumptive (i.e. they do not use water), reservoirs do result in some loss due to evaporation. There is also an issue of inter‐sectoral linkages, and the need to balance supply and demand for municipal, industrial, agricultural irrigation and hydro‐electricity. An issue may arise where downstream irrigation increases due to climate change, affecting reservoir water release schedules and may affect the optimal production conditions for generation, so for example, the need to meet irrigation requirements could lead to suboptimal production conditions for hydro‐electricity plants upstream.
Finally, it is possible that major changes in generation could lead to problems in meeting electricity demand, affecting multiple

sectors/households. Dry years are a particular issue and can result in increased cost of power generation due to increased thermal generation / increased imports.
These risks are considered material, but they are unlikely to lead to the halting of projects or plans, and thus more likely to affect design criteria, etc. However, it is possible that under projections of future drier outcomes, there might be concerns about the viability of hydro because of secure generation.
Timing of the problem / action (development decisions are currently being made that have medium and/or long‐lived implications)
Near‐term planned projects exposed to future changes in variability and extremes, as well as slow‐onset trends, over the economic/operating lifetime of the plant. Operating plant lifetime could be potentially 50 years for large plants, though economic lifetime considerably less than this. Note may also be an issue for existing plants, however, greatest potential for future resilience at the design stage.
Categorisation Type II adaptation problem, i.e. ‘climate proofing/mainstreaming’ ‐ building long‐term resilience into the scheme design for near‐term investment in high capital investment plant (infrastructure).
Organisations/ Actors (agents of change)
MININFRA (Ministry of Infrastructure). Lender/financing provider for schemes. This varies with the scheme but involves multi‐lateral/IFI/DPs. Private sector developers – as public‐private initiatives or independent power projects
Entry points Strategic level: Sector development plans. Energy Sector Strategic Plan and National Energy Policy Plan [NEPP] (draft 2014). Strategic Environment Assessment of National Energy Policy plan. Project level: Environmental Impact Assessment of individual projects (projects undertaken by private developers must undertake an Environment and Social Impact Assessment). Climate Risk Screening/Climate safeguard analysis from Lender/Development Partner, where co‐financed/loan/grant. Public private partnership agreements. Sector Development Plans are also subject to the Checklists and Guidelines for Environment and Climate Change (CC) Mainstreaming into Sectors and District Development Plans (DDPs (Annex 19 budget circular) This has indicators for introduction of mini‐hydro, but not resilience indicators for hydro. indeed, it highlights Rwanda has high proportion of hydropower, and in recent years, poorly protected watershed areas and erratic rains have affected Rwanda’s hydroelectric power generation resulting in an additional economic cost for additional diesel generation.
Is the problem recognised?
Yes, during 2004 and 2005, Rwanda suffered from a prolonged drought, drying up the seasonal rivers and doubling electricity prices in the country.

The NEPP recognises future risks under policy principle 05) Integrate environmental and climate change concerns into energy planning and development. Integrating expected rainfall and hydrological shifts into the planning, design, construction, and operations of Rwanda’s hydroelectric power facilities. As the dominant modern energy source in the country; hydropower generation, is likely to be the most directly affected by climate change, because it is sensitive to the amount, timing and geographical pattern of precipitation and temperature. Climate change is being considered as part of the Strategic Environment Assessment of the NEPP. There is also a recognition of the need for risk screening. MININFRA shall ensure that major new energy investments and programs do not materially damage the environment and natural habitats and take into account climate risks and adaptation strategies. Operationalised through (a) introducing controls and systems in energy infrastructure planning and design processes to robustly address climate change and disaster risk management; Under cross cutting issues, the NEPP outlines
i. A climate‐related risk assessment for the energy sector shall be conducted in late‐2014 to highlight major vulnerabilities in strategic policy and planning. These assessments will identify areas for institutional strengthening so that energy infrastructure is less vulnerable to climate change, natural disasters, and other extreme weather events. Following a one year review after the adoption of these plans, MIINFRA shall further consider whether more stringent regulations are necessary to be adopted with support from a sister regulatory authority.
ii. Promoting a mix of energy supply and power generation options increasing investment in domestic resources, even if not at the lowest financial cost of production, and by expanding regional trade in all energy commodities in order to ensure sufficient supplies and reliable reserves.
A review of existing EIA was undertaken for a recent plant (Environmental Audit for Rukarara II Hydropower Plant Project) Rukarara I, II and Agatobwe Micro Hydropower Plants projects (Rukarara I Small Hydropwer Plant (Installed capacity 9.16MW) in Nyamagabe District, Rukarara II (2.2 MW) in Nyamagabe District and Agatobwe(200kW) in Nyaruguru District.) The EIA is good and comprehensive – but does not consider the risks of climate change (though the benefits in reducing GHG are recognised). This EIA and EMP were designed for these hydropower projects, so that all investments complied with the relevant laws of Rwanda and the Environmental and Social Safeguard Policies of the World Bank. (Note this highlights the important linkage between the DP and Rwandan context – such that the consideration of these issues is likely to arise from DP obligations)

This raises the question of whether resilience should be in design report (HPP Rukarara II, Design Report 2011)
Is climate information current Does the capacity exist to generate /interpret climate information in‐country
No, most analysis to date has been qualitative as in the SEA, or omitted as in the EIA No, in that there are low levels of climate modelling expertise in‐country, thus any capacity for analysis would have to come from outside (e.g. as part of technical assistance from DPs or through contracted assessment).
Potential types of adaptation response and consideration of uncertainty
There are a large number of options, at the system level (energy policy) and at individual plant level, and these include technical and non‐technical options ‐Capacity building (e.g. enhanced integrated water resource management [institutional strengthening], better hydrological data collection/monitoring and forecasting systems, research and development e.g. into appropriate turbine and design, future flow regimes, etc.). ‐Low‐regret (current) ‐ retro‐fitting to upgrade the efficiency of power generation facilities and offset any potential changes in river flow. ‐Enhanced meteo and hydrological observations and streamflow forecasting, linked to early warning systems ‐Low cost incremental design modifications to planned hydro power projects e.g. different turbines to cope with greater flow variations/higher volumes/higher silt, potential to cope with future risks through safety over‐design such as enhanced spillway capacity or emergency spillway facilities, increased discharge design, sediment handling etc ‐Changes to reservoir rule optimisation ‐Changes to planned maintenance regimes. ‐Robustness (e.g. scheme/turbine optimised to cope with future higher flow variations or cope with higher silt volumes). ‐Flexibility (e.g. infrastructure/size designed to allow future upgrades to turbines or overflow height more easily). ‐Insurance or risk sharing arrangements ‐Iterative risk management (e.g. enhanced monitoring programme of river flows, etc. with later set of potential adaptation options). ‐Hedging/Portfolio. (e.g. mix of plant on the system, e.g. the mix of pico‐ or micro‐schemes versus larger schemes, balance of run‐of‐river and storage). This could also include the ratio of domestic versus imported hydro (invest in regional interconnections), or a shift away from hydro to other forms of electricity generation domestically. ‐Demand side management (including seasonal management for low flows)
Key Trade‐Offs Whether these future risks are worth paying for now, at the time of construction, especially as they lead to increases in scheme costs today, when benefits will arise in future periods, and will be low in the scheme appraisal due to high discount rates / short pay back times. Many hydro projects will be assessed with a 12% discount rate (in public economic appraisal by the DPs). Private rates likely to be higher, thus quick pay‐back offsets the value of future

resilience.
Other ancillary issues or policy aspects
Low carbon objectives (Rwanda)
Access to electricity (key target) and potential for rural off grid hydro / potential for rural economic development
Cross‐sectoral linkages to water and irrigation (agriculture)
Energy security (e.g. domestic versus imports).
Existing studies in Rwanda
An older regional environmental impact assessment of hydro‐schemes in East Africa as part of the Nile Basin Initiative (SNC and Stratus, 2006) did consider the risks of climate change to a number of hydro‐plants in Rwanda/border. This included the 62 MW proposed (2012) Rusumo Falls project on the Kagera river Burundi/Rwanda/Tanzania) and the 82 MW proposed (2014) Ruzizi III on the Ruzizi river Rwanda/DRC. This assessed the impacts of climate change on hydro‐electricity stations from a combination of changes in precipitation, run‐off and river flow, surface water evaporation, various impacts from changes in variability (reduced run‐off due to droughts and increased run‐off due to floods) and secondary effects such as impacts of siltration deposits and sedimentation. The analysis used a hydrological model and considered two future scenarios, to represent a central and high projection, based on an analysis of a large number of GCM outputs. The study highlights that while all models show warming, there is a wide range of model projections of precipitation, including projected increases and decreases across the models (with annual and seasonal variations) though for most of the study areas, the models generally reported increases in precipitation and run‐off. The study looked at storage‐yield curves (as well as run‐off), to show the amount of water storage necessary to provide a reliable amount of water in each time period. Note that the wettest and driest models were selected, not the hottest and coolest, for the analysis. For the Rwanda/Uganda scheme, both models projected an increase in precipitation, even in dry months, though it was noted that was less agreement among the models about seasonal changes than annual changes in precipitation. The study also looked at the “signal to noise” (SNR) ratio for precipitation to consider agreement. The study looked at run‐off and storage‐yield. For the Rwanda/Burundi scheme, the study found increased variability. It also suggested that larger reservoir capacity schemes could better cope with increased variability (which was important as under some scenarios, the shape of the storage yield curve changed. However, overall with a risk analysis, the study considered that the level of change (especially in early years) was minimal. Note that for other regions studied (notably in Tanzania) the dry models did indicate run‐off was reduced to the point where the scheme viability could be affected. Alongside this, the study highlighted the potential for increased flood flows in all regions. thus designs for flood discharge during construction and over a permanent spillway should take this into account (noting this would increase project costs). The analysis highlights the need for detailed data as an input to the hydrological analysis (e.g. seasonal or monthly data), and the need for detailed hydrological modelling analysis. The draft SEA of the NEPP highlights the supply side risks from climate change

(to biomass, hydroelectricity) but only in qualitative terms.
Other potentially relevant studies
The standard engineering approach often looks at probability, which is not a good fit for future climate change uncertainty. Some studies (e.g. Grijsen et al, 2013 Ghile et al, 2014) do apply these concepts to look at climate change and hydro with risk management and seek to identify first the response of important performance metrics to parametrically varied changes in climate, and then use available climate change projections to assess which of these performance variables could be affected. This can therefore look at the sensitivity to changes in river runoff of performance indicators significant for hydro‐energy generation (e.g average annual/seasonal generation, guaranteed power) from changes in climate. This involves detailed hydrological models and analysis, and still tends to work with a probabilistic engineering view. These studies also consider worst case scenarios, to look at issue such as design discharge levels. There are also examples of decision making under uncertainty. There has been the application of robust decision making to dams (Nassopoulos et al, 2013) and real options analysis to multi‐dam development in Ethiopia (Jeuland and Whittington, 2013). The first of these test multiple scenarios. The latter is an extremely complex study which applies ROA to look at a portfolio of large schemes.
Climate analysis Projections of rainfall (and thus run‐off and stream flow) for Rwanda are under climate change show high uncertainty. Although the intensity, frequency and spatial distribution of precipitation are unknown, all the climate model scenarios show that average rainfall regimes will change. The majority of the projections indicate that average annual rainfall will actually increase, particularly in some seasons, indicating a potential strengthening of the rains. However, some models show reductions in rainfall in some months. The range of model results highlights the considerable uncertainty in predicting future rainfall changes. Examples of projection data (from main report) are shown below. A more detailed review of model projections (GCMs) for East Africa (Shongwe et al, 2009) looking at the longer term (where the climate signals are clearer) also found that many models indicate the intensity and frequency of heavy rainfall extremes may increase in the wet seasons.

Risk / Impact analysis
There does not appear to be detailed hydrological modelling runs for future climate change in Rwanda. The information that does exist is part of regional initiatives (e.g. Nile Basin) or external technical assistance (e.g. the earlier hydro EIA). The Ministry of Natural Resources had undertaken integrated water resource management modelling out to 2040, and had wanted to include climate change in their demand‐supply projections, they had not been able to do this because they did not know how to use the climate projection information in their models.
Adaptation analysis
The potential increase in high flows and river floods indicates rising flood frequency and intensity, which means facilities might need to be planned with greater capacity for high flows. Indicative evidence from other countries suggest the additional costs to deal with changing flows (IDS, 2014) to build this headroom is estimated at 10% to 15% per facility (at design stage). Changing the mix of plants (e.g. more small‐scale) is likely to lead to higher marginal costs of generation compared to larger‐scale hydro. Diversifying from hydro to other electricity supply is also like to increase costs (higher marginal costs of generation). It is also clear that the payback periods for plants are short, thus the focus is likely to be on the next decades, not the long‐term (e.g. before 2040).
Capacity levels The NEPP reports Prior independent assessments in the hydropower sector, found that many local private energy developers lacked foundational skills in basic hydrology and plant engineering to devise appropriate plant designs.
Climate information needs
Climate projection [regional] multi‐model. Temperature, evaporation, precipitation. Issue of date period, ideally daily data (not monthly) to capture flow variations. Issue of bias correction (for rainfall, to align observed and modelled hind cast data). Information on levels of variability important because of historical low flows and problems, and high flows and risks.
Uncertainty It is useful to understand the sensitivity of key metrics such as source yield and low river flows to climate; this can be achieved empirically or/and through use

of the models described above (e.g. through systematic variation of rainfall and PET) as well as extreme events and high flow (including maximum, i.e. worst case) for damage assessment and safety. Uncertainty in future climate can be managed through use of multi‐model ensembles and different emissions scenarios. In addition, uncertainty in inter‐annual variability (which is important for understanding the reliability of yield) can be explored, if not resolved, through use of simulations which provide alternative plausible variations in baseline or/and future climate variability e.g. transient climate model runs, stochastic weather generators. Pragmatically there is often a need to limit the number of impact model runs, particularly if these are computationally expensive. In this case it is best to explore the range of climate projections (e.g. rainfall and PET), ideally in conjunction with an understanding of the sensitivities, in order to select specific climate projections for analysis. Additionally, historical data series are often short and more recent than climate model baseline periods, requiring assumptions or adjustments to change factors; in this case it is useful to compare the climate model baseline period with the available observed model.
Hydrological information needs
In order to produce quantitative estimates of source yield and river flows (historically and for the future), modelling is required. This is primarily achieved through rainfall‐runoff modelling, which simulates the process of runoff generation based on the input of rainfall and losses due to evaporation, interception by plants and infiltration to the ground, as modified by vegetation, land use, topography, soils and geology. Rainfall‐runoff models range from coarse resolution regional models, with simplified descriptions of vegetation etc, through to more detailed catchment models (and for other applications to field or site scale models). Note low flows highly relevant for run‐of river, high flows for flood risks. Storage‐yield relationships are established for reservoirs that describe the reliable yield (outflow) of a reservoir over different time periods based on the storage capacity. Reservoirs are generally designed to be full, based on analysis of their inflows and the need to maintain a certain downstream flow. Sediment models simulate the processes that result in delivery of sediment to watercourses and its movement downstream. There are often linked to rainfall‐runoff models as rainfall (or/and runoff) is often the cause of erosion, entrainment and transport of sediment to watercourses, although other processes can be important e.g. human activity, fire, wind. There is often statistical analysis (derivation of Flow Duration Curves) to assess the impact of climate change on hydrology (stream‐flows) and on hydro‐power generation. Issue of annual flow duration curve, but also daily exceedance probability. Flood Frequency Analysis using observed and simulated stream‐flow data to assess the impact of climate change on floods. This includes instantaneous annual maximum flood estimates. There can be issues here of capturing daily flow with daily hydrological models rather than monthly models. Long‐term historical data sets are required to calibrate and validate rainfall‐runoff and sediment models. Ideally this will extend to at least 30 years (and preferably will match climate model baseline periods e.g. 1961‐1990, 1971‐
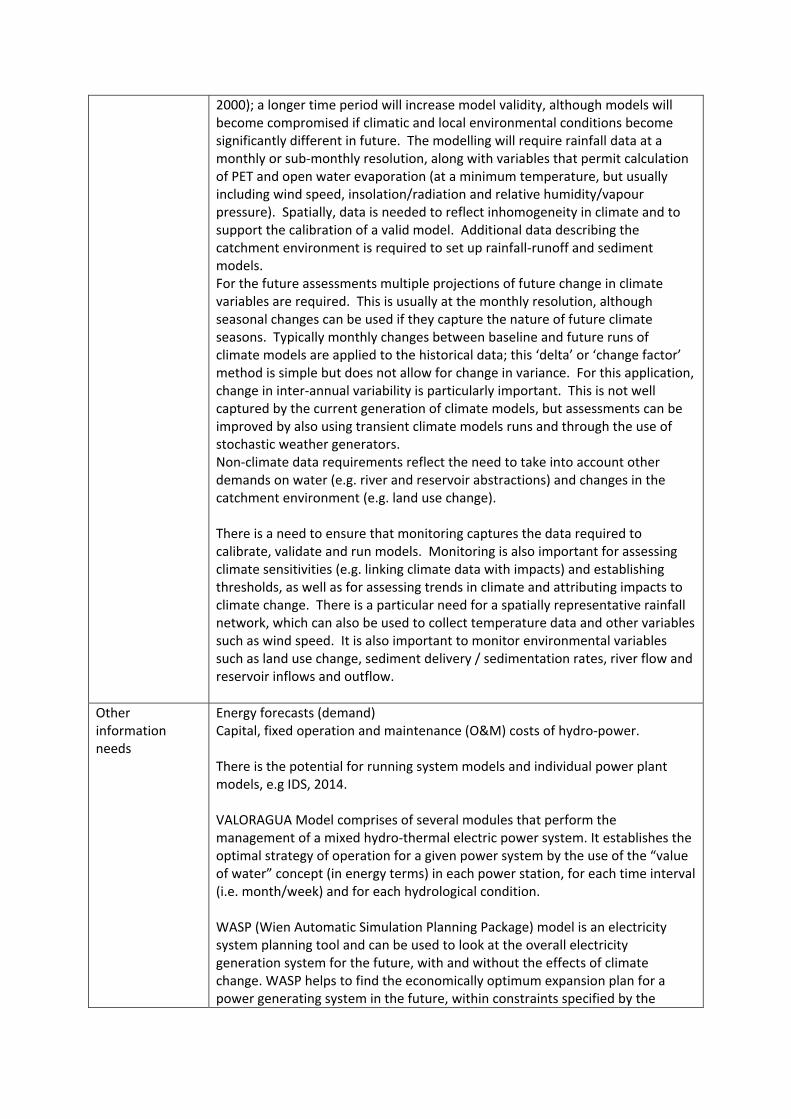
2000); a longer time period will increase model validity, although models will become compromised if climatic and local environmental conditions become significantly different in future. The modelling will require rainfall data at a monthly or sub‐monthly resolution, along with variables that permit calculation of PET and open water evaporation (at a minimum temperature, but usually including wind speed, insolation/radiation and relative humidity/vapour pressure). Spatially, data is needed to reflect inhomogeneity in climate and to support the calibration of a valid model. Additional data describing the catchment environment is required to set up rainfall‐runoff and sediment models. For the future assessments multiple projections of future change in climate variables are required. This is usually at the monthly resolution, although seasonal changes can be used if they capture the nature of future climate seasons. Typically monthly changes between baseline and future runs of climate models are applied to the historical data; this ‘delta’ or ‘change factor’ method is simple but does not allow for change in variance. For this application, change in inter‐annual variability is particularly important. This is not well captured by the current generation of climate models, but assessments can be improved by also using transient climate models runs and through the use of stochastic weather generators. Non‐climate data requirements reflect the need to take into account other demands on water (e.g. river and reservoir abstractions) and changes in the catchment environment (e.g. land use change). There is a need to ensure that monitoring captures the data required to calibrate, validate and run models. Monitoring is also important for assessing climate sensitivities (e.g. linking climate data with impacts) and establishing thresholds, as well as for assessing trends in climate and attributing impacts to climate change. There is a particular need for a spatially representative rainfall network, which can also be used to collect temperature data and other variables such as wind speed. It is also important to monitor environmental variables such as land use change, sediment delivery / sedimentation rates, river flow and reservoir inflows and outflow.
Other information needs
Energy forecasts (demand) Capital, fixed operation and maintenance (O&M) costs of hydro‐power. There is the potential for running system models and individual power plant models, e.g IDS, 2014. VALORAGUA Model comprises of several modules that perform the management of a mixed hydro‐thermal electric power system. It establishes the optimal strategy of operation for a given power system by the use of the “value of water” concept (in energy terms) in each power station, for each time interval (i.e. month/week) and for each hydrological condition. WASP (Wien Automatic Simulation Planning Package) model is an electricity system planning tool and can be used to look at the overall electricity generation system for the future, with and without the effects of climate change. WASP helps to find the economically optimum expansion plan for a power generating system in the future, within constraints specified by the

planner. WASP requires that the technical, economic and environmental characteristics of all existing power plants in a country’s electricity generation system are defined, as well as information on candidate (future) projects. The characteristics include plant capacities, minimum and maximum operating levels, heat rates, maintenance requirements, outage rates, investment costs, fuel and operation costs, emission rates, etc. as well as the load forecasts from individual modelling of plants.
Key conclusion Does it make a difference?
Unlikely to make a major difference. Small plants have very short pay‐back times, which would count against major resilience. However, there are already small plants that have not lasted for their planned economic lifetime, due to the choice of turbines, or lack of maintenance. A key issue is thus to ensure better planning and maintenance regimes for the current climate. The main potential risk seems to be around future higher flows, and thus some design discharge modifications might be justified, especially for large plant, over and above the economic payback, because of safety (especially on large plants). The one more material risk would be if there were major increases in low flow years projected, because this would have an impact on generation, and would influence the role of hydro in the system, because of guaranteed power as well as economics. The projections do not seem to indicate this is a major risk, thus there is the potential for maladaptation if hydro was dropped out of the mix or penalised. What was particularly interesting is that the relevance for the sector varies, i.e. it is not a case of all hydro‐plants should undergo climate risk screening and adaptation. The key difference identified was between small (micro) and large hydro, due to the lifetime of these plants and the opportunity cost of money, i.e. most small plants have an intended payback period of 5 to 10 years, so it makes little economic sense to increase costs by over‐design. In contrast there are longer life‐times involved in major plants (noting there are differences in risks for storage and run‐of‐river plants). A further issue arose over the climate information and the risk from climate change. The previous projections indicate an increase in average rainfall and extreme events, thus the risks are minor and can be accounted for by extra contingency in design. However, the more recent projections indicate a stronger pattern of dry spells and thus the potential for lower generation levels, or low seasonal flow issues. This highlights some of the issues in designing for the available information, when the confidence is low and the information is changing. This highlights that even for a potentially at risks development, it still depends.
How would better communication and understanding of available climate information (and
As with the main conclusions, there is a need for more harmonised climate projection information, including uncertainty, and the need for a boundary organisation to help in the dissemination and use of this information.

uncertainty) affect the design of the policy/ programme?
How could climate science be better integrated into decision‐making processes to make policy and planning more robust to future climate?
The Ministry of Natural Resources could include climate change in integrated water resource management modelling out to 2040, in demand‐supply projections. There is a need to strengthen the requirement to include climate analysis in the design stage – it may be that this is more relevant for the design analysis rather than the EIA (note by the time the EIA is undertaken, the plant design is largely finalised). There is also a strong link to the DP as the financing linkages to hydro, which links to the DP climate safeguard systems. There is more potential for adaptation decision making under uncertainty, with sensitivity (range, agreement) as well as techniques such as robust decision making, real options, iterative planning. However, in practice, even sensitivity testing is likely to only be justified for large plants, and is unlikely to involve detailed analysis unless an extreme problem is identified. Moreover, most of these assessments are made by engineers, and this leads to a number of issues. Firstly, the use of climate information in coupled hydrological models introduces additional complexity and increase resources needed (especially when handling multi‐model information) thus this is a barrier to using more complex approaches (and tends towards simple testing of central and worst case examples). Second, they work with an engineering approach (probability‐based) with engineering responses, and it would be difficult to introduce other approaches and responses (e.g. robustness or flexibility), i.e. there are capacity problems.
background
Hydro‐plants include both run‐of‐river plants, where there is little or no control over the discharge,
and thus the daily discharge is the natural flow of the river; and storage plants, where there is
reservoir for flow regulation. This can include further variations, e.g. run‐of‐river (RoR) without
regulation, RoR with small regulation where storage in reservoir is low compared with river flow, and
storage (or reservoir) type.
Key information linkages on the hydro side are summarised below.
Theme Sensitivity End user
requirements
Processing Climate data
requirements
Non‐climate data
requirements
Historical Future Historical Future

Theme Sensitivity End user
requirements
Processing Climate data
requirements
Non‐climate data
requirements
Historical Future Historical Future
Hydro‐ Rainfall
amount and
variability;
evaporation
(temperature)
Sedimentation
Source
(reservoir)
yield
Low river
flows (run‐of‐
river)
High flow
(discharge)
Rainfall‐
runoff
modelling
Storage‐
yield
relationships
Sediment
modelling
Long‐term
historical
monthly
rainfall
Variables
for
calculation
of PET and
open water
evaporation
Multiple
projections
of future
change in
monthly
rainfall and
PET/temp.;
change in
inter‐
annual
variability*
Other
demands
Other
demands;
land‐use
change
Discussion of Hydropower in the National Energy Plan (NEPP, 2014)
Rwanda’s power supply has around 106 MW14 of installed generating capacity and 91 MW of
available capacity. The installed capacity is made up of approximately 42.3 MW of domestic hydro,
15.5 MW of regional hydro imports, 48.3 MW of thermal plants (20 MW rental diesel), and 0.25 MW
of solar power.
The cost of electricity is high – due to the high‐cost generation from diesel and Heavy Fuel Oils and
low demand for electricity ‐ with an average end‐user cost at US$ 23 cents/kWh for domestic
consumers despite heavy government subsidies.
The aim is to meet projected demand expected to exceed 400 MW by the end of 2018 with installed
generation of 563 MW to account for a reserve margin and system losses by diversifying resources
over time and increasing the share of clean power generation in the total generation mix over time;
Studies suggest that Rwanda’s topography is most suitable for medium to high head pico‐ and micro‐
hydro run‐of‐river schemes. Rwanda’s overall technical hydropower potential has been estimated at
about 500 MW, but the most significant resource assessment conducted to date, roughly five years
ago—the Rwandan Hydropower Atlas—found that the majority of sites identified would be rated
between 50 kW and 1 MW in terms of capacity. This study estimated a potential of 96 MW for the
category of micro‐hydro projects. Although this study was fairly comprehensive, with some 333
potential sites identified across a large number of locations, additional viable sites have already
been, and are likely to continue to be identified.15 Feasibility studies have been completed or are
under way for a number of sites representing at least 32 MW of technically viable new capacity. In
addition, over 192 sites have been identified for pico‐hydro potential of less than 50 kW. It is
evident that more detailed resource mapping work for the sector would be valuable, particularly
taking a river basin approach before prioritizing specific sites for development. This approach is
14 Another quote (annex) cites that the current electric power generation capacity is 113MW. Rwanda’s electric power resources are generated from the following sources: 59% hydro, 40%, diesel thermal plants, and 1% methane and solar. Roughly 18% of the population has access to an electricity connection. 15 Roughly 20% of proposed sites to be developed to date were not already included in the Hydropower Atlas. Informal
communication with Rwanda Development Board, 30 May 2014

already been taken for a comprehensive assessment of hydropower resources on the Akanyaru River
basin located on the border between Rwanda and Burundi.
Hydro References
Y.B. Ghile, M.Ü. Taner, C. Brown, J.G. Grijsen and A. Talbi Bottom‐up Climate Risk Assessment of
Infrastructure Investment in the Niger River Basin by, in Climate Change, Volume 121‐2, DOI
10.1007/s10584‐013‐1008‐9.
.G. Grijsen et al, 2013: Climate Risk Assessment for Water Resources Development in the Niger River
Basin: Part I: Context and Climate Projections; Part II: Runoff elasticity and probabilistic analysis; in:
Climate Variability ‐ Regional and Thematic Patterns, published by InTech, Croatia
Jeuland, M and Whittington, D (2013). Water Resources Planning under Climate Change: A “Real
Options” Application to Investment Planning in the Blue Nile. Environment‐for‐Development. EfD DP
13‐05.
Hypatia Nassopoulos Patrice Dumas Stéphane Hallegatte (2013). Adaptation to an Uncertain Climate
Change: Cost Benefit Analysis and Robust Decision Making for Dam Dimensioning. Climatic Change
(2012) 114:497–508. DOI 10.1007/s10584‐012‐0423‐7.
IDS‐ Nepal, PAC, GCAP (2014). Economic Impact Assessment of Climate Change In Key Sectors in
Nepal. Kathmandu. Final Technical Report. IDS‐Nepal, Kathmandu.
RoR (2014). Environmental Audit for Rukarara II Hydropower Plant Project
SNC and Stratus Consulting (2006) Strategic/sectoral, social and environmental assessment of power
development options in the Nile Equatorial Lakes region. Supplemental analysis – Climate change
and potential impacts on hydro generation. Interim report ‐ Climate change and impacts on runoff.
August 16, 2006. SNC‐Lavalin International Inc. Stratus Consulting Inc.
References
Adger, W. N., Arnell, N. W. & Tompkins, E. L., (2005) Successful Adaptation to Climate Change Across Scales,
Global Environmental Change 15, pp.77‐86.
Allan, Richard P, Brian J Soden, Viju O John, William Ingram, and Peter Good. 2010. “Current Changes in
Tropical Precipitation.” Environmental Research Letters 5 (2) (April 9): 025205. doi:10.1088/1748‐
9326/5/2/025205.
Arkell, B., Darch, G., Fawcett, D. and Sutherland, J. 2013. Practical Methodologies for Monitoring and
Responding to the Impacts of Climate Change on Industry Treatment Processes. Report Ref. No. 13/CL/01/20.
UK Water Industry Research, London. ISBN: 1 84057 682 0.
Carter, T.R., R.N. Jones, X. Lu, S. Bhadwal, C. Conde, L.O. Mearns, B.C. O’Neill, M.D.A. Rounsevell and M.B.
Zurek, 2007: New Assessment Methods and the Characterisation of Future Conditions. Climate Change 2007:
Impacts, Adaptation and Vulnerability. Contribution of Working Group II to the Fourth Assessment Report of
the Intergovernmental Panel on Climate Change, M.L. Parry, O.F. Canziani, J.P. Palutikof, P.J. van der Linden
and C.E. Hanson, Eds., Cambridge University Press, Cambridge, UK, 133‐171.
Christensen, O. B, Goodess, C. M. Harris, I, and Watkiss, P. (2011). European and Global Climate Change
Projections: Discussion of Climate Change Model Outputs, Scenarios and Uncertainty in the EC RTD
ClimateCost Project. In Watkiss, P (Editor), 2011. The ClimateCost Project. Final Report. Volume 1: Europe.
Published by the Stockholm Environment Institute, Sweden, 2011. ISBN 978‐91‐86125‐35‐6.
Conway, D. and Schipper, E.L.F., 2011. Adaptation to climate change in Africa: Challenges and opportunities
identified from Ethiopia. Global Environmental Change, 21(1), pp.227‐237.
Dai, A (2011). Drought under global warming: a review. Wiley Interdisciplinary Reviews: Climate Change
Volume 2, Issue 1, pages 45–65, January/February 2011
Dessai, S. and Hulme, M. 2007. Assessing the robustness of adaptation decisions to climate change
uncertainties: A case study on water resources management in the East of England. Global Environmental
Change, 17, 59‐72
Dessai, S.& van der Sluijs (2007): Uncertainty and Climate Change Adaptation ‐ a Scoping Study. Report NWS‐E‐
2007‐198, ISBN 978‐90‐8672‐025‐5
Dirmeyer, P. (2011, April). Floods and Droughts in a Changing Climate – Now and the Future. Earthzine.
Retrieved from http://www.earthzine.org/2011/04/29/floods‐and‐droughts‐in‐a‐changing‐climate‐
%E2%80%93‐now‐and‐the‐future/
Jillian Dyszynski, Paul Watkiss, and Nick Brooks (2011). Climate Change Strategic Evaluation of the DFID
Rwanda Programme. Report to DFID Rwanda. March 2011.
Downing, T.E. (2012). Views of the frontiers in climate change adaptation economics. WIREs Clim Change 2012.
doi: 10.1002/wcc.157.
EC. 2011. Non‐paper Guidelines for Project Managers: Making vulnerable investments climate resilient.
European Commission, Brussels.
EA (2009). TE2100 Plan Technical Report. Appendix H. Appraisal in TE2100.
Gersonius, B., Ashley, R. Pathirana, A., and Zevenbergen, C. (2013). Climate change uncertainty: building
flexibility into water and flood risk infrastructure. Climatic Change,Volume 116,Issue 2,pp411‐423.
10.1007/s10584‐012‐0494‐5
Groves, D. G. and Lempert, R. J. (2007): A new analytic method for finding policy‐relevant scenarios. Global
Environmental Change. 17: 73‐85.
Hallegatte, S (2009). Strategies to adapt to an uncertain climate change. Global Environmental Change.
Volume 19, Issue 2, May 2009, Pages 240–247. doi.org/10.1016/j.gloenvcha.2008.12.003
HMT, 2009. Accounting for the Effects of Climate Change. June 2009. Supplementary Green Book Guidance,
Available at http://www.hm‐
treasury.gov.uk/data_greenbook_supguidance.htm#Adaptation_to_Climate_Change Accessed Jan 2010
IPCC, 2012: Managing the Risks of Extreme Events and Disasters to Advance Climate Change Adaptation. A
Special Report of Working Groups I and II of the Intergovernmental Panel on Climate Change [Field, C.B., V.
Barros, T.F. Stocker, D. Qin, D.J. Dokken, K.L. Ebi, M.D. Mastrandrea, K.J. Mach, G.‐K. Plattner, S.K. Allen, M.
Tignor, and P.M. Midgley (eds.)]. Cambridge University Press, Cambridge, UK, and New York, NY, USA, 582 pp.
IPCC. Summary for Policymakers Working Group I Contribution to the IPCC Fifth Assessment Report Climate
Change 2013: The Physical Science Basis.
IPCC. Summary for Policymakers Working Group II Contribution to the IPCC Fifth Assessment Report Climate
Change 2014: Impacts, Adaptation, and Vulnerability.
Jeuland, M and Whittington, D (2013). Water Resources Planning under Climate Change: A “Real Options”
Application to Investment Planning in the Blue Nile. Environment‐for‐Development. EfD DP 13‐05.
Jeuland, M and Whittington, D (2014). Water Resources Planning under Climate Change: A “Real Options”
Application to Investment Planning in the Blue Nile. Environment‐for‐Development. Water Resources
Research. Volume 50, Issue 3, pages 2086–2107, March 2014. DOI: 10.1002/2013WR013705
Kendon, E.J., Roberts, N.M., Fowler, H.J., Roberts, M.J., Chan, S.C. and Senior, C.A. 2014. Heavier summer
downpours with climate change revealed by weather forecast resolution model, Nature Climate Change, DOI:
10.1038/NCLIMATE2258.
Klein, R J.T. and Persson, Å (2008). Financing Adaptation to Climate Change: Issues and Priorities. ECP Report
No. 8/October 2008. European Climate Platform (ECP). ISBN 978‐92‐9079‐829‐7.
Least Developed Countries Expert Group (2012a). The National Adaptation Plan Process: A Brief Overview.
UNFCCC secretariat. Bonn, Germany. December 2012. Available at:
http://unfccc.int/files/adaptation/application/pdf/nap_overview.pdf
Least Developed Countries Expert Group (2012b).National Adaptation Plans: Technical guidelines for the
national adaptation plan process. UNFCCC secretariat. Bonn, Germany. December 2012. Available at
http://unfccc.int/files/adaptation/cancun_adaptation_framework/application/pdf/naptechguidelines_eng_hig
h__res.pdf
Liu, J, Fritzb, S, Van Wesenbeeckc, CFA, Fuchsd, M, Youe, L, Obersteinerb, M, and Yang, H., 2008. A spatially
explicit assessment of current and future hotspots of hunger in Sub‐Saharan Africa in the context of global
change. Global and Planetary Change. Volume 64, Issues 3‐4, December 2008, pp 222‐235.
McGray, H., A. Hammill and R. Bradley (2007), Weathering the Storm: Options for Framing Adaptation and
Development, World Resources Institute, Washington, D.C.
Alphonse Mutabazi (2011). Rwanda Country Situational Analysis. Camco report to assist the East African
community (EAC) in the development of a regional Climate Change Master Plan. Available at
http://rema.gov.rw/rema_doc/Climate%20change/Situational%20Analysis%20‐%20RWANDA%20Final.pdf

Nicola Ranger, Antony Millner, Simon Dietz, Sam Fankhauser, Ana Lopez and Giovanni Ruta (2010). Adaptation
in the UK: a decision‐making process. Policy Briefing Note for the Committee on Climate Change Adaptation
Sub‐Committee.
Jennifer Olson and Leonard Berry. Soil Erosion in Rwanda.
http://www.google.co.uk/url?sa=t&rct=j&q=&esrc=s&source=web&cd=8&cad=rja&uact=8&ved=0CE8QFjAH&
url=http%3A%2F%2Fstatistics.gov.rw%2Fnode%2F793&ei=ubl9U5K4Hauq7QbGlIHQAQ&usg=AFQjCNHT1SeOlq
TLljXyNWaJRB4LG2mypw&sig2=Gyx_VzbpdHNCdAOgUi_rZg
Reeder, T and Ranger, N(2011). “How do you adapt in an uncertain world? Lessons from the Thames Estuary
2100 project.” World Resources Report, Washington DC.
REMA. Chapter 7. Agriculture and Land Degradation In Environmental Profile of Rwanda. http://rema.gov.rw/rema_doc/publications/Chapter_7_Agriculture_FINAL_DRAFT_copy%20edited%20‐
%20ME%20approved.pdf
Republic of Rwanda (2006). National Adaptation Programmes Of Action To Climate Change: NAPA‐Rwanda.
Ministry of lands. Environment, Forestry, Water and Mines. Republic of Rwanda. December 2006.
Republic of Rwanda (2011). Rwanda Green Growth and Climate Resilience (National Strategy for Climate
Change and Low Carbon Development), 2011.
Republic of Rwanda (2012). Second National Communication Under The United Nations Framework
Convention On Climate Change (U.N.F.C.C.C). Ministry Of Natural Resources. June 2012.
Republic of Rwanda (2012b). Disaster High Risk Zones on Floods and Landslides. Republic of Rwanda, Ministry
of Disaster Management and Refugee Affairs, March 2012
RoR (2013). Statistical year book 2012. National Institute Of Statistics Of Rwanda. Republic of Rwanda.
RoR EDPRS (2013). Economic Development and Poverty Reduction Strategy 2013 – 2018: Shaping Our
Development. Republic of Rwanda.
RoR RPHC4 (2012). Fourth Rwanda Population and Housing Census (RPHC4). Available at
http://statistics.gov.rw/publications/rphc4‐thematic‐report‐population‐size‐structure‐and‐distribution
SNC and Stratus Consulting (2006) Strategic/sectoral, social and environmental assessment of power
development options in the Nile Equatorial Lakes region. Supplemental analysis – Climate change and
potential impacts on hydro generation. Interim report ‐ Climate change and impacts on runoff. August 16,
2006. SNC‐Lavalin International Inc. Stratus Consulting Inc.
Shongwe, M.E., van Oldenborgh and van Aalst (2009). Submitted to Journal of Climate. Projected changes in
mean and extreme precipitation in Africa under global warming, Part II: East Africa. Nairobi, Kenya, 56 pp.
Available at http://www.knmi.nl/africa_scenarios/projected_changes_east_africa.pdf
UNFCCC (2009). Potential costs and benefits of adaptation options: A review of existing literature. Technical
Paper. Markandya, A. and Watkiss, P. CDCeCce/mTPb/e2r0 20090/29.
Van Ierland EC, de Bruin K, Dellink RB, Ruijs A (eds) (2007). A qualitative assessment of climate adaptation
options and some estimates of adaptation costs. Reports on the Routeplanner projects 3, 4 and 5
(Routeplanner deelprojecten 3, 4 en 5), Wageningen UR. Available at
www.enr.wur.nl/UK/Routeplanner+Report
Van Ierland , E.C. , de Bruin, K. and Watkiss, P. (2013). Multi‐Criteria Analysis: Decision Support Methods for
Adaptation, MEDIATION Project, Briefing Note 6. Funded by the EC’s 7FWP. Available at
http://www.mediation‐project.eu/platform/pbs/pdf/Briefing‐Note‐6‐LR.pdf

Watkiss, P, Downing, T., Dyszynski, J., Butterfield, R., Devisscher, T., Pye, S., Olwoch, J., Harding, B., M., Hunt,
A., Taylor, T., Bouma, M. Kovats, S., Maitima, J., Mugatha, S., Kariuki, P., Chambwera, M., Birch, T., Lager, B.,
Suazo, J., Rwamuhizi, F., Nyberg, Y., Bizimana, J. P., Mugiraneza, T., Ford, R., Nduwamungu, J. Twarabamenye,
E., Christine M., Simbizi, D., Mwesigye. E., and Habineza, F. (2009). The Economics of Climate Change in
Rwanda. Final Report to DFID. Led by the Stockholm Environment Institute, Oxford. Available at
http://rwanda.cceconomics.org/rwdo/Final%20Report.pdf
Watkiss, P. and A. Hunt, 2011: Method for the UK Adaptation Economic Assessment (Economics of Climate
Resilience). Final Report to Defra. May 2011. Deliverable 2.2.1
Watkiss, P. and Hunt, A. (2012). Cost‐effectiveness analysis:: Decision Support Methods for Adaptation,
MEDIATION Project, Briefing Note 2. Funded by the EC’s 7FWP Project. Available at http://www.mediation‐
project.eu/platform/pbs/pdf/Briefing‐Note‐2‐LR.pdf
Watkiss et al (2013). Decision Support Methods for Adaptation, Briefing Note 1 ‐ 9. Summary of Methods and
Case Study Examples from the MEDIATION Project. Available at http://mediation‐project.eu/output/technical‐
policy‐briefing‐notes
Watkiss et al, (2014). Early Value‐for‐Money Adaptation: Delivering VfM Adaptation using Iterative
Frameworks and Low‐Regret Options. Report to DFID. Evidence on Demand.
Watkiss P, Hunt, A,Blyth, W and Dyszynski J (in review). The use of new economic decision support tools for
adaptation assessment: A review of methods and applications, towards guidance on applicability. Climatic
Change, in review.
Robert L. Wilby and Suraje Dessai (2010). Robust adaptation to climate change. Weather – July 2010, Vol. 65,
No. 7. DOI: 10.1002/wea.543.
Wilby, Robert L. (2012). Frameworks for delivering regular assessments of the risks and opportunities from
climate change: An independent review of the first UK Climate Change Risk Assessment. Final Report to the
Committee on Climate cange. 18 June 2012.
World Bank (2009). Evaluating Adaptation via Economic Analysis. Guidance Note 7, Annex 12.

Date Meeting Contact
Monday 9th June
DFID Orientation , Climate Change Resilience
Sarah Love Emmeline Skinner Mark Davies
Security Briefing Robert Ndegeya
Meeting to present project to the office
Discussion with DFID programme staff
‐ Sarah Love – climate advisor ‐‐Emmeline Skinner ‐social development advisor ‐Hashim Wasswa Mulangwa ‐PSD adviser
Tuesday 10th June
Energy policy Attendance at workshop organised by MININFRA
REMA / FONERWA Rose Mukankomeje and Alex Mulisa
CDKN Jon Macartney <[email protected]
REMA Alphonse Mutabazi
Wednesday 11
th June KfW Ian Cedric Bichmann
DFID Mark Davies, livelihoods, agriculture
Access to Finance Rwanda Judith Aguga 0787830040
WFP Didace Kayiranga 0788308072 [email protected]
World Bank, agriculture
Agriculture Mark Austin [email protected]
Ministry DRR
Jean Baptiste Nsengiyumva Director of Research and Public Awareness National DRR Focal Point Email: [email protected]
Thursday 12
th June MINALOC (the Ministry of Local Development)
Justine Gatsinzi ([email protected] ) Deputy Director General, Social Protection Program, Rwanda Local Development Support Fund (RLDSF), email: [email protected]
UNDP Nicolas Schmids; [email protected] : Gemma Dalena [email protected]
FEWSNET Dan Chizelema [email protected]
EC Delegation [email protected] Mrs Seraphine MUKANKUSI , [email protected]
Ministry of Energy Sam Fell ([email protected]).
Friday 13
th May GGGI, MININFRA, green cities Oke Jeong, [email protected],
Cataline Galleno Lopez, IMC,
Rwanda Met Agency
John Ntangandasemafara , Director METEO, [email protected] Anthony Twahirwa , [email protected]
Ministry of Agriculture
Mr Raphael Rurangwa , DIRECTOR PLANNING, [email protected]
DFID wash‐up Sarah Love
Ministry of Natural Resources IRWM Department
Vincent Kabalisa
Saturday 14th June
Field visit to Musanze and onwards to Rubavu
Sunday 15th June
Return travel from Gysenyi Visit to rehabilitated Lake Karago and rehabilitated mountain Gisenyi Discussion with REMA local office representative
FONERWA Jillian Dyszynski, management lead FONERWA
RIWSP, Integrated Water
Security Program
Marara Madeleine [email protected],
0788 769 481