microsimulation as a tool to integrated sdg-based development planningmicrosimulation as a tool to...
TRANSCRIPT
www.ipc-undp.org - www.ipea.gov.br
Rafael Guerreiro OsorioResearch Coordinator
International Policy Centre for Inclusive GrowthInstitute of Applied Economic Research
Kingston, Jamaica, 2-4 December, 2015
Inter-Regional Workshop:�Experiences and LessonsLearned from ECOSOC National Voluntary Presentations
Microsimulation as a tool forintegrated SDG-baseddevelopment planning

* The World Bank, World Development Indicators, 2015 (2011 PPP)
of the world populationwere living under
US$ 1.90/day in 2012*12.7%almost 1 billion human beings
Yet many people in the world areseverely income deprived
Extreme poverty was more than halvedThe world reached the main target of MDG 1 for 2015
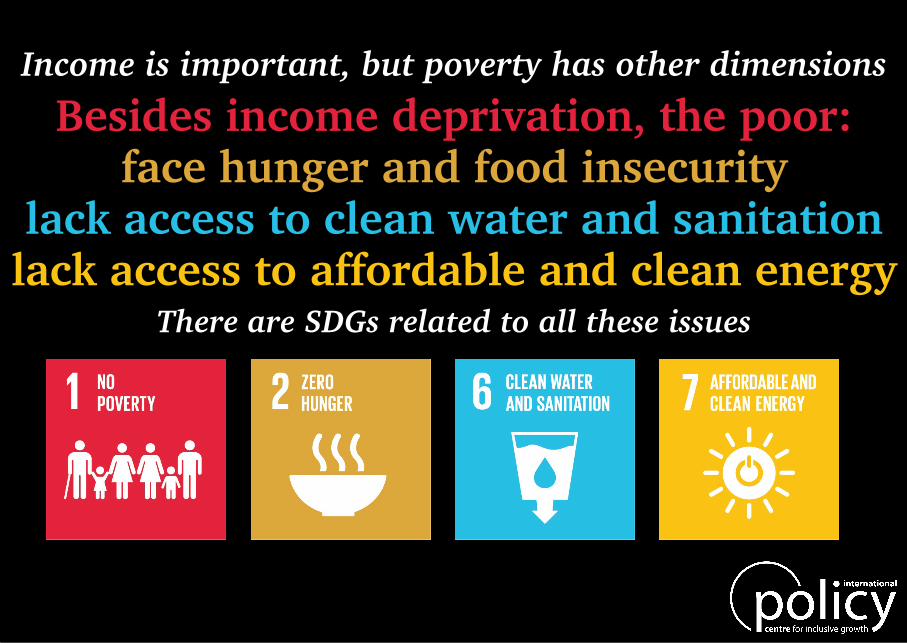
There are SDGs related to all these issueslack access to affordable and clean energylack access to clean water and sanitation
face hunger and food insecurityBesides income deprivation, the poor:
Income is important, but poverty has other dimensions
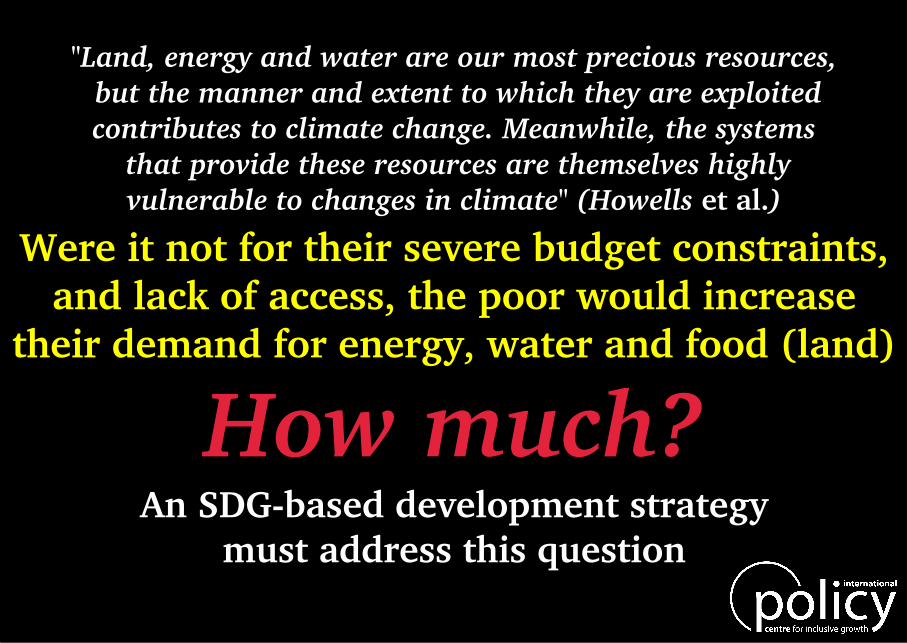
An SDG-based development strategymust address this question
"Land, energy and water are our most precious resources, but the manner and extent to which they are exploitedcontributes to climate change. Meanwhile, the systems
that provide these resources are themselves highlyvulnerable to changes in climate" (Howells et al.)
How much?
Were it not for their severe budget constraints,and lack of access, the poor would increase
their demand for energy, water and food (land)
Ann
ual G
Wh
0
250
500
750
1000
1250
1500
Year
2000 2005 2010 2015 2020 2025 2030
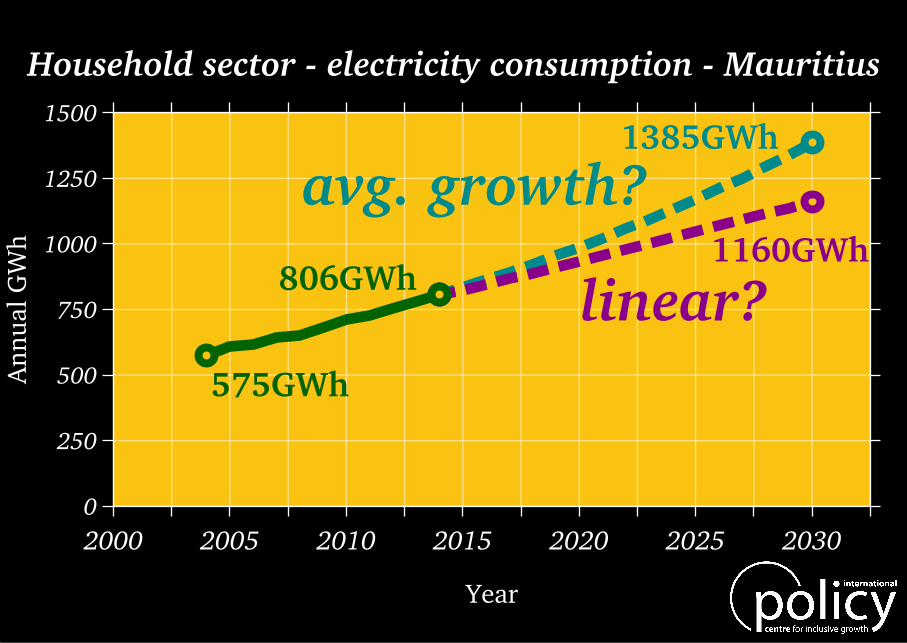
avg. growth?
linear?806GWh
575GWh
1160GWh
1385GWh
Household sector - electricity consumption - Mauritius

Fitting curves to the time seriesof the outcome variable
does not allow us to relatefuture variation of the outcome
with the variables on whichit depends, such as household income
and consumption patterns
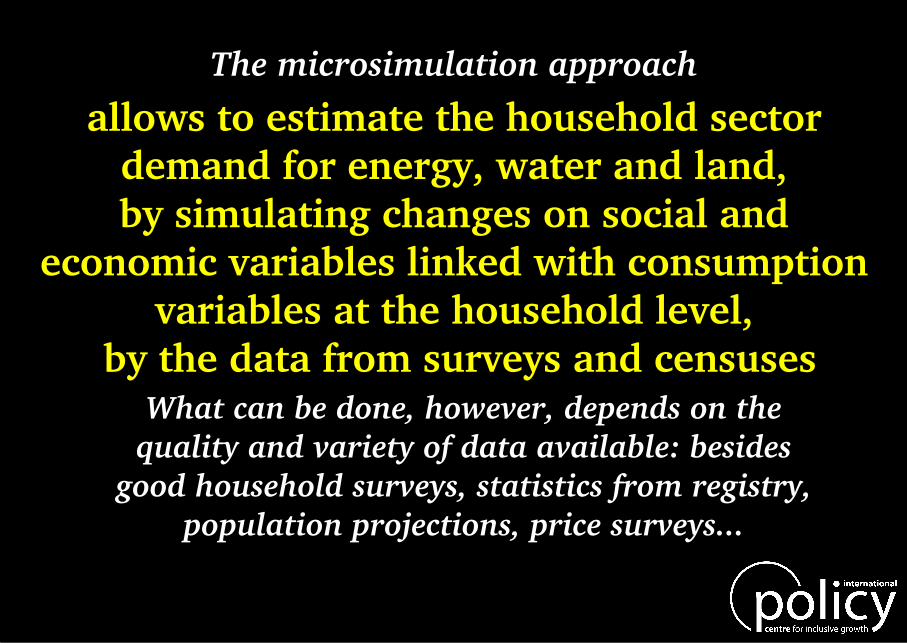
What can be done, however, depends on thequality and variety of data available: besides
good household surveys, statistics from registry,population projections, price surveys...
allows to estimate the household sectordemand for energy, water and land,by simulating changes on social and
economic variables linked with consumptionvariables at the household level,
by the data from surveys and censuses
The microsimulation approach

Component 3
Per capita consumptionof those with access
Microsimulationdataset
Component 2
Size and distributionof access to resource
Resourceaccess model
Populationprojection
Size and distributionof the population
Component 1
Initially, the tool will cover only energy and water
IPC is developing a tool to do microsimulationsaiming at its integration with other tools tosupport SDG-based development planning
The microsimulation approach

Component 3
Per capita consumptionof those with access
Microsimulationdataset
Component 2
Size and distributionof access to resource
Resourceaccess model
Populationprojection
Size and distributionof the population
Household electricity consumption - MauritiusComponent 1
A projected future demand of 921GWh in 2030a 14.3% increase of the 806GWh reported in 2014
The microsimulation approach
703.6KWh100%1,309,522 * *

Then, we simulate changes in the income distributionthat yield new levels of poverty and inequalityand using the elasticities we calculate future
demand for electricity
In the simulations there is only one driver of consumption,household per capita income - the income elasticity
of electricity consumption was calculated for every household
As proof of concept some simplesimulations were done for Mauritius
for the case of electricity consumption
The microsimulation approach

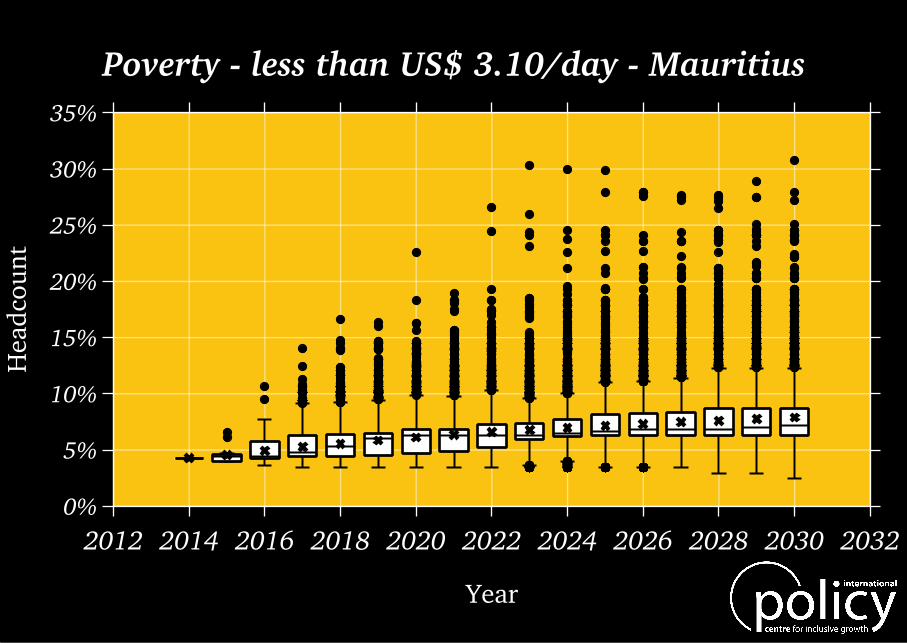
Simulation 3 - income distribution changes as it did inany pair of years from 2007 to 2014, randomly chosen- this is done 10,000 times, yielding interval estimates
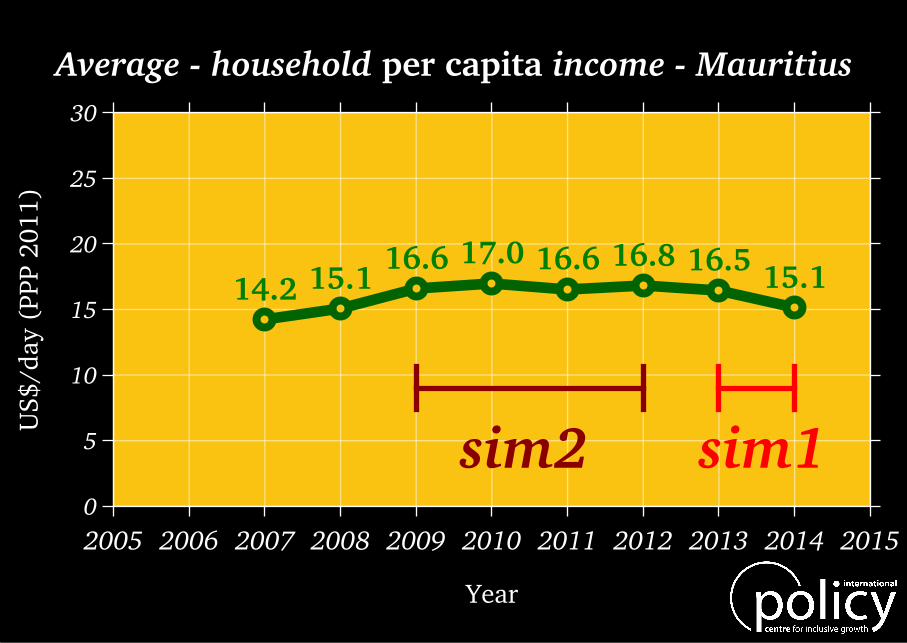
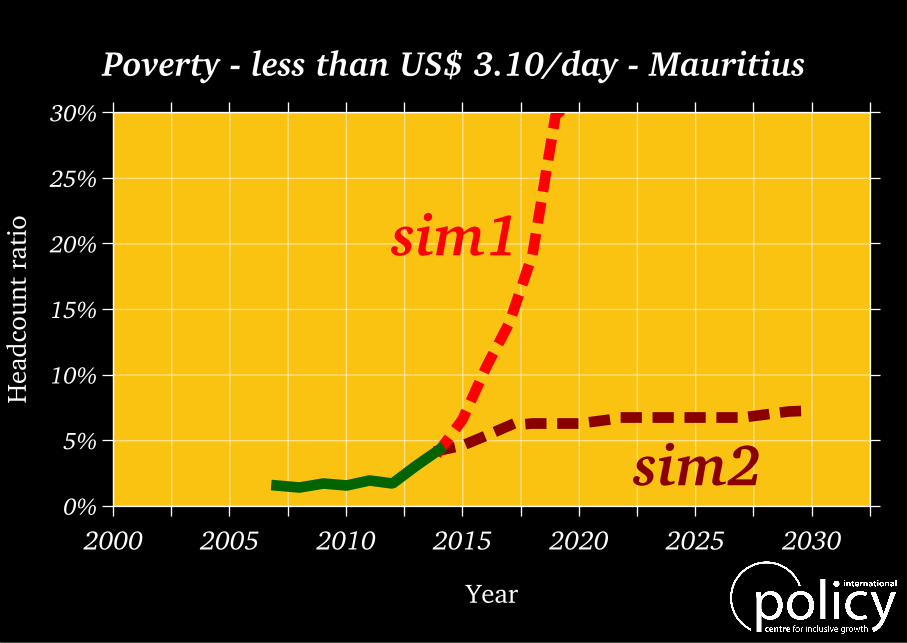
Simulation 2 - income distribution changes as it did from2009 to 2012
Simulation 1 - income distribution changes as it did from2013 to 2014
In the simulations, we used informationon past changes in the income distribution
but the parameters could be theoreticalor obtained from other tools
The microsimulation approach
US$
/day
(PP
P 20
11)
0
5
10
15
20
25
30
Year
2005 2006 2007 2008 2009 2010 2011 2012 2013 2014 2015
sim1sim2
14.2 15.116.6 17.0 16.6 16.8 16.5 15.1
Average - household per capita income - Mauritius

Gin
i (0-
1000
)
0
200
400
600
800
1000
Year
2005 2006 2007 2008 2009 2010 2011 2012 2013 2014 2015
sim1sim2
374 390 409 407 413 408 417 439
Inequality - household per capita income - Mauritius

Hea
dcou
nt r
atio
0%
5%
10%
15%
20%
25%
30%
Year
2005 2006 2007 2008 2009 2010 2011 2012 2013 2014 2015
sim1sim2
1.6 1.4 1.7 1.6 2.0 1.7 3.1 4.3
Poverty - less than US$ 3.10/day - Mauritius

US$
/day
(PP
P 20
11)
0
5
10
15
20
25
30
Year
2000 2005 2010 2015 2020 2025 2030
sim2
sim1
Average - household per capita income - Mauritius

Gin
i (0-
1000
)
0
200
400
600
800
1000
Year
2000 2005 2010 2015 2020 2025 2030
sim1
sim2
Inequality - household per capita income - Mauritius
Hea
dcou
nt r
atio
0%
5%
10%
15%
20%
25%
30%
Year
2000 2005 2010 2015 2020 2025 2030
sim1
sim2
Poverty - less than US$ 3.10/day - Mauritius

Ann
ual G
Wh
0
250
500
750
1000
1250
1500
Year
2000 2005 2010 2015 2020 2025 2030
sim1
806GWh
575GWh
921GWh
462GWh
sim2
Household sector - electricity consumption - Mauritius

US$
/day
(PP
P 20
11)
10
15
20
25
30
35
Year
2012 2014 2016 2018 2020 2022 2024 2026 2028 2030 2032
Average household per capita income - Mauritius

Gin
i (0-
1000
)
350
400
450
500
550
600
Year
2012 2014 2016 2018 2020 2022 2024 2026 2028 2030 2032
Gini - household per capita income - Mauritius
Hea
dcou
nt
0%
5%
10%
15%
20%
25%
30%
35%
Year
2012 2014 2016 2018 2020 2022 2024 2026 2028 2030 2032
Poverty - less than US$ 3.10/day - Mauritius

Ann
ual K
Wh
per
capi
ta
500
550
600
650
700
750
800
850
Year
2012 2014 2016 2018 2020 2022 2024 2026 2028 2030 2032
Average domestic electricity consumption - Mauritius

1) a cash transfer targeted at low income families;2) electricity subsidies and no connection charge;3) a very progressive electricity tariff;4) a plan to expand the grid to one remote area.
All this can be simulated together, giving plannersa good idea of what would be the social, economic,
and environmental outcomes of different policy options
Suppose that to eradicate extreme poverty and provideclean and affordable energy for all, a country sets up:
Some very interesting ones are SDG-related There are many other scenarios to be considered