microsemi annual report 2012 hostings - s3.amazonaws.comannual+report.pdf · this annual report on...
TRANSCRIPT

UNITED STATESSECURITIES AND EXCHANGE COMMISSION
WASHINGTON, DC 20549_______________________________________________
FORM 10-K(Mark One)
ANNUAL REPORT PURSUANT TO SECTION 13 OR 15(d) OF THE SECURITIES EXCHANGE ACT OF1934
For the fiscal year ended September 30, 2012 OR
TRANSITION REPORT PURSUANT TO SECTION 13 OR 15(d) OF THE SECURITIES EXCHANGE ACTOF 1934
For the transition period from to Commission file number # 000-08866
_______________________________________________
MICROSEMI CORPORATION(Exact name of Registrant as specified in its charter)
Delaware 95-2110371(State or other jurisdiction ofincorporation or organization)
(I.R.S. EmployerIdentification No.)
One Enterprise, Aliso Viejo, California 92656(Address of principal executive offices) (Zip Code)
(949) 380-6100Registrant’s telephone number, including area code
Securities registered pursuant to Section 12(b) of the Act:
Title of each class Name of each exchange on which registeredCommon Stock, $0.20 par value;
NASDAQ Stock Market LLC
(NASDAQ Global Select Market)Securities registered pursuant to Section 12(g) of the Act:
None_______________________________________________
Indicate by check mark if the registrant is a well-known seasoned issuer, as defined in Rule 405 of the Securities Act. Yes No Indicate by check mark if the registrant is not required to file reports pursuant to Section 13 or Section 15(d) of the Act. Yes No Indicate by check mark whether the registrant (1) has filed all reports required to be filed by Section 13 or 15(d) of the Securities Exchange
Act of 1934 during the preceding 12 months (or for such shorter period that the registrant was required to file such reports), and (2) has been subject to such filing requirements for the past 90 days. Yes No
Indicate by check mark whether the registrant has submitted electronically and posted on its corporate Website, if any, every Interactive Data File required to be submitted and posted pursuant to Rule 405 of Regulation S-T (§ 232.405 of this chapter) during the preceding 12 months (or for such shorter period that the registrant was required to submit and post such files). Yes No
Indicate by check mark if disclosure of delinquent filers pursuant to Item 405 of Regulation S-K is not contained herein, and will not be contained, to the best of registrant’s knowledge, in definitive proxy or information statements incorporated by reference in Part III of this Form 10-K or any amendment to this Form 10-K.
Indicate by check mark whether the registrant is a large accelerated filer, an accelerated filer, a non-accelerated filer, or a smaller reporting company. See definitions of “large accelerated filer,” “accelerated filer” and “smaller reporting company” in Rule 12b-2 of the Exchange Act. (Check one):
Large Accelerated Filer Accelerated Filer Non-Accelerated Filer Smaller Reporting Company
(Do not check if a smaller reporting company)Indicate by check mark whether the registrant is a shell company (as defined in Rule 12b-2 of the Exchange Act. Yes No The aggregate market value of Common Stock held by non-affiliates of the registrant, based upon the closing sale price on March 30, 2012
was approximately $1,900,000,000.The number of outstanding shares of Common Stock on November 2, 2012 was 90,323,928.
Documents Incorporated by ReferencePart III: Incorporated by reference are portions of the definitive Proxy Statement for the Annual Meeting of Stockholders to be filed not later
than 120 days after the close of the registrant’s fiscal year ended September 30, 2012.

2
TABLE OF CONTENTS
Item Page
PART I
11A1B234
5
677A.899A.9B.
1011121314
15
Business 4Risk Factors 10Unresolved Staff Comments 23Properties 23Legal Proceedings 24Mine Safety Disclosures 24
PART II
Market the Registrant’s Common Equity, Related Stockholder Matters and Issuer Purchases of Equity Securities 24Selected Financial Data 26Management’s Discussion and Analysis of Financial Condition and Results of Operations 27Quantitative and Qualitative Disclosures About Market Risk 41Financial Statements and Supplementary Data 43Changes in and Disagreements with Accountants on Accounting and Financial Disclosure 72Controls and Procedures 72Other Information 73
PART III
Directors, Executive Officers and Corporate Governance 73Executive Compensation 73Security Ownership of Certain Beneficial Owners and Management and Related Stockholder Matters 73Certain Relationships and Related Transactions, and Director Independence 73Principal Accountant Fees and Services 73
PART IV
Exhibits and Financial Statement Schedules 73

3
IMPORTANT FACTORS RELATED TO FORWARD-LOOKING STATEMENTS AND ASSOCIATED RISKS
This Annual Report on Form 10-K must be read in its entirety and contains forward-looking statements within the meaning of the federal securities laws. Any statements that do not relate to historical or current facts or matters are forward-looking statements. You can identify some of the forward-looking statements by the use of forward-looking words, such as “can,” “may,” “will,” “could,” “should,” “project,” “believe,” “anticipate,” “expect,” “plan,” “estimate,” “forecast,” “potential,” “intend,” “maintain,” “continue” and variations of these words and comparable words. In addition, all of the information herein that does not state a historical fact is forward-looking, including any statement or implication about an estimate or a judgment, or an expectation as to a future time, future result or other future circumstance. Statements concerning current conditions may also be forward-looking if they imply a continuation of current conditions. Examples of forward-looking statements in this Annual Report on Form 10-K include, but are not limited to, statements concerning:
• expectations that we will be able to successfully integrate acquired companies and personnel with our existing operations;
• expectations that plant consolidations will result in anticipated cost savings without unanticipated costs or expenses;
• demand, growth and sales expectations for our products;
• expectations regarding tax exposures and future tax rates, our ability to realize deferred tax assets and the effect of examinations by U.S., state or foreign jurisdictions;
• expectations regarding competitive conditions;
• new market opportunities and emerging applications for our products;
• the uncertainty of litigation, the costs and expenses of litigation, and the potential material adverse effect litigation could have on our business and results of operations;
• beliefs that our customers will not cancel orders or terminate or renegotiate their purchasing relationships with us;
• expectation that we will not suffer production delays as a result of a supplier's inability to supply parts;
• the effect of events such as natural disasters and related disruptions on our operations, including, without limitation, the effects of and status of our recovery from the recent flooding in Thailand;
• beliefs that we stock adequate supplies of all materials;
• beliefs that we will be able to successfully resolve any disputes and other business matters as anticipated;
• beliefs that we will be able to meet our operating cash and capital commitment requirements in the foreseeable future;
• critical accounting estimates;
• expectations regarding our financial and operating results;
• expectations regarding our liquidity and capital resources, including our loan covenants;
• expectations regarding our performance and competitive position in future periods; and
• expectations regarding our outlook for our end markets.
Forward-looking statements are subject to risks and uncertainties that could cause actual results to differ materially from the results that the forward-looking statements suggest. You are urged to carefully review the disclosures we make in this report concerning risks and other factors that may affect our business and operating results, including those made under the heading “Item 1A. RISK FACTORS” included below in this Annual Report on Form 10-K, as well as in our other reports filed with the Securities and Exchange Commission (“SEC”). Forward-looking statements are not a guarantee of future performance and should not be regarded as a representation by us or any other person that all of our estimates will necessarily prove correct or that all of our objectives or plans will necessarily be achieved. You are cautioned, therefore, not to place undue reliance on these forward-looking statements, which are made only as of the date of this report. We do not intend, and undertake no obligation, to update or revise the forward-looking statements to reflect events or circumstances after the date of this report, whether as a result of new information, future events or otherwise.

4
ITEM 1. BUSINESS
INTRODUCTION
Microsemi Corporation was incorporated in Delaware in 1960. Our name was changed from Microsemiconductor Corporation in February 1983. Unless the context otherwise requires, the “Company,” “Microsemi,” “we,” “our,” “ours” and “us” refer to Microsemi Corporation and its consolidated subsidiaries. Our principal executive offices are located at One Enterprise, Aliso Viejo, California 92656 and our telephone number is (949) 380-6100.
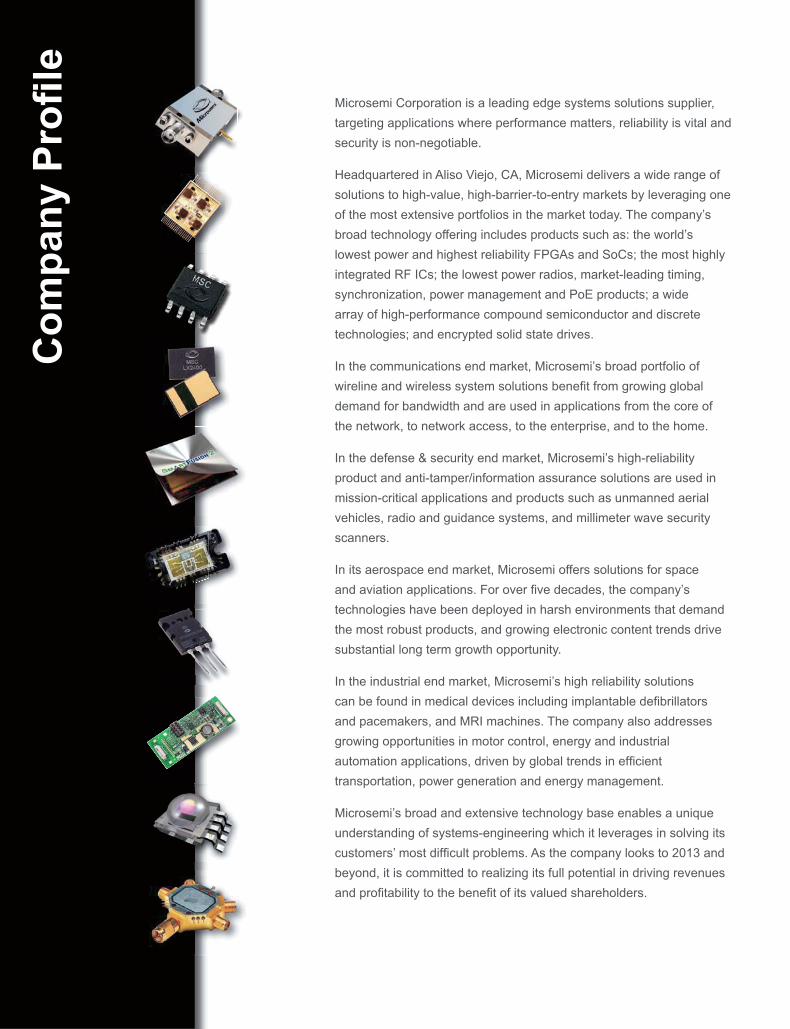
We are a leading designer, manufacturer and marketer of high-performance analog and mixed-signal semiconductor solutions differentiated by power, security, reliability and performance. Our semiconductors manage and control or regulate power, protect against transient voltage spikes and transmit, receive and amplify signals. We offer one of the industry's most comprehensive portfolios of semiconductor technology. Our products include high-performance, high-reliability radio frequency (RF) and power components, analog and RF integrated circuits (ICs), standard and customizable system-on-chip solutions (SoCs/cSoCs), and mixed-signal and radiation-tolerant field programmable gate arrays (“FPGAs”). We also offer subsystems and modules that include application-specific power modules and Power-over-Ethernet (“PoE”) midspans.
Our products include individual components as well as IC solutions that enhance customer designs by improving performance, reliability and battery optimization, reducing size or protecting circuits. The principal end markets that we serve include Communications, Defense & Security, Aerospace and Industrial.
Power management generally refers to a class of standard linear integrated circuits (“SLICs”) that perform voltage regulation and reference in most electronic systems. The definition of power management has broadened in recent years to encompass other devices and modules, often application-specific standard products (“ASSPs”), which address particular aspects of power management, such as audio or display related ICs. This business is composed of both a core platform of traditional SLICs, such as low dropout regulators (“LDOs”) and pulse width modulators (“PWMs”), and differentiated ASSPs such as backlight inverters, audio amplification ICs and small computer standard interface terminators. Our IC products are used in data storage, wireless local area network (“LAN”), automobiles, telecommunications, test instruments, defense and aerospace equipment, high-quality sound reproduction and data transfer equipment.
Our individual component semiconductor products include silicon rectifiers, zener diodes, low leakage and high voltage diodes, temperature compensated zener diodes, transistors, subminiature high power transient suppressor diodes and pin diodes used in magnetic resonance imaging (“MRI”) machines. We also manufacture semiconductors for commercial applications, such as automatic surge protectors, transient suppressor diodes used for telephone applications and switching diodes used in computer systems. A partial list of these products includes: implantable cardioverter defibrillator and heart pacer switching, charging and transient shock protector diodes, low leakage diodes, transistors used in jet aircraft engines and high performance test equipment, high temperature diodes used in oil drilling sensing elements operating at 200 degrees centigrade, temperature compensated zener or rectifier diodes used in missile systems and power transistors.
We have implemented a growth strategy through continuous innovation complemented by strategic acquisitions to strengthen our product and technology portfolio with the intent of broadening our customer base and increasing our technology footprint in customers' end designs in high-value, high barrier-to-entry markets where power matters, security is non-negotiable, and reliability is vital. This allows us to offer an increased value proposition, gather a larger portion of the bill of materials, and engage with customers as a strategic partner as opposed to a socket provider. We believe this strategy strengthens our position in the industry as it protects and grows our share within those markets with the highest barriers to entry, and increases our served available market.
Recent industry leading innovations include:
• SmartFusion 2 SoC FPGAs designed to address fundamental requirements for advanced security, high reliability and low power in critical industrial, defense, aviation, communications and medical applications;
• Ultra secure TRRUST-Stor™ solid state drive with a unique, ruggedized SATA connector designed to solve severe shock and vibration issues prevalent in defense and industrial applications;
• Meeting stringent military operating temperatures for SmartFusion® customizable system-on-chip (cSoC) devices, ideal for applications including avionics systems and missiles, as well as unmanned and weaponry systems which must continuously and reliably operate in harsh ground and atmospheric environments;
• A family of radiation-hardened, surface mount technology packaged 28 volt input, 50 watt output DC-DC converters which provide military and commercial satellites with continuous protection against naturally occurring "total dose" ionized radiation;
• A suite of system and power management design tools for high availability wired and wireless communications infrastructure equipment;

5
• A new 30 watt dimmable light emitting diode (“LED”) driver module optimized for worldwide residential, commercial and industrial light fixtures which closely emulates the "lights-on" performance of a typical incandescent lamp;
• New generation 1200 volt non-punch through insulated gate bipolar transistors (“IGBTs”) that leverage the Company's leading-edge Power MOS 8™ technology and offer a dramatic reduction of 20 percent or more in total switching and conduction losses as compared to competitive solutions;
• The DRF1400 power metal-oxide-semiconductor field-effect-transistor (“MOSFET”), which is well-suited for use in RF generators for a wide range of industrial, scientific and medical applications including plasma generation for semiconductors, LCD and solar cell manufacturing, and carbon dioxide lasers operating up to 30 megahertz;
• Meeting extreme operating temperatures for FPGAs and SmartFusion® cSoC solutions, ideal for down-hole drilling products, space systems, avionics equipment and other applications requiring high performance and the utmost reliability in extreme low and high temperature environments; and
• New advanced motor control algorithms optimized for SmartFusion® cSoC, allowing design engineers to realize highly reliable multi-motor control in a single IC and reducing system cost and power.
Our website address is http://www.microsemi.com. Our filings with the SEC of annual reports on Form 10-K, quarterly reports on Form 10-Q and current reports on Form 8-K, and all amendments to such forms, are made accessible on such website as soon as reasonably practicable after such documents are electronically filed with or furnished to the SEC and are always available free of charge. Also accessible on our website are our code of ethics, governance guidelines, internal audit charter and charters for the Audit Committee, Compensation Committee, Executive Committee and Governance and Nominating Committee of our Board of Directors. Such website is not intended to constitute any part of this report.
Please read the information under the heading “IMPORTANT FACTORS RELATED TO FORWARD-LOOKING STATEMENTS AND ASSOCIATED RISKS” above, which describes and refers to some of the important risks and uncertainties that could affect Microsemi’s future business and prospects.
We report results of operations on the basis of fifty-two and fifty-three week periods. The fiscal year ended on September 30, 2012 and October 2, 2011 consisted of fifty-two weeks and the fiscal year ended on October 3, 2010 consisted of fifty-three weeks. In referencing a year, we are referring to the fiscal year ended on the Sunday closest to September 30.
ACQUISITIONS
We have in the past acquired a number of businesses or companies, additional product lines and assets. We currently expect to continue to expand and diversify our operations with additional acquisitions.
During 2012, we completed the acquisition of Zarlink Semiconductor Inc. (“Zarlink”), an international semiconductor supplier that designs, manufactures and distributes microelectronic components for the communications and medical industries. We sometimes refer to this division herein as “Microsemi – CMPG.” We acquired Zarlink for its world-leading, mixed-signal chip technologies for a broad range of communication and medical applications. Zarlink's core capabilities include timing solutions that manage time-sensitive communication applications over wireless and wired networks, line circuits supporting high-quality voice services over cable and broadband connections, and ultra low-power radios enabling new wireless medical devices and therapies. Serving the world's largest original equipment manufacturers, Zarlink's highly integrated chip solutions help customers simplify design, lower costs and reach market quickly. Zarlink’s timing, synchronization and voice products, which complement our existing communications products, significantly increased our consolidated net sales in 2012. We also acquired the timing, synchronization and synthesis business of Maxim Integrated Products, Inc. The acquired product lines and technology are vital to the effective and efficient delivery of time-sensitive voice, data and multimedia traffic over wireless and wired networks, and will further provide our customers with the critical synchronization components required to harmonize system and network clocks, as well as the synthesis products required to distribute timing clocks throughout each system.
During 2011, we acquired Actel Corporation (“Actel”), a leading supplier of low-power FPGAs, mixed-signal FPGAs, and system-critical FPGAs. We sometimes refer to this division herein as “Microsemi – SoC.” We also acquired AML Communications, Inc. ("AML"), a designer, manufacturer, and marketer of microelectronic assemblies for the defense industry, Asic Advantage, Inc. (“Asic Advantage”), a fabless semiconductor company that designs and manufactures a broad portfolio of high-performance, high-voltage and radiation-hardened mixed-signal integrated circuit solutions for the aerospace, automotive, communications, industrial and medical markets and substantially all the assets of Brijot Imaging Systems, Inc. (“Brijot”) and its passive millimeter wave imaging solutions technology.
During 2010, we acquired White Electronic Designs Corporation (“White Electronic”), a defense electronics manufacturer and supplier that designs, develops and manufactures innovative electronic components and systems for inclusion in high technology products for the defense and aerospace markets. We also acquired substantially all the assets of VT Silicon, a designer and manufacturer of multi-band radio frequency integrated circuit (“RFIC”) solutions for the mobile wireless

6
broadband market and all the shares of Arxan Defense Systems, Inc., a leading provider of anti-tamper solutions, providing full-service support to defense clients in securing systems against tampering, piracy and reverse engineering.
MARKETING
Our products include individual components as well as IC solutions that enhance customer designs by improving performance, reliability and battery optimization, reducing size or protecting circuits. The principal end markets that we serve include:
• Communications – Products in this end market include broadband power amplifiers and monolithic microwave integrated circuits (“MMICs”) targeted at 802.11 a/b/g/n/e, FGPAs, multiple-in multiple-out (“MIMO”), LED, cold cathode fluorescent lamp (“CCFL”) controllers, visible light sensors, PWM controllers, voltage regulators, EMI/RFI filters, transient voltage suppressors and class-D audio circuits. Applications for these products include wi-max and wireless LAN devices, PoE devices, portable devices, set top box and telecom applications, notebook computers, monitors, storage devices and televisions.
• Defense & Security – Products in this end market include mixed-signal analog integrated circuits, JAN, JANTX, JANTXV and JANS high-reliability semiconductors and modules including diodes, zeners, diode arrays, transient voltage suppressors, bipolar transistors, MOSFETs, IGBTs, small signal analog integrated circuits, small signal transistors, relays, silicon-controlled rectifiers (“SCRs”), RF transceivers and subsystems and FPGAs. These products are utilized in a variety of applications including radar and communications, defense electronics, homeland security, threat detection, targeting and fire control and other power conversion and related systems in military platforms.
• Aerospace – Products in this end market include offerings such as JAN, JANTX, JANTXV and JANS high-reliability semiconductors and modules and analog mixed-signal products including diodes, zeners, diode arrays, transient voltage suppressors, bipolar transistors, small signal analog integrated circuits, relays, small signal transistors, SCRs, MOSFETs, IGBTs and FPGAs. These products are utilized in a variety of applications including electronic applications for large aircraft and regional jets, commercial radar and communications, satellites, cockpit electronics, and other power conversion and related systems in space and aerospace platforms.
• Industrial – Products in this end market include MOSFETs, IGBTs, FPGAs, power modules, ultra thin bypass diodes, bridge rectifiers, and high-voltage assemblies for use in industrial equipment, semiconductor capital equipment and solar power applications. Industrial applications also include zener diodes, high-voltage diodes, MOSFETs, IGBTs, transient voltage suppressors and thyristor surge protection devices that are designed into implantable defibrillators, pacemakers and neurostimulators and PIN diode switches, dual diode modules and switched-most power supplies (“SMPS”) for use in MRI systems.
Our products are marketed through electronic component distributors and independent sales representatives, as well as our inside sales personnel. We have direct sales offices in many metropolitan areas around the world.
Net sales were $1.0 billion, $835.9 million and $518.3 million in 2012, 2011 and 2010, respectively. Net sales by originating geographic area and end market are disclosed in Note 14 of the notes to the consolidated financial statements included in this Annual Report on Form 10-K, which information is incorporated herein by reference. A discussion of the risks attendant to our international operations are included in Item 1A, Risk Factors, under the heading, “International operations and sales expose us to material risks and may increase the volatility of our operating results,” which information is incorporated herein by reference.
RESEARCH AND DEVELOPMENT
We believe that continuing timely development and introduction of new products is essential to maintaining our competitive position. We currently conduct most of our product development effort in-house. We also employ outside consultants to assist with product design.
We expense the cost of research and development as incurred. Research and development expenses principally comprise payroll and related costs, consulting costs, supplies, and the cost of prototypes.
We spent approximately $168.5 million, $114.2 million and $55.4 million in 2012, 2011 and 2010 respectively, for research and development. The principal focus of our research and development activities has been to improve processes and to develop new products that support the growth of our businesses.
The spending on research and development was principally to develop new higher-margin application-specific products, including, among others, our 65nm process development for next generation programmable products, higher power PoE solutions, the continued roadmap development of our industry-leading timing & synchronization products, our SiGe RF power amplifier solutions for wireless LAN applications, and the ongoing development of GaN and SiC power management and RF solutions.

7
PATENTS, LICENSES, AND OTHER INTELLECTUAL PROPERTY RIGHTS
We have registered several of our trademarks with the U.S. Patent and Trademark Office and in foreign jurisdictions. We rely to some extent upon confidential trade secrets and patents to develop and maintain our competitive position. It is our policy to seek patent protection for significant inventions that may be patented, though we may elect, in appropriate cases, not to seek patent protection even for significant inventions if other protection, such as maintaining the invention as a trade secret, is considered more advantageous or cost-effective. We believe that patent and mask work protection could grow in significance but presently is of less significance in our business than experience, innovation, and management skill. No individual patent contributed significantly to our 2012, 2011 or 2010 net sales.
Due to the many technological developments and the technical complexity of the semiconductor industry, it is possible that certain of our designs or processes may involve infringement of patents or other intellectual property rights held by others. From time to time, we have received, and in the future may receive, notice of claims of infringement by our products on intellectual property rights of third parties. If any such infringements were alleged to exist, we might be obligated to seek a license from the holder of the rights and might have liability for past infringement. In the past, it has been common semiconductor industry practice for patent holders to offer licenses on reasonable terms and rates. Although in some situations, typically where the patent directly relates to a specific product or family of products, patent holders have refused to grant licenses, the practice of offering licenses appears to be generally continuing. However, no assurance can be given that we will be able to obtain licenses as needed in all cases or that the terms of any license that may be offered will be acceptable to us. In those circumstances where an acceptable license is not available, we would need either to change the process or product so that it no longer infringes or stop manufacturing the product or products involved in the infringement, which might be costly and could adversely affect our revenues and operating results.
Please see the information that is set forth under the subheading “Any failure by us to protect our proprietary technologies or maintain the right to use certain technologies may negatively affect our ability to compete,” within the section below entitled “ITEM 1A. RISK FACTORS.”
MANUFACTURING AND SUPPLIERS
We depend on third party subcontractors, primarily in Asia for wafer fabrication, assembly, test and packaging of an increasing portion of our products. Approximately 82% of our wafer and 89% of our assembly and test requirements are currently sourced from third party foundries and subcontractors. We expect that these percentages may increase due, in part, to the manufacture of our next-generation products by third party subcontractors in Asia and from activity at recently acquired operations. We evaluate factors such as quality, feasibility, volume, capacity and cost in determining whether to utilize third parties or our facilities.
Our wafer designs requirements are increasing in technological complexity and in order to meet our design specifications, our foundry partners must expend resources for capital equipment and to develop or improve manufacturing processes. Our foundry partners' inability or unwillingness to expend these resources could adversely affect our business and operating results. The assembly, testing and packaging of our products is performed by a limited group of subcontractors. Disruption or termination of any of these subcontractors could occur and such disruptions or terminations could harm our business and operating results.
We utilize third party logistics services, including transportation, warehouse and shipping services. These service providers are subject to interruptions that affect their ability to service us, including the availability of transportation services, disruptions related to work stoppages, volatility in fuel prices and security incidents or natural events at manufacturing, shipping or receiving points or along transportation routes.
We generally do not have any long-term agreements with our subcontractors. As a result, we may be unable to directly control our quality assurance and product delivery schedules. The cost of product replacements or returns and other warranty matters in connection with quality assurance problems caused by third party subcontractors could materially adversely affect us. Third party manufacturers generally will have longer lead times for delivery of products as compared with our internal manufacturing, and therefore, when ordering from these suppliers, we will be required to make longer-term estimates of our customers' current demand for products, and these estimates are difficult to make accurately. Also, due to the amount of time typically required to qualify assemblers and testers, we could experience delays in the shipment of our products if we are forced to find alternate third parties to assemble or test our products. Any product delivery delays in the future could have a material adverse effect on our operating results, financial condition and cash flows. Our operations and ability to satisfy customer obligations could be adversely affected if our relationships with these subcontractors were disrupted or terminated. In addition, these subcontractors must be qualified by the U.S. government or customers for high-reliability processes. Historically the Defense Supply Center Columbus (DSCC) has rarely qualified any foreign manufacturing or assembly lines for reasons of national security; therefore, our ability to move certain manufacturing offshore may be limited or delayed.

8
In the event that any of our subcontractors were to experience financial, operational, production or quality assurance difficulties resulting in a reduction or interruption in supply to us, our operating results could suffer until alternate qualified subcontractors, if any, were to become available and active.
Our principal manufacturing operations are in the following locations:
California Arizona Shanghai, ChinaCamarillo PhoenixFolsom Ennis, IrelandGarden Grove MassachusettsLa Mirada Lawrence Manila, PhilippinesSan Jose LowellSanta Clara Caldicot, United Kingdom
OregonBend
Many of our manufacturing and processing operations are controlled in accordance with military as well as other rigid commercial and industrial specifications. At our facilities with wafer processing capabilities, we manufacture and process products, starting from purchased silicon wafers. At our locations without wafer processing capabilities, processed wafers are sourced from third parties or our other facilities. We purchase silicon wafers, other semiconductor materials and packaging piece parts from domestic and international suppliers generally on long-term purchase commitments, that are cancelable on 30 to 90-days’ notice. Significantly all materials are available from multiple sources. In the case of sole source items, we have never suffered production delays as a result of suppliers’ inability to supply the parts. We believe that we stock adequate supplies for all materials, based upon backlog, delivery lead-time and anticipated new business. In the ordinary course of business, we enter into cancelable purchase agreements with some of our major suppliers to supply products over periods of up to 18 months. We also purchase a portion of our finished wafers from several foundry sources.
Processed silicon wafers are separated into individual dice that are then assembled in packages and tested in accordance with our test procedures. A major portion of our semiconductor manufacturing effort takes place after the semiconductor is assembled. Parts are tested a number of times, visually screened and environmentally subjected to shock, vibration, “burn in” and electrical tests in order to prove and assure reliability. As noted above, certain subcontract suppliers provide packaging and testing for our products necessary to deliver finished products. We pay those suppliers for assembled or fully-tested products meeting predetermined specifications.
RAW MATERIALS
Our manufacturing processes use certain key raw materials critical to our products. These include silicon wafers, certain chemicals and gases, ceramic and plastic packaging materials and various precious metals. We also rely on subcontractors to supply finished or semi-finished products that are marketed through our various sales channels. We obtain raw materials and semi-finished or finished products from various sources, although the number of sources for any particular material or product may be limited. We feel that our current supply of essential materials is adequate; however, shortages have occurred from time to time and could occur again.
SEASONALITY
Generally, we are affected by the seasonal trends of the semiconductor and related industries. The impacts of seasonality are to some extent dependent on product and market mix of products shipped. These impacts can change from time to time and are not predictable. Factors that increase seasonality include, for example, holiday work schedules during our first fiscal quarter that tend to limit production and holiday demand that tends to increase net sales in the Communications end market during our fiscal first and fourth quarters.
COMPETITIVE CONDITIONS
The semiconductor industry, including the areas in which we do business, is highly competitive. We expect intensified competition from existing competitors and new entrants. Competition is based on price, product performance, product availability, quality, reliability and customer service. We compete in various markets with companies of various sizes, some of which are larger and have greater financial and other resources than we have, and thus may be better able to pursue acquisition candidates and to withstand adverse economic or market conditions. In addition, companies not currently in direct competition with us may introduce competing products in the future. Some of our current major competitors are Aeroflex Holding Corporation; Altera Corporation; Fairchild Semiconductor International, Inc.; Freescale Semiconductor, Inc.; Texas Instruments, Inc.; Integrated Device Technology, Inc.; International Rectifier Corp.; Linear Technology Corp.; M/A COM

9
Technology Solutions Inc.; Maxim Integrated Products, Inc.; Micrel Incorporated; Monolithic Power Systems, Inc.; O2Micro International, Ltd.; Semtech Corp.; Silicon Laboratories, Inc.; Skyworks Solutions, Inc.; Supertex, Inc. and Xilinx, Inc. Some of our competitors in developing markets are Integrated Device Technology, Inc.; Semtech Corp.; Silicon Laboratories, Inc.; Skyworks Solutions, Inc. and Triquint Semiconductor, Inc. Several of these companies are larger than we are and have greater resources than we have and may therefore be better able than we are to penetrate new markets, pursue acquisition candidates, and withstand adverse economic or market conditions. We expect intensified competition from both these existing competitors and new entrants into our markets. To the extent we are not able to compete successfully in the future, our financial condition, operating results or cash flows could be harmed.
We have implemented a growth strategy through continuous innovation complemented by strategic acquisitions with the intent of increasing our technology footprint in customers’ end designs in high-value, high barrier-to-entry markets. This allows us to offer an increased value proposition, gather a larger portion of the bill of materials, and engage with customers as a strategic partner as opposed to a socket provider. We believe this strategy strengthens our position in the industry as it protects and grows our share within those markets with the highest barriers to entry.
SALES TO THE U.S. GOVERNMENT
Approximately 28% of total net sales in 2012 were in the Defense & Security end market, with a very significant amount to customers whose principal sales are to the U.S. Government or to subcontractors whose material sales are to the U.S. Government. We, as a subcontractor, sell our products to higher-tier subcontractors or to prime contractors based upon purchase orders that usually do not contain all of the conditions included in the prime contract with the U.S. Government. However, these sales are usually subject to termination and/or price renegotiations by virtue of their reference to a U.S. Government prime contract. Therefore, we believe that all of our product sales that ultimately are sold to the U.S. Government may be subject to termination, at the convenience of the U.S. Government or to price renegotiations under the Renegotiation Act. While one of our contracts was terminated in the past due to the termination of the underlying government contract, we have never experienced a material loss due to termination of a U.S. Government contract. We have never had to renegotiate our price under any government contract. There can be no assurance that we will not have contract termination or price renegotiation in the future.
ENVIRONMENTAL REGULATIONS
To date, our compliance with federal, state and local laws or regulations that have been enacted to regulate the environment has not had a material adverse effect on our capital expenditures, earnings, or competitive or financial position.
Federal, state and local laws and regulations impose various restrictions and controls on the discharge of materials, chemicals and gases used in semiconductor manufacturing processes. In addition, under some laws and regulations, we could be held financially responsible for remedial measures if our properties are contaminated or if we send waste to a landfill or recycling facility that becomes contaminated, even if we did not cause the contamination. Also, we may be subject to common law claims if we release substances that damage or harm third parties. Further, future changes in environmental laws or regulations may require additional investments in capital equipment or the implementation of additional compliance programs in the future. Any failure to comply with environmental laws or regulations could subject us to serious liabilities and could have material adverse effects on our operating results and financial condition.
In the conduct of our manufacturing operations, we have handled and do handle materials that are considered hazardous, toxic or volatile under federal, state or local laws. The risk of accidental release of such materials cannot be completely eliminated. In addition, we operate or own facilities located on or near real property that was formerly owned and operated by others. These properties were used in ways that involved hazardous materials. Contaminants may migrate from or within or through property. These risks may give rise to claims. We may be financially responsible for third parties, who are responsible for contamination, if they do not have funds, or if they do not make funds available when needed, to pay remediation costs imposed under environmental laws and regulations.
In Broomfield, Colorado, the owner of a property located adjacent to a manufacturing facility owned by one of our subsidiaries, Microsemi Corp. – Colorado had notified the subsidiary and other parties of a claim that contaminants migrated to his property, thereby diminishing its value. In August 1995, the subsidiary, together with Coors Porcelain Company, FMC Corporation and Siemens Microelectronics, Inc. (former owners of the manufacturing facility), agreed to settle the claim and to indemnify the owner of the adjacent property for remediation costs. Although trichloroethylene (“TCE”) and other contaminants previously used by former owners at the facility are present in soil and groundwater on the subsidiary’s property, we vigorously contest any assertion that the subsidiary caused the contamination. In November 1998, we signed an agreement with the three former owners of this facility whereby they have 1) reimbursed us for $0.5 million of past costs, 2) assumed responsibility for 90% of all future clean-up costs, and 3) promised to indemnify and protect us against any and all third-party claims relating to the contamination of the facility. An Integrated Corrective Action Plan was submitted to the State of Colorado. Sampling and management plans were prepared for the Colorado Department of Public Health & Environment. State and local agencies in Colorado are reviewing current data and considering study and cleanup options. The most recent forecast

10
estimated that the total project cost, up to the year 2020, would be approximately $5.3 million; accordingly, we recorded a one-time charge of $0.5 million for this project in 2003. There has not been any significant development since September 28, 2003.
EMPLOYEES
At the end of the most recently completed fiscal year, we employed approximately 1,900 persons domestically and 1,300 persons at our international facilities. None of our employees are represented by a labor union; however, some employees in Europe are represented by an employee works council pursuant to local regulations. We have experienced no work stoppages and believe our employee relations are good.
ITEM 1A. RISK FACTORS
Negative or uncertain worldwide economic conditions could prevent us from accurately forecasting demand for our products, which could adversely affect our operating results or market share.
Recent negative worldwide economic conditions and market instability have made it increasingly difficult for us, our customers and our suppliers to accurately forecast future product demand trends. If signs of improvement in the global economy do not progress as expected and global economic conditions worsen, our forecasts of product demand trends could prove to be incorrect and could cause us to produce excess products that can depress product prices, increase our inventory carrying costs and result in obsolete inventory. Alternatively, this forecasting difficulty could cause a shortage of products, or materials used in our products, that could result in an inability to satisfy demand for our products and a loss of market share.
Negative or uncertain worldwide economic conditions may adversely affect our business, financial condition, cash flow and results of operations.
Recent domestic and global economic conditions have presented unprecedented and challenging conditions reflecting continued concerns about the availability and cost of credit, downgrades and continued negative pressure on sovereign credit ratings, the mortgage market, declining real estate values, increased energy costs, decreased consumer confidence and spending and added concerns fueled by the federal government's interventions in the financial and credit markets. These conditions have contributed to instability in both the domestic and international capital and credit markets, potentially increased the cost of credit and diminished expectations for the global economy. In addition, these conditions make it extremely difficult for our customers to accurately forecast and plan future business activities and could cause businesses to slow spending on our products, which could cause our sales to decrease or result in an extension of our sales cycles. If signs of improvement in the global economy do not progress as expected and global economic conditions worsen, our customers may have difficulties obtaining capital at adequate or historical levels to finance their ongoing businesses and operations, which could impair their ability to make timely payments to us. If that were to occur, we may be required to increase our allowance for doubtful accounts and our days sales outstanding would be negatively impacted. We cannot predict the timing, strength or duration of any economic slowdown or subsequent economic recovery, worldwide or within our industry. If signs of improvement in the global economy do not progress as expected and economic conditions worsen, our business, financial condition, cash flows and results of operations will be adversely affected.
We may be unable to successfully implement our acquisitions strategy or integrate acquired companies and personnel with existing operations.
We have in the past acquired a number of businesses or companies, additional product lines and assets, and we may continue to expand and diversify our operations with additional acquisitions. We may be unable to identify or complete prospective acquisitions for many reasons, including competition from other companies in the semiconductor industry and high valuations of business candidates. In addition, applicable antitrust laws and other regulations may limit our ability to acquire targets or force us to divest an acquired business, such as occurred with our attempt to acquire SEMICOA. If we are unable to identify suitable targets or complete acquisitions, our growth prospects may suffer, and we may not be able to realize sufficient scale advantages to compete effectively in all markets. To the extent that we are successful in making acquisitions, if we are unsuccessful in integrating acquired companies or product lines with existing operations, or if integration is more difficult or more costly than anticipated, we may experience disruptions that could have a material adverse effect on our business, financial condition and results of operations. In addition, the market price of our common stock could be adversely affected if the effect of any acquisitions on the Microsemi consolidated group's financial results is dilutive or is below the market's or financial analysts' expectations. Some of the risks that may affect our ability to integrate or realize any anticipated benefits from acquired companies, businesses or assets include those associated with:
• unexpected losses of key employees or customers of the acquired company;
• conforming the acquired company's standards, processes, procedures and controls with our operations;
• coordinating new product and process development;
• increasing complexity from combining recent acquisitions;

11
• hiring additional management and other critical personnel;
• increasing the scope, geographic diversity and complexity of our operations;
• difficulties in consolidating facilities and transferring processes and know-how;
• other difficulties in the assimilation of acquired operations, technologies or products;
• diversion of management's attention from other business concerns; and
• adverse effects on existing business relationships with customers.
In connection with acquisitions, we may:
• use a significant portion of our available cash;
• issue equity securities, which would dilute current stockholders' percentage ownership;
• incur substantial debt;
• incur or assume contingent liabilities, known or unknown, including potential lawsuits, infringement actions and similar liabilities;
• incur impairment charges related to goodwill or other intangibles;
• incur large, immediate accounting write-offs; and
• face antitrust or other regulatory inquiries or actions.
There can be no assurance that the benefits of any acquisitions will outweigh the attendant costs, and if they do not, our results of operations and stock price may be adversely affected.
The concentration of the facilities that service the semiconductor industry, including facilities of current or potential vendors or customers, makes us more susceptible to events or disasters affecting the areas in which they are most concentrated.
Relevant portions of the semiconductor industry, and the facilities that serve or supply this industry, tend to be concentrated in certain areas of the world. Events such as natural disasters and related disruptions, epidemics and health advisories like those related to Sudden Acute Respiratory Syndrome, Avian Influenza or the H1N1 Virus, flooding, tsunamis, power outages and infrastructure disruptions, and civil unrest and political instability in those areas, have from time to time in the past, and may again in the future, adversely affect the semiconductor industry. In particular, events such as these could adversely impact our ability to manufacture or deliver our products and result in increased costs and a loss of revenue. Similarly, a localized risk affecting our employees or the staff of our suppliers could impair the total volume of products that we are able to manufacture, which could adversely affect our results of operations and financial condition.
In the first quarter of fiscal year 2012, severe flooding in certain regions of Thailand forced a shutdown of our operations in two subcontracted facilities in Thailand. The two Thailand facilities together accounted for as much as 5% of our total quarterly revenues. In response to the impact of flooding at subcontractor facilities in Thailand, we implemented plans to move production to other facilities outside the affected area. We believe that current production capabilities at these other facilities can compensate in the near future for the loss of production of the flooded facilities in Thailand and that we have recovered from this event as of the end of the second fiscal quarter of 2012. However, unforeseen impacts on our customers, suppliers or subcontractors as a result of the flooding in Thailand could continue to affect our revenue, consolidated financial position, results of operations and cash flows.
We are dependent on third parties for key functions including foundries for wafer supplies, subcontractors for assembly, test, packaging services and vendors for logistics and problems at these third parties could adversely affect our business and operating results.
We depend on third party subcontractors, primarily in Asia for wafer fabrication, assembly, test and packaging of an increasing portion of our products. Approximately 82% of our wafer and 89% of our assembly and test requirements are currently sourced from third party foundries and subcontractors. We expect that these percentages may increase due, in part, to the manufacture of our next-generation products by third party subcontractors in Asia and from activity at recently acquired operations.
Our wafer designs requirements are increasing in technological complexity and in order to meet our design specifications, our foundry partners must expend resources for capital equipment and to develop or improve manufacturing processes. Our foundry partners' inability or unwillingness to expend these resources could adversely affect our business and operating results. The assembly, testing and packaging of our products is performed by a limited group of subcontractors. Disruption or

12
termination of any of these subcontractors could occur and such disruptions or terminations could harm our business and operating results.
We utilize third party logistics services, including transportation, warehouse and shipping services. These service providers are subject to interruptions that affect their ability to service us, including the availability of transportation services, disruptions related to work stoppages, volatility in fuel prices and security incidents or natural events at manufacturing, shipping or receiving points or along transportation routes.
We generally do not have any long-term agreements with our subcontractors. As a result, we may be unable to directly control our quality assurance and product delivery schedules. The cost of product replacements or returns and other warranty matters in connection with quality assurance problems caused by third party subcontractors could materially adversely affect us. Third party manufacturers generally will have longer lead times for delivery of products as compared with our internal manufacturing, and therefore, when ordering from these suppliers, we will be required to make longer-term estimates of our customers' current demand for products, and these estimates are difficult to make accurately. Also, due to the amount of time typically required to qualify assemblers and testers, we could experience delays in the shipment of our products if we are forced to find alternate third parties to assemble or test our products. Any product delivery delays in the future could have a material adverse effect on our operating results, financial condition and cash flows. Our operations and ability to satisfy customer obligations could be adversely affected if our relationships with these subcontractors were disrupted or terminated. In addition, these subcontractors must be qualified by the U.S. government or customers for high-reliability processes. Historically the Defense Supply Center Columbus (DSCC) has rarely qualified any foreign manufacturing or assembly lines for reasons of national security; therefore, our ability to move certain manufacturing offshore may be limited or delayed.
In the event that any of our subcontractors were to experience financial, operational, production or quality assurance difficulties resulting in a reduction or interruption in supply to us, our operating results could suffer until alternate qualified subcontractors, if any, were to become available and active.
Reliance on government contracts for a portion of our sales could have a material adverse effect on results of operations.
Some of our sales are or may be derived from customers whose principal sales are to the United States government. These sales are or may be derived from direct and indirect business with the U.S. Department of Defense and other U.S. government agencies. Future sales are subject to the uncertainties of governmental appropriations and national defense policies and priorities, including impacts of potential sequestration under the Budget Control Act of 2011, constraints of the budgetary process and timing and potential changes in these policies and priorities. If we experience significant reductions or delays in procurements of our products by the U.S. government or terminations of government contracts or subcontracts, our operating results could be materially and adversely affected. Generally, the U.S. government and its contractors and subcontractors may terminate their contracts with us for cause or for convenience. We have in the past experienced one termination of a contract due to the termination of the underlying government contract. All government contracts are also subject to price renegotiation in accordance with the U.S. Government Renegotiation Act. By reference to such contracts, all of the purchase orders we receive that are related to government contracts are subject to these possible events. There is no guarantee that we will not experience contract terminations or price renegotiations of government contracts in the future.
In addition, we are required to maintain compliance with government regulations, particularly for our facilities and products that service the defense and security markets. Maintaining compliance requires that we devote resources to matters that include training, personnel, information technology and facilities. Failure to maintain compliance may result in the loss of certifications, fines and penalties that may materially and adversely affect our operating results.
Microsemi's aggregate net sales to the Defense & Security end market represented approximately 28% of total net sales in 2012. From time to time, we have experienced declining security- and defense-related sales, primarily as a result of contract award delays and reduced security and defense program funding. We may be unable to adequately forecast or respond to the timing of and changes to demand for security- and defense-related products. In the past, defense-related spending on programs that we participate in has increased at a rate that has been slower than expected, been delayed or declined. Our prospects for additional security- and defense-related sales may be adversely affected in a material manner by numerous events or actions outside our control.
Provisions in our credit facility and our current leverage could adversely affect our consolidated financial position and our ability to operate our business.

13
Our credit facility requires that we comply with financial and restrictive covenants. Although we are currently in compliance with these covenants, unexpected downturns in our business may trigger certain covenants that increase our cost of borrowing, decrease the amounts available under our credit facility, or both. The current amount outstanding on our credit facility exceeds our current cash and cash equivalents balance, and we may incur additional debt in the future. Some of the risks that are associated with our leverage include the following:
• our ability to obtain additional financing in the future for acquisitions, capital expenditures, general corporate purposes or other purposes may be impaired;
• our current credit facility only permits borrowing on variable rates of interest and increases in certain benchmark interest rates will increase the cost of borrowing;
• leverage will increase our vulnerability to declining economic conditions, particularly if the decline is prolonged;
• failure to comply with any of our debt covenants may result in an event of default which, if not cured or waived, could have a material adverse effect on us;
• financial and restrictive covenants may adversely affect our ability to implement business plans, react to changes in economic conditions or benefit from changes in tax regulations;
• debt service payments will continue to have a negative impact on our cash flows; and
• prepayment terms that may discourage us from refinancing our current credit agreement or reduce the benefit of lower interest rates.
We are subject to laws, regulations and similar requirements, changes to which may adversely affect our business and operations.
We are subject to laws, regulations and similar requirements that affect our business and operations, including, but not limited to, the areas of commerce, import and export control (especially related to products in our defense and security end market), intellectual property, income and other taxes, anti-trust, anti-corruption, labor, environmental, health and safety. Our compliance in these areas may be costly, especially in areas where there are inconsistencies between the various jurisdictions in which we operate. While we have implemented policies and procedures to comply with laws and regulations, there can be no assurance that our employees, contractors, suppliers or agents will not violate such laws and regulations or our policies. Any such violation or alleged violation could materially and adversely affect our business. Any changes or potential changes to laws, regulations or similar requirements, or our ability to respond to these changes, may significantly increase our costs to maintain compliance or result in our decision to limit our business, products or jurisdictions in which we operate, any of which could materially and adversely affect our business and operations.
Unanticipated changes in our tax provisions or exposure to additional income tax liabilities could affect our financial results.
We are subject to income taxes in the United States and numerous foreign jurisdictions. Our tax liabilities are affected by the amounts we record in intercompany transactions for inventory, services, licenses, funding and other items. We are subject to ongoing tax examinations in various jurisdictions. Tax authorities may disagree with our intercompany charges or other matters and assess additional taxes. Our application of transfer pricing has been the primary subject of the current examination of our federal income tax returns. We regularly assess the likely outcomes of these examinations in order to determine the appropriateness of our tax provision. However, the actual outcomes of these examinations could have a material impact on our financial condition. In addition, our effective tax rate in the future could be adversely affected by changes in the mix of earnings in countries with differing statutory tax rates, changes in the valuation of deferred tax assets and liabilities, changes in tax laws, especially tax laws related to foreign operations, and the discovery of new information in the course of our tax return preparation process. Any of these changes could affect our operating results, cash flows and financial condition.

14
Our operating results may fluctuate in future periods, which could cause our stock price to decline.
We have experienced, and expect to experience in future periods, fluctuations in net sales and operating results from period to period. Our projections and results may be subject to significant fluctuations as a result of a number of factors including:
• the timing of orders from and shipment of products to major customers;
• an unexpected reduction in sales to, or loss of, key customers;
• our product mix;
• changes in the prices of our products;
• manufacturing delays or interruptions;
• delays or failures in testing and processing products for defense, security and aerospace applications;
• inventory obsolescence or write-downs;
• restructuring charges;
• variations in the cost of components for our products;
• limited availability of components that we obtain from a single or a limited number of suppliers; and
• seasonal and other fluctuations in demand for our products.
We have closed, combined, sold or disposed of certain of our operations, which in the past has reduced our sales volume and resulted in significant restructuring costs.
In September 2009, we approved consolidation plans that resulted in the closure of our manufacturing facility in Scottsdale, Arizona during the quarter ended April 3, 2011. Scottsdale represented approximately 1% of our annual net sales in fiscal year 2011 and occupied a 135,000 square foot leased facility. We face major technical challenges in regard to transferring component manufacturing between locations. Before a transfer of manufacturing, we must be finished qualifying the new facility appropriately with the U.S. government or certain customers. In addition, to mitigate the potential for manufacturing disruptions following a closure, we typically build inventory to support the transition process. While we plan generally to retain revenues and income of those operations by transferring the manufacturing elsewhere within Microsemi's subsidiaries, our plans may change at any time based on reassessment of the alternatives and consequences. While we hope to benefit overall from increased gross margins and increased capacity utilization rates at remaining operations, the remaining operations will need to bear the corporate administrative and overhead costs, which are charges to income that had been allocated to the discontinued business units. Moreover, delays in effecting our consolidations could result in changes in the timing of realized costs savings and in greater than anticipated costs incurred to achieve the hoped for longer-range savings.
In October 2003, we announced the consolidation of the manufacturing operations of Microsemi Corp. - Santa Ana, of Santa Ana, California into some of our other facilities. The Santa Ana facility, whose manufacturing represented approximately 13% of our annual net sales in fiscal year 2004, had approximately 380 employees and occupied 123,000 square feet. In April 2005, we announced the consolidation of the high-reliability products operations of Microsemi Corp. - Colorado of Broomfield, Colorado (“Broomfield”) into some of our other facilities. Broomfield represented approximately 5% of our annual net sales in fiscal year 2009, had approximately 50 employees and occupied a 130,000 square foot owned facility.
We may make further specific determinations to consolidate, close, sell or divest of additional facilities, operations or product lines, which could be announced at any time. Possible adverse consequences from current and future consolidation or disposition activities may include a loss of revenues and various accounting charges such as for workforce reduction, including severance and other termination benefits and for excess facilities, including lease termination fees, future contractual commitments to pay lease charges, facility remediation costs and moving costs to remove property and equipment from facilities. We may also be adversely impacted from inventory buildup in preparation for the transition of manufacturing, disposition costs, impairments of goodwill, a possible immediate loss of revenues, and other items in addition to normal or attendant risks and uncertainties. We may be unsuccessful in any of our current or future efforts to consolidate our business into a smaller number of facilities. Our plans to minimize or eliminate any loss of revenues during consolidation may not be achieved.
We may not be able to develop new technologies and products to satisfy changes in customer demand, and our competitors could develop products that decrease the demand for our products.

15
Rapidly changing technologies and industry standards, along with frequent new product introductions, characterize the semiconductor industry. Our financial performance depends, in part, on our ability to design, develop, manufacture, assemble, test, market and support new products and enhancements on a timely and cost-effective basis. If we are unable to continue to reduce package sizes, improve manufacturing yields and expand sales, we may not remain competitive. Our recent spending on research and development was principally to develop new higher-margin application-specific products, including, among others, our 65nm process development for next generation programmable products, higher power PoE solutions, the continued roadmap development of our industry-leading timing & synchronization products, our SiGe RF power amplifier solutions for wireless LAN applications, and the ongoing development of GaN and SiC power management and RF solutions. The competitiveness of designs that we have introduced, including power-over-ethernet, CCFL and LED drivers, class-D audio amplifiers, InGaP RF power amplifiers for wireless LAN applications, development and adoption of silicon carbide technology, ASICs, VDMOS products for high frequency communications and S-band products for RF applications, are subject to various risks and uncertainties that we are not able to control, including changes in customer demand and the introduction of new or superior technologies by others. Moreover, any failure by us in the future to develop new technologies or timely react to changes in existing technologies could materially delay our development of new products, which could result in product obsolescence, decreased revenues and a loss of our market share to our competitors. New technologies or products that we may develop may not lead to an incremental increase in revenues, and there is a risk that these new technologies or products will decrease the demand for our existing products and result in an offsetting reduction in revenues. In addition, products or technologies developed by others may render our products or technologies obsolete or non-competitive. A fundamental shift in technologies in our product markets could have a material adverse effect on our competitive position within the industry.
We must commit resources to research and development, design, and production prior to receipt of purchase commitments and could lose some or all of the associated investment.
We sell products primarily pursuant to purchase orders for current delivery, rather than pursuant to long-term supply contracts. Many of these purchase orders may be revised or canceled without penalty. As a result, we must commit resources to the research, design and production of products without any advance purchase commitments from customers. Any inability to sell a product after we devote significant resources to it could have a material adverse effect on our business, financial condition, results of operations and cash flows.
International operations and sales expose us to material risks and may increase the volatility of our operating results.
Net sales from international markets represent a significant portion of total net sales. Our net sales to international customers represented approximately 50% in 2012. These sales were principally to customers in Europe and Asia. Foreign sales are classified as shipments to foreign destinations. We maintain several international facilities or contracts with entities outside the United States, including Canada, China, France, India, Ireland, Israel, Japan, Korea, Malaysia, Macau, the Philippines, Taiwan, Thailand and the United Kingdom. There are risks inherent in doing business internationally, including:
• legislative or regulatory requirements and potential changes in or interpretations of requirements in the United States and in the countries in which we manufacture or sell our products;
• tax regulations and treaties and potential changes in regulations and treaties in the United States and in and between countries in which we manufacture or sell our products;
• fluctuations in income tax expense and net income due to differing statutory tax rates in various domestic and international jurisdictions;
• trade restrictions;
• uncertain interpretations of and difficulties enforcing intellectual property laws;
• local business and cultural factors that may differ from our domestic standards and practices, including business practices from which we are prohibited from engaging by the Foreign Corrupt Practices Act and other anti-corruption laws and regulations;
• availability of transportation services, including disruptions related to work stoppages, security incidents or natural events at manufacturing, shipping or receiving points or along transportation routes;
• work stoppages or disruption of local labor supply;
• communication interruptions;
• economic and political instability, including the recent uncertainty in the global financial markets;
• acts of war or terrorism, or health issues (such as Sudden Acute Respiratory Syndrome, Avian Influenza or the H1N1 Virus), which could disrupt our manufacturing and logistical activities;
16
• compliance with and changes in import/export regulations;
• changes in tariffs and freight rates;
• difficulties in collecting receivables and enforcing contracts generally;
• restrictions in the transfer or repatriation of funds; and
• currency exchange rate fluctuations, devaluation of foreign currencies, hard currencies shortages and exchange rate fluctuations.
International sales of our products that service the defense and security markets are subject to U.S. and local government regulations and procurement policies and practices including regulations relating to import-export control. Violations of export control regulations could result in suspension of our ability to export our products. Depending on the scope of the suspension, this could have a material effect on our ability to perform certain international contracts. In addition, failure to maintain compliance with U.S. and foreign government regulations, including the FCPA and foreign anti-corruption measures may result in fines and penalties that may materially and adversely affect our operating results.
If political, military, transportation, health or other issues in foreign countries result in cancellations of customer orders or contribute to a general decrease in economic activity or corporate spending, or directly impact Microsemi's marketing, manufacturing, financial and logistics functions, our consolidated results of operations and financial condition could be materially adversely affected. In addition, the laws of certain foreign countries may not protect our products, assets or intellectual property rights to the same extent as do U.S. laws. Therefore, the risk of piracy of our technology and products, which could result in a material adverse effect on our financial condition, operating results and cash flows, may be greater in those foreign countries.
There may be unanticipated costs associated with appropriately scaling our manufacturing capacity to meet expected changes in customer demand.
We may incur unanticipated costs as we scale our manufacturing capacity to meet expected changes in customer demand. During periods of anticipated increases in customer demand, we may determine that our business will require increased manufacturing capacity on our part and on the part of certain outside foundries, assembly shops, or testing facilities for some of our integrated circuit products or other products. Expansion activities are subject to a number of risks, including:
• unavailability or late delivery of the advanced, and often customized, equipment used in the production of our specialized products;
• availability of qualified manufacturing personnel;
• delays in bringing new production equipment on-line;
• delays in supplying satisfactory designs or products to our existing customers;
• unforeseen environmental, engineering or manufacturing qualification problems relating to existing or new facilities; and
• overexpansion may result in unfavorable manufacturing variances, restructuring costs and impairments.
These and other risks may affect the ultimate cost and timing of any expansion of our capacity.
Downturns in the highly cyclical semiconductor industry have in the past adversely affected our operating results, cash flows and the value of our business, and may continue to do so in the future.
The semiconductor industry is highly cyclical and is characterized by constant technological change, rapid product obsolescence and price erosion, short product life-cycles and fluctuations in product supply and demand. During recent years we, as well as many others in our industry, have experienced significant declines in the pricing of, as well as demand for, products during the “down” portions of these cycles, which have sometimes been severe and prolonged. In the future, these downturns may prove to be as, or possibly even more, severe than past ones. Our ability to sell our products depends, in part, on continued demand in each of our diverse end markets. Each of these end markets has in the past experienced reductions in demand, and current and future downturns in any of these markets may continue to adversely affect our revenues, operating results, cash flows and financial condition.
The semiconductor business is subject to downward price pressure.
The market for our products has been characterized by declining selling prices, and we anticipate that our average selling prices will decrease in future periods, although the timing and amount of these decreases cannot be predicted with any certainty. The pricing pressure in the semiconductor industry in past years has been due to a large number of factors, many of which were not easily foreseeable, such as the Asian currency crisis, industry-wide excess manufacturing capacity, weak

17
economic growth, the slowdown in capital spending that followed the “dot-com” collapse, the reduction in capital spending by telecom companies and satellite companies, and the effects of the tragic events of terrorism on September 11, 2001. Similar to past years, recent unfavorable economic conditions have resulted in a tightening of the credit markets. If signs of improvement in the global economy do not progress as expected and global economic conditions worsen, we may experience a decline in our average selling prices. In addition, our competitors have in the past, and may again in the future, lower prices in order to increase their market share. Continued downward price pressure in the industry may reduce our operating results and harm our financial and competitive position.
The semiconductor industry is highly competitive.
The semiconductor industry, including the areas in which we do business, is highly competitive. We expect intensified competition from existing competitors and new entrants. Competition is based on price, product performance, product availability, quality, reliability and customer service. We compete in various markets with companies of various sizes, some of which are larger and have greater financial and other resources than we have, and thus may be better able to pursue acquisition candidates and to withstand adverse economic or market conditions. In addition, companies not currently in direct competition with us may introduce competing products in the future. Some of our current major competitors are Aeroflex Holding Corporation; Altera Corporation; Fairchild Semiconductor International, Inc.; Freescale Semiconductor, Inc.; Texas Instruments, Inc.; Integrated Device Technology, Inc.; International Rectifier Corp.; Linear Technology Corp.; M/A COM Technology Solutions Inc.; Maxim Integrated Products, Inc.; Micrel Incorporated; Monolithic Power Systems, Inc.; O2Micro International, Ltd.; Semtech Corp.; Silicon Laboratories, Inc.; Skyworks Solutions, Inc.; Supertex, Inc. and Xilinx, Inc. Some of our competitors in developing markets are Integrated Device Technology, Inc.; Semtech Corp.; Silicon Laboratories, Inc.; Skyworks Solutions, Inc. and Triquint Semiconductor, Inc. Several of these companies are larger than we are and have greater resources than we have and may therefore be better able than we are to penetrate new markets, pursue acquisition candidates, and withstand adverse economic or market conditions. We expect intensified competition from both these existing competitors and new entrants into our markets. To the extent we are not able to compete successfully in the future, our financial condition, operating results or cash flows could be harmed.
Compound semiconductor products may not successfully compete with silicon-based products.
Our choices of technologies for development and future implementation may not reflect future market demand. The production of gallium arsenide (GaAs), indium gallium phosphide (InGaP), silicon germanium (SiGe), indium gallium arsenide phosphide (InGaAsP) or silicon carbide (SiC) integrated circuits is more costly than the production of silicon circuits, and we believe it will continue to be more costly in the future. The costs differ because of higher costs of raw materials, lower production yields and higher unit costs associated with lower production volumes. Silicon semiconductor technologies are widely used in process technologies for integrated circuits, and these technologies continue to improve in performance. As a result, we must offer compound semiconductor products that provide vastly superior performance to that of silicon for specific applications in order for our products to be competitive with silicon products. If we do not offer compound semiconductor products that provide sufficiently superior performance to offset the cost differential and otherwise successfully compete with silicon-based products, our revenues and operating results may be materially and adversely affected.
Production delays related to new compound semiconductors could adversely affect our future results.
We utilize process technology to manufacture compound semiconductors such as GaAs, InGaP, SiGe, SiC and InGaAsP primarily to manufacture semiconductor components. We are pursuing this development effort internally as well as with third party foundries. Our efforts sometimes may not result in commercially successful products. Certain competitors offer this capability and our customers may purchase our competitors' products instead of ours for this reason. In addition, the third party foundries that we use may delay delivery of, or even completely fail to deliver, technology and products to us. Our business and financial prospects could be materially and adversely affected by any failure by us to timely produce these products.
We may be unable to retain our customers due in part to our inability to fulfill our customer demand and other factors.
Our ability to fulfill our customers' demand for our products is and will continue to be dependent in part on our order volumes and long lead times with regard to our manufacturing and testing of certain high-reliability products. The lead time for manufacture and testing of high-reliability products can be many months. In response to this current demand, we have recently increased our capital expenditures for production equipment as well as increased expenses for personnel at certain manufacturing locations. We may have delays or other difficulties in regard to increasing our production and in hiring and retaining qualified personnel. In addition, we have raised prices on certain products, primarily in our Aerospace, Defense & Security and Industrial end markets. Manufacturing delays and price increases may result in our customers reducing their purchase levels with us and/or seeking alternative solutions to meet their demand. In addition, the current demand may not continue in the future. Decreased sales as a result of a loss of one or more significant customers could materially and adversely impact our business and results of operations.

18
Unfavorable or uncertain conditions in certain retail markets that our OEM customers address may cause fluctuations in our rate of revenue growth or financial results.
Some of the principal markets we serve include consumer markets, such as mobile/connectivity and notebooks, monitors and LCD televisions. If domestic and global economic conditions worsen, overall consumer spending may be reduced or shifted to products other than those made by our customers, which would adversely impact demand for products in these markets. Reduced sales by our customers in these end markets will adversely impact demand by our customers for our products and could also slow new product introductions by our customers and by us. Lower net sales of our products would have an adverse effect on our revenue, cash flow and results of operations.
Fluctuations in sales of high-reliability products for use in implantable defibrillators may adversely affect our financial results.
Although the market for implantable defibrillators is growing, customers in this market could reduce their reliance on outside suppliers. The implantable defibrillator market also fluctuates based on several other factors, such as product recalls and the need to secure regulatory approvals. Product recalls can from time to time accelerate sales to levels that cannot be sustained for long periods of time. The timing and qualification of new generations of products brought to market by OEMs can also result in fluctuations in order rates.
Variability of our manufacturing yields may affect our gross margins and profits.
Our manufacturing yields vary significantly among products, depending on the complexity of a particular product's design and our experience in manufacturing that type of product. We have in the past experienced difficulties in achieving planned yields, which have adversely affected our gross margins and profits.
The fabrication of semiconductor products is a highly complex and precise process. Problems in the fabrication process can cause a substantial percentage of wafers to be rejected or numerous circuits on each wafer to be non-functional, thereby reducing yields. These difficulties include:
• defects in masks, which are used to transfer circuit patterns onto our wafers;
• impurities in the materials used;
• contamination of the manufacturing environment; and
• equipment failure.
Because a large portion of our costs of manufacturing is relatively fixed and average selling prices for our products tend to decline over time, it is critical for us to improve the number of shippable circuits per wafer and increase the production volume of wafers in order to maintain and improve our results of operations. Yield decreases can result in substantially higher unit costs, which could materially and adversely affect our operating results and have done so in the past. Moreover, our process technologies have primarily utilized standard silicon semiconductor manufacturing equipment, and production yields of compound integrated circuits have been relatively low compared with silicon circuit devices. We may be unable to continue to improve yields in the future, and we may suffer periodic yield problems, particularly during the early production of new products or introduction of new process technologies. In either case, our results of operations could be materially and adversely affected.
Some of our facilities are located near major earthquake fault lines.
Our headquarters, our major operating facilities, and certain other critical business operations are located near known major earthquake fault lines. We presently do not have earthquake insurance. We could be materially and adversely affected in the event of a major earthquake.
Delays in beginning production, implementing production techniques, resolving problems associated with technical equipment malfunctions, or issues related to government or customer qualification of facilities could adversely affect our manufacturing efficiencies and our ability to realize cost savings.
Microsemi's consolidated manufacturing efficiency will be an important factor in our future profitability, and we may be unsuccessful in our efforts to maintain or increase our manufacturing efficiency. Our manufacturing processes, and those utilized by our third-party subcontractors, are highly complex, require advanced and costly equipment and are sometimes modified in an effort to improve yields and product performance. We have from time to time experienced difficulty in transitions of manufacturing processes to different facilities or adopting new manufacturing processes. As a consequence, we have at times experienced delays in product deliveries and reduced yields. Every silicon wafer fabrication facility utilizes very precise processing, and processing difficulties and reduced yields commonly occur, often as a result of contamination of the material. Reduced manufacturing yields can often result in manufacturing and shipping delays due to capacity constraints. Therefore, manufacturing problems can result in additional operating expense and delayed or lost revenues. In one instance,

19
which occurred in fiscal year 2005, Microsemi scrapped nonconforming inventory at a cost of approximately $1 million and experienced a delay of approximately two months in realizing approximately $1.5 million of net sales. In an additional instance, which occurred in fiscal year 2004, Microsemi encountered a manufacturing problem concerning contamination in a furnace that resulted in the quarantine of approximately one million units at a cost of approximately $2 million. The identification and resolution of that manufacturing issue required four months of effort to investigate and resolve, which resulted in a concurrent delay in realizing approximately $2 million of net sales. Microsemi may experience manufacturing problems in achieving acceptable yields or experience product delivery delays in the future as a result of, among other things, upgrading existing facilities, relocating processes to different facilities, or changing its process technologies, any of which could result in a loss of future revenues or an increase in manufacturing costs.
Interruptions, delays or cost increases affecting our materials, parts, equipment or subcontractors may impair our competitive position.
Our manufacturing operations, and the outside manufacturing operations that we use increasingly, in some instances depend upon obtaining a governmental qualification of the manufacturing process, and in all instances, adequate supplies of materials including wafers, parts and equipment (including silicon, mold compounds and lead frames) on a timely basis from third parties. Some of the outside manufacturing operations we use are based in foreign countries. Our results of operations could be adversely affected if we are unable to obtain adequate supplies of materials, parts and equipment in a timely manner or if the costs of materials, parts or equipment increase significantly. From time to time, suppliers may extend lead times, limit supplies or increase prices due to capacity constraints or other factors. Although we generally use materials, parts and equipment available from multiple suppliers, we have a limited number of suppliers for some materials, parts and equipment. In addition, if signs of improvement in the global economy do not progress as expected and global economic conditions worsen, our suppliers may cease operations or be unable to obtain capital at adequate or historical levels to finance their ongoing businesses and operations, which could impair their ability to continue to supply us. If alternate suppliers for these materials, parts and equipment are not available, our operations could be interrupted, which would have a material adverse effect on our operating results, financial condition and cash flows.
Fixed costs may reduce operating results if our sales fall below expectations.
Our expense levels are based, in part, on our expectations for future sales. Many of our expenses, particularly those relating to capital equipment and manufacturing overhead, are relatively fixed. We might be unable to reduce spending quickly enough to compensate for reductions in sales. Accordingly, shortfalls in sales could materially and adversely affect our operating results. This challenge could be made even more difficult if lead times between orders and shipments are shortening.
Failure to manage consolidation of operations effectively could adversely affect our margins and earnings.
Our ability to successfully offer and sell our products requires effective planning and management processes. Our consolidations and realignments of operations, and expected future growth, may place a significant strain on our management systems and resources, including our financial and managerial controls, reporting systems, procedures and information technology. In addition, we will need to continue to train and manage our workforce worldwide. Any unmet challenges in that regard could negatively affect our results of operations.
Any failure by us to protect our proprietary technologies or maintain the right to use certain technologies may negatively affect our ability to compete.
We rely heavily on our proprietary technologies. Our future success and competitive position depend in part upon our ability to obtain or maintain protection of certain proprietary technologies used in our principal products. We do not have significant patent protection on many aspects of our technology. The protection of some of our technology as “trade secrets” will not necessarily protect us from all uses by other persons of our technology, or their use of technology that is similar or superior to that which is embodied in our trade secrets. In addition, others may be able to independently duplicate or exceed our technology in whole or in part. In the instances in which we hold patents or patent licenses, such as with respect to some circuit components for notebook computers and LCD TVs, any patents held by us may be challenged, invalidated or circumvented, or the rights granted under any patents may not provide us with competitive advantages. Patents often provide only narrow protection and require public disclosure of information that may otherwise be subject to trade secret protection. In addition, patents eventually expire and are not renewable.
Obtaining or protecting our proprietary rights may require us to defend claims of intellectual property infringement by our competitors. We could also become subject to lawsuits in which it is alleged that we or companies we have acquired have infringed or are infringing upon the intellectual property rights of others with or without our prior awareness of the existence of those third-party rights, if any. Litigation in connection with our intellectual property, whether instituted by us or others, could be very costly and distract management and other resources from our business. We are currently involved in certain patent litigation to protect our patents and patent rights, which could cause legal costs to increase above normal levels over the next

20
several years. It is not possible to estimate the exact amounts of these costs, but it is possible that these costs could have a negative effect on our future results.
Moreover, if any infringement, real or imagined, happens to exist, arise or is claimed in the future, we may be exposed to substantial liability for damages and may need to obtain licenses from the patent owners, discontinue or change our processes or products or expend significant resources to develop or acquire non-infringing technologies. We may not be successful in such efforts, or such licenses may not be available under reasonable terms. Any failure by us to develop or acquire non-infringing technologies or to obtain licenses on acceptable terms could have a material adverse effect on our operating results, financial condition and cash flows.
Our products may be found to be defective or hazardous and we may not have sufficient liability insurance.
There is at any time a risk that our products may be found to be defective or to contain, without the customer's knowledge, certain prohibited hazardous chemicals after we have already shipped the products in volume, perhaps requiring a product replacement or recall. We may be subject to product returns that could impose substantial costs and have a material and adverse effect on our business, financial condition and results of operations. Our aerospace, defense, and industrial businesses in particular expose us to potential liability risks that are inherent in the manufacturing and marketing of high-reliability electronic components for critical applications. Production of many of these products is sensitive to minute impurities, which can be introduced inadvertently in manufacture. Any production mistake can result in large and unanticipated product returns, product liability and warranty liability. Environmental regulations have imposed on every major participant in the electronics industry a new burden of determining and tracking the presence and quantity of certain chemicals in the content of supplies we buy and add to our products for sale and to inform our customers about each of our finished goods' relevant chemical contents. The management and execution of this process is very challenging, and mistakes in this information gathering process could have a material adverse effect on our business.
We may be subject to product liability claims with respect to our products. Our product liability insurance coverage may be insufficient to pay all such claims. In addition, product liability insurance may become too costly for us to maintain or may become completely unavailable to us in the future. We may not have sufficient resources to satisfy any product liability claims not covered by insurance, which would materially and adversely affect our financial position.
Environmental liabilities could adversely impact our consolidated financial position.
Federal, state and local laws and regulations impose various restrictions and controls on the discharge of materials, chemicals and gases used in our semiconductor manufacturing processes or in our finished goods. Under recent environmental regulations, we are responsible for determining whether certain toxic metals or certain other toxic chemicals are present in any given component we purchase and in each given product we sell. These environmental regulations have required us to expend a portion of our resources and capital on relevant compliance programs. In addition, under other laws and regulations, we could be held financially responsible for remedial measures if our current or former properties are contaminated or if we send waste to a landfill or recycling facility that becomes contaminated, even if we did not cause the contamination. Also, we may be subject to additional common law claims if we release substances that damage or harm third parties. Further, future changes in environmental laws or regulations may require additional investments in capital equipment or the implementation of additional compliance programs in the future. Any failure to comply with existing or future environmental laws or regulations could subject us to significant liabilities and could have a material adverse effect on our operating results, cash flows and financial condition.
In the conduct of our manufacturing operations, we have handled and do handle materials that are considered hazardous, toxic or volatile under federal, state and local laws. The risk of accidental release of such materials cannot be completely eliminated. In addition, we operate or own facilities located on or near real property that was formerly owned and operated by others. These properties were used in ways that involved hazardous materials. Contaminants may migrate from, within or through any such property, which may give rise to claims against us. Third parties who are responsible for contamination may not have funds, or may not make funds available when needed, to pay remediation costs imposed upon us jointly with them under environmental laws and regulations.
In Broomfield, Colorado, the owner of a property located adjacent to a manufacturing facility owned by one of our subsidiaries, Microsemi Corp. - Colorado, had notified the subsidiary and other parties of a claim that contaminants migrated to his property, thereby diminishing its value. In August 1995, the subsidiary, together with Coors Porcelain Company, FMC Corporation and Siemens Microelectronics, Inc. (former owners of the manufacturing facility), agreed to settle the claim and to indemnify the owner of the adjacent property for remediation costs. Although TCE and other contaminants previously used by former owners at the facility are present in soil and groundwater on the subsidiary's property, we vigorously contest any assertion that our subsidiary caused the contamination. In November 1998, we signed an agreement with the three former owners of this facility whereby they have 1) reimbursed us for $0.5 million of past costs, 2) assumed responsibility for 90% of all future clean-up costs, and 3) promised to indemnify and protect us against any and all third-party claims relating to the contamination of the facility. An Integrated Corrective Action Plan was submitted to the State of Colorado. Sampling and

21
management plans were prepared for the Colorado Department of Public Health & Environment. State and local agencies in Colorado are reviewing current data and considering study and cleanup options. The most recent forecast estimated that the total project cost, up to the year 2020, would be approximately $5.3 million; accordingly, we recorded a one-time charge of $0.5 million for this project in 2003. There has not been any significant development since September 28, 2003.
Litigation could adversely impact our consolidated financial position.
We are and have been involved in various litigation matters, including from time to time, litigation relating to employment matters, commercial transactions, intellectual property matters, contracts, environmental matters and matters related to compliance with governmental regulations. Litigation is inherently uncertain and unpredictable. The potential risks and uncertainties include, but are not limited to, such factors as the costs and expenses of litigation and the time and attention required of management to attend to litigation. An unfavorable resolution of any particular legal claim or proceeding, and/or the costs and expenses incurred in connection with a legal claim or proceeding, could have a material adverse effect on our consolidated financial position or results of operations.
Our future success depends, in part, upon our ability to continue to attract and retain the services of our executive officers or other key management or technical personnel.
We could potentially lose the services of any of our senior management personnel at any time due to a variety of factors that could include, without limitation, death, incapacity, military service, personal issues, retirement, resignation or competing employers. Our ability to execute current plans could be adversely affected by such a loss. We may fail to attract and retain qualified technical, sales, marketing and managerial personnel required to continue to operate our business successfully. Personnel with the expertise necessary for our business are scarce and competition for personnel with proper skills is intense. Also, attrition in personnel can result from, among other things, changes related to acquisitions, retirement and disability. We may not be able to retain existing key technical, sales, marketing and managerial employees or be successful in attracting, assimilating or retaining other highly-qualified technical, sales, marketing and managerial personnel, particularly at such times in the future as we may need to fill a key position. If we are unable to continue to retain existing executive officers or other key employees or are unsuccessful in attracting new highly-qualified employees, our business, financial condition and results of operations could be materially and adversely affected.
The volatility of our stock price could affect the value of an investment in our stock and our future financial position.
The market price of our stock has fluctuated widely. Between October 2, 2011 and September 30, 2012, the market sale price of our common stock ranged between a low of $14.82 and a high of $22.30. The historic market price of our common stock may not be indicative of future market prices. We may not be able to sustain or increase the value of our common stock. The trading price of our common stock may be influenced by factors beyond our control, such as the recent unprecedented volatility of the financial markets and the current uncertainty surrounding domestic and foreign economies. Declines in the market price of our stock could adversely affect our ability to retain personnel with stock incentives, to acquire businesses or assets in exchange for stock and/or to conduct future financing activities with or involving our common stock.
We may not make the sales that are suggested by our order rates, backlog or book-to-bill ratio, and our book-to-bill ratio may be affected by product mix.
Prospective investors should not place undue reliance on our book-to-bill ratios or changes in book-to-bill ratios. We determine bookings substantially based on orders that are scheduled for delivery within 12 months. However, lead times for the release of purchase orders depend, in part, upon the scheduling practices of individual customers, and delivery times of new or non-standard products can be affected by scheduling factors and other manufacturing considerations. The rate of booking new orders can vary significantly from month to month. Customers frequently change their delivery schedules or cancel orders. We have in the past experienced long lead times for some of our products, which may have therefore resulted in orders in backlog being duplicative of other orders in backlog, which would increase backlog without resulting in additional revenues. Because of long lead times in certain products, our book-to-bill ratio may not be an indication of sales in subsequent periods. Uncertain worldwide economic conditions and market instability have also resulted in hesitance of our customers to place orders with long delivery schedules, which contributes to limited visibility into our markets.
At times, our working capital levels have risen, which adversely affects cash flow.
At times, our working capital levels have risen and the increase has adversely affected cash flow. A factor contributing to the increase in our working capital has related to acquisitions with increases in accounts receivable and inventory generally exceeding increases in accounts payable and accrued liabilities. Another factor resulting in an increase in working capital has been a buildup of inventory prior to the consolidation of our manufacturing operations. We built inventory cushions during the transition of manufacturing between facilities in order to maintain an uninterrupted supply of product. Obsolescence of any inventory has recently and could in the future result in adverse effects on our future results of operations and future revenue. In 2009, in addition to other inventory write-downs, we recorded inventory write-downs of $10.3 million for product lines that did

22
not meet gross margin targets, products that are being migrated to newer generations, and products that service the large capital spending end markets for which demand has declined and $7.3 million for estimated inventory components that were not expected to be used by the closure date of our Scottsdale facility and that cannot be used by other manufacturing facilities. During the quarter ended April 3, 2011, we recorded a charge of $8.4 million for the write-off of bridging inventory and an additional $8.2 million for the write-off of medical inventory.
There may be some potential effects of system outages or data security breaches, which could adversely affect our operations financial results or reputation.
We face risks from electrical or telecommunications outages, computer hacking or other general system failure. We rely heavily on our internal information and communications systems and on systems or support services from third parties to manage our operations efficiently and effectively. Any of these are subject to failure. System-wide or local failures that affect our information processing could have a material adverse effect on our business, financial condition, results of operations and cash flows. In addition, a system failure or data security breach could also result in the unintentional disclosure of confidential information about us, our customers or our employees, which could result in our incurring costs for remedial or preventative actions damage our reputation with customers and reduce demand for our products and services. Further, insurance coverage does not generally protect from normal wear and tear, which can affect system performance. Any applicable insurance coverage for an occurrence could prove to be inadequate. Coverage may be or become unavailable or inapplicable to any risks then prevalent. We are upgrading and integrating, and have plans to upgrade and integrate further our enterprise information systems, and these efforts may cause additional strains on personnel and system resources or may result in potential system outages.
Our investments in securities subject us to principal, liquidity and counterparty risks that could adversely affect our financial results.
We invest cash balances in excess of projected liquidity needs primarily in money market funds. At times, we have also entered into interest rate swap and foreign currency forward contracts. While all of our investments to date are highly rated and we believe our counterparties to be highly rated, current credit market disruptions may adversely affect the value and liquidity of these investments and may affect the ability of our counterparties to fulfill their contractual obligations.
We may have increasing difficulty attracting and retaining qualified outside Board members.
The directors and management of publicly traded corporations are increasingly concerned with the extent of their personal exposure to lawsuits and shareholder claims, as well as governmental and creditor claims that may be made against them in connection with their positions with publicly-held companies. Outside directors are becoming increasingly concerned with the availability of directors' and officers' liability insurance to pay on a timely basis the costs incurred in defending shareholder claims. Directors' and officers' liability insurance is expensive and difficult to obtain. The SEC and the NASDAQ Stock Market have also imposed higher independence standards and certain special requirements on directors of public companies. Accordingly, it may become increasingly difficult to attract and retain qualified outside directors to serve on our Board.
Delaware law and our charter documents contain provisions that could discourage or prevent a potential takeover of Microsemi that might otherwise result in our stockholders receiving a premium over the market price for their shares.
Provisions of Delaware law and our certificate of incorporation and bylaws could make more difficult an acquisition of Microsemi by means of a tender offer, a proxy contest, or otherwise, and the removal of incumbent officers and directors.
These provisions include:
• Section 203 of the Delaware General Corporation Law, which prohibits a merger with a 15%-or-greater stockholder, such as a party that has completed a successful tender offer, without board approval until three years after that party became a 15%-or-greater stockholder;
• The authorization in the certificate of incorporation of undesignated preferred stock, which could be issued without stockholder approval in a manner designed to prevent or discourage a takeover or in a way that may dilute an investment in our common stock; and
• Certain provisions of our charter documents, including provisions eliminating the ability of stockholders to take action by written consent or call special meetings and limiting the ability of stockholders to raise matters at a meeting of stockholders without giving advance notice, may have the effect of delaying or preventing changes in control or management of Microsemi. In addition, our charter documents do not permit cumulative voting, which may make it more difficult for a third party to gain control of our Board of Directors.

23
Our accounting policies and estimates have a material effect on the financial results we report.
Critical accounting policies and estimates have a material effect on our calculations and estimations of amounts in our financial statements. Our operating results and balance sheets may be adversely affected either to the extent that actual results prove to be materially lower than previous accounting estimates or to the extent that accounting estimates are revised adversely. We base our critical accounting policies, including our policies regarding revenue recognition, reserves for returns, rebates, price protections, and bad debt and inventory valuation, on various estimates and subjective judgments that we may make from time to time. The judgments made can significantly affect net income and our balance sheets. We are required to make significant judgments concerning inventory, and whether it becomes obsolete or excess, and concerning impairments of long-lived assets and of goodwill. Our judgments, estimates and assumptions are subject to change at any time. In addition, our accounting policies may change at any time as a result of changes in generally accepted accounting principles as they apply to us or changes in other circumstances affecting us. Changes in accounting policy have affected and could further affect, in each case materially and adversely, our results of operations or financial position.
If, in the future, we conclude that our internal control over financial reporting is not effective, investors could lose confidence in the reliability of our financial statements, which could result in a decrease in the value of our common stock.
As directed by Section 404 of the Sarbanes-Oxley Act of 2002, the SEC adopted rules requiring public companies to include a report of management on the companies' internal control over financial reporting in their annual reports on Form 10-K, including an assessment by management of the effectiveness of the filing company's internal control over financial reporting. In addition, the independent registered public accounting firm auditing a public company's financial statements must attest to the effectiveness of the company's internal control over financial reporting. There is a risk that in the future we may identify internal control deficiencies that suggest that our controls are no longer effective. This could result in an adverse reaction in the financial markets due to a loss of confidence in the reliability of our financial statements, which could cause the market price of our common stock to decline and make it more difficult for us to finance our operations.
ITEM 1B. UNRESOLVED STAFF COMMENTS
None.
ITEM 2. PROPERTIES
We are headquartered in Aliso Viejo, California. We conduct manufacturing, engineering, research and development, sales and/or administration activities at our principal owned and leased facilities and a list of locations is as follows:
California Arizona Massachusetts Ottawa, CanadaAliso Viejo Phoenix LawrenceCamarillo Lowell Macau SAR, ChinaCupertino FloridaFolsom Lake Mary Oregon Shanghai, ChinaGarden Grove BendLa Mirada Georgia Bruges, FranceSan Diego Atlanta PennsylvaniaSan Jose Reading Ennis, IrelandSanta Clara Indiana
West Lafayette Texas Hod Hasharon, IsraelAustinDallas Manila, Philippines
Caldicot, United Kingdom
We also lease sales offices throughout the world. We believe that our existing facilities are well maintained and in good operating condition and that they are adequate for our foreseeable business needs.

24
ITEM 3. LEGAL PROCEEDINGS
On December 8, 2010, Intellectual Ventures I LLC and Intellectual Ventures II LLC filed a complaint in the United States District Court for the District of Delaware against Altera Corporation, Microsemi, and Lattice Semiconductor Corporation. On February 15, 2011, the plaintiffs filed an amended complaint adding Xilinx, Inc. as a defendant. The complaint alleges, inter alia, that programmable logic devices manufactured and sold by our subsidiary Microsemi - SoC infringe United States Patent Numbers 5,687,325, 6,260,087 and 6,272,646 assigned to Intellectual Ventures II LLC, and seeks damages and other relief at law or in equity as the court deems appropriate. The discovery process recently commenced and we do not expect trial to begin for at least one year. In the event of an unfavorable outcome, we believe amounts accrued are adequate and do not believe the resolution of this matter will have a material impact on our financial position or results of operations.
We are also involved in other pending litigation matters arising out of the normal conduct of our business, including litigation relating to acquisitions, employment matters, commercial transactions, contracts, environmental matters and matters related to compliance with governmental regulations. The ultimate aggregate amount of monetary liability or financial impact with respect to these matters is subject to many uncertainties and is therefore not predictable with assurance. In the opinion of management, the final outcome of these matters, if they are adverse, will not have a material adverse effect on our financial position, results of operations or cash flows. However, there can be no assurance with respect to such result, and monetary liability or financial impact on us from these litigation matters could differ materially from those projected.
ITEM 4. MINE SAFETY DISCLOSURES
Inapplicable
PART II
ITEM 5. MARKET FOR REGISTRANT’S COMMON EQUITY, RELATED STOCKHOLDER MATTERS AND ISSUER PURCHASES OF EQUITY SECURITIES
(a) Market Information
Our Common Stock is traded on the NASDAQ Global Select Market under the symbol MSCC. The following table sets forth the high and low sales prices at which our Common Stock traded as reported on the NASDAQ Global Select Market.
Fiscal Year ended September 30, 2012 HIGH LOW
1st Quarter $ 19.34 $ 14.822nd Quarter $ 22.30 $ 16.593rd Quarter $ 22.02 $ 16.634th Quarter $ 21.84 $ 16.57
Fiscal Year ended October 2, 2011 HIGH LOW
1st Quarter $ 24.68 $ 18.082nd Quarter $ 24.96 $ 19.353rd Quarter $ 23.81 $ 19.554th Quarter $ 22.01 $ 14.49
POSSIBLE VOLATILITY OF STOCK PRICES
The market prices of securities issued by technology companies, including ours, have been and will be volatile. The securities of many technology companies have experienced extreme price and volume fluctuations, which have often not necessarily been related to their respective operating performances. Quarter to quarter variations in operating results, changes in earnings estimates by analysts, announcements of technological innovations or new products, announcements of major contract awards, events involving other companies in or out of the industry, economic conditions, events involving war or terrorism, and other events or factors may have a significant impact (positive or negative) on the market price of our Common Stock.
(b) Approximate Number of Common Equity Security Holders
Title of Class
Approximate Number of Record Holders (as of
November 2, 2012)
Common Stock, $0.20 Par Value 722

25
The number of stockholders of record treats all of the beneficial holders of shares held in one “nominee” or “street name” as a unit.
(c) Dividends
We have not paid cash dividends in the last five years and have no current plans to do so. Our credit facility contains covenants that restrict the amount of cash dividends we may pay.
(d) Performance Graph
The following graph, which is furnished rather than filed, compares the five-year cumulative total return on the Company’s Common Stock to the total returns of 1) NASDAQ Stock Market and 2) NASDAQ Stock Market – Electronics & Electrical Equipment & Components Index, excluding Computer Equipment. This comparison assumes in each case that $100 was invested on or about September 30, 2007 and all dividends were reinvested. The Company’s fiscal year ends on the Sunday closest to September 30 each year.
COMPARISON OF 5 YEAR CUMULATIVE TOTAL RETURN*Among Microsemi Corporation, The NASDAQ Composite Index
And the NASDAQ Electronic Components Index
* $100 invested on September 30, 2007 in Microsemi common stock or in an index – including reinvestment of dividends. Indexes calculated on month-end basis.

26
ITEM 6. SELECTED FINANCIAL DATA
For the five fiscal years in the period ended on September 30, 2012(Amounts in thousands, except per share data)
2012 2011 2010 2009 2008
Selected Consolidated Income Statement Data:Net sales $ 1,012,495 $ 835,854 $ 518,268 $ 452,972 $ 514,067Gross profit $ 552,623 $ 441,171 $ 248,211 $ 180,407 $ 228,972Operating income (loss) $ 58,347 $ 54,981 $ 55,881 $ (10,070) $ 63,543Net income (loss) $ (29,675) $ 55,730 $ 59,038 $ (26,823) $ 49,654Earnings (loss) per share:
Basic $ (0.35) $ 0.66 $ 0.73 $ (0.33) $ 0.64Diluted $ (0.35) $ 0.65 $ 0.72 $ (0.33) $ 0.62
Weighted-average shares outstandingBasic 85,837 83,916 80,797 80,943 77,897Diluted 85,837 85,747 81,541 80,943 79,859
Selected Consolidated Balance Sheet Data:Working capital $ 404,863 $ 424,201 $ 360,846 $ 353,953 $ 351,460Total assets $ 1,934,630 $ 1,482,473 $ 879,886 $ 811,130 $ 760,608Long-term liabilities $ 850,166 $ 436,677 $ 42,120 $ 34,010 $ 20,212Stockholders’ equity $ 927,986 $ 892,107 $ 766,443 $ 676,351 $ 673,170
The selected financial data should be read in conjunction with the Consolidated Financial Statements and Notes thereto, and “Management’s Discussion and Analysis of Financial Condition and Results of Operations” in Item 7 of this Form 10-K.

27
ITEM 7. MANAGEMENT’S DISCUSSION AND ANALYSIS OF FINANCIAL CONDITION AND RESULTS OF OPERATIONS
This Annual Report on Form 10-K includes current beliefs, expectations and other forward-looking statements that involve risks and uncertainties. Our actual results could differ materially from the results contemplated by these forward-looking statements due to certain factors, including those discussed in Part II, Item 1A, “Risk Factors” and elsewhere in this Form 10-K. This “Management's Discussion and Analysis of Financial Condition and Results of Operations” (“MD&A”) and the accompanying consolidated financial statements and notes thereto must be read in conjunction with the MD&A and the consolidated financial statements and notes thereto in its entirety.
OVERVIEW
We are a leading designer, manufacturer and marketer of high-performance analog and mixed-signal semiconductor solutions differentiated by power, security, reliability and performance. Our semiconductors manage and control or regulate power, protect against transient voltage spikes and transmit, receive and amplify signals. We offer one of the industry's most comprehensive portfolios of semiconductor technology. Our products include high-performance, high-reliability radio frequency (RF) and power components, analog and RF integrated circuits (ICs), standard and customizable system-on-chip solutions (SoCs/cSoCs), and mixed-signal and radiation-tolerant field programmable gate arrays (“FPGAs”). We also offer subsystems and modules that include application-specific power modules and Power-over-Ethernet (“PoE”) midspans.
Our products include individual components as well as IC solutions that enhance customer designs by improving performance, reliability and battery optimization, reducing size or protecting circuits. The principal end markets that we serve include Communications, Defense & Security, Aerospace and Industrial.
Power management generally refers to a class of standard linear integrated circuits (“SLICs”) that perform voltage regulation and reference in most electronic systems. The definition of power management has broadened in recent years to encompass other devices and modules, often application-specific standard products (“ASSPs”), which address particular aspects of power management, such as audio or display related ICs. This business is composed of both a core platform of traditional SLICs, such as low dropout regulators (“LDOs”) and pulse width modulators (“PWMs”), and differentiated ASSPs such as backlight inverters, audio amplification ICs and small computer standard interface terminators. Our IC products are used in data storage, wireless local area network (“LAN”), automobiles, telecommunications, test instruments, defense and aerospace equipment, high-quality sound reproduction and data transfer equipment.
Our individual component semiconductor products include silicon rectifiers, zener diodes, low leakage and high voltage diodes, temperature compensated zener diodes, transistors, subminiature high power transient suppressor diodes and pin diodes used in magnetic resonance imaging (“MRI”) machines. We also manufacture semiconductors for commercial applications, such as automatic surge protectors, transient suppressor diodes used for telephone applications and switching diodes used in computer systems. A partial list of these products includes: implantable cardioverter defibrillator and heart pacer switching, charging and transient shock protector diodes, low leakage diodes, transistors used in jet aircraft engines and high performance test equipment, high temperature diodes used in oil drilling sensing elements operating at 200 degrees centigrade, temperature compensated zener or rectifier diodes used in missile systems and power transistors.
We have implemented a growth strategy through continuous innovation complemented by strategic acquisitions to strengthen our product and technology portfolio with the intent of broadening our customer base and increasing our technology footprint in customers' end designs in high-value, high barrier-to-entry markets where power matters, security is non-negotiable, and reliability is vital. This allows us to offer an increased value proposition, gather a larger portion of the bill of materials, and engage with customers as a strategic partner as opposed to a socket provider. We believe this strategy strengthens our position in the industry as it protects and grows our share within those markets with the highest barriers to entry, and increases our served available market.
Recent industry leading innovations include:
• SmartFusion®2 system-on-chip (SoC) field programmable gate array (FPGA) family, which integrates inherently reliable flash-based FPGA fabric, a 166 megahertz ARM® Cortex™-M3 processor, advanced security processing accelerators, DSP blocks, SRAM, eNVM and industry-required high-performance communication interfaces all on a single chip;
• Three more devices in the Company's new generation of 1,200 volt non-punch through IGBTs based on its advanced Power MOS 8™ technology, which enables a significant reduction of at least 20 percent in total switching and conduction losses as compared to competitive solutions;
28
• 1011GN-700ELM, the first in a family of radio frequency transistors for high-power air traffic control, secondary surveillance radio applications and is based on gallium nitride on silicon carbide technologies, which are particularly well-suited for high-power electronics applications;
• A new die packaging technology targeted at implantable medical devices such as pacemakers and cardiac defibrillators, which can also be used in wearable devices such hearing aids and intelligent patches, as well as nerve stimulators and drug delivery products;
• The AAHS298B, the first in a new family of octal source driver integrated circuits for aerospace and other high-reliability power electronics control applications including motor control; and
• Two new subscriber line interface circuits (SLICs) for voice-over-broadband cable applications-the dual-channel Le9540 and the single-channel Le9541-which offer industry-leading low-power consumption and include features that allow product developers to cost-effectively add voice capabilities to DOCSIS® and Euro-DOCSIS™3.0 modems.
Our growth strategy is dependent on our ability to successfully develop new technologies and products, and complemented by our ability to implement our selective acquisitions strategy. New technologies or products that we may develop may not lead to an incremental increase in revenues, and there is a risk that these new technologies or products will decrease the demand for our existing products and result in an offsetting reduction in revenues. There can be no assurance that the benefits of any acquisition will outweigh the attendant costs, and if they do not, our results of operations and stock price may be adversely affected.
Net sales increased $176.6 million or 21% between 2012 and 2011 to $1.0 billion in 2012 from $835.9 million in 2011. Net sales increased $317.6 million or 61% between 2011 and 2010 to $835.9 million in 2011 from $518.3 million in 2010. Sales in each end market were favorably impacted in each year by contributions from products we added from recent acquisitions. For 2012 and 2011, we estimate that between 15% to 20% and 25% to 30%, respectively, of net sales were derived from acquisitions concluded in each fiscal year. Estimated sales by end markets are based on our understanding of end market uses of our products. Our analysis of sales by end markets may be found in the "Results of Operations" section below. We believe an estimated breakout of net sales by end markets for the last three fiscal years is approximately as follows (amounts in thousands):
2012 2011 2010
Communications $ 311,952 $ 148,792 $ 116,369Defense & Security 286,430 299,503 208,098Aerospace 212,293 212,127 107,587Industrial 201,820 175,432 86,214
Total $ 1,012,495 $ 835,854 $ 518,268
Operating income increased $3.4 million to $58.3 million in 2012 from $55.0 million in 2011. The favorable impact of higher sales of $176.6 million and higher gross margin of $111.5 million were offset by increases in selling, general and administrative costs of $24.8 million, research and development costs of $54.4 million and amortization expense of $42.3 million, offset by $13.4 million lower restructuring costs.
While each of our acquisitions contributed to higher sales and operating income, we immediately executed an integration plan in functional areas such as sales, operations, human resources, finance and information technology. We have actively taken steps to integrate the management of our various operations, including management of our recent acquisitions. Sales offices, personnel and efforts are combined. Production has been transferred among our facilities to share resources and technology, as well as to increase efficiency. We strive to make the best possible use of our engineering capabilities by sharing product road maps, research and production methods across our divisions and, where appropriate, assigning engineers to the same projects, regardless of which facility records personnel expense. Due to this commingling of activities, we do not practically measure the impact of any particular acquisition. Our acquisitions subjected us to certain risks (See Part II, Item IA, Risk Factors, "We may be unable to successfully implement our acquisitions strategy or integrate acquired companies and personnel with existing operations.")
Uncertain macroeconomic conditions worldwide subject us to certain risks (see Part II, Item 1A, Risk Factors, “Negative or uncertain worldwide economic conditions may adversely affect our business, financial condition, cash flow and results of operations,” “The concentration of the facilities that service the semiconductor industry, including facilities of current or potential vendors or customers, makes us more susceptible to events or disasters affecting the areas in which they are most concentrated,” and “We may be unable to successfully implement our acquisitions strategy or integrate acquired companies and personnel with existing operations.”) In response to the impact of flooding at subcontractor

29
facilities in Thailand, we implemented plans that moved production to other facilities outside the affected area. We believe that current production capabilities at these other facilities can compensate in the near future for the loss of production in the flooded facilities in Thailand and that we have recovered from this event as of the end of the second quarter of 2012. However, unforeseen impacts on our customers, suppliers or subcontractors as a result of the flooding in Thailand could continue to affect our revenue, consolidated financial position, results of operations and cash flows.
Concentrations of credit risk exist because we rely on a significant portion of customers whose principal sales are to the U.S. Government. Approximately 28% of total net sales in 2012 were in the Defense & Security end market, with a very significant amount to customers whose principal sales are to the U.S. Government or to subcontractors whose material sales are to the U.S. Government. We are subject to the impacts of potential sequestration under the Budget Control Act of 2011 and other risks related to U.S. Government sales (see Part II, Item 1A, Risk Factors, "Reliance on government contracts for a portion of our sales could have a material adverse effect on results of operations.")
We closed our Scottsdale facility during the second quarter of 2011. We may make further specific determinations to consolidate, close, sell or divest additional facilities, operations or product lines, which could be announced at any time. Possible adverse consequences from current and future consolidation or disposition activities may include a loss of revenues and various accounting charges such as for workforce reduction, including severance and other termination benefits and for excess facilities, including lease termination fees, future contractual commitments to pay lease charges, facility remediation costs and moving costs to remove property and equipment from facilities. We may also be adversely impacted from inventory buildup in preparation for the transition of manufacturing, disposition costs, impairments of goodwill, a possible immediate loss of revenues, and other items in addition to normal or attendant risks and uncertainties. We may be unsuccessful in any of our current or future efforts to consolidate our business into a smaller number of facilities. Our plans to minimize or eliminate any loss of revenues during consolidation may not be achieved.
Marketing
Our products include individual components as well as IC solutions that enhance customer designs by improving performance, reliability and battery optimization, reducing size or protecting circuits. The principal end markets that we serve include:
• Communications - Products in this end market include broadband power amplifiers and monolithic microwave integrated circuits (“MMICs”) targeted at 802.11 a/b/g/n/e, phase-locked loop, clock synthesis and distribution devices, Synchronous Ethernet (“SyncE”), packet timing devices, voice circuits, FPGAs, multiple-in multiple-out (“MIMO”), LED, cold cathode fluorescent lamp (“CCFL”) controllers, visible light sensors, PWM controllers, voltage regulators, EMI/RFI filters, transient voltage suppressors and class-D audio circuits. Applications for these products include wi-max and wireless LAN devices, PoE devices, portable devices, set top box and telecom applications, monitors, and storage devices.
• Defense & Security - Products in this end market include mixed-signal analog integrated circuits, JAN, JANTX, JANTXV and JANS high-reliability semiconductors, as well as modules including diodes, zeners, diode arrays, transient voltage suppressors, bipolar transistors, MOSFETs, IGBTs, small signal analog integrated circuits, small signal transistors, relays, silicon-controlled rectifiers (“SCRs”), RF transceivers, subsystems and FPGAs. These products are utilized in a variety of applications including radar and communications, defense electronics, homeland security, threat detection, targeting and fire control and other power conversion and related systems in military platforms.
• Aerospace - Products in this end market include offerings such as JAN, JANTX, JANTXV and JANS high-reliability semiconductors and modules, as well as analog mixed-signal products including diodes, zeners, diode arrays, transient voltage suppressors, bipolar transistors, small signal analog integrated circuits, relays, small signal transistors, SCRs, MOSFETs, IGBTs and FPGAs. These products are utilized in a variety of applications including electronic applications for large aircraft and regional jets, commercial radar and communications, satellites, cockpit electronics, and other power conversion and related systems in space and aerospace platforms.
• Industrial - Products in this end market include MOSFETs, IGBTs, FPGAs, power modules, ultra thin bypass diodes, bridge rectifiers, and high-voltage assemblies for use in industrial equipment, semiconductor capital equipment and solar power applications. Industrial applications also include zener diodes, high-voltage diodes, MOSFETs, IGBTs, transient voltage suppressors and thyristor surge protection devices that are designed into implantable defibrillators, pacemakers and neurostimulators, as well as PIN diode switches, dual diode modules, switched-most power supplies (“SMPS”) and RF gradient amplifiers for use in MRI systems.

30
Acquisitions
Zarlink Semiconductor, Inc.
During October 2011, we completed our acquisition of Zarlink Semiconductor, Inc. (“Zarlink”) through a wholly-owned subsidiary. Following the expiration of the previously announced offers for all of the issued and outstanding common shares (“Zarlink Shares”) and 6% unsecured, subordinated convertible debentures maturing September 30, 2012 (“Zarlink Debentures” and together with the Zarlink Shares, the “Zarlink Securities”) of Zarlink, we acquired all remaining Zarlink Shares and Zarlink Debentures for $623.7 million in cash through compulsory acquisitions under, respectively, the Canada Business Corporations Act and the trust indenture governing the Zarlink Debentures. We acquired Zarlink for its world-leading, mixed-signal chip technologies for a broad range of communication and medical applications. Zarlink's core capabilities include timing solutions that manage time-sensitive communication applications over wireless and wired networks, line circuits supporting high-quality voice services over cable and broadband connections, and ultra low-power radios enabling new wireless medical devices and therapies. Serving the world's largest original equipment manufacturers, Zarlink's highly integrated chip solutions help customers simplify design, lower costs and reach market quickly. We sometimes refer to this division herein as “Microsemi - CMPG.”
We allocated the total consideration to Zarlink's tangible and intangible assets and liabilities based on their estimated fair values as of the date of the completion of the transaction. During the fourth quarter of 2012, we adjusted our allocation of deferred tax assets, net. The consideration is allocated as follows (in thousands):
Cash and cash equivalents $ 83,497Accounts receivable 17,980Inventories 28,403Other current assets 35,655Property and equipment 7,648Deferred tax assets, net 27,741Other assets 4,353Identifiable intangible assets 210,100Goodwill 271,757Current liabilities (58,379)Other non-current liabilities (5,085)Total consideration $ 623,670
Identifiable intangible assets and their estimated useful lives are as follows (amounts in thousands):
AssetAmount
WeightedAverage
Useful Life(Years)
Completed technology $ 47,800 6Customer relationships 144,600 6Backlog 15,700 1Trade name 2,000 2
$ 210,100
Timing, Synchronization and Synthesis Business of Maxim Integrated Products, Inc.
During January 2012, we acquired the timing, synchronization and synthesis business of Maxim Integrated Products, Inc. for $44.0 million in cash. The acquired product lines and technology are vital to the effective and efficient delivery of time-sensitive voice, data and multimedia traffic over wireless and wired networks, and will further provide our customers with the critical synchronization components required to harmonize system and network clocks, as well as the synthesis products required to distribute timing clocks throughout each system.

31
We allocated the total consideration to the acquired business' tangible and intangible assets and liabilities based on their estimated fair values as of the date of the completion of the transaction. The consideration is allocated as follows (in thousands):
Inventories $ 2,741Property and equipment 4Identifiable intangible assets 12,960Goodwill 28,509Current liabilities (169)Total consideration $ 44,045
Identifiable intangible assets and their estimated useful lives are as follows (amounts in thousands):
AssetAmount
WeightedAverage
Useful Life(Years)
Completed technology $ 6,000 5Customer relationships 6,700 5Backlog 260 1
$ 12,960
Valuation methodology
The fair value of the identified intangible assets for the acquisitions noted above was estimated by performing a discounted cash flow analysis using the “income” approach. This method includes a forecast of direct revenues and costs associated with the respective intangible assets and charges for economic returns on tangible and intangible assets utilized in cash flow generation. Net cash flows attributable to the identified intangible assets were discounted to their present value at a rate commensurate with the perceived risk. The projected cash flow assumptions considered contractual relationships, customer attrition, eventual development of new technologies and market competition.
The valuation of completed technology and trade names for the acquisitions noted above was based on the relief-from-royalty income approach, a variation of the income approach. The premise of the relief-from-royalty income approach is that if we had not been assigned the rights to the technology and trade names, we would have to pay royalties to continue to exploit the technology and trade names covered by their claims. To arrive at an estimate of royalty charges, the acquired entity's revenue and profit margins were analyzed to determine the ability to pay a royalty. In addition, the license databases were searched for actual royalty terms based on transactions involving technology and trade name licensing.
The useful lives of completed technology rights are based on the number of years in which net cash flows have been projected. The useful life of backlog is estimated based upon the fulfillment period. The useful lives of customer relationships are estimated based upon the length of the relationships currently in place, historical attrition patterns and natural growth and diversification of other potential customers. The useful life of a trade name was estimated based on the period in which a benefit could be ascribed to the identified trade names.
Assumptions used in forecasting cash flows for each of the identified intangible assets included consideration of the following:
• Historical performance including sales and profitability.
• Business prospects and industry expectations.
• Estimated economic life of asset.
• Development of new technologies.
• Acquisition of new customers.
• Attrition of existing customers.
• Obsolescence of technology over time.

32
Generally, the allocation of purchase prices results in an allocation to goodwill. Depending on the structure of a particular acquisition, goodwill and identifiable intangible assets may not be deductible for tax purposes. We determined that goodwill related to the Zarlink acquisition is not deductible while goodwill related to the acquisition of the Timing, Synchronization and Synthesis Business of Maxim Integrated Products, Inc. is deductible.
The factors that contributed to a purchase price resulting in the recognition of goodwill include:
• The premium paid over market capitalization immediately prior to the merger announcement.
• Our belief that the merger will create a more diverse semiconductor company with expansive offerings which will enable us to expand our product offerings.
• Our belief that both companies are committed to improving cost structures and that our combined efforts after the merger should result in a realization of cost savings and an improvement of overall efficiencies.
The purchase price allocations described above are preliminary, primarily with respect to tax contingency matters. A final determination of fair values of assets acquired and liabilities assumed relating to the transactions could differ from the preliminary purchase price allocations and if material differences exist they could result in retrospective revision to the purchase price allocations. We utilized the straight line method of amortization for completed technology, customer relationships and trade name and the estimated fulfillment period for backlog.
Restructuring and Severance Charges
In 2009, we approved consolidation plans that resulted in the closure of our manufacturing facility in Scottsdale, Arizona (“Scottsdale”), which ceased production during the quarter ended April 3, 2011. The Scottsdale facility occupied a 135,000 square foot leased facility. Employee severance is expected to be paid through 2013. Facility termination costs relate primarily to remaining obligations under facility and equipment leases and are expected to be paid through 2016. The following table reflects the restructuring activities for the Scottsdale facility and the accrued liabilities in the consolidated balance sheets at the dates below (amounts in thousands):
EmployeeSeverance
FacilityTermination
Costs Total
Balance at October 2, 2011 $ 355 $ 7,328 $ 7,683Cash expenditures (238) (1,480) (1,718)Balance at September 30, 2012 $ 117 $ 5,848 $ 5,965
At October 2, 2011, we had recorded severance accruals of $2.7 million from reductions in force at our various facilities other than Scottsdale. We recorded additional provisions, primarily related to activities at Microsemi - CMPG, for severance and retention payments totaling $8.7 million in 2012 and also assumed a fair value of $9.8 million in pre-acquisition liabilities recorded by Microsemi - CMPG. Severance covered approximately 300 individuals in manufacturing, engineering and sales. Employee severance is expected to be paid within the next twelve months. Contract termination costs relate primarily to remaining obligations under facility leases and are expected to be paid through 2020. During the quarter ended July 1, 2012, we executed an agreement with a landlord that released us from a lease commitment and as a result, we reversed $1.3 million in provision for contract termination costs. Other associated costs related primarily to relocation costs that we incurred for the consolidation of several facilities in Northern California. The following table reflects the related restructuring activities and the accrued liabilities in the consolidated balance sheets at the dates below (amounts in thousands):
EmployeeSeverance
ContractTermination
Costs
OtherAssociated
Costs Total
Balance at October 2, 2011 $ 2,723 $ — $ — $ 2,723Assumed from acquisition 8,215 1,582 — 9,797Provisions 9,063 561 1,522 11,146Reversal of prior provision (1,112) (1,260) (108) (2,480)Cash expenditures (16,747) (601) (1,414) (18,762)Other non-cash settlement (20) (92) — (112)Balance at September 30, 2012 $ 2,122 $ 190 $ — $ 2,312

33
CRITICAL ACCOUNTING POLICIES AND ESTIMATES
The consolidated financial statements have been prepared in accordance with accounting principles generally accepted in the United States that require us to make estimates and assumptions that affect the reported amounts of assets and liabilities at the date of the consolidated financial statements and revenues and expenses during the periods reported. Actual results could differ from those estimates. Information with respect to our critical accounting policies that we believe could have the most significant effect on our reported results and require subjective or complex judgments is contained in Note 1 to these consolidated financial statements
Accounts Receivable and Allowance for Doubtful Accounts
Trade accounts receivable are recorded at the invoiced amount and do not bear interest. The accounts receivable amount shown in the balance sheet are trade accounts receivable balances at the respective dates, net of allowance for doubtful accounts. The allowance for doubtful accounts is our best estimate of the amount of probable credit losses in our existing accounts receivable. We determine the allowance based in part on our historical write-off experience and specific review of account balances due. Past due balances are reviewed individually for collectability. All other balances are reviewed on a pooled basis by type of receivable. Account balances are charged off against the allowance when we determine that it is probable the receivable will not be recovered. We review our allowance for doubtful accounts quarterly. We do not have any off-balance-sheet credit exposure related to our customers. To date, our allowance for doubtful accounts has generally been within management’s estimates.
Inventories
Inventories are stated at the lower of cost, as determined using the first-in, first-out (“FIFO”) method, or market. Costs include materials, labor and manufacturing overhead. We evaluate the carrying value of our inventories taking into account such factors as historical and anticipated future sales compared with quantities on hand and the price we expect to obtain for our products in their respective markets. We also evaluate the composition of our inventories to identify any slow-moving or obsolete products. Additionally, inventory write-downs are made based upon such judgments for any inventories that are identified as having a net realizable value less than their cost, which is further reduced by related selling expenses. The net realizable value of our inventories for ongoing operations has generally been within management’s estimates. We have recorded inventory write-downs for discontinued product lines that did not meet gross margin targets, products that are being migrated to newer generations, products that service the large capital spending end markets for which demand has declined, products related to facility closures and losses related to flooding of a facility in Thailand.
Fair Value of Financial Assets and Liabilities
Accounting Standards Codification (“ASC”) 825 permits entities to elect the fair value option for certain financial assets and financial liabilities. For financial assets or financial liabilities for which an entity elects the fair value option, ASC 825 requires that the entity record the financial asset or financial liability at fair value rather than at historical cost with changes in fair value recorded in the income statement. ASC 825-25 requires that upfront costs and fees related to items for which the fair value option is elected shall be recognized in earnings as incurred and not deferred. As further discussed in Note 8 of the notes to the consolidated financial statements, we elected the fair value option in accounting for the term loan balance outstanding as of October 2, 2011. Following the extinguishment of the term loan in conjunction with our acquisition of Zarlink, we did not elect the fair value option and are reporting new term loan balances subsequent to October 2, 2011, at par value.
Long-Lived Assets
We assess the impairment of long-lived assets whenever events or changes in circumstances indicate that their carrying value may not be recoverable from the undiscounted estimated future cash flows expected to result from their use.
We are required to make judgments and assumptions in identifying those events or changes in circumstances that may trigger impairment. Some of the factors we consider include:
• Significant decrease in the market value of an asset.
• Significant changes in the extent or manner for which the asset is being used or in its physical condition including manufacturing plant closures.
• A significant change, delay or departure in our business strategy related to the asset.
• Significant negative changes in the business climate, industry or economic conditions.
• Current period operating losses or negative cash flow combined with a history of similar losses or a forecast that indicates continuing losses associated with the use of an asset.
If events or circumstances indicate that the carrying amount of a long-lived asset or asset group may not be recoverable and the expected undiscounted future cash flows attributable to the asset group are less than the carrying value, an impairment

34
loss equal to the excess of the carrying value of the assets within the asset group over their fair value is recorded. The appropriate asset group is determined based on the lowest level of largely independent cash inflows and outflows for the related assets. Depending on the nature of the primary assets in the asset group, fair value is estimated using one of several approaches including replacement cost, appraised values, market quotes or estimated expected future cash flows using a discount rate commensurate with the risk involved. During 2009, we recorded a held for sale impairment of $1.7 million related to the real estate and building for our closed manufacturing facility in Broomfield, Colorado and a held and used impairment of $4.5 million for the closure of our manufacturing facility in Scottsdale, Arizona to reflect our long-lived assets at their lower fair value. Future impairments may be required if we close other manufacturing sites.
Goodwill and Intangible Assets
We account for goodwill on an impairment-only approach and amortize intangible assets with definite useful lives over the benefit period, which approximates straight-line expense over the respective useful lives. We assess qualitative factors to determine whether it is more likely than not that an indefinite-lived intangible asset such as goodwill is impaired as the basis for determining whether a quantitative impairment test is required. We assess definite-lived intangible assets for impairment whenever events or changes in circumstances indicate that the carrying value of an asset may not be fully recoverable. Whenever we determine that there has been an impairment of goodwill or other intangible assets with indefinite lives, we will record an impairment charge against earnings. We operate as one reporting unit and an impairment charge would equal the excess of the carrying value of goodwill in our one reporting unit over its then fair value. The identification of intangible assets and determination of the fair value and useful lives are subjective in nature and often involve the use of significant estimates and assumptions. The judgments made in determining the estimated useful lives assigned to each class of assets can significantly affect net income. We completed our most recent quantitative analysis during the fourth quarter of 2012 and noted that the estimated fair value of our reporting unit substantially exceeded its carrying value and no qualitative factors existed during the fiscal year to indicate that it was more likely than not that the fair value of the reporting unit is less than its carrying amount.
Revenue Recognition, Sales Returns and Allowances
We primarily recognize revenue from customers, including distributors, when title and risk of loss have passed to the customer provided that: 1) evidence of an arrangement exists; 2) delivery has occurred; 3) the fee is fixed or determinable; and 4) collectability is reasonably assured. For substantially all sales, revenue is recognized at the time the product is shipped.
We enter into contracts with certain distributors, and these contracts may permit limited stock rotation returns. We provide an estimated allowance for such returns, and corresponding reductions in revenue are concurrently recorded, based on several factors including past history and notification from customers of pending returns. Actual returns have been within management’s expectations. Estimated reductions to revenue are also recorded for customer incentive programs consisting of price protection and volume purchase rebates. Such programs are limited and actual reductions to revenue have been within management’s expectations.
We also derive a portion of our revenue from fixed-price contracts. Revenue for these contracts are recorded under a percentage of completion method, which is based on the ratio of total costs incurred to date to estimated total costs at completion. Gross profit expected to be realized on fixed-price contracts are based on periodic estimates of total revenues and costs for each contract. Losses on contracts are accrued when estimated total costs exceed total revenues. Occasionally, we will enter into contracts on a cost plus fee basis. We recognize revenue based on reimbursements for actual expenses plus the contractually agreed upon fee with the customer.
Restructuring Charges
We recognize a liability for restructuring costs when the liability is incurred. The restructuring accruals are based upon management estimates at the time they are recorded and can change depending upon changes in facts and circumstances subsequent to the date the original liability is recorded. The main components of our restructuring charges are workforce reductions and elimination of excess facilities. Workforce-related charges are accrued when it is determined that a liability exists, which is generally when individuals have been notified of their expected termination dates and expected severance payments or when formal severance plans exist, when the severance payments are probable and reasonably estimable. The elimination of excess facilities results in charges for lease termination fees, future contractual commitments to pay lease charges net of estimated sublease income, facility remediation costs and moving costs to remove property and equipment from the facilities. We recognize charges for elimination of excess facilities when we have vacated the premises or ceased use of the facility.
Stock-Based Compensation
Compensation expense for stock options and stock appreciation rights was calculated based on the grant or assumption date using the Black-Scholes pricing model. All stock appreciation rights we have granted or assumed are stock-settled. Stock options and stock appreciation rights are granted at exercise prices equal to the closing price of our common stock on the date of grant.

35
Assumed stock options and stock appreciation rights are granted at exercise prices determined in accordance with the acquisition agreement. Expected life was estimated based on historical exercise data that was stratified between members of the Board of Directors, executive employees and all other recipients. Expected volatility was estimated based on historical volatility using equally weighted daily price observations over a period approximately equal to the expected life of each option. The risk free interest rate is based on the implied yield currently available on U.S. Treasury securities with an equivalent remaining term. No dividends are expected to be paid.
Compensation expense for restricted stock awards was calculated based on the closing price of our common stock on the date of grant. Restricted stock awards are subject to forfeiture if a participant does not meet length of service requirements.
Performance stock units are subject to performance-based vesting requirements and generally vest based on the Company's growth in net sales and earnings per share (subject to certain adjustments) for fiscal years 2012 and 2013 in comparison with the growth in net sales and adjusted earnings per share over the same period for a peer group selected by the Compensation Committee. Compensation expense is based upon our estimate of performance relative to the peer group.
Accounting For Income Taxes
We account for income taxes under the asset and liability method, whereby deferred tax assets and liabilities are recognized for the future tax consequences attributable to differences between the financial statement carrying amounts of existing assets and liabilities and their respective tax bases. Deferred tax assets and liabilities are measured using enacted tax rates expected to apply in the years in which those temporary differences are expected to be recovered or settled. The effect on deferred tax assets and liabilities of a change in tax rates is recognized in income in the period that includes the enactment date. We evaluate the need to establish a valuation allowance for deferred tax assets based upon the amount of existing temporary differences, the period in which they are expected to be recovered and expected levels of taxable income. A valuation allowance to reduce deferred tax assets is established when it is more likely than not that some or all of the deferred tax assets will not be realized. We recognize uncertain tax positions when they meet a more-likely-than-not threshold. We recognize potential accrued interest and penalties related to unrecognized tax benefits within operations as income tax expense.
We file U.S. federal, state, and foreign income tax returns in jurisdictions with varying statutes of limitations. Fiscal years 2007 to 2012 generally remain subject to examination by federal and most state tax authorities. In significant foreign jurisdictions, the 2009 to 2012 tax years generally remain subject to examination by tax authorities. We establish liabilities for possible assessments by tax authorities resulting from known tax exposures including, but not limited to, international tax issues and certain tax credits. We are currently undergoing an Internal Revenue Service examination as well as certain state examinations. There have been no significant proposed adjustments to date. We do not believe the results of any audits would have a material impact on our financial position, results of operations or cash flows.
Segment Information
We use the management approach for segment disclosure, which designates the internal organization that is used by management for making operating decisions and assessing performance as the source of our reportable segments. We manage our business on the basis of one reportable segment, as a manufacturer of semiconductors in different geographic areas, including the United States, Europe and Asia.
RESULTS OF OPERATIONS
Net sales increased $176.6 million or 21% between 2012 and 2011 to $1.0 billion for 2012 from $835.9 million for 2011. Net sales increased $317.6 million or 61% between 2011 and 2010 to $835.9 million for 2011 from $518.3 million for 2010. Sales in each end market were favorably impacted in each year by contributions from products we added from recent acquisitions. For 2012 and 2011, we estimate that between 15% to 20% and 25% to 30%, respectively, of net sales were derived from acquisitions concluded in each fiscal year. Estimated sales by end markets are based on our understanding of end market uses of our products. We believe an estimated breakout of net sales by end markets for the last three fiscal years is approximately as follows (amounts in thousands):
2012 2011 2010
Communications $ 311,952 $ 148,792 $ 116,369Defense & Security 286,430 299,503 208,098Aerospace 212,293 212,127 107,587Industrial 201,820 175,432 86,214
Total $ 1,012,495 $ 835,854 $ 518,268
Net sales in the Communications end market increased $163.2 million to $312.0 million in 2012 from $148.8 million in 2011 and increased $32.4 million between 2011 and 2010 from $116.4 million. The increase in net sales during 2012 was due primarily to the contributions of voice circuit and timing and synchronization products of Microsemi - CMPG while net sales in

36
2011 benefited from our acquisition of Microsemi - SoC. Over this period, market adoption of PoE technology, especially by enterprise customers, has increased our market share and our wireless LAN products are well accepted. Both 2012 and 2011 net sales also benefited from steady sales increases in our power management and conversion solutions. We also serve the optical transport network, carrier ethernet switch, IP edge router and wireless backhaul markets which we consider growth markets. Our Communications end markets are however sensitive to macroeconomic conditions and capital expenditure deployment and we expect net sales in this end market to decline in the upcoming quarter based on current and expected backlog.
Net sales in the Defense & Security end market decreased $13.1 million to $286.4 million in 2012 from $299.5 million in 2011 and increased $91.4 million between 2011 and 2010 from $208.1 million. Sales were adversely impacted by the lack of a 2012 federal budget through the first quarter of 2012 and uncertainty surrounding the defense budget has been reflected in cautious procurement plans of our customers. We believe the most recent budget emphasizes command, control, communications, computers, intelligence, surveillance and reconnaissance and equates to growing electronic content. This is reflected in sequential growth in net sales since our second quarter of 2012. In 2011, sales in this end market were favorably impacted by contributions from the ramping of millimeter wave scan subsystems used in whole-body scanners, missile defense and military RF applications. We also believe that both 2012 and 2011, net sales benefited from increasing international defense sales, enabled in part by our security product offerings, and that Microsemi's dollar content in defense programs will increase as our products move up the value chain. We believe the Department of Defense and Homeland Security budgets for electronic content, an area of Microsemi focus, will continue to expand and contribute to growth in this end market. However, we recognize that the current uncertainty surrounding the U.S. federal budget situation may result in short-term delays in defense programs and potentially moderate growth in the upcoming quarter.
Net sales in the Aerospace end market increased $0.2 million to $212.3 million in 2012 from $212.1 million in 2011 and increased $104.5 million between 2011 and 2010 from $107.6 million. During 2012 and 2011, we noted an increase in demand and order rates for commercial aircraft at aircraft manufacturers and tier one suppliers, growing electronic content in current aircraft, refurbishment programs for older aircraft and demand for the high-reliability radar and avionics solutions we provide. This growth followed a period where this end market was negatively impacted by global economic conditions. Growth in 2012 was offset by a slowdown in satellite billings in the beginning of the year though we have experienced increases in recent satellite order activity, which we believe is a reflection of our product portfolio, especially in system-level products, power management, and programmable logic ICs. Generally space-related applications are in a less economically sensitive market, but due to higher average selling prices and our significant dollar content in satellite applications, this end market can fluctuate on a quarterly basis based on the timing of shipments.
Net sales in the Industrial end market increased $26.4 million to $201.8 million in 2012 from $175.4 million in 2011 and increased $89.2 million between 2011 and 2010 from $86.2 million. The increase in 2012 was due primarily to the contributions of medical products of Microsemi - CMPG, though we noted growth in plasma cutting and welding applications where our high power proficiency differentiates our products. We also noted steady contributions from our products for industrial printing, rail transport and precision GPS products for surveying. The increases in 2011 were driven by contributions from Microsemi – SoC and growth in products for semiconductor capital equipment, an area which experienced substantial declines in 2009 and part of 2010 due to decreased capital spending during the recent economic downturn. While we have lessened our reliance on semiconductor capital equipment applications, we expect cyclicality for products in this end market, as well as overall economic uncertainty to adversely impact this end market in the upcoming quarter.
An estimated breakout of net sales by originating geographic area for 2012, 2011 and 2010 is approximately as follows (amounts in thousands):
2012 2011 2010
United States $ 565,931 $ 508,145 $ 243,822Europe 290,265 132,145 125,209Asia 156,299 195,564 149,237
Total $ 1,012,495 $ 835,854 $ 518,268
Gross profit increased $111.5 million between 2012 and 2011, to $552.6 million (54.6% of sales) for 2012 from $441.2 million (52.8% of sales) for 2011 and increased $193.0 million between 2011 and 2010, from $248.2 million (47.9% of sales) for 2010. The increase in gross profit percentage for 2012 was primarily a result of contributions from the acquisition of Microsemi - CMPG. During the second quarter of 2012, gross profit was adversely affected by $3.2 million from an inventory write-off related to flooding in Thailand, net of insurance recoveries. Gross profit percentage for 2011 was favorably impacted by higher margin products related to Microsemi – SoC, cost optimization programs, transfer of manufacturing to lower cost and more efficient facilities (including the closure of our Scottsdale facility) and reductions in personnel. During the second quarter of 2011, we recorded a charge of $8.4 million for the write-off of bridging inventory that we intended to complete at other

37
locations and $8.2 million for the write-off of medical inventory that did not meet our corporate gross margin targets. We also recorded a charge in the second quarter of 2011 of $5.6 million for Scottsdale remediation and fixed assets that we abandoned as part of our Scottsdale facility closure. In addition, we recorded non-cash purchase accounting expenses of $5.9 million in 2011 related to manufacturing profit in acquired inventory. Gross profit percentage for 2010 was favorably impacted by cost optimization programs, which included the closure of our facility in Colorado, ramp down of our Scottsdale facility, transfer of manufacturing to lower cost and more efficient facilities and reductions in personnel.
Selling, general and administrative expenses increased $24.8 million between 2012 and 2011 to $212.3 million for 2012 from $187.5 million in 2011 and increased $72.9 million between 2011 and 2010 from $114.7 million in 2010. While selling, general and administrative expenses in 2012 were favorably impacted by restructuring and cost control measures, these expenses increased overall primarily due to the incremental costs incurred from acquisitions. We also recorded acquisition related costs of $7.3 million in 2012 and $11.8 million in 2011. In connection with the relocation of one of our facilities during 2012, we received cash consideration of $15.0 million and recorded this consideration in selling, general and administrative costs as an offset to incremental costs incurred for the relocation.
Research and development expense increased $54.4 million between 2012 and 2011 to $168.5 million in 2012 from $114.2 million in 2011 and increased $58.8 million between 2011 and 2010 from $55.4 million in 2010. The increase in 2012 was due to additional product development to support our organic growth and additional research and development activities from our most recent acquisitions. The principal focus of our research and development activities has been to improve processes and to develop new products that support the growth of our businesses. The spending on research and development was principally to develop new higher-margin application-specific products, including, among others, our 65nm process development for next generation programmable products, higher power PoE solutions, the continued roadmap development of our industry-leading timing & synchronization products, our SiGe RF power amplifier solutions for wireless LAN applications, and the ongoing development of GaN and SiC power management and RF solutions.
Amortization of intangible assets increased $42.3 million between 2012 and 2011 to $104.8 million in 2012 from $62.4 million 2011 and increased $42.3 million between 2011 and 2010 from $20.2 million in 2010. These amounts include amortization related to acquired completed technology of $40.6 million for 2012, $29.4 million for 2011 and $12.5 million for 2010. The increases in amortization expense reflect amounts related to recently completed acquisitions.
Restructuring charges amounted to $8.7 million in 2012 compared to $22.1 million in 2011 and $2.1 million in 2010. The variances relate to the timing and announcement of restructuring activities. Of the amount recorded in 2012, $4.4 million related directly to Microsemi - CMPG, which we acquired in the first quarter of 2012, and $1.5 million related to relocation costs for the consolidation of several facilities in Northern California, with the remaining balance related to cost reduction initiatives at other operations. The amount recorded in 2011 included $8.1 million related to Scottsdale lease termination costs and $3.8 million in retention payments agreed to in the Actel acquisition agreement. In addition to these amounts, restructuring expense in 2011 included $14.0 million in severance charges, primarily from Microsemi - SoC, which we acquired in first quarter of 2011. Restructuring charges in 2010 related to costs incurred to optimize our personnel levels.
Interest expense was $39.9 million in 2012, $16.7 million in 2011 and $0.8 million in 2010. The increase was due to an increase in term loan balances to $776.0 million at the end of 2012 compared to $372.2 million at the end of 2011.
Other expense, net, was $33.5 million in 2012 compared to $16.7 million in 2011 and $0.5 million in 2010. We elected the fair value option in accounting for the term loan balance outstanding under our Credit Agreement and changes in fair value of the loan balances are reflected as adjustments to the income statement. In connection with the Credit Agreement, we entered into interest rate swap agreements for the purpose of minimizing the variability of cash flows in the interest rate payments of our variable rate borrowings. In connection with the acquisition of Zarlink, we entered into a foreign currency forward agreement in the fourth quarter of 2011 to minimize our foreign currency risk associated with the transaction that we funded in Canadian Dollars (“CAD”). We reflect the change in fair value of our term loan balances, swaps and forward contract through other income or expense. We recorded expense of $3.3 million related to these adjustments. In addition, upon election of the fair value option, we were required to immediately expense up front debt issuance and refinancing costs that totaled $14.2 million in 2011. Finally, in 2011 we recorded a gain of $2.0 million related to the sale of a facility.
We recorded a provision for income taxes of $15.0 million on pretax loss of $14.7 million in 2012 compared to a benefit for income taxes of $33.7 million on pre-tax income of $22.0 million in 2011. During fiscal year 2012, we generated tax expense of $15.0 million primarily due to the tax provision on profitable entities in foreign jurisdictions and U.S. tax provision relating to deferred tax liabilities that will not provide future sources of income to reduce deferred tax assets. During fiscal year 2011, we generated a tax benefit of $33.7 million primarily due to the release of the entire valuation allowance on our Israeli operations, and due to the release of valuation allowance resulting from the recording of the deferred tax liability related to the acquisitions completed during the year. We had cumulative operating losses for the three years ended in 2012 for our U.S. operations and several foreign operations and accordingly, have reflected a full valuation allowance on our U.S. and such

38
foreign net deferred tax assets as we have determined that it is more likely than not that the tax benefits will not be realized in the future.
During fiscal year 2011 we released the remaining valuation allowance related to our Israel operation, based on evaluation of key positive and negative evidence including the history of substantial losses in past years but cumulative income for the past three year period, and the indefinite carryforward period for the Israeli net operating loss carryforwards which are the principal component of our deferred tax assets in Israel.
During fiscal year 2012 we increased the valuation allowance by $194.7 million, which primarily related to the acquisition of Zarlink during the quarter ended January 1, 2012, and the recording of the deferred tax assets related to the acquisition.
CAPITAL RESOURCES AND LIQUIDITY
We had $204.3 million and $266.6 million in cash and cash equivalents at September 30, 2012 and October 2, 2011, respectively. During 2012, we financed our operations with cash generated from operations. A significant portion of our cash and cash equivalents are domiciled in the United States and we believe that we will be able to meet our future capital and liquidity requirements without significant tax consequences.
Net cash provided by operating activities increased $24.7 million to $171.2 million in 2012 from $146.6 million in 2011. During 2012 and 2011, net cash provided by operating activities was reduced by acquisition-related activities and restructuring activities. During 2012, we made payments of $20.5 million in restructuring and severance payments related primarily to Microsemi - CMPG and $9.2 million in transaction related costs. During 2011, we issued $26.1 million in credits to Microsemi - SoC distributors, paid $17.2 million in acquisition related costs ($10.9 million was accrued in the fourth quarter of fiscal year 2010 or was a liability recorded by Microsemi - SoC at the time of acquisition) and paid $18.2 million in severance and retention bonuses, primarily for Microsemi - SoC.
A summary of net cash provided by operating activities in 2012, 2011 and 2010 is as follows (amounts in thousands):
2012 2011 2010
Net income (loss) $ (29,675) $ 55,730 $ 59,038Depreciation and amortization 136,050 91,482 39,436Provision for doubtful accounts (526) 171 (324)Deferred income taxes (32,569) (19,442) 21,561Valuation allowance on deferred income taxes 43,112 (22,887) (15,616)Stock-based compensation 36,680 28,465 25,277Net change in working capital accounts 38,718 14,153 (20,217)Net change in other long term assets and liabilities (20,567) (1,111) (1,544)
Net cash provided by operating activities $ 171,223 $ 146,561 $ 107,611
Accounts receivable increased $42.3 million to $153.2 million at September 30, 2012 from $110.9 million at October 2, 2011. The increase in accounts receivable was primarily due to higher sales, including incremental sales from operations we acquired in 2012.
Inventories increased $18.2 million to $159.1 million at September 30, 2012 from $140.8 million at October 2, 2011. The increase was due primarily to inventory balances at operations that we acquired in 2012. Days of inventory at the end of 2012 was 128 days compared to 134 days at the end of 2011 reflecting additional inventory management efforts.
Current liabilities increased $2.8 million to $156.5 million at September 30, 2012 from $153.7 million at October 2, 2011. The increase was due primarily to current liability balances at operations we acquired in the current fiscal year and offset by a decrease of $11.7 million related to the settlement of a foreign currency forward, a decrease of $3.1 million in current maturities of long term debt from our term loan balances and timings of payments in the ordinary course of business.
Net cash used in investing activities was $625.9 million in 2012 compared to $460.5 million in 2011 and $82.0 million in 2010. Net cash used in investing activities in 2012 consisted of net cash consideration of $540.2 million and $44.0 million, respectively, for the acquisitions of Zarlink and the timing, synchronization and synthesis business of Maxim Integrated Products, Inc., $49.1 million in purchases of property and equipment and a $1.0 million capital contribution to an investment fund, offset by $4.4 million in proceeds from the sale of an investment, $3.7 million for the settlement of foreign currency forward and $0.3 million in insurance proceeds related to the Thailand flooding. Net cash used in investing activities in 2011 primarily consisted of $436.8 million in net cash consideration for four acquisitions and purchases of property and equipment of $25.8 million, offset by $2.2 million in proceeds for the sale of assets. Net cash used in investing activities in 2010 primarily consisted of $112.4 million in net cash consideration for three acquisitions, purchases of property and equipment of $16.2 million, partially offset by $46.6 million from the disposition of investments in available for sale securities.
39
Net cash provided by (used in) financing activities was $392.4 million in 2012, $380.6 million in 2011 and $(42.4) million in 2010. Net cash provided by financing activities in 2012 primarily consisted of net borrowings of $403.8 million under our credit agreement and $30.4 million in net proceeds from stock awards, offset by $41.8 million in credit facility issuance and refinancing costs. Net cash provided by financing activities in 2011 consisted of net borrowings of $372.1 million under our Credit Agreement and $25.7 million related to proceeds from stock awards, offset by $17.2 million in credit facility issuance and refinancing costs. Net cash used in financing activities in 2010 consisted of $5.2 million related to stock award activity offset by $46.6 million used to repay amounts outstanding under our auction rate securities credit facility.
During the quarter ended April 1, 2012, we entered into Amendment No. 3 to our Credit Agreement (as amended, the “Third Amended and Restated Credit Agreement”). We paid $9.1 million in amendment costs, consisting of a 1% repricing premium and underwriting fees and expenses. In accordance with ASC 470-50, we accounted for the third amendment as a debt modification with respect to amounts that remained in the syndicate and a debt extinguishment with respect to amounts that exited the syndicate. As such, we immediately expensed $1.2 million in financing costs and deferred the remaining $7.9 million, which we will amortize over the six year remaining life of the term loan to interest expense. Pursuant to the Third Amended and Restated Credit Agreement, Morgan Stanley Senior Funding, Inc. has provided $860.0 million in senior secured lien credit facilities, consisting of a term loan facility in an aggregate principal amount of $810.0 million and a revolving credit facility in an aggregate principal amount of $50.0 million.
Under the Third Amended and Restated Credit Agreement, the current applicable margin on revolving loans and swingline loans determined at the Base Rate is 3.00% to 3.75% and revolving loans and swingline loans determined at the Eurodollar Rate is 4.00% to 4.75%, depending on Microsemi's consolidated leverage ratio. For term loans, the current applicable margin on term loans determined at the Base Rate is 2.00% and on term loans determined at the Eurodollar Rate is 3.00%. The “Base Rate” is defined as a rate per annum equal to the greatest of (a) the prime rate, (b) 1/2 of 1% per annum above the federal funds effective rate, (c) the one-month Eurodollar Rate plus 1%, and (d) in the case of any term loans, 2.00%. The “Eurodollar Rate” is defined as (a) the rate per annum offered for deposits of dollars for the applicable interest period that appears on Reuters Screen LIBOR01 Page as of 11:00 A.M., London, England time, two (2) business days prior to the first day of such interest period or (b) if no such offered rate exists, such rate will be the rate of interest per annum as determined by the administrative agent (rounded upwards, if necessary, to the nearest 1/100 of 1%) at which deposits of dollars in immediately available funds are offered at 11:00 A.M., London, England time, two (2) business days prior to the first day in the applicable interest period by major financial institutions reasonably satisfactory to the administrative agent in the London interbank market for such interest period and for an amount equal or comparable to the principal amount of the loans to be borrowed, converted or continued as Eurodollar Rate loans on such date of determination. In the case of term loans, the Eurodollar Rate will not be lower than 1.00%. The principal amount outstanding under our term loan facility is a Eurodollar Rate loan and is subject to an interest rate of 4.00% as of September 30, 2012.
As of September 30, 2012, we had $776.0 million borrowed under the term loan facility and no borrowings under the revolving facility. The amended term loan facility matures in February 2018 with scheduled principal payments of 0.25% of the aggregate initial principal amount or $8.1 million per year. During the quarter ended September 30, 2012, we completed an optional principal prepayment of $30.0 million and in October 2012, we made an additional optional principal prepayment of $25.0 million. While there are currently no scheduled principal repayments on the term loan facility until the maturity date, our credit agreement stipulates an annual payment of a percentage of Excess Cash Flow beginning after 2013. The ECF Percentage is between 0% and 50% depending on our Consolidated Leverage Ratio as of the end of a fiscal year.
Pursuant to the Third Amended and Restated Credit Agreement, Microsemi can request, at any time and from time to time, the establishment of one or more term loan and/or revolving credit facilities with commitments in an aggregate amount not to exceed $200.0 million as of September 30, 2012.
Microsemi expects to pay an undrawn commitment fee ranging from 0.25% to 0.625% depending on Microsemi's consolidated leverage ratio, on the unused portion of the revolving facility. If any letters of credit are issued, then Microsemi expects to pay a fronting fee equal to 0.25% per annum of the aggregate face amount of each letter of credit and a participation fee on all outstanding letters of credit at a per annum rate equal to the margin then in effect with respect to Eurodollar Rate-based loans on the face amount of such letter of credit.
The Amended and Restated Credit Agreement includes financial covenants requiring a maximum leverage ratio and minimum fixed charge coverage ratio and also contains other customary affirmative and negative covenants and events of default. We were in compliance with our financial covenants as of September 30, 2012.
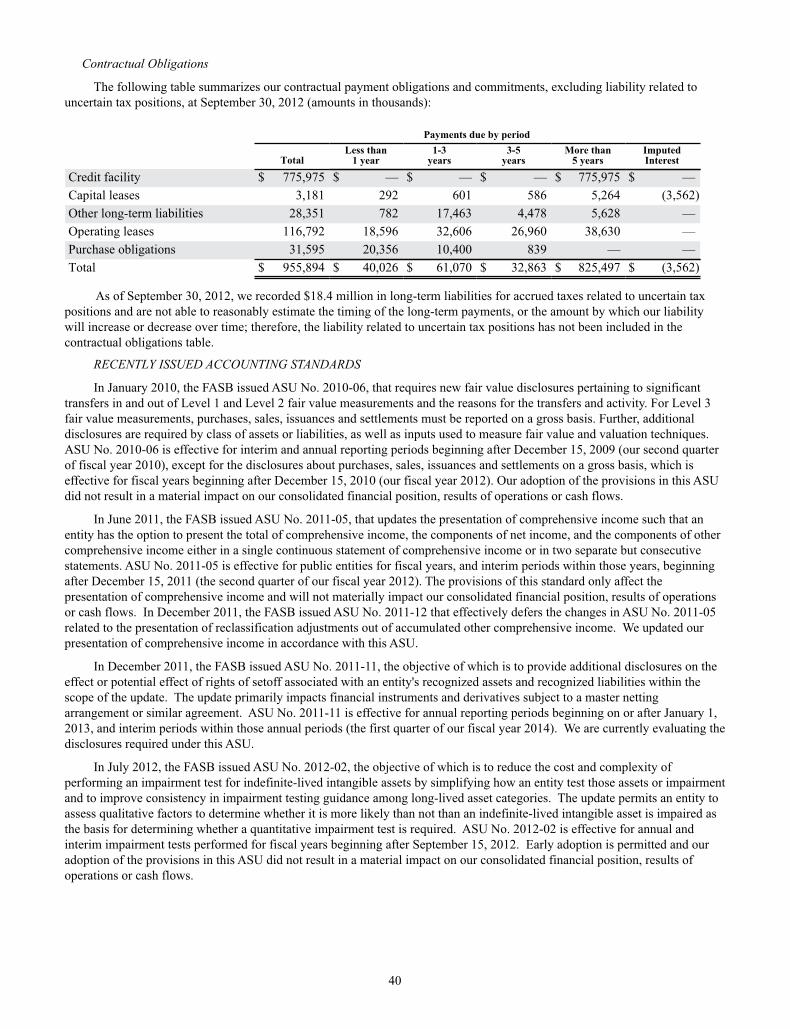
40
Contractual Obligations
The following table summarizes our contractual payment obligations and commitments, excluding liability related to uncertain tax positions, at September 30, 2012 (amounts in thousands):
Payments due by period
TotalLess than
1 year1-3
years3-5
yearsMore than
5 yearsImputedInterest
Credit facility $ 775,975 $ — $ — $ — $ 775,975 $ —Capital leases 3,181 292 601 586 5,264 (3,562)Other long-term liabilities 28,351 782 17,463 4,478 5,628 —Operating leases 116,792 18,596 32,606 26,960 38,630 —Purchase obligations 31,595 20,356 10,400 839 — —Total $ 955,894 $ 40,026 $ 61,070 $ 32,863 $ 825,497 $ (3,562)
As of September 30, 2012, we recorded $18.4 million in long-term liabilities for accrued taxes related to uncertain tax positions and are not able to reasonably estimate the timing of the long-term payments, or the amount by which our liability will increase or decrease over time; therefore, the liability related to uncertain tax positions has not been included in the contractual obligations table.
RECENTLY ISSUED ACCOUNTING STANDARDS
In January 2010, the FASB issued ASU No. 2010-06, that requires new fair value disclosures pertaining to significant transfers in and out of Level 1 and Level 2 fair value measurements and the reasons for the transfers and activity. For Level 3 fair value measurements, purchases, sales, issuances and settlements must be reported on a gross basis. Further, additional disclosures are required by class of assets or liabilities, as well as inputs used to measure fair value and valuation techniques. ASU No. 2010-06 is effective for interim and annual reporting periods beginning after December 15, 2009 (our second quarter of fiscal year 2010), except for the disclosures about purchases, sales, issuances and settlements on a gross basis, which is effective for fiscal years beginning after December 15, 2010 (our fiscal year 2012). Our adoption of the provisions in this ASU did not result in a material impact on our consolidated financial position, results of operations or cash flows.
In June 2011, the FASB issued ASU No. 2011-05, that updates the presentation of comprehensive income such that an entity has the option to present the total of comprehensive income, the components of net income, and the components of other comprehensive income either in a single continuous statement of comprehensive income or in two separate but consecutive statements. ASU No. 2011-05 is effective for public entities for fiscal years, and interim periods within those years, beginning after December 15, 2011 (the second quarter of our fiscal year 2012). The provisions of this standard only affect the presentation of comprehensive income and will not materially impact our consolidated financial position, results of operations or cash flows. In December 2011, the FASB issued ASU No. 2011-12 that effectively defers the changes in ASU No. 2011-05 related to the presentation of reclassification adjustments out of accumulated other comprehensive income. We updated our presentation of comprehensive income in accordance with this ASU.
In December 2011, the FASB issued ASU No. 2011-11, the objective of which is to provide additional disclosures on the effect or potential effect of rights of setoff associated with an entity's recognized assets and recognized liabilities within the scope of the update. The update primarily impacts financial instruments and derivatives subject to a master netting arrangement or similar agreement. ASU No. 2011-11 is effective for annual reporting periods beginning on or after January 1, 2013, and interim periods within those annual periods (the first quarter of our fiscal year 2014). We are currently evaluating the disclosures required under this ASU.
In July 2012, the FASB issued ASU No. 2012-02, the objective of which is to reduce the cost and complexity of performing an impairment test for indefinite-lived intangible assets by simplifying how an entity test those assets or impairment and to improve consistency in impairment testing guidance among long-lived asset categories. The update permits an entity to assess qualitative factors to determine whether it is more likely than not than an indefinite-lived intangible asset is impaired as the basis for determining whether a quantitative impairment test is required. ASU No. 2012-02 is effective for annual and interim impairment tests performed for fiscal years beginning after September 15, 2012. Early adoption is permitted and our adoption of the provisions in this ASU did not result in a material impact on our consolidated financial position, results of operations or cash flows.
41
ITEM 7A. QUANTITATIVE AND QUALITATIVE DISCLOSURES ABOUT MARKET RISK
Market risk is the potential loss arising from adverse changes in credit risk, foreign currency exchange rates, interest rates or the stock market. We are exposed to various market risks, which are related to credit risks, changes in certain foreign currency exchange rates and changes in certain interest rates.
We conduct a relatively small portion of our business in a number of foreign currencies, principally the European Union Euro, British Pound, Israeli Shekel and Chinese RMB. We may receive some revenues in foreign currencies and purchase some inventory and services in foreign currencies. Accordingly, we are exposed to transaction gains and losses that could result from changes in exchange rates of foreign currencies relative to the U.S. dollar. Transactions in foreign currencies have represented a relatively small portion of our business. As a result, foreign currency fluctuations have not had a material impact historically on our revenues or results of operations. However, there can be no assurance that future fluctuations in the value of foreign currencies will not have material adverse effects on our results of operations, cash flows or financial condition. Specific to the acquisition of Zarlink, we entered into a foreign currency forward agreement in the fourth quarter of 2011 to minimize our foreign currency risk associated with the transaction that we funded in Canadian Dollars. We agreed to purchase CAD 623.0 million for $608.2 million that settled in the first quarter of 2012. Other than the foregoing, we have not conducted a foreign currency hedging program thus far. We have considered and may continue to consider the adoption of a foreign currency hedging program.
Concentrations of credit risk exists because we rely on a significant portion of customers whose principal sales are to the U.S. Government. Approximately 28% of total net sales in 2012 were in the Defense & Security end market, with a very significant amount to customers whose principal sales are to the U.S. Government or to subcontractors whose material sales are to the U.S. Government. We, as a subcontractor, sell our products to higher-tier subcontractors or to prime contractors based upon purchase orders that usually do not contain all of the conditions included in the prime contract with the U.S. Government. However, these sales are usually subject to termination and/or price renegotiations by virtue of their reference to a U.S. Government prime contract. Therefore, we believe that all of our product sales that ultimately are sold to the U.S. Government may be subject to termination, at the convenience of the U.S. Government or to price renegotiations under the Renegotiation Act. We have never experienced a material loss due to termination of a U.S Government contract. We have never had to renegotiate our price under any government contract.
We are potentially subject to concentrations of credit risk consisting principally of trade accounts receivable. We attempt to limit our credit risk exposure by performing credit evaluations of our customers and monitoring the aging of invoices. We have one customer that is a distributor of our products, primarily servicing our Defense & Security and aerospace end markets, that accounted for approximately 20% of net sales in 2012, and any disruption with this distributor could have a material adverse effect on our business, financial condition and results of operations.
In addition, net sales from international markets represent a significant portion of total net sales. Our net sales to international customers represented approximately 50% for 2012, 46% for 2011 and 40% for 2010. These sales were principally to customers in Europe and Asia. We maintain reserves for potential credit losses and such losses have been within management’s expectations.
Under the Third Amended and Restated Credit Agreement, the current applicable margin on revolving loans and swingline loans determined at the Base Rate is 3.00% to 3.75% and revolving loans and swingline loans determined at the Eurodollar Rate is 4.00% to 4.75%, depending on Microsemi's consolidated leverage ratio. For term loans, the current applicable margin on term loans determined at the Base Rate is 2.0% and on term loans determined at the Eurodollar Rate is 3.00%. The “Base Rate” is defined as a rate per annum equal to the greatest of (a) the prime rate, (b) 1/2 of 1% per annum above the federal funds effective rate, (c) the one-month Eurodollar Rate plus 1%, and (d) in the case of any term loans, 2.00%. The “Eurodollar Rate” is defined as (a) the rate per annum offered for deposits of dollars for the applicable interest period that appears on Reuters Screen LIBOR01 Page as of 11:00 A.M., London, England time, two (2) business days prior to the first day of such interest period or (b) if no such offered rate exists, such rate will be the rate of interest per annum as determined by the administrative agent (rounded upwards, if necessary, to the nearest 1/100 of 1%) at which deposits of dollars in immediately available funds are offered at 11:00 A.M., London, England time, two (2) business days prior to the first day in the applicable interest period by major financial institutions reasonably satisfactory to the administrative agent in the London interbank market for such interest period and for an amount equal or comparable to the principal amount of the loans to be borrowed, converted or continued as Eurodollar Rate loans on such date of determination. In the case of term loans, the Eurodollar Rate will not be lower than 1.00%. The principal amount outstanding under our term loan facility is a LIBOR-based loan and is subject to an interest rate of 4.00% as of September 30, 2012. A one percent increase in the variable rate of interest on the term loan facility would increase interest expense by approximately $7.8 million annually.

42
In connection with the original Credit Agreement in 2011, we entered into interest rate swap agreements for the purpose of minimizing the variability of cash flows in the interest rate payments of our variable rate borrowings. The cash flows received under the interest rate swap agreements are expected to offset the change in cash flows associated with LIBOR rate borrowings between the effective and maturity dates of the swaps. Our three swap agreements have notional amounts, fixed rates and initial terms as follows: $24.0 million at 1.49% for 2.0 years, $121.0 million at 1.83% for 3.0 years and $24.0 million at 2.21% for 4.0 years. We classify our interest rate swap balances as Level 2 fair value measurements. We determined the fair value of our interest rate swap agreements based on mid-market valuations reported to us by the counterparty to the swap agreements. Related to these interest rate swap agreements, we recorded a long-term liability of $1.9 million as of September 30, 2012 and $2.8 million as of October 2, 2011. We reflect the change in fair value of the swaps through other income (expense), net. We recorded other income (expense) of $0.9 million in 2012 and $(2.8) million in 2011.

43
ITEM 8. FINANCIAL STATEMENTS AND SUPPLEMENTARY DATA
MICROSEMI CORPORATION AND SUBSIDIARIES
Index to Consolidated Financial Statements
Page
1 Consolidated Financial Statements
2 Financial Statement Schedule
Schedule for the fiscal years ended September 30, 2012, October 2, 2011 and October 3, 2010
Financial statement schedules not listed above are either omitted because they are not applicable or therequired information is shown in the consolidated financial statements or in the notes thereto.
Report of Independent Registered Public Accounting Firm 44
Consolidated Balance Sheets at September 30, 2012 and October 2, 2011 45
Consolidated Statements of Operations and Comprehensive Income for each of the three fiscal years in the period ended September 30, 2012 46
Consolidated Statements of Stockholders’ Equity for each of the three fiscal years in the period ended September 30, 2012 47
Consolidated Statements of Cash Flows for each of the three fiscal years in the period endedSeptember 30, 2012 48
Notes to Consolidated Financial Statements 49
II – Valuation and Qualifying Accounts 72

44
Report of Independent Registered Public Accounting Firm
To the Board of Directors andStockholders of Microsemi Corporation:
In our opinion, the consolidated financial statements listed in the accompanying index appearing under Item 8(1) present fairly, in all material respects, the financial position of Microsemi Corporation and its subsidiaries at September 30, 2012 and October 2, 2011 and the results of their operations and their cash flows for each of the three years in the period ended September 30, 2012 in conformity with accounting principles generally accepted in the United States of America. In addition, in our opinion, the financial statement schedule listed in the accompanying index appearing under Item 8(2) presents fairly, in all material respects, the information set forth therein when read in conjunction with the related consolidated financial statements. Also in our opinion, the Company maintained, in all material respects, effective internal control over financial reporting as of September 30, 2012, based on criteria established in Internal Control – Integrated Framework issued by the Committee of Sponsoring Organizations of the Treadway Commission (COSO). The Company’s management is responsible for these financial statements and financial statement schedule, for maintaining effective internal control over financial reporting and for its assessment of the effectiveness of internal control over financial reporting, included in Management’s Report to Stockholders on Internal Control over Financial Reporting. Our responsibility is to express opinions on these financial statements, on the financial statement schedule, and on the Company’s internal control over financial reporting based on our integrated audits. We conducted our audits in accordance with the standards of the Public Company Accounting Oversight Board (United States). Those standards require that we plan and perform the audits to obtain reasonable assurance about whether the financial statements are free of material misstatement and whether effective internal control over financial reporting was maintained in all material respects. Our audits of the financial statements included examining, on a test basis, evidence supporting the amounts and disclosures in the financial statements, assessing the accounting principles used and significant estimates made by management, and evaluating the overall financial statement presentation. Our audit of internal control over financial reporting included obtaining an understanding of internal control over financial reporting, assessing the risk that a material weakness exists, and testing and evaluating the design and operating effectiveness of internal control based on the assessed risk. Our audits also included performing such other procedures as we considered necessary in the circumstances. We believe that our audits provide a reasonable basis for our opinions.
A company’s internal control over financial reporting is a process designed to provide reasonable assurance regarding the reliability of financial reporting and the preparation of financial statements for external purposes in accordance with generally accepted accounting principles. A company’s internal control over financial reporting includes those policies and procedures that (i) pertain to the maintenance of records that, in reasonable detail, accurately and fairly reflect the transactions and dispositions of the assets of the company; (ii) provide reasonable assurance that transactions are recorded as necessary to permit preparation of financial statements in accordance with generally accepted accounting principles, and that receipts and expenditures of the company are being made only in accordance with authorizations of management and directors of the company; and (iii) provide reasonable assurance regarding prevention or timely detection of unauthorized acquisition, use, or disposition of the company’s assets that could have a material effect on the financial statements.
Because of its inherent limitations, internal control over financial reporting may not prevent or detect misstatements. Also, projections of any evaluation of effectiveness to future periods are subject to the risk that controls may become inadequate because of changes in conditions, or that the degree of compliance with the policies or procedures may deteriorate.
/s/ PricewaterhouseCoopers LLPIrvine, CaliforniaNovember 20, 2012

45
MICROSEMI CORPORATION AND SUBSIDIARIES CONSOLIDATED BALANCE SHEETS
(amounts in thousands, except per share data)
September 30,2012
October 2,2011
ASSETSCurrent assets:
Cash and cash equivalents $ 204,335 $ 266,631Accounts receivable, net of allowance for doubtful accounts of $1,623 at September30, 2012 and $2,149 at October 2, 2011 153,190 110,908Inventories, net 159,055 140,827Deferred income taxes, net 20,361 43,424Other current assets 24,400 16,100
Total current assets 561,341 577,890Property and equipment, net 116,146 89,922Goodwill 790,236 491,079Intangible assets, net 399,991 281,689Deferred income taxes, net 33,066 12,000Other assets 33,850 29,893
TOTAL ASSETS $ 1,934,630 $ 1,482,473LIABILITIES AND STOCKHOLDERS’ EQUITY
Current liabilities:Accounts payable $ 75,351 $ 48,561Accrued liabilities 80,224 101,078Current maturity of long-term liabilities 903 4,050
Total current liabilities 156,478 153,689Credit facility 775,975 357,384Deferred income taxes 25,135 46,285Other long-term liabilities 49,056 33,008Commitments and contingencies (Note 12)Stockholders’ equity:
Preferred stock, $1.00 par value; authorized 1,000 shares; none issued — —Common stock, $0.20 par value; 250,000 authorized, 90,282 issued and outstanding atSeptember 30, 2012 and 86,806 issued and outstanding at October 2, 2011 18,056 17,361Capital in excess of par value of common stock 678,905 612,517Retained earnings 231,768 261,443Accumulated other comprehensive income (loss) (743) 786
Total stockholders’ equity 927,986 892,107TOTAL LIABILITIES AND STOCKHOLDERS’ EQUITY $ 1,934,630 $ 1,482,473
The accompanying notes are an integral part of these statements.

46
MICROSEMI CORPORATION AND SUBSIDIARIES CONSOLIDATED STATEMENTS OF OPERATIONS AND COMPREHENSIVE INCOME
For each of the three fiscal years in the period ended September 30, 2012 (amounts in thousands, except earnings per share)
2012 2011 2010
Net sales $ 1,012,495 $ 835,854 $ 518,268Cost of sales 459,872 394,683 270,057
Gross profit 552,623 441,171 248,211Operating expenses:
Selling, general and administrative 212,338 187,529 114,663Research and development costs 168,516 114,155 55,395Amortization of intangible assets 104,756 62,425 20,165Restructuring and severance charges 8,666 22,081 2,107
Total operating expenses 494,276 386,190 192,330Operating income 58,347 54,981 55,881
Other income (expenses):Interest expense (39,861) (16,654) (756)Interest income 308 383 432Other, net (33,519) (16,661) (526)
Total other expense (73,072) (32,932) (850)Income (loss) before income taxes (14,725) 22,049 55,031Provision (benefit) for income taxes 14,950 (33,681) (4,007)
Net income (loss) $ (29,675) $ 55,730 $ 59,038Earnings (loss) per share:
Basic $ (0.35) $ 0.66 $ 0.73Diluted $ (0.35) $ 0.65 $ 0.72
Weighted-average common shares outstanding:Basic 85,837 83,916 80,797Diluted 85,837 85,747 81,541
Net income (loss) $ (29,675) $ 55,730 $ 59,038Other comprehensive income, net of tax:
Translation adjustment, net of tax (373) 332 (78)Unrealized actuarial loss on pension benefits, net of tax (1,156) — —
Other comprehensive income (loss) (1,529) 332 (78)
Total comprehensive income (loss) $ (31,204) $ 56,062 $ 58,960
The accompanying notes are an integral part of these statements.

47
MICROSEMI CORPORATION AND SUBSIDIARIES CONSOLIDATED STATEMENTS OF STOCKHOLDERS’ EQUITY
For each of the three fiscal years in the period ended September 30, 2012 (amounts in thousands)
Common Stock
Capital inExcess of
Par value ofCommon
StockRetainedEarnings
AccumulatedOther
ComprehensiveIncome TotalShares Amount
Balance at September 27, 2009 81,413 $ 16,282 $ 512,862 $ 146,675 $ 532 $ 676,351Proceeds from exercise of stock options 464 93 4,714 — — 4,807Grants and cancellations of restricted share awards 1,363 273 (273) — — —Issuance of stock awards related to acquisition — — 161 — — 161Tax benefit – stock-based compensation — — 730 — — 730Stock-based compensation — — 25,434 — — 25,434Translation adjustment — — — — (78) (78)Net income — — — 59,038 — 59,038Balance at October 3, 2010 83,240 $ 16,648 $ 543,628 $ 205,713 $ 454 $ 766,443Proceeds from exercise of stock options 2,089 418 26,790 — — 27,208Tax withholding on restricted stock units — — (1,538) — — (1,538)Grants and cancellations of restricted share awards 1,477 295 (295) — — —Issuance of stock awards related to acquisition — — 15,293 — — 15,293Stock-based compensation — — 28,639 — — 28,639Translation adjustment — — — — 332 332Net income — — — 55,730 — 55,730Balance at October 2, 2011 86,806 $ 17,361 $ 612,517 $ 261,443 $ 786 $ 892,107Proceeds from exercise of stock options 1,902 380 30,831 — — 31,211Tax withholding on restricted stock units — — (808) — — (808)Grants and cancellations of restricted share awards 1,574 315 (315) — — —Stock-based compensation — — 36,680 — — 36,680Translation adjustment — — — — (373) (373)Unrealized actuarial loss on pension benefits — — — — (1,156) (1,156)Net loss — — — (29,675) — (29,675)Balance at September 30, 2012 90,282 $ 18,056 $ 678,905 $ 231,768 $ (743) $ 927,986
The accompanying notes are an integral part of these statements.

48
MICROSEMI CORPORATION AND SUBSIDIARIESCONSOLIDATED STATEMENTS OF CASH FLOWS
For each of the three fiscal years in the period ended September 30, 2012(amounts in thousands)
2012 2011 2010
Cash flows from operating activities:Net income (loss) $ (29,675) $ 55,730 $ 59,038Adjustments to reconcile net income to net cash provided by operating activities:
Depreciation and amortization 136,050 91,482 39,436Provision for doubtful accounts (526) 171 (324)Amortization of deferred financing cost 2,215 — —Settlement of foreign currency forward (3,701) — —Loss on disposition or impairment of assets 1,935 — —Deferred income taxes (32,569) (19,442) 21,561Valuation allowance on net deferred income taxes 43,112 (22,887) (15,616)Charge for stock based compensation 36,680 28,465 25,277Effect of fair value option on credit facility issuance and refinancing costs 32,275 14,218 —Change in assets and liabilities (net of acquisitions and disposition):
Accounts receivable (23,776) 9,692 (8,068)Inventories 12,916 14,968 (20,295)Other current assets 27,355 3,697 (1,669)Other assets 11,799 6,201 1,320Accounts payable 16,017 2,354 15,153Accrued liabilities (37,355) (16,603) (6,658)Other long-term liabilities (21,529) (21,485) (1,544)
Net cash provided by operating activities 171,223 146,561 107,611Cash flows from investing activities:Purchases of property and equipment (49,079) (25,826) (16,224)Proceeds from sale of available for sale securities — — 46,550Proceeds from the divestiture or sale of assets 325 2,157 —Proceeds from the sale of investment 4,352 — —Settlement of foreign currency forward 3,701 — —Payments for acquisitions, net of cash acquired (585,218) (436,849) (112,370)
Net cash used in investing activities (625,919) (460,518) (82,044)Cash flows from financing activities:Repayments of auction rate securities credit facility — — (46,550)Repayments of credit facility (85,625) (52,814) —Credit facility issuance costs (41,790) (17,218) —Proceeds from credit facility 959,708 425,000 —Extinguishment of debt (470,296) — (981)Excess tax benefit from stock awards — — 365Net proceeds from stock awards 30,403 25,670 4,807
Net cash (used in) provided by financing activities 392,400 380,638 (42,359)Net increase (decrease) in cash and cash equivalents (62,296) 66,681 (16,792)Cash and cash equivalents at beginning of year 266,631 199,950 216,742Cash and cash equivalents at end of year $ 204,335 $ 266,631 $ 199,950Supplemental disclosure of cash flow informationCash paid during the year for:
Interest $ 42,178 $ 12,625 $ 790Income taxes $ 4,407 $ 6,553 $ 8,398
The accompanying notes are an integral part of these statements.

49
MICROSEMI CORPORATION AND SUBSIDIARIES NOTES TO CONSOLIDATED FINANCIAL STATEMENTS
1. DESCRIPTION OF BUSINESS AND SUMMARY OF SIGNIFICANT ACCOUNTING POLICIES
Description of Business
We are a leading designer, manufacturer and marketer of high performance analog and mixed-signal integrated circuits and high-reliability semiconductors. Our semiconductors manage and control or regulate power, protect against transient voltage spikes and transmit, receive and amplify signals.
Our products include individual components as well as integrated circuit solutions that enhance customer designs by reducing size, protecting circuits, improving performance, reliability, and battery optimization. The principal markets we serve include Defense & Security, Aerospace, Enterprise & Communication and Industrial & Alternative Energy.
During 2010, we acquired White Electronic Designs Corporation (“White Electronic”), a defense electronics manufacturer and supplier that designs, develops and manufactures innovative electronic components and systems for inclusion in high technology products for the defense and aerospace markets. We also acquired substantially all the assets of VT Silicon, a designer and manufacturer of multi-band radio frequency integrated circuit (“RFIC”) solutions for the mobile wireless broadband market and all the shares of Arxan Defense Systems, Inc., a leading provider of anti-tamper solutions, providing full-service support to defense clients in securing systems against tampering, piracy and reverse engineering.
During 2011, we acquired Actel Corporation (“Actel”), a leading supplier of low-power FPGAs, mixed-signal FPGAs, and system-critical FPGAs. We sometimes refer to this division herein as Microsemi – SoC. We also acquired AML Communications, Inc., a designer, manufacturer, and marketer of microelectronic assemblies for the defense industry, Asic Advantage, Inc. (“Asic Advantage”), a fabless semiconductor company that designs and manufactures a broad portfolio of high-performance, high-voltage and radiation-hardened mixed-signal integrated circuit solutions for the aerospace, automotive, communications, industrial and medical markets and substantially all the assets of Brijot Imaging Systems, Inc. (“Brijot”) and its passive millimeter wave imaging solutions technology.
During 2012, we acquired Zarlink Semiconductor, Inc. ("Zarlink") for its world-leading, mixed-signal chip technologies for a broad range of communication and medical applications. We also acquired the timing, synchronization and synthesis business of Maxim Integrated Products, Inc. and integrated the operations of this business with Zarlink.
Fiscal Year
We report results of operations on the basis of fifty-two and fifty-three week periods. The fiscal year ended on September 30, 2012 and the fiscal year ended on October 2, 2011 consisted of fifty-two weeks, and the fiscal year ended on October 3, 2010 consisted of fifty-three weeks. In referencing a year, we are referring to the fiscal year ended on the Sunday closest to September 30.
Principles of Consolidation and Presentation of Financial Information
The consolidated financial statements include the accounts of Microsemi and our subsidiaries. All intercompany transactions and balances have been eliminated.
Use of Estimates
The preparation of financial statements in conformity with generally accepted accounting principles requires management to make estimates and assumptions that affect the reported amounts of assets and liabilities and disclosures of contingent assets and liabilities at the date of the financial statements and the reported amounts of revenues and expenses during the respective reporting periods. Actual results could differ from those estimates.
Measurement Period for the Acquisition of Actel Corporation
During the first quarter of 2012, we closed the measurement period for the acquisition of Actel Corporation that occurred in the prior year first quarter. We completed our evaluation of income tax-related information regarding facts and circumstances that existed as of the acquisition date. In accordance with ASC 805-10, we retrospectively adjusted the preliminary amounts previously reported and are now reporting the final amounts. In the financial statements as of, and for the year ended, October 2, 2011, we have reflected a retrospective adjustment of $1.3 million that increased non-current deferred tax assets and retained earnings and decreased income tax expense.
Cash and Cash Equivalents
We consider all short-term, highly liquid investments with maturities of three months or less at date of acquisition to be cash equivalents.

50
Accounts receivable and allowance for doubtful accounts
Trade accounts receivable are recorded at the invoiced amount and do not bear interest. The accounts receivable amount shown in the balance sheet are trade accounts receivable balances at the respective dates, net of allowance for doubtful accounts. The allowance for doubtful accounts is our best estimate of the amount of probable credit losses in our existing accounts receivable. We determine the allowance based in part on our historical write-off experience and specific review of account balances due. Past due balances are reviewed individually for collectability. All other balances are reviewed on a pooled basis by type of receivable. Account balances are charged off against the allowance when we determine that it is probable the receivable will not be recovered. We review our allowance for doubtful accounts quarterly. We do not have any off-balance-sheet credit exposure related to our customers. To date, our allowance for doubtful accounts has generally been within management’s estimates.
Inventories
Inventories are stated at the lower of cost, as determined using the first-in, first-out (“FIFO”) method, or market. Costs include materials, labor and manufacturing overhead. We evaluate the carrying value of our inventories taking into account such factors as historical and anticipated future sales compared with quantities on hand and the price we expect to obtain for our products in their respective markets. We also evaluate the composition of our inventories to identify any slow-moving or obsolete products. Additionally, inventory write-downs are made based upon such judgments for any inventories that are identified as having a net realizable value less than their cost, which is further reduced by related selling expenses. The net realizable value of our inventories for ongoing operations has generally been within management’s estimates. We have recorded inventory write-downs for discontinued product lines that did not meet gross margin targets, products that are being migrated to newer generations, products that service the large capital spending end markets for which demand has declined, products related to facility closures and losses related to flooding of a facility in Thailand.
Fair Value of Financial Assets and Liabilities
Accounting Standards Codification (“ASC”) 825 permits entities to elect the fair value option for certain financial assets and financial liabilities. For financial assets or financial liabilities for which an entity elects the fair value option, ASC 825 requires that the entity record the financial asset or financial liability at fair value rather than at historical cost with changes in fair value recorded in the income statement. ASC 825-25 requires that upfront costs and fees related to items for which the fair value option is elected shall be recognized in earnings as incurred and not deferred. As further discussed in Note 8, we elected the fair value option in accounting for the term loan balance outstanding as of October 2, 2011. Following the extinguishment of the term loan in conjunction with our acquisition of Zarlink, we did not elect the fair value option and are reporting new term loan balances subsequent to October 2, 2011, at par value.
Fair value is defined as the exchange price that would be received for an asset or paid to transfer a liability in the principal or most advantageous market for the asset or liability in an orderly transaction between market participants on the measurement date. ASC 820 establishes a hierarchy for ranking the quality and reliability of the information used to determine fair values and includes the following classifications:
Level 1: Quoted market prices in active markets for identical assets or liabilities.Level 2: Observable market based inputs or unobservable inputs that are corroborated by market data.Level 3: Unobservable inputs that are not corroborated by market data.

51
The following financial assets and liabilities were measured at fair value on a recurring basis using the type of inputs shown:
Fair Value Measurements Using:Total Level 1 Inputs Level 2 Inputs Level 3 Inputs
October 2, 2011Cash and cash equivalents $ 266,631 $ 266,631 $ — $ —Interest rate swap liabilities $ 2,808 $ — $ 2,808 $ —Foreign currency forward liability $ 11,675 $ — $ 11,675 $ —Term loan liability $ 361,022 $ — $ 361,022 $ —
September 30, 2012Cash and cash equivalents $ 204,335 $ 204,335 $ — —Pension plan assets $ 5,382 $ — $ — $ 5,382Interest rate swap liabilities $ 1,950 $ — $ 1,950 $ —
There were no transfers of financial assets or liabilities between the classifications during 2012 or 2011.
Property and Equipment
Property and equipment are stated at lower of cost or realizable values. Depreciation is computed on the straight-line method over the estimated useful lives of the assets. Leasehold improvements are amortized over the shorter of the lease terms or the estimated useful lives. Maintenance and repairs are charged to expense as incurred and the costs of additions and betterments that increase the useful lives of the assets are capitalized.
Long-Lived Assets
We assess the impairment of long-lived assets whenever events or changes in circumstances indicate that their carrying value may not be recoverable from the undiscounted estimated future cash flows expected to result from their use.
We are required to make judgments and assumptions in identifying those events or changes in circumstances that may trigger impairment. Some of the factors we consider include:
• Significant decrease in the market value of an asset.
• Significant changes in the extent or manner for which the asset is being used or in its physical condition including manufacturing plant closures.
• A significant change, delay or departure in our business strategy related to the asset.
• Significant negative changes in the business climate, industry or economic conditions.
• Current period operating losses or negative cash flow combined with a history of similar losses or a forecast that indicates continuing losses associated with the use of an asset.
If events or circumstances indicate that the carrying amount of a long-lived asset or asset group may not be recoverable and the expected undiscounted future cash flows attributable to the asset group are less than the carrying value, an impairment loss equal to the excess of the carrying value of the assets within the asset group over their fair value is recorded. The appropriate asset group is determined based on the lowest level of largely independent cash inflows and outflows for the related assets. Depending on the nature of the primary assets in the asset group, fair value is estimated using one of several approaches including replacement cost, appraised values, market quotes or estimated expected future cash flows using a discount rate commensurate with the risk involved. During 2009, we recorded a held for sale impairment of $1.7 million related to the real estate and building for our closed manufacturing facility in Broomfield, Colorado and a held and used impairment of $4.5 million for the closure of our manufacturing facility in Scottsdale, Arizona to reflect our long-lived assets at their lower fair value. Future impairments may be required if we close other manufacturing sites.

52
Goodwill and Intangible Assets
We account for goodwill on an impairment-only approach and amortize intangible assets with definite useful lives over the benefit period, which approximates straight-line expense over the respective useful lives. We assess qualitative factors to determine whether it is more likely than not that an indefinite-lived intangible asset such as goodwill is impaired as the basis for determining whether a quantitative impairment test is required. We assess definite-lived intangible assets for impairment whenever events or changes in circumstances indicate that the carrying value of an asset may not be fully recoverable. Whenever we determine that there has been an impairment of goodwill or other intangible assets with indefinite lives, we will record an impairment charge against earnings. We operate as one reporting unit and an impairment charge would equal the excess of the carrying value of goodwill in our one reporting unit over its then fair value. The identification of intangible assets and determination of the fair value and useful lives are subjective in nature and often involve the use of significant estimates and assumptions. The judgments made in determining the estimated useful lives assigned to each class of assets can significantly affect net income. We completed our most recent quantitative analysis during the fourth quarter of 2012 and noted that the estimated fair value of our reporting unit substantially exceeded its carrying value and no qualitative factors existed during the fiscal year to indicate that it was more likely than not that the fair value of the reporting unit is less than its carrying amount.
Revenue Recognition, Sales Returns and Allowances
We primarily recognize revenue from customers, including distributors, when title and risk of loss have passed to the customer provided that: 1) evidence of an arrangement exists; 2) delivery has occurred; 3) the fee is fixed or determinable; and 4) collectability is reasonably assured. For substantially all sales, revenue is recognized at the time the product is shipped.
We enter into contracts with certain distributors, and these contracts may permit limited stock rotation returns. We provide an estimated allowance for such returns, and corresponding reductions in revenue are concurrently recorded, based on several factors including past history and notification from customers of pending returns. Actual returns have been within management’s expectations. Estimated reductions to revenue are also recorded for customer incentive programs consisting of price protection and volume purchase rebates. Such programs are limited and actual reductions to revenue have been within management’s expectations.
We also derive a portion of our revenue from fixed-price contracts. Revenue for these contracts are recorded under a percentage of completion method, which is based on the ratio of total costs incurred to date to estimated total costs at completion. Gross profit expected to be realized on fixed-price contracts are based on periodic estimates of total revenues and costs for each contract. Losses on contracts are accrued when estimated total costs exceed total revenues. Occasionally, we will enter into contracts on a cost plus fee basis. We recognize revenue based on reimbursements for actual expenses plus the contractually agreed upon fee with the customer.
Research and Development
We expense the cost of research and development as incurred. Research and development expenses principally comprise payroll and related costs, supplies, and the cost of prototypes.
Restructuring Charges
We recognize a liability for restructuring costs when the liability is incurred. The restructuring accruals are based upon management estimates at the time they are recorded and can change depending upon changes in facts and circumstances subsequent to the date the original liability is recorded. The main components of our restructuring charges are workforce reductions and elimination of excess facilities. Workforce-related charges are accrued when it is determined that a liability exists, which is generally when individuals have been notified of their expected termination dates and expected severance payments or when formal severance plans exist, when the severance payments are probable and reasonably estimable. The elimination of excess facilities results in charges for lease termination fees, future contractual commitments to pay lease charges net of estimated sublease income, facility remediation costs and moving costs to remove property and equipment from the facilities. We recognize charges for elimination of excess facilities when we have vacated the premises or ceased use of the facility.
Stock-Based Compensation
Compensation expense for stock options and stock appreciation rights was calculated based on the grant or assumption date using the Black-Scholes pricing model. All stock appreciation rights we have granted or assumed are stock-settled. Stock options and stock appreciation rights are granted at exercise prices equal to the closing price of our common stock on the date of grant. Assumed stock options and stock appreciation rights are granted at exercise prices determined in accordance with

53
the acquisition agreement. Expected life was estimated based on historical exercise data that was stratified between members of the Board of Directors, executive employees and all other recipients. Expected volatility was estimated based on historical volatility using equally weighted daily price observations over a period approximately equal to the expected life of each option. The risk free interest rate is based on the implied yield currently available on U.S. Treasury securities with an equivalent remaining term. No dividends are expected to be paid.
Compensation expense for restricted stock awards was calculated based on the closing price of our common stock on the date of grant. Restricted stock awards are subject to forfeiture if a participant does not meet length of service requirements.
Performance stock units are subject to performance-based vesting requirements and generally vest based on the Company's growth in net sales and earnings per share (subject to certain adjustments) for fiscal years 2012 and 2013 in comparison with the growth in net sales and adjusted earnings per share over the same period for a peer group selected by the Compensation Committee. Compensation expense is based upon our estimate of performance relative to the peer group.
Accounting For Income Taxes
We account for income taxes under the asset and liability method, whereby deferred tax assets and liabilities are recognized for the future tax consequences attributable to differences between the financial statement carrying amounts of existing assets and liabilities and their respective tax bases. Deferred tax assets and liabilities are measured using enacted tax rates expected to apply in the years in which those temporary differences are expected to be recovered or settled. The effect on deferred tax assets and liabilities of a change in tax rates is recognized in income in the period that includes the enactment date. We evaluate the need to establish a valuation allowance for deferred tax assets based upon the amount of existing temporary differences, the period in which they are expected to be recovered and expected levels of taxable income. A valuation allowance to reduce deferred tax assets is established when it is more likely than not that some or all of the deferred tax assets will not be realized. We recognize uncertain tax positions when they meet a more-likely-than-not threshold. We recognize potential accrued interest and penalties related to unrecognized tax benefits within operations as income tax expense.
We file U.S. federal, state, and foreign income tax returns in jurisdictions with varying statutes of limitations. Fiscal years 2007 to 2012 generally remain subject to examination by federal and most state tax authorities. In significant foreign jurisdictions, the 2009 to 2012 tax years generally remain subject to examination by tax authorities. We establish liabilities for possible assessments by tax authorities resulting from known tax exposures including, but not limited to, international tax issues and certain tax credits. We are currently undergoing an Internal Revenue Service examination as well as certain state examinations. There have been no significant proposed adjustments to date. We do not believe the results of any audits would have a material impact on our financial position, results of operations or cash flows.
Segment Information
We use the management approach for segment disclosure, which designates the internal organization that is used by management for making operating decisions and assessing performance as the source of our reportable segments. We manage our business on the basis of one reportable segment, as a manufacturer of semiconductors in different geographic areas, including the United States, Europe and Asia.
Foreign Currency
Our subsidiaries outside the United States typically use the United States Dollar (“USD”) as their functional currency with the exception of a subsidiary in China that uses the Chinese RMB as its functional currency. For subsidiaries that use USD as the functional currency, assets and liabilities are remeasured to USD at the exchange rate in effect at the balance sheet date except for non-monetary assets and capital accounts which are measured at historical rates; revenues, expenses, gains and losses are remeasured at rates of exchange that approximate the rates in effect at the transaction date. For subsidiaries that use the local currency as the functional currency, all assets and liabilities are remeasured to USD using exchange rates in effect at the end of the period. Resulting translation gains or losses are recognized as a component of other comprehensive income. We also conduct a relatively small portion of our business in a number of foreign currencies, principally the European Union Euro, Canadian Dollar, British Pound, Israeli Shekel and Chinese RMB.
Earnings Per Share
Basic earnings per share have been computed based upon the weighted-average number of common shares outstanding during the respective periods. Diluted earnings per share have been computed, when the result is dilutive, using the treasury stock method for stock awards outstanding during the respective periods. Earnings per share for 2012, 2011 and 2010 were calculated as follows (amounts in thousands, except per share data):

54
Fiscal Years 2012 2011 2010
BASICNet income (loss) $ (29,675) $ 55,730 $ 59,038Weighted-average common shares outstanding 85,837 83,916 80,797Basic earnings (loss) per share $ (0.35) $ 0.66 $ 0.73
DILUTEDNet income (loss) $ (29,675) $ 55,730 $ 59,038Weighted-average common shares outstanding for basic 85,837 83,916 80,797Dilutive effect of stock awards — 1,831 744Weighted-average common shares outstanding on a diluted basis 85,837 85,747 81,541Diluted earnings (loss) per share $ (0.35) $ 0.65 $ 0.72
For 2012, 2011 and 2010, 5.1 million, 7.3 million and 7.4 million awards, respectively, were excluded in the computation of diluted EPS as these stock awards would have been anti-dilutive.
Out of Period Adjustments
During 2012, we identified several principally tax adjustments aggregating to $0.8 million to decrease our net income in 2012 for errors that originated in fiscal years 2011, 2010 and 2009. We assessed the materiality of these errors on our current and prior period financial statements in accordance with SEC Staff Accounting Bulletins ("SAB") No. 99 and SAB No. 108 and concluded the errors were not material to our consolidated financial statements for the current or prior annual or interim periods. The out-of-period adjustments impacted basic and diluted net income by less than $0.01 per share for fiscal year 2012. The largest of these out-of-period adjustments was recorded in the third quarter of 2012, which increased our income tax provision and reduced our net income for that quarter by $1.5 million or $0.02 per basic and diluted share.
Revision to Prior Year Consolidated Statement of Cash Flows
During 2012, we have revised our consolidated statement of cash flows to correct for an error in our 2011 presentation of excess tax benefits on stock awards. The correction resulted in an increase in cash flows from operating activities in 2011 of $7.4 million and a corresponding decrease in cash flows from financing activities for the same amount. This correction revises previously reported cash flows from operations from $139.2 million to $146.6 million and revises previously reported cash flows from financing activities from $388.0 million to $380.6 million. The revision had no impact on our total cash flows or cash and cash equivalents.
Reclassifications
Certain prior year amounts have been reclassified to conform to current year presentation.
Concentration of Credit Risk and International Sales
Concentrations of credit risk exist because we rely on a significant portion of customers whose principal sales are to the U.S. Government. Approximately 28% of total net sales in 2012 were in the Defense & Security end market, with a very significant amount to customers whose principal sales are to the U.S. Government or to subcontractors whose material sales are to the U.S. Government. We, as a subcontractor, sell our products to higher-tier subcontractors or to prime contractors based upon purchase orders that usually do not contain all of the conditions included in the prime contract with the U.S. Government. However, these sales are usually subject to termination and/or price renegotiations by virtue of their reference to a U.S. Government prime contract. Therefore, we believe that all of our product sales that ultimately are sold to the U.S. Government may be subject to termination, at the convenience of the U.S. Government or to price renegotiations under the Renegotiation Act. We have never experienced a material loss due to termination of a U.S Government contract. We have never had to renegotiate our price under any government contract.
We are potentially subject to concentrations of credit risk consisting principally of trade accounts receivable. We attempt to limit our credit risk exposure by performing credit evaluations of our customers and monitoring the aging of invoices. We have one customer that is a distributor of our products, primarily servicing our Defense & Security and Aerospace end markets, that accounted for approximately 20% of net sales in 2012. Any disruption with this distributor could have a material adverse effect on our business, financial condition and results of operations.

55
In addition, net sales from international markets represent a significant portion of total net sales. Our net sales to international customers represented approximately 50% for 2012, 46% for 2011 and 40% for 2010. These sales were principally to customers in Europe and Asia. We maintain reserves for potential credit losses and such losses have been within management’s expectations.
RECENTLY ISSUED ACCOUNTING STANDARDS
In January 2010, the FASB issued ASU No. 2010-06, that requires new fair value disclosures pertaining to significant transfers in and out of Level 1 and Level 2 fair value measurements and the reasons for the transfers and activity. For Level 3 fair value measurements, purchases, sales, issuances and settlements must be reported on a gross basis. Further, additional disclosures are required by class of assets or liabilities, as well as inputs used to measure fair value and valuation techniques. ASU No. 2010-06 is effective for interim and annual reporting periods beginning after December 15, 2009 (our second quarter of fiscal year 2010), except for the disclosures about purchases, sales, issuances and settlements on a gross basis, which is effective for fiscal years beginning after December 15, 2010 (our fiscal year 2012). Our adoption of the provisions in this ASU did not result in a material impact on our consolidated financial position, results of operations or cash flows.
In June 2011, the FASB issued ASU No. 2011-05, that updates the presentation of comprehensive income such that an entity has the option to present the total of comprehensive income, the components of net income, and the components of other comprehensive income either in a single continuous statement of comprehensive income or in two separate but consecutive statements. ASU No. 2011-05 is effective for public entities for fiscal years, and interim periods within those years, beginning after December 15, 2011 (the second quarter of our fiscal year 2012). The provisions of this standard only affect the presentation of comprehensive income and will not materially impact our consolidated financial position, results of operations or cash flows. In December 2011, the FASB issued ASU No. 2011-12 that effectively defers the changes in ASU No. 2011-05 related to the presentation of reclassification adjustments out of accumulated other comprehensive income. We updated our presentation of comprehensive income in accordance with this ASU.
In December 2011, the FASB issued ASU No. 2011-11, the objective of which is to provide additional disclosures on the effect or potential effect of rights of setoff associated with an entity's recognized assets and recognized liabilities within the scope of the update. The update primarily impacts financial instruments and derivatives subject to a master netting arrangement or similar agreement. ASU No. 2011-11 is effective for annual reporting periods beginning on or after January 1, 2013, and interim periods within those annual periods (the first quarter of our fiscal year 2014). We are currently evaluating the disclosures required under this ASU.
In July 2012, the FASB issued ASU No. 2012-02, the objective of which is to reduce the cost and complexity of performing an impairment test for indefinite-lived intangible assets by simplifying how an entity test those assets or impairment and to improve consistency in impairment testing guidance among long-lived asset categories. The update permits an entity to assess qualitative factors to determine whether it is more likely than not that an indefinite-lived intangible asset is impaired as the basis for determining whether a quantitative impairment test is required. ASU No. 2012-02 is effective for annual and interim impairment tests performed for fiscal years beginning after September 15, 2012. Early adoption is permitted and our adoption of the provisions in this ASU did not result in a material impact on our consolidated financial position, results of operations or cash flows.
2. ACQUISITIONS
Zarlink Semiconductor, Inc.
During October 2011, we completed our acquisition of Zarlink through a wholly-owned subsidiary. Following the expiration of the previously announced offers for all of the issued and outstanding common shares (“Zarlink Shares”) and 6% unsecured, subordinated convertible debentures maturing September 30, 2012 (“Zarlink Debentures” and together with the Zarlink Shares, the “Zarlink Securities”) of Zarlink, we acquired all remaining Zarlink Shares and Zarlink Debentures for $623.7 million in cash through compulsory acquisitions under, respectively, the Canada Business Corporations Act and the trust indenture governing the Zarlink Debentures. We acquired Zarlink for its world-leading, mixed-signal chip technologies for a broad range of communication and medical applications. Zarlink's core capabilities include timing solutions that manage time-sensitive communication applications over wireless and wired networks, line circuits supporting high-quality voice services over cable and broadband connections, and ultra low-power radios enabling new wireless medical devices and therapies. Serving the world's largest original equipment manufacturers, Zarlink's highly integrated chip solutions help customers simplify design, lower costs and reach market quickly. We sometimes refer to this division herein as “Microsemi - CMPG.”

56
We allocated the total consideration to Zarlink's tangible and intangible assets and liabilities based on their estimated fair values as of the date of the completion of the transaction. During the fourth quarter of 2012, we adjusted our allocation of deferred tax assets, net. The consideration is allocated as follows (in thousands):
Cash and cash equivalents $ 83,497Accounts receivable 17,980Inventories 28,403Other current assets 35,655Property and equipment 7,648Deferred tax assets, net 27,741Other assets 4,353Identifiable intangible assets 210,100Goodwill 271,757Current liabilities (58,379)Other non-current liabilities (5,085)Total consideration $ 623,670
Identifiable intangible assets and their estimated useful lives are as follows (amounts in thousands):
AssetAmount
WeightedAverage
Useful Life(Years)
Completed technology $ 47,800 6Customer relationships 144,600 6Backlog 15,700 1Trade name 2,000 2
$ 210,100
Timing, Synchronization and Synthesis Business of Maxim Integrated Products, Inc.
During January 2012, we acquired the timing, synchronization and synthesis business of Maxim Integrated Products, Inc. for $44.0 million in cash. The acquired product lines and technology are vital to the effective and efficient delivery of time-sensitive voice, data and multimedia traffic over wireless and wired networks, and will further provide our customers with the critical synchronization components required to harmonize system and network clocks, as well as the synthesis products required to distribute timing clocks throughout each system.
We allocated the total consideration to the acquired business' tangible and intangible assets and liabilities based on their estimated fair values as of the date of the completion of the transaction. The consideration is allocated as follows (in thousands):
Inventories $ 2,741Property and equipment 4Identifiable intangible assets 12,960Goodwill 28,509Current liabilities (169)Total consideration $ 44,045

57
Identifiable intangible assets and their estimated useful lives are as follows (amounts in thousands):
AssetAmount
WeightedAverage
Useful Life(Years)
Completed technology $ 6,000 5Customer relationships 6,700 5Backlog 260 1
$ 12,960
Valuation methodology
The fair value of the identified intangible assets for the acquisitions noted above was estimated by performing a discounted cash flow analysis using the “income” approach. This method includes a forecast of direct revenues and costs associated with the respective intangible assets and charges for economic returns on tangible and intangible assets utilized in cash flow generation. Net cash flows attributable to the identified intangible assets were discounted to their present value at a rate commensurate with the perceived risk. The projected cash flow assumptions considered contractual relationships, customer attrition, eventual development of new technologies and market competition.
The valuation of completed technology and trade names for the acquisitions noted above was based on the relief-from-royalty income approach, a variation of the income approach. The premise of the relief-from-royalty income approach is that if we had not been assigned the rights to the technology and trade names, we would have to pay royalties to continue to exploit the technology and trade names covered by their claims. To arrive at an estimate of royalty charges, the acquired entity's revenue and profit margins were analyzed to determine the ability to pay a royalty. In addition, the license databases were searched for actual royalty terms based on transactions involving technology and trade name licensing.
The useful lives of completed technology rights are based on the number of years in which net cash flows have been projected. The useful life of backlog is estimated based upon the fulfillment period. The useful lives of customer relationships are estimated based upon the length of the relationships currently in place, historical attrition patterns and natural growth and diversification of other potential customers. The useful life of a trade name was estimated based on the period in which a benefit could be ascribed to the identified trade names.
Assumptions used in forecasting cash flows for each of the identified intangible assets included consideration of the following:
• Historical performance including sales and profitability.
• Business prospects and industry expectations.
• Estimated economic life of asset.
• Development of new technologies.
• Acquisition of new customers.
• Attrition of existing customers.
• Obsolescence of technology over time.
Generally, the allocation of purchase prices results in an allocation to goodwill. Depending on the structure of a particular acquisition, goodwill and identifiable intangible assets may not be deductible for tax purposes. We determined that goodwill related to the Zarlink acquisition is not deductible while goodwill related to the acquisition of the Timing, Synchronization and Synthesis Business of Maxim Integrated Products, Inc. is deductible.
The factors that contributed to a purchase price resulting in the recognition of goodwill include:
• The premium paid over market capitalization immediately prior to the merger announcement.
• Our belief that the merger will create a more diverse semiconductor company with expansive offerings which will enable us to expand our product offerings.
• Our belief that both companies are committed to improving cost structures and that our combined efforts after the merger should result in a realization of cost savings and an improvement of overall efficiencies.

58
The purchase price allocations described above are preliminary, primarily with respect to tax contingency matters. A final determination of fair values of assets acquired and liabilities assumed relating to the transactions could differ from the preliminary purchase price allocations and if material differences exist they could result in retrospective revision to the purchase price allocations. We utilized the straight line method of amortization for completed technology, customer relationships and trade name and the estimated fulfillment period for backlog.
Supplemental pro forma data (unaudited)
The following supplemental pro forma data summarizes the results of operations for 2012, 2011 and 2010, as if all acquisitions during these years were completed as of the first day of the fiscal year immediately preceding the acquisition. The supplemental pro forma information presented is for illustrative purposes only and is not necessarily indicative of the financial position or results of operations that would have been realized if the transactions had been completed on the dates indicated, nor is it indicative of future operating results or financial position. Net sales and earnings for the acquisitions on a standalone basis since their acquisition dates are impracticable to determine, as on the acquisition date, we implemented a plan developed prior to the completion of the acquisition and began to immediately integrate these acquisitions into existing operations, engineering groups, sales distribution networks and management structure. The pro forma adjustments are based upon currently available information and certain assumptions that we believe are reasonable under the circumstances.
The supplemental pro forma data reports actual operating results, adjusted to include the pro forma effect of, among others, the impact in cost of goods sold from manufacturing profit in acquired inventory, amortization expense of identified intangible assets, timing of the impact of restructuring expenses, timing of credit facility issuance costs, foregone interest income, incremental interest expense and the related tax effect of these items. Supplemental pro forma earnings for 2012 were adjusted to exclude $9.2 million in cost of goods sold from manufacturing profit in acquired inventory, $7.3 million in acquisition costs and $34.0 million in credit facility refinancing costs associated with the Zarlink financing. Supplemental pro forma earnings for 2011 were adjusted to include the above noted items from 2012 and exclude $5.5 million in cost of goods sold from manufacturing profit in acquired inventory, $6.3 million in acquisition costs, $14.2 million in credit facility issuance costs and $5.0 million in non-cash benefits from valuation allowance releases. Supplemental pro forma earnings for 2010 were adjusted to include the above noted items excluded from 2011. Supplemental pro forma data does not adjust the timing of the refinancing completed in the quarter ended April 1, 2012. Supplemental pro forma data is as follows (amounts in thousands, except per share data) (unaudited):
For each of the three fiscal years in the period endedSeptember 30, 2012 (unaudited)
2012 2011 2010
Net sales $ 1,019,329 $ 1,095,481 806,331Net income $ 10,002 $ 65,804 (89,868)Net income per share: Basic $ 0.12 $ 0.78 $ (1.11) Diluted $ 0.11 $ 0.77 $ (1.11)
3. INVENTORIES
Inventories are summarized as follows (amounts in thousands):
September 30,2012
October 2,2011
Raw materials $ 39,094 $ 40,454Work in progress 90,920 65,190Finished goods 29,041 35,183
$ 159,055 $ 140,827

59
4. PROPERTY AND EQUIPMENT
Property and equipment consisted of the following components (amounts in thousands):
Asset LifeSeptember 30,
2012October 2,
2011
Buildings 20-40 years $ 39,310 $ 38,571Machinery and equipment 3-10 years 284,925 163,566Furniture and fixtures 5-10 years 9,908 5,902Leasehold improvements Shorter of
asset life orlife of lease 30,516 21,221
364,659 229,260Accumulated depreciation (257,563) (148,090)Land 1,725 1,725Construction in progress 7,325 7,027
$ 116,146 $ 89,922
Depreciation expense was $31.3 million, $29.1 million and $19.3 million in 2012, 2011 and 2010, respectively.
5. GOODWILL AND INTANGIBLE ASSETS, NET
Goodwill and intangible assets, net consisted of the following components (amounts in thousands):
September 30, 2012 October 2, 2011
Life(in years)
GrossCarrying
ValueAccumulatedAmortization
GrossCarrying
ValueAccumulatedAmortization
Amortizable intangible assetsCompleted technology $ 309,470 $ (118,463) $ 253,838 $ (76,010) 2 to 15Customer relationships 270,030 (64,885) 116,760 (21,464) 4 to 15Backlog 46,630 (46,003) 26,900 (22,242) 1 to 2Other 13,341 (10,129) 7,394 (3,487) 5
$ 639,471 $ (239,480) $ 404,892 $ (123,203)Non-amortizing intangible assets
Goodwill $ 790,236 $ 491,079
A reconciliation of our goodwill for the years ended September 30, 2012 and October 2, 2011 is as follows (in thousands):
September 30, 2012 October 2, 2011
Beginning balance $ 491,079 $ 270,832Additions from acquisitions 300,266 220,291Post-acquisition adjustments (1,109) (44)Ending balance $ 790,236 $ 491,079
Amortization expense for intangible assets in 2012, 2011 and 2010 was $104.8 million, $62.4 million and $20.2 million, respectively. Estimated amortization in each of the five succeeding years and thereafter is as follows (amounts in thousands):
Fiscal Year 2013 2014 2015 2016 2017 Thereafter
Amortization expense $ 84,818 $ 79,399 $ 73,162 $ 69,565 $ 66,400 $ 26,647

60
6. ACCRUED LIABILITIES
Accrued liabilities consisted of the following components (amounts in thousands):
September 30,2012
October 2,2011
Payroll, bonus, accrued time off and other employee benefits $ 43,219 $ 41,264Fair value of foreign currency forward — 11,675Restructuring and severance 8,277 9,562Licenses 1,688 9,636Outside services 11,826 7,815Interest 1,720 4,037Warranties 2,472 2,945Commissions 2,900 2,692Other 8,122 11,452
$ 80,224 $ 101,078
7. INCOME TAXES
Pretax income (loss) was generated from the following sources (amounts in thousands):
For each of the three fiscal years in the period ended
September 30, 2012 2012 2011 2010
Domestic $ (88,964) $ (40,359) $ (19,878)Foreign 74,239 62,408 74,909Total $ (14,725) $ 22,049 $ 55,031
The provision (benefit) for income taxes consisted of the following components (amounts in thousands):
For each of the three fiscal years in the period ended
September 30, 2012 2012 2011 2010
Current:Federal $ (16) $ 314 $ (17,830)State 228 10 533Foreign 3,458 8,324 7,345
Deferred:Federal 5,061 (25,962) 5,352State 2,255 (1,609) 373Foreign 3,964 (14,758) 220
$ 14,950 $ (33,681) $ (4,007)
We recorded a provision for income taxes of $15.0 million on pretax loss of $14.7 million in 2012 compared to a benefit for income taxes of $33.7 million on pre-tax income of $22.0 million in 2011. During 2012, we generated tax expense of $15.0 million primarily due to the tax provision on profitable entities in foreign jurisdictions and U.S. tax provision relating to deferred tax liabilities that will not provide future sources of income to reduce deferred tax assets. During 2011, the income tax benefit we generated was primarily due to the release of the entire valuation allowance on our Israeli operations, and due to the release of valuation allowance resulting from the recording of the deferred tax liability related to acquisitions completed during the year. We had cumulative operating losses for the three years ended in 2012 for our U.S. operations and several foreign operations and accordingly, have reflected a full valuation allowance on our U.S. and such foreign net deferred tax assets as we have determined that it is more likely than not that the tax benefits will not be realized in the future.

61
During 2010 we decreased our valuation allowance by $15.6 million primarily due to the utilization of certain foreign net operating losses and the recording of the deferred tax liability related to the acquisition of White Electronic Designs Corporation.
During fiscal year 2011 we released the remaining valuation allowance related to our Israel operation, based on evaluation of key positive and negative evidence including the history of substantial losses in past years but cumulative income for the past three year period, and the indefinite carryforward period for the Israeli net operating loss carryforwards which are the principal component of our deferred tax assets in Israel.
During fiscal year 2012 we increased the valuation allowance by $194.7 million, which primarily related to the acquisition of Zarlink Semiconductor, Inc. during the quarter ended January 1, 2012, and the recording of the deferred tax assets related to the acquisition.
We have federal and state net operating losses (“NOLs”) of approximately $209.6 million and $140.7 million that begin expiring in 2021 and 2014, respectively. Of the total NOL carryforward, $8.2 million related to the excess tax benefit from employee stock compensation and stockholders' equity will increase by $8.2 million if and when such excess tax benefits are ultimately realized. We have foreign NOLs of approximately $245.6 million that carry forward indefinitely. We have federal and state research and experimentation credits of approximately $19.2 million and $40.5 million, respectively. We have federal foreign tax credits of approximately $2.6 million. We have federal and state enterprise zone credits, state investment tax credits, and alternative minimum tax credits totaling $4.1 million that carry forward indefinitely.
The utilization of the NOLs and credits acquired with the acquisitions of Advance Power Technology, Inc. in 2006, White Electronic in 2010, Actel Corporation, AML Corporation, and ASIC Advantage, Inc., each in 2011, and Zarlink Semiconductor, Inc. in 2012, may be subject to limitations due to change in control.
No provision has been made for future U.S. income taxes on undistributed earnings of foreign operations since they have been indefinitely reinvested in these operations. Determination of the amount of unrecognized deferred tax liability for temporary differences related to these undistributed earnings is not practicable, as such liability is dependent upon a number of factors, including U.S. foreign tax credit position that would exist at the time any remittance would occur. At the end of fiscal years 2012 and 2011, these undistributed earnings aggregated approximately $311.3 million and $253.8 million, respectively.
The following is a reconciliation of income tax computed at the federal statutory rate to our actual tax expense (amounts in thousands):
For each of the three fiscal years in the period ended
September 30, 2012 2012 2011 2010
Tax computed at federal statutory rate $ (5,153) $ 7,717 $ 19,261State taxes, net of federal impact (3,244) (7,023) 2,147Foreign income taxed at different rates (18,207) (9,830) (14,621)Tax credits (1,096) (4,234) (3,025)Stock award compensation 295 347 3,288Unrecognized tax benefits 1,981 1,541 2,325Executive compensation — 444 1,312U.S. tax on foreign income 2,767 — 212Income tax return to provision (3,153) 55 (347)Non-deductible permanent items 1,682 2,748 862Pre-acquisition loss carryforwards (4,043) (2,298) —Other differences, net 9 (261) 195Valuation allowance 43,112 (22,887) (15,616)
$ 14,950 $ (33,681) $ (4,007)
The tax effected deferred tax assets (liabilities) are comprised of the following components (amounts in thousands):

62
September 30,2012
October 2,2011
Accounts receivable, net $ 925 $ 1,159Inventories 12,109 22,041Accrued employee benefit expenses 5,230 6,209Net operating losses 142,986 32,095Tax credits 137,628 31,051Accrued other expenses 7,776 9,296Deferred equity compensation 14,111 12,075Property and equipment, net 3,152 (465)Other assets 17,155 7,822Total deferred tax assets 341,072 121,283Intangible assets (101,250) (96,624)Total deferred tax liabilities (101,250) (96,624)Less valuation allowance (211,530) (16,803)
$ 28,292 $ 7,856
A reconciliation of the beginning and ending amount of unrecognized tax benefits is as follows (amounts in thousands):
September 30,2012
October 2,2011
October 3,2010
Beginning gross unrecognized tax benefits $ 32,370 $ 21,719 $ 16,431Additions based on tax positions related to the current year 12,786 2,665 4,757Additions based on current year acquisitions 10,615 8,164 349Additions based on tax positions of prior years 2,436 382 2,408Reductions for lapses and settlements (191) (560) (2,226)Ending gross unrecognized tax benefit $ 58,016 $ 32,370 $ 21,719
We recognize interest and penalties accrued related to unrecognized tax benefits in tax expense. During the years ended September 30, 2012, October 2, 2011, and October 3, 2010, we recognized approximately $2.0 million, $0.7 million, and $0.2 million, respectively, in interest and penalties. The cumulative interest and penalties at September 30, 2012, October 2, 2011, and October 3, 2010 were $6.0 million, $4.2 million, and $3.5 million, respectively.
Unrecognized tax benefits of $52.4 million (including interest) at September 30, 2012 would impact the effective tax rate if recognized after the valuation allowance has been released. We anticipate a decrease in gross unrecognized tax benefits of approximately $10.1 million within the next twelve months based on federal, state, and foreign expirations in various jurisdictions.
We file U.S. state, and foreign income tax returns in jurisdictions with varying statutes of limitations. Fiscal years 2007 to 2012 generally remain subject to examination by federal and most state tax authorities. In significant foreign jurisdictions, the 2009 to 2012 tax years generally remain subject to examination by tax authorities. We establish liabilities for possible assessments by tax authorities resulting from known tax exposures including, but not limited to, international tax issues and certain tax credits. We are currently undergoing an Internal Revenue Service examination as well as certain state examinations. There have been no significant proposed adjustments to date. We do not believe the results of any audits would have a material impact on our financial position, results of operations or cash flows. We will continue to monitor the status of these audits.
8. CREDIT AGREEMENT AND RELATED INSTRUMENTS
Credit Agreement
In connection with the acquisition of Zarlink, during the quarter ended January 1, 2012, we entered into Amendment No. 2 to our Credit Agreement dated as of November 2, 2010 with Morgan Stanley Senior Funding, Inc. (“MSSF”), Morgan Stanley & Co. Incorporated, East West Bank, Raymond James Bank, FSB and the lenders referred to therein, as amended by Amendment No. 1 to the Credit Agreement, dated as of March 2, 2011 (as amended, the “Second Amended and Restated Credit Agreement”). We accounted for the second amendment as a debt extinguishment and recorded $34.0 million in debt extinguishment costs in other income (expense) in accordance with ASC 470-50. Pursuant to the Second Amended and

63
Restated Credit Agreement, MSSF has provided $850.0 million senior secured lien credit facilities, consisting of a term loan facility in an aggregate principal amount of $800.0 million and a revolving credit facility in an aggregate principal amount of $50.0 million. Microsemi paid upfront fees or original issue discount equal to 2.00% of the term loan facility and an amendment fee on the revolving facility of 0.25%.
During the quarter ended April 1, 2012, we entered into Amendment No. 3 to our Credit Agreement (as amended, the “Third Amended and Restated Credit Agreement”). We paid $9.1 million in amendment costs, consisting of a 1% repricing premium and underwriting fees and expenses. In accordance with ASC 470-50, we accounted for the third amendment as a debt modification with respect to amounts that remained in the syndicate and a debt extinguishment with respect to amounts that exited the syndicate. As such, we immediately expensed $1.2 million in financing costs and deferred the remaining $7.9 million, which we will amortize over the six year remaining life of the term loan to interest expense. Pursuant to the Third Amended and Restated Credit Agreement, MSSF has provided $860.0 million in senior secured lien credit facilities, consisting of a term loan facility in an aggregate principal amount of $810.0 million and a revolving credit facility in an aggregate principal amount of $50.0 million.
Under the Third Amended and Restated Credit Agreement, the current applicable margin on revolving loans and swingline loans determined at the Base Rate is 3.00% to 3.75% and revolving loans and swingline loans determined at the Eurodollar Rate is 4.00% to 4.75%, depending on Microsemi's consolidated leverage ratio. For term loans, the current applicable margin on term loans determined at the Base Rate is 2.00% and on term loans determined at the Eurodollar Rate is 3.00%. The “Base Rate” is defined as a rate per annum equal to the greatest of (a) the prime rate, (b) 1/2 of 1% per annum above the federal funds effective rate, (c) the one-month Eurodollar Rate plus 1%, and (d) in the case of any term loans, 2.00%. The “Eurodollar Rate” is defined as (a) the rate per annum offered for deposits of dollars for the applicable interest period that appears on Reuters Screen LIBOR01 Page as of 11:00 A.M., London, England time, two (2) business days prior to the first day of such interest period or (b) if no such offered rate exists, such rate will be the rate of interest per annum as determined by the administrative agent (rounded upwards, if necessary, to the nearest 1/100 of 1%) at which deposits of dollars in immediately available funds are offered at 11:00 A.M., London, England time, two (2) business days prior to the first day in the applicable interest period by major financial institutions reasonably satisfactory to the administrative agent in the London interbank market for such interest period and for an amount equal or comparable to the principal amount of the loans to be borrowed, converted or continued as Eurodollar Rate loans on such date of determination. In the case of term loans, the Eurodollar Rate will not be lower than 1.00%. The principal amount outstanding under our term loan facility is a Eurodollar Rate loan and is subject to an interest rate of 4.00% as of September 30, 2012.
As of September 30, 2012, we had $776.0 million borrowed under the term loan facility and no borrowings under the revolving facility. The amended term loan facility matures in February 2018 and principal amortizes at $8.1 million per year. During the quarter ended September 30, 2012, we completed an optional principal prepayment of $30.0 million and in October 2012 we made an additional principal payment of $25.0 million. While there are currently no scheduled principal repayments on the term loan facility until 2016, our credit agreement stipulates an annual payment of a percentage of Excess Cash Flow beginning after 2013. The ECF Percentage is between 0% and 50% depending on our Consolidated Leverage Ratio as of the end of a fiscal year.
The scheduled principal payments under our term loan at September 30, 2012 were (amounts in thousands):
Fiscal Year
2013 2014 2015 2016 2017 Thereafter
— — — 4,425 8,100 763,450
Pursuant to the Third Amended and Restated Credit Agreement, Microsemi can request, at any time and from time to time, the establishment of one or more term loan and/or revolving credit facilities with commitments in an aggregate amount not to exceed $200.0 million as of September 30, 2012.
Microsemi expects to pay an undrawn commitment fee ranging from 0.25% to 0.625% depending on Microsemi's consolidated leverage ratio, on the unused portion of the revolving facility. If any letters of credit are issued, then Microsemi expects to pay a fronting fee equal to 0.25% per annum of the aggregate face amount of each letter of credit and a participation fee on all outstanding letters of credit at a per annum rate equal to the margin then in effect with respect to Eurodollar Rate-based loans on the face amount of such letter of credit.

64
The Amended and Restated Credit Agreement includes financial covenants requiring a maximum leverage ratio and minimum fixed charge coverage ratio and also contains other customary affirmative and negative covenants and events of default. We were in compliance with our financial covenants as of September 30, 2012.
Interest Rate Swap Agreements
In connection with the original Credit Agreement in 2011, we entered into interest rate swap agreements for the purpose of minimizing the variability of cash flows in the interest rate payments of our variable rate borrowings. The cash flows received under the interest rate swap agreements are expected to offset the change in cash flows associated with LIBOR rate borrowings between the effective and maturity dates of the swaps. Our three swap agreements have notional amounts, fixed rates and initial terms as follows: $24.0 million at 1.49% for 2.0 years, $121.0 million at 1.83% for 3.0 years and $24.0 million at 2.21% for 4.0 years. We classify our interest rate swap balances as Level 2 fair value measurements. We determined the fair value of our interest rate swap agreements based on mid-market valuations reported to us by the counterparty to the swap agreements. Related to these interest rate swap agreements, we recorded a long-term liability of $1.9 million as of September 30, 2012 and $2.8 million as of October 2, 2011. We reflect the change in fair value of the swaps through other income (expense), net and recorded $0.9 million in 2012 and $(2.8) million in 2011.
Fair Value Option
We elected the fair value option in accounting for the term loan balance outstanding as of October 2, 2011 which we extinguished in October 2011. We classified term loan balances currently outstanding under our original Credit Agreement as Level 2 where valuations are based on quoted prices for similar assets or liabilities, quoted prices in markets that are not active, or other inputs that are observable or can be corroborated by observable data for substantially the full term of the assets or liabilities. Our valuations are based on market quotes provided to us by MSSF.
We determined the fair value of the term loan balance as of October 2, 2011 to be $361.0 million compared to a par value of $372.2 million. Subsequent to entering into Amendment No. 2 to the Credit Agreement, we did not elect the fair value option on term loan balances and outstanding at par. We extinguished the existing term loan balance at par and recorded an expense of $11.2 million in other income (expense), net. At September 30, 2012, the par and carrying value of the term loan balance was $776.0 million and the fair value was $783.8 million.
Foreign Currency Forward
In connection with the acquisition of Zarlink, we entered into a foreign currency forward agreement in the fourth quarter of 2011 to minimize our foreign currency risk associated with the transaction that we funded in Canadian Dollars (“CAD”). We agreed to purchase CAD 623.0 million for $608.2 million that settled in October 2011. We classified interest rate forward balances as Level 1 fair value measurements where there are quoted prices in active markets for identical instruments. We determined the fair value of our foreign currency forward agreement based on a corresponding quote from the counterparty to the forward transaction. As the forward currency forward contract did not qualify for hedge accounting, we reflected the change in fair value of the swap through other income (expense), net. At October 2, 2011, we recorded a current liability and corresponding expense of $11.7 million for the change in fair value. During the quarter ended January 1, 2012, we recorded income of $15.4 million related to the settlement of this forward. As our only foreign currency forward agreement settled in the quarter ended January 1, 2012, we did not record a fair value adjustment subsequent to the quarter ended January 1, 2012.
9. OTHER LONG-TERM LIABILITIES
Other long-term liabilities consisted of (amounts in thousands):
September 30,2012
October 2,2011
Unrecognized tax benefits 18,427 14,466Accrued retirement 4,484 4,063Capital leases 2,889 3,005Interest rate swaps 1,919 2,808Environmental 406 314Other 20,931 8,352
Total $ 49,056 $ 33,008

65
We lease a building in Santa Ana, California, under a long-term capital lease obligation. Building and equipment under capital lease obligations are reflected in property and equipment, net, in the accompanying consolidated balance sheets.
The contractual obligations under our capital leases at September 30, 2012 were (amounts in thousands):
Fiscal Year2013 2014 2015 2016 2017 Thereafter
$ 292 $ 308 $ 293 $ 293 $ 293 $ 1,702
10. STOCK-BASED COMPENSATION
Stock Based Compensation
In January 2012, our stockholders approved an amendment to the Microsemi Corporation 2008 Performance Incentive Plan (the “2008 Plan”). The amendment a) increased the share limit by an additional 14.5 million shares so that the amended aggregate share limit for the 2008 Plan is 28.5 million shares; b) extended the plan term to December 5, 2021; c) increased the number of shares counted against the share limit for every one share issued in connection with a full-value award to 2.41; d) terminated the evergreen provision in the original plan; and e) extended the Performance-Based Award feature through the first annual meeting of stockholders that occurs in calendar year 2017. Awards authorized by the 2008 Plan include options, stock appreciation rights, restricted stock, stock bonuses, stock units, performance share awards, and other cash- or share-based awards. The shares issued under the 2008 Plan may be newly issued or shares held by the Company as treasury stock. The maximum term of a stock option grant or a stock appreciation right granted under the 2008 Plan is 6 years.
At September 30, 2012, unamortized compensation expense related to unvested stock awards, net of estimated forfeitures, was $40.2 million. The weighted average period over which compensation expense related to these grants will be recognized is 1.3 years.
Remaining shares available for grant at September 30, 2012, October 2, 2011 and October 3, 2010 under the 2008 Plan were 16.0 million, 6.4 million and 6.9 million, respectively.
Stock Options and Stock Appreciation Rights
Compensation expense for stock options and stock appreciation rights was calculated based on the grant or assumption date using the Black-Scholes pricing model. All stock appreciation rights we have granted or assumed are stock-settled. Stock options and stock appreciation rights are granted at exercise prices equal to the closing price of our common stock on the date of grant. Assumed stock options and stock appreciation rights are granted at exercise prices determined in accordance with the acquisition agreement. Expected life was estimated based on historical exercise data that was stratified between members of the Board of Directors, executive employees and all other recipients. Expected volatility was estimated based on historical volatility using equally weighted daily price observations over a period approximately equal to the expected life of each option. The risk free interest rate is based on the implied yield currently available on U.S. Treasury securities with an equivalent remaining term. No dividends are expected to be paid.

66
Activity and price information related to stock options and stock appreciation rights are as follows (quantity and intrinsic value in thousands):
Quantity
Weighted-AverageExercise
PriceIntrinsic
Value
WeightedAverage
RemainingLife (Years)
Outstanding at September 27, 2009 10,663 $ 20.48 $ 11,356 4.3Assumed from acquisition 28 $ 13.87Exercised (464) $ 10.35 $ 2,683Forfeited (1,001) $ 23.43Outstanding at October 3, 2010 9,226 $ 20.65 13,156 3.4Granted 12 $ 23.69Assumed from acquisition 3,120 $ 13.56Exercised (2,155) $ 13.90 $ 18,558Forfeited (729) $ 20.88Outstanding at October 2, 2011 9,474 $ 19.84 $ 12,684 3.1Exercised (1,933) $ 16.82 $ 7,619Forfeited (567) $ 24.99Outstanding at September 30, 2012 6,974 $ 20.26 $ 21,557 2.5Exercisable at September 30, 2012 6,754 $ 20.50 19,968 2.4Exercisable and expected to vest after September 30, 2012 6,973 $ 20.26 $ 21,558 2.5
In connection with the acquisitions of Actel and Asic Advantage in 2011 and White Electronic Designs Corporation in 2010, we assumed stock options and stock appreciation rights and converted them to Microsemi awards in accordance with the respective merger agreement.
Quantity and weighted-average exercise prices related to stock options and stock appreciation rights stratified by exercise price are as follows (quantity in thousands):
Exercisable Outstanding
Exercise Price Quantity
Weighted-AverageExercise
Price Quantity
Weighted-AverageExercise
PriceLess than $10.00 374 $ 6.61 396 $ 6.57$10.00 to $20.00 2,446 $ 13.97 2,638 $ 13.92Greater than $20.00 3,934 $ 25.88 3,940 $ 25.88
6,754 $ 20.50 6,974 $ 20.26
Weighted-average fair value and weighted-average assumptions used in the calculation of compensation expense are as follows. There were no stock options or stock appreciation rights granted in 2012.
Fiscal Year Ended Fair ValueRisk Free
Rate
ExpectedDividend
YieldExpected
Life (Years)ExpectedVolatility
October 3, 2010 $ 5.25 0.2% —% 0.5 34.3%October 2, 2011 $ 7.42 0.2% —% 1.1 41.6%
Restricted Stock Awards
Compensation expense for restricted stock awards was calculated based on the closing price of our common stock on the date of grant. Restricted stock awards are subject to forfeiture if a participant does not meet length of service requirements. Restricted stock awards granted to employees typically vest over a three year period and awards granted to non-employee directors vest on grant date in accordance with our director compensation policy.

67
Activity and price information related to restricted stock awards are as follows (quantity in thousands):
QuantityWeighted-Average
Grant Price
Outstanding at September 27, 2009 1,620 $ 22.21Granted 1,398 $ 14.99Vested (1,060) $ 22.09Assumed from acquisition 2 $ 16.95Forfeited (44) $ 16.37Outstanding at October 3, 2010 1,916 $ 17.14Granted 1,624 $ 20.88Assumed from acquisition 252 $ 19.90Vested (1,265) $ 17.98Forfeited (177) $ 18.82Outstanding at October 2, 2011 2,350 $ 19.44Granted 1,656 $ 19.41Vested (1,281) $ 19.27Forfeited (70) $ 19.34Outstanding at September 30, 2012 2,655 $ 19.51
In connection with the acquisitions of Actel in 2011 and White Electronic Designs Corporation in 2010, we assumed restricted stock awards and converted them to Microsemi awards in accordance with the respective merger agreement.
Performance Units
Performance stock units are subject to performance-based vesting requirements and are reported at target levels. These performance-based awards will generally vest based on the Company's growth in net sales and earnings per share (subject to certain adjustments) for fiscal years 2012 and 2013 in comparison with the growth in net sales and adjusted earnings per share over the same period for a peer group selected by the Compensation Committee. Compensation expense is based upon our estimate of performance relative to the peer group. Half of each performance-based award opportunity will be subject to the growth in net sales metric for the performance period and half will be subject to the growth in earnings per share metric for the performance period. None of the units related to a particular metric will vest if the Company's performance ranking using that metric is lower than the 30th percentile relative to the peer group for the performance period, and the maximum number of units related to a particular metric that will vest is capped at 200% of the “target” number of units subject to the award related to that metric (half the total target number of units subject to the total performance-based award). This maximum vesting level will be achieved only if the Company's performance ranking using that metric is equal to or greater than the 95th percentile relative to the peer group for the performance period. The “target” number of units subject to an award related to a particular metric (half the total target number of units subject to the total performance-based award) will vest only if the Company's performance ranking using that metric is at the 70th percentile of the peer group for the performance period. Thirty percent of the target number of units may vest based on performance for fiscal 2012, with the majority of each award subject to the long-term two year performance period (fiscal years 2012 and 2013). During fiscal year 2012, we granted 0.4 million performance units at a weighted-average grant price of $17.77. During 2012, we recognized $7.1 million in expense related to performance units. There were no performance units granted prior to 2012.

68
11. EMPLOYEE BENEFIT PLANS
We sponsor 401(k) savings plans whereby participating employees may elect to contribute up to 50% of their eligible wages up to the statutory contribution limit. Employees 50 years of age and older may contribute a further 75% of their eligible wages up to the statutory contribution limit. We suspended the employer match to this plan during 2009. In 2012, we reinstated the employer match and also made a non-elective employer contribution. During 2012, employer contributions were $4.3 million.
In certain entities outside the United States, we provide defined-benefit and defined contribution plans, many in accordance with local regulations. We typically deposit employer contributions with third party trustees, insurance trust funds, or government-managed accounts.
We assumed a pension plan in Germany related to our acquisition of Microsemi - CMPG in 2012 that covers employees with over ten years of active service and provides benefits based on length of service and final pensionable earnings. There are no segregated pension fund assets under this plan. The pension liability is insured and we have pledged the insurance contracts to the pensioners. Accordingly, the contracts are now considered to be a plan asset. As the plan assets are insurance contracts, the Company does not control the investment strategy and thus cannot influence the return on investments. The insurance payments are guaranteed by the insurer and should the insurer default on its obligation, the security fund for insurance companies in Germany would assume the contracts. As of September 30, 2012, the fair value of plan assets was $5.3 million and benefit obligations were of $7.2 million. During 2012, we recorded an unrealized actuarial loss on pension benefits of $1.2 million in other comprehensive income due to a reduction in the discount rate assumption used to determine benefit obligations from 4.0% to 3.2% and a reduction in the expected rate of return on plan assets from 4.8% to 4.0%. There are no employer contributions expected in the next twelve months.
12. COMMITMENTS AND CONTINGENCIES
Operating Leases
We occupy premises and lease equipment under operating lease agreements expiring through 2029. The aggregate undiscounted future minimum rental payments under these leases are as follows (amounts in thousands):
Payments due by period2013 2014 2015 2016 2017 Thereafter
$ 18,596 $ 16,971 $ 15,635 $ 14,432 $ 12,528 $ 38,630
Lease expense charged to income was $21.4 million, $13.6 million and $7.8 million in 2012, 2011 and 2010, respectively.
Contingencies
In Broomfield, Colorado, the owner of a property located adjacent to a manufacturing facility owned by one of our subsidiaries, Microsemi Corp. – Colorado had notified the subsidiary and other parties of a claim that contaminants migrated to his property, thereby diminishing its value. In August 1995, the subsidiary, together with Coors Porcelain Company, FMC Corporation and Siemens Microelectronics, Inc. (former owners of the manufacturing facility), agreed to settle the claim and to indemnify the owner of the adjacent property for remediation costs. Although tricholorethylene and other contaminants previously used by former owners at the facility are present in soil and groundwater on the subsidiary’s property, we vigorously contest any assertion that the subsidiary caused the contamination. In November 1998, we signed an agreement with the three former owners of this facility whereby they have 1) reimbursed us for $0.5 million of past costs, 2) assumed responsibility for 90% of all future clean-up costs, and 3) promised to indemnify and protect us against any and all third-party claims relating to the contamination of the facility. An Integrated Corrective Action Plan was submitted to the State of Colorado. Sampling and management plans were prepared for the Colorado Department of Public Health & Environment. State and local agencies in Colorado are reviewing current data and considering study and cleanup options. The most recent forecast estimated that the total project cost, up to the year 2020, would be approximately $5.3 million; accordingly, we recorded a one-time charge of $0.5 million for this project in 2003. There has not been any significant development since September 28, 2003.
We are generally self-insured for losses and liabilities related to workers’ compensation and employer’s liability insurance. Accrued workers’ compensation liability was $1.4 million and $1.5 million at September 30, 2012 and October 2, 2011, respectively. Our self-insurance accruals are based on estimates and, while we believe that the amounts accrued are adequate, the ultimate claims may be in excess of the amounts provided.
On December 8, 2010, Intellectual Ventures I LLC and Intellectual Ventures II LLC filed a complaint in the United States District Court for the District of Delaware (the “Complaint”) against Altera Corporation, Microsemi, and Lattice Semiconductor Corporation. On February 15, 2011, the plaintiffs filed an amended complaint adding Xilinx, Inc. as a defendant. The complaint alleges, inter alia, that programmable logic devices manufactured and sold by our subsidiary Microsemi – SoC infringe United

69
States Patent Numbers 5,687,325, 6,260,087 and 6,272,646 assigned to Intellectual Ventures II LLC, and seeks damages and other relief at law or in equity as the court deems appropriate. We have responded to the complaint. On April 26, 2011, the defendants filed a motion to transfer the case to the United States District Court for the Northern District of California. On August 8, 2011, the defendants filed a motion to stay the litigation pending conclusion of reexamination of the patents-in-suit by the United States Patent & Trademark Office. The Court has not yet decided the motion to transfer or motion to stay. Discovery has not yet commenced and no trial date has been set. While material losses are reasonably possible, given the early stages of this matter, we cannot reasonably estimate the amount of any loss in the event of an unfavorable outcome.
We are also involved in other pending litigation matters arising out of the normal conduct of our business, including litigation relating to acquisitions, employment matters, commercial transactions, contracts, environmental matters and matters related to compliance with governmental regulations. The ultimate aggregate amount of monetary liability or financial impact with respect to these matters is subject to many uncertainties and is therefore not predictable with assurance. In the opinion of management, the final outcome of these matters, if they are adverse, will not have a material adverse effect on our financial position, results of operations or cash flows. However, there can be no assurance with respect to such result, and monetary liability or financial impact on us from these litigation matters could differ materially from those projected.
13. RESTRUCTURING CHARGES AND SEVERANCE CHARGES
In 2009, we approved consolidation plans that resulted in the closure of our manufacturing facility in Scottsdale, Arizona (“Scottsdale”), which ceased production during the quarter ended April 3, 2011. The Scottsdale facility occupied a 135,000 square foot leased facility. Employee severance is expected to be paid through 2013. Facility termination costs relate primarily to remaining obligations under facility and equipment leases and are expected to be paid through 2016. The following table reflects the restructuring activities for the Scottsdale facility and the accrued liabilities in the consolidated balance sheets at the dates below (amounts in thousands):
EmployeeSeverance
FacilityTermination
Costs Total
Balance at October 2, 2011 $ 355 $ 7,328 $ 7,683Cash expenditures (238) (1,480) (1,718)Balance at September 30, 2012 $ 117 $ 5,848 $ 5,965
At October 2, 2011, we had recorded severance accruals of $2.7 million from reductions in force at our various facilities other than Scottsdale. We recorded additional provisions, primarily related to activities at Microsemi - CMPG, for severance and retention payments totaling $8.7 million in 2012 and also assumed a fair value of $9.8 million in pre-acquisition liabilities recorded by Microsemi - CMPG. Severance covered approximately 300 individuals in manufacturing, engineering and sales. Employee severance is expected to be paid within the next twelve months. Contract termination costs relate primarily to remaining obligations under facility leases and are expected to be paid through 2020.
During the quarter ended July 1, 2012, we executed an agreement with a landlord that released us from a lease commitment and as a result, we reversed $1.3 million in provision for contract termination costs. Other associated costs related primarily to relocation costs that we incurred for the consolidation of several facilities in Northern California. The following table reflects the related restructuring activities and the accrued liabilities in the consolidated balance sheets at the dates below (amounts in thousands):
EmployeeSeverance
ContractTermination
Costs
OtherAssociated
Costs Total
Balance at October 2, 2011 $ 2,723 $ — $ — $ 2,723Assumed from acquisition 8,215 1,582 — 9,797Provisions 9,063 561 1,522 11,146Reversal of prior provision (1,112) (1,260) (108) (2,480)Cash expenditures (16,747) (601) (1,414) (18,762)Other non-cash settlement (20) (92) — (112)Balance at September 30, 2012 $ 2,122 $ 190 $ — $ 2,312

70
14. SEGMENT INFORMATION
We manage our business on the basis of one reportable segment, as a manufacturer of semiconductors in different geographic areas, including the United States, Europe and Asia. We derive revenue from sales of our high-performance analog/mixed-signal integrated circuits and power and high-reliability individual component semiconductors. These products include individual components as well as integrated circuit solutions that enhance customer designs by improving performance, reliability and battery optimization, reducing size or protecting circuits. The principal markets that we serve include Communications, Defense & Security, Aerospace and Industrial. We evaluate sales by end-market based on our understanding of end market uses of our products.
Net sales by the originating geographic area and by estimated end market are as follows (amounts in thousands):
2012 2011 2010
Net Sales:United States $ 565,931 $ 508,145 $ 243,822Europe 290,265 132,145 125,209Asia 156,299 195,564 149,237
Total $ 1,012,495 $ 835,854 $ 518,268
Communications $ 311,952 $ 148,792 $ 116,369Defense & Security 286,430 299,503 208,098Aerospace 212,293 212,127 107,587Industrial 201,820 175,432 86,214
Total $ 1,012,495 $ 835,854 $ 518,268
Property and equipment, net by geographic area are as follows (amounts in thousands):
2012 2011 2010
United States $ 93,496 $ 69,647 $ 55,737Europe 13,253 12,632 14,212Asia 7,912 7,643 5,964Other 1,485 — —
Total $ 116,146 $ 89,922 $ 75,913

71
15. UNAUDITED SELECTED QUARTERLY FINANCIAL DATA
Selected quarterly financial data are as follows (amounts in thousands, except earnings per share):
Quarters ended in fiscal year 2012
September 30,
2012July 1,2012
April 1,2012
January 1,2012
Net sales $ 263,074 $ 259,195 $ 249,306 $ 240,920Gross profit $ 150,426 $ 144,593 $ 131,868 $ 125,736Net income (loss) $ 11,593 $ 8,126 $ (4,792) $ (44,602)Basic earnings (loss) per share $ 0.13 $ 0.09 $ (0.06) $ (0.52)Diluted earnings (loss) per share $ 0.13 $ 0.09 $ (0.06) $ (0.52)
Quarters ended in fiscal year 2011
October 2,
2011July 3,2011
April 3,2011
January 2,2011
Net sales $ 227,291 $ 216,722 $ 207,490 $ 184,351Gross profit $ 129,875 $ 123,631 $ 92,636 $ 95,029Net income (loss) $ 43,376 $ 32,778 $ (19,128) $ (1,296)Basic earnings (loss) per share $ 0.51 $ 0.39 $ (0.23) $ (0.02)Diluted earnings (loss) per share $ 0.50 $ 0.38 $ (0.23) $ (0.02)

72
SCHEDULE II—VALUATION AND QUALIFYING ACCOUNTS
(amounts in thousands)
Column A Column B Column C Column D Column E Column F
Classification
Balance atbeginningof period
Chargedto costs and
expenses
Chargedto otheraccounts
Deductions-recoveries and
write-offs
Balanceat end ofperiod
Allowance for doubtful accountsOctober 3, 2010 $ 2,302 $ 425 $ — $ (749) $ 1,978October 2, 2011 $ 1,978 $ 690 $ — $ (519) $ 2,149September 30, 2012 $ 2,149 $ (497) $ — $ (29) $ 1,623Tax valuation allowanceOctober 3, 2010 $ 53,220 $ (15,616) $ — $ — $ 37,604October 2, 2011 $ 37,604 $ (22,887) $ 2,086 $ — $ 16,803September 30, 2012 $ 16,803 $ 43,112 $ 151,615 $ — $ 211,530
ITEM 9. CHANGES IN AND DISAGREEMENTS WITH ACCOUNTANTS ON ACCOUNTING AND FINANCIAL DISCLOSURE.
Inapplicable
ITEM 9A. CONTROLS AND PROCEDURES.
(a) Evaluation of disclosure controls and procedures.
As of September 30, 2012, under the supervision and with the participation of the Company’s management, including the Company’s Chief Executive Officer and Chief Financial Officer, the Company carried out an evaluation of the effectiveness of the design and operation of the Company’s disclosure controls and procedures as defined in Exchange Act Rules 13a-15(e) and 15d-15(e). These disclosure controls and procedures are designed to ensure that the information required to be disclosed by the Company in the reports that it files or submits under the Exchange Act is recorded, processed, summarized and reported within the time periods specified by the SEC’s rules and forms, and that the information is accumulated and communicated to the Company’s management, including the Chief Executive Officer and Chief Financial Officer, as appropriate to allow timely decisions regarding required disclosure.
Based upon their evaluation, the Chief Executive Officer and Chief Financial Officer concluded that the Company’s disclosure controls and procedures were effective as of September 30, 2012.
(b) Changes in internal control over financial reporting.
There have been no changes in the Company’s internal control over financial reporting during the fiscal quarter ended September 30, 2012 that have materially affected, or are reasonably likely to materially affect, the Company’s internal control over financial reporting.
(c) Management’s Report on Internal Control over Financial Reporting
Management is responsible for establishing and maintaining adequate internal control over financial reporting. Because of its inherent limitations, internal control over financial reporting may not prevent or detect misstatements. Also, projections of any evaluation of effectiveness to future periods are subject to the risks that controls may become inadequate because of changes in conditions or that the degree of compliance with the policies or procedures may deteriorate.
Under the supervision and with the participation of management, including the Company’s Chief Executive Officer and Chief Financial Officer, the Company conducted an evaluation of the effectiveness of its internal control over financial reporting as defined in Exchange Act Rules 13a-15(f) and 15d-15(f) based on the framework in Internal Control – Integrated Framework issued by the Committee of Sponsoring Organizations of the Treadway Commission. Based on the Company’s evaluation, management concluded that the Company’s internal control over financial reporting was effective as of September 30, 2012.
PricewaterhouseCoopers LLP, the Company’s independent registered public accounting firm that audited the consolidated financial statements included in this Form 10-K, has audited the effectiveness of the Company’s internal control over financial reporting, as stated within their report which appears herein.

73
ITEM 9B. OTHER INFORMATION
Inapplicable.
PART III
The Company intends to file a definitive proxy statement with the Securities and Exchange Commission pursuant to Regulation 14A within 120 days after the Company’s fiscal year ended September 30, 2012. Except to the extent set forth below, the information required by Items 10, 11, 12, 13 and 14 will be set forth in that definitive proxy statement and such information is hereby incorporated by reference into such respective items in this Form 10-K.
ITEM 10. DIRECTORS, EXECUTIVE OFFICERS AND CORPORATE GOVERNANCE
The information required by this item is incorporated by reference from the Company’s Proxy Statement for the 2013 Annual Meeting of Stockholders under the headings “Election of Directors,” “Executive Officers,” “Corporate Governance, Board Meetings and Committees,” and “Section 16(a) Beneficial Ownership Reporting Compliance.”
ITEM 11. EXECUTIVE COMPENSATION
The information required by this item is incorporated by reference from the Company’s Proxy Statement for the 2013 Annual Meeting of Stockholders under the headings “Executive Compensation” and “Director Compensation,” “Compensation Committee Interlocks and Insider Participation,” and “Report of the Compensation Committee.”
ITEM 12. SECURITY OWNERSHIP OF CERTAIN BENEFICIAL OWNERS AND MANAGEMENT AND RELATED STOCKHOLDER MATTERS.
The information required by this item is incorporated by reference from the Company’s Proxy Statement for the 2013 Annual Meeting of Stockholders under the heading “Security Ownership of Certain Beneficial Owners and Management” and “Equity Compensation Plan Information.”
ITEM 13. CERTAIN RELATIONSHIPS AND RELATED TRANSACTIONS, AND DIRECTOR INDEPENDENCE
The information required by this item is incorporated by reference from the Company’s Proxy Statement for the 2013 Annual Meeting of Stockholders under the heading “Corporate Governance, Board Meetings and Committees” and “Transactions with Related Persons.”
ITEM 14. PRINCIPAL ACCOUNTANT FEES AND SERVICES.
The information required by this item is incorporated by reference from the Company’s Proxy Statement for the 2013 Annual Meeting of Stockholders under the heading “Audit Matters.”
PART IV
ITEM 15. EXHIBITS AND FINANCIAL STATEMENT SCHEDULES
(a) 1. Financial Statements. See Index under Item 8.
2. Financial Statement Schedule. See Index under Item 8.
(b) Exhibits
The exhibits to this report are listed in the Exhibit Index
(c) Financial statements of unconsolidated affiliates.
None

74
SIGNATURES
Pursuant to the requirements of Section 13 or 15(d) of the Securities Exchange Act of 1934, the Registrant has duly caused this report to be signed on its behalf by the undersigned, thereunto duly authorized.
Microsemi Corporation
By /s/ John W. Hohener John W. Hohener
Executive Vice President,Chief Financial Officer,Secretary and Treasurer
(Principal Financial and Accounting Officer andduly authorized to sign on behalf of
the Registrant) Dated: November 20, 2012

75
POWER OF ATTORNEY
The undersigned hereby constitutes and appoints James J. Peterson and John W. Hohener, or either of them, his true and lawful attorney-in-fact and agent, with full power of substitution and re-substitution, to sign the report on Form 10-K and any or all amendments thereto and to file the same, with all exhibits thereto, and other documents in connection therewith, with the Securities and Exchange Commission, hereby ratifying and confirming all that said attorney-in-fact, or his substitute or substitutes, may do or cause to be done by virtue hereof in any and all capacities.
Pursuant to the requirements of Securities Exchange Act of 1934, this report has been signed by the following persons on behalf of the Registrant and in the capacities and on the dates indicated.
Signature Title Date
/s/ Dennis R. Leibel Chairman of the Board November 20, 2012Dennis R. Leibel
/s/ James J. Peterson President, Chief Executive Officer and Director(Principal Executive Officer) November 20, 2012
James J. Peterson
/s/ John W. Hohener
Executive Vice President, Chief Financial Officer,Secretary and Treasurer (Principal Financial andAccounting Officer) November 20, 2012
John W. Hohener
/s/ Thomas R. Anderson Director November 20, 2012Thomas R. Anderson
/s/ William E. Bendush Director November 20, 2012William E. Bendush
/s/ Paul F. Folino Director November 20, 2012Paul F. Folino
/s/ William L. Healey Director November 20, 2012William L. Healey
/s/ Matthew E. Massengill Director November 20, 2012Matthew E. Massengill
/s/ James V. Mazzo Director November 20, 2012James V. Mazzo
.

76
EXHIBIT INDEX
ExhibitNumber Description
2.1 Agreement and Plan of Merger, dated October 2, 2010, by and among Microsemi Corporation, ArtfulAcquisition Corp. and Actel Corporation(17)
2.2 Support Agreement, dated September 21, 2011, by and among 0916753 B.C. ULC, MicrosemiCorporation and Zarlink Semiconductor Inc.(22)
3.1 Amended and Restated Certificate of Incorporation of Microsemi Corporation(20)*
3.2 Second Amended and Restated Bylaws of Microsemi Corporation(24)*
4.1 Specimen certificate for the shares of common stock of Microsemi Corporation(7)
10.1 Microsemi Corporation 1987 Stock Plan, and amendments thereto(5)*
10.1.1 Form of Employee Stock Option Agreement prior to August 17, 2004(4)*
10.1.2 Form of Employee Stock Option Agreement from and after August 17, 2004(4)*
10.1.3 Form of Employee Stock Option Agreement from and after September 26, 2005(6)*
10.1.4 Form of Employee Stock Option Agreement from and after February 22, 2006(8)*
10.1.5 Form of Employee Stock Option Agreement from and after March 28, 2006(10)*
10.1.6 Form of Non-Employee Stock Option Agreement from and after February 22, 2006(8)*
10.1.8 Form of Stock Option Exchange Grant and Replacement Option Agreement(2)*
10.1.8 Form of Amendment of Eligible Unvested Options(5)*
10.1.9 Form of Notice of Restricted Stock Award and Restricted Stock Agreement(11)*
10.1.10 Form of Notice of Restricted Stock Award and Employee Restricted Stock Agreement(12)*
10.1.11 Form of Notice of Restricted Stock Award and Non-Employee Restricted Stock Agreement(12)*
10.2 Microsemi Corporation 2008 Performance Incentive Plan, as amended(13)*
10.2.1 Form of Notice of Grant of Restricted Stock Award under Terms and Conditions of 2008 PerformanceIncentive Plan(14)*
10.2.2 Form of Notice of Grant of Stock Option under Terms and Conditions of 2008 Performance IncentivePlan(14)*

77
10.2.3 Form of Notice of Performance Stock Unit Award(28)*
10.3 Microsemi Corporation Cash Bonus Plan(14)*
10.4 Microsemi Corporation 2007 Executive Cash Bonus Plan(11)*
10.5 Agreement dated November 10, 2008 between James J. Peterson and Microsemi Corporation(14)*
10.5.1 Letter Agreement, dated January 28, 2009, between James J. Peterson and Microsemi CorporationRelating to Amendment of Restricted Stock Award Agreement(15)*
10.5.2 Executive Retention Agreement dated March 31, 2009 between James J. Peterson and MicrosemiCorporation(16)*
10.6 Executive Retention Agreement dated March 31, 2009 between John W. Hohener and MicrosemiCorporation (16)*
10.7 Form of Executive Retention Agreement for Named Executive Officers other than James J. Petersonand John W. Hohener(16)*
10.8 Supplemental Executive Retirement Plan(1)*
10.9 Supplemental Medical Plan(4)*
10.10 Summary of Compensation Arrangements for Named Executive Officers†
10.11 Directors’ Compensation Policy(19)
10.12 Board Member Retirement Process(3)*
10.13 Form of Officers and Directors Indemnification Agreement(13)*
10.15 Settlement Agreement dated July 8, 1998 by and between Microsemi Corp. - Colorado, FMCCorporation, Siemens Microelectronics, Inc. and Coors Porcelain Company(9)
10.16 Credit Agreement, dated as of November 2, 2010, by and among Microsemi Corporation, MorganStanley Senior Funding, Inc., Morgan Stanley & Co. Incorporated, East West Bank, Raymond JamesBank, FSB and the lenders referred to therein(18)
10.16.1 Amendment No. 1 to Credit Agreement, dated as of March 2, 2011, by and among MicrosemiCorporation, Morgan Stanley Senior Funding, Inc. and the lenders referred to therein(21)
10.16.2 Amendment No. 2 to Credit Agreement, dated as of October 13, 2011, by and among MicrosemiCorporation, Morgan Stanley Senior Funding, Inc., Morgan Stanley & Co. LLC and the lenders referredto therein(23)
10.16.3 Amendment No. 3 to Credit Agreement, dated as of February 17, 2012, by and among Microsemi Corporation, Morgan Stanley Senior Funding, Inc., Morgan Stanley & Co. LLC and the lenders referred to therein.(26)

78
10.16.4 Increase Term Joinder, dated as of February 17, 2012, by and among Microsemi Corporation andMorgan Stanley Senior Funding, Inc.(27)
21 List of Subsidiaries†
23 Consent of Independent Registered Public Accounting Firm†
24 Power of Attorney (see signature page)
31.1 Certification of Chief Executive Officer Pursuant to Securities Exchange Act Rules 13a-14(a) and 15d-14(a) as Adopted Pursuant to Section 302 of the Sarbanes-Oxley Act of 2002, dated November 20, 2012†
31.2 Certification of Chief Financial Officer Pursuant to Securities Exchange Act Rules 13a-14(a) and 15d-14(a) as Adopted Pursuant to Section 302 of the Sarbanes-Oxley Act of 2002, dated November 20, 2012†
32 Certification of Chief Executive Officer and Chief Financial Officer pursuant to 18 U.S.C. Section 1350 as Adopted Pursuant to Section 906 of the Sarbanes-Oxley Act of 2002, dated November 20, 2012†
101 The following financial statements are from Microsemi Corporation’s Annual Report on Form 10-K for the fiscal year ended September 30, 2012, formatted in XBRL (eXtensible Business Reporting Language): (i) Consolidated Balance Sheets; (ii) Consolidated Statements of Operations and Comprehensive Income; (iii) Consolidated Statements of Stockholders’ Equity; (iv) Consolidated Statements of Cash Flows; and (v) Notes to Consolidated Financial Statements.†
† Filed with this report.* Management contract or compensatory plan or arrangement required to be filed as an exhibit pursuant
to applicable rules of the Securities and Exchange Commission.(1) Incorporated by reference to the indicated Exhibit to the Registrant’s Quarterly Report on Form 10-Q
(File No. 0-08866) as filed with the Commission on February 9, 1998.(2) Incorporated by reference to Exhibit 99(D)(2) to the Registrant’s Tender Offer Statement on
Schedule TO (File No. 005-20930) as filed on November 1, 2002.(3) Incorporated by reference to the indicated Exhibit to the Registrant’s Annual Report on Form 10-K
(File No. 0-08866) as filed with the Commission on December 19, 2002.(4) Incorporated by reference to the indicated Exhibit to the Registrant’s Current Report on Form 8-K
(File No. 0-08866) as filed with the Commission on September 24, 2004.(5) Incorporated by reference to Exhibit 99(D)(1) to the Registrant’s Tender Offer Statement on
Schedule TO (File No. 005-30432) as filed with the Commission on August 17, 2005.(6) Incorporated by reference to the indicated Exhibit to the Registrant’s Current Report on Form 8-K
(File No. 0-08866) as filed with the Commission on September 28, 2005.(7) Incorporated by reference to the indicated Exhibit to the Registrant’s Annual Report on Form 10-K
(File No. 0-08866) as filed with the Commission on December 16, 2005.(8) Incorporated by reference to the indicated Exhibit to the Registrant’s Current Report on Form 8-K
(File No. 0-08866) as filed with the Commission on February 28, 2006.(9) Incorporated by reference to the indicated Exhibit to the Registrant’s Pre-Effective Amendment No. 2 to
Form S-4 (Reg. No. 333-130655) as filed with the Commission on March 3, 2006.(10) Incorporated by reference to the indicated Exhibit to the Registrant’s Current Report on Form 8-K
(File No. 0-08866) as filed with the Commission on April 3, 2006.(11) Incorporated by reference to the indicated Exhibit to the Registrant’s Current Report on Form 8-K
(File No. 0-08866) as filed with the Commission on April 4, 2007.(12) Incorporated by reference to the indicated Exhibit to the Registrant’s Current Report on Form 8-K
(File No. 0-08866) as filed with the Commission on October 3, 2007.(13) Incorporated by reference to the indicated Exhibit to the Registrant’s Current Report on Form 8-K
(File No. 0-08866) as filed with the Commission on September 3, 2008.
79
(14) Incorporated by reference to the indicated Exhibit to the Registrant’s Annual Report on Form 10-K(File No. 0-08866) as filed with the Commission on November 21, 2008.
(15) Incorporated by reference to the indicated Exhibit to the Registrant’s Quarterly Report on Form 10-Q(File No. 0-08866) as filed with the Commission on April 30, 2009.
(16) Incorporated by reference to the indicated Exhibit to the Registrant’s Quarterly Report on Form 10-Q(File No. 0-08866) as filed with the Commission on July 30, 2009.
(17) Incorporated by reference to the indicated Exhibit to the Registrant’s Current Report on Form 8-K(File No. 0-08866) as filed with the Commission on October 4, 2010.
(18) Incorporated by reference to the indicated Exhibit to the Registrant’s Current Report on Form 8-K(File No. 0-08866) as filed with the Commission on November 5, 2010.
(19) Incorporated by reference to the indicated Exhibit to the Registrant’s Annual Report on Form 10-K(File No. 0-08866) as filed with the Commission on November 23, 2010.
(20) Incorporated by reference to the indicated Exhibit to the Registrant’s Quarterly Report on Form 10-Q(File No. 0-08866) as filed with the Commission on February 10, 2011.
(21) Incorporated by reference to the Exhibit to the Registrant’s Current Report on Form 8-K(File No. 0-08866) as filed with the Commission on March 4, 2011.
(22) Incorporated by reference to the indicated Exhibit to Amendment No. 3 to the Schedule 14D-1F filed byMicrosemi Corporation with the Commission on September 26, 2011.
(23) Incorporated by reference to the Exhibit to the Registrant’s Current Report on Form 8-K(File No. 0-08866) as filed with the Commission on October 19, 2011.
(24) Incorporated by reference to Exhibit 3.2 to the Registrant's Annual Report on Form 10-K (File No. 0-08866) as filed with the Commission on November 23, 2011.
(25) Incorporated by reference to the indicated Exhibit to the Registrant's Quarterly Report on Form 10-Q (File No. 0-08866) as filed with the Commission on February 8, 2011.
(26) Incorporated by reference to Exhibit 10.1 to the Registrant's Current Report on Form 8-K (File No. 0-08866) as filed with the Commission on February 21, 2012).
(27) Incorporated by reference to Exhibit 10.2 to the Registrant's Current Report on Form 8-K (File No. 0-08866) as filed with the Commission on February 21, 2012).
(28) Incorporated by reference to the indicated Exhibit to the Registrant's Quarterly Report on Form 10-Q (File No. 0-08866) as filed with the Commission on February 8, 2012.

