identify microsemi edition tutorial
TRANSCRIPT

Identify® Microsemi EditionTutorial
November 2014

LO
2 Identify for Microsemi Edition Tutorial, November 2014
Copyright Notice and Proprietary Information
Copyright © 2014 Synopsys, Inc. All rights reserved. This software and documentation contain confidential and proprietary information that is the property of Synopsys, Inc. The software and documentation are furnished under a license agreement and may be used or copied only in accordance with the terms of the license agreement. No part of the software and documentation may be reproduced, transmitted, or translated, in any form or by any means, electronic, mechanical, manual, optical, or otherwise, without prior written permission of Synopsys, Inc., or as expressly provided by the license agreement.
Right to Copy Documentation
The license agreement with Synopsys permits licensee to make copies of the documentation for its internal use only.
Each copy shall include all copyrights, trademarks, service marks, and proprietary rights notices, if any. Licensee must assign sequential numbers to all copies. These copies shall contain the following legend on the cover page:
“This document is duplicated with the permission of Synopsys, Inc., for the exclusive use of __________________________________________ and its employees. This is copy number __________.”
Destination Control Statement
All technical data contained in this publication is subject to the export control laws of the United States of America. Disclosure to nationals of other countries contrary to United States law is prohibited. It is the reader’s responsibility to determine the applicable regulations and to comply with them.

Identify for Microsemi Edition Tutorial, November 2014 3
Disclaimer
SYNOPSYS, INC., AND ITS LICENSORS MAKE NO WARRANTY OF ANY KIND, EXPRESS OR IMPLIED, WITH REGARD TO THIS MATERIAL, INCLUDING, BUT NOT LIMITED TO, THE IMPLIED WARRANTIES OF MERCHANTABILITY AND FITNESS FOR A PARTICULAR PURPOSE.
Registered Trademarks (®)
Synopsys, AEON, AMPS, Astro, Behavior Extracting Synthesis Technology, Cadabra, CATS, Certify, CHIPit, CoMET, CODE V, Design Compiler, DesignWare, EMBED-IT!, Formality, Galaxy Custom Designer, Global Synthesis, HAPS, HapsTrak, HDL Analyst, HSIM, HSPICE, Identify, Leda, LightTools, MAST, METeor, ModelTools, NanoSim, NOVeA, OpenVera, ORA, PathMill, Physical Compiler, PrimeTime, SCOPE, Simply Better Results, SiVL, SNUG, SolvNet, Sonic Focus, STAR Memory System, Syndicated, Synplicity, the Synplicity logo, Synplify, Synplify Pro, Synthesis Constraints Optimization Environment, TetraMAX, UMRBus, VCS, Vera, and YIELDirector are regis-tered trademarks of Synopsys, Inc.
Trademarks (™)
AFGen, Apollo, ARC, ASAP, Astro-Rail, Astro-Xtalk, Aurora, AvanWaves, BEST, Columbia, Columbia-CE, Cosmos, CosmosLE, CosmosScope, CRITIC, CustomExplorer, CustomSim, DC Expert, DC Professional, DC Ultra, Design Analyzer, Design Vision, DesignerHDL, DesignPower, DFTMAX, Direct Silicon Access, Discovery, Eclypse, Encore, EPIC, Galaxy, HANEX, HDL Compiler, Hercules, Hierarchical Optimization Technology, High-performance ASIC Prototyping System, HSIMplus, i-Virtual Stepper, IICE, in-Sync, iN-Tandem, Intelli, Jupiter, Jupiter-DP, JupiterXT, JupiterXT-ASIC, Liberty, Libra-Passport, Library Compiler, Macro-PLUS, Magellan, Mars, Mars-Rail, Mars-Xtalk, Milkyway, ModelSource, Module Compiler, MultiPoint, ORAengi-neering, Physical Analyst, Planet, Planet-PL, Polaris, Power Compiler, Raphael, RippledMixer, Saturn, Scirocco, Scirocco-i, SiWare, Star-RCXT, Star-SimXT, StarRC, System Compiler, System Designer, Taurus, Total-Recall, TSUPREM-4, VCSi, VHDL Compiler, VMC, and Worksheet Buffer are trademarks of Synopsys, Inc.

LO
4 Identify for Microsemi Edition Tutorial, November 2014
Service Marks (sm)
MAP-in, SVP Café, and TAP-in are service marks of Synopsys, Inc.
SystemC is a trademark of the Open SystemC Initiative and is used under license.
ARM and AMBA are registered trademarks of ARM Limited.
Saber is a registered trademark of SabreMark Limited Partnership and is used under license.
All other product or company names may be trademarks of their respective owners.
Printed in the U.S.ANovember 2014

Identify for Microsemi Edition Tutorial, November 2014 5
Contents
Chapter 1: Getting Started
The Debugging System . . . . . . . . . . . . . . . . . . . . . . . . . . . . . . . . . . . . . . . . . . . . . . . 8Identify Instrumentor . . . . . . . . . . . . . . . . . . . . . . . . . . . . . . . . . . . . . . . . . . . . . . 9IICE Block . . . . . . . . . . . . . . . . . . . . . . . . . . . . . . . . . . . . . . . . . . . . . . . . . . . . . . 9Identify Debugger . . . . . . . . . . . . . . . . . . . . . . . . . . . . . . . . . . . . . . . . . . . . . . . . . 9
Design Flow . . . . . . . . . . . . . . . . . . . . . . . . . . . . . . . . . . . . . . . . . . . . . . . . . . . . . . . 10
Tutorial Requirements . . . . . . . . . . . . . . . . . . . . . . . . . . . . . . . . . . . . . . . . . . . . . . . 11Hardware/Software Environments . . . . . . . . . . . . . . . . . . . . . . . . . . . . . . . . . . . 11
Chapter 2: The Tutorial DesignDesign Schematic . . . . . . . . . . . . . . . . . . . . . . . . . . . . . . . . . . . . . . . . . . . . . . . 14VHDL Design Files . . . . . . . . . . . . . . . . . . . . . . . . . . . . . . . . . . . . . . . . . . . . . . . 15Board Clock Configuration . . . . . . . . . . . . . . . . . . . . . . . . . . . . . . . . . . . . . . . . . 15
Chapter 3: Instrumenting Your Design
Launching the Identify Instrumentor . . . . . . . . . . . . . . . . . . . . . . . . . . . . . . . . . . . . . 17Creating a Synplify Project . . . . . . . . . . . . . . . . . . . . . . . . . . . . . . . . . . . . . . . . . 18Launching the Instrumentor . . . . . . . . . . . . . . . . . . . . . . . . . . . . . . . . . . . . . . . . 20
Selecting the Instrumentation . . . . . . . . . . . . . . . . . . . . . . . . . . . . . . . . . . . . . . . . . . 24Instrumenting the Arbiter . . . . . . . . . . . . . . . . . . . . . . . . . . . . . . . . . . . . . . . . . . 24Assigning Watchpoints to a Partial Bus . . . . . . . . . . . . . . . . . . . . . . . . . . . . . . . 27Assigning Breakpoints . . . . . . . . . . . . . . . . . . . . . . . . . . . . . . . . . . . . . . . . . . . . 29
Configuring the IICE . . . . . . . . . . . . . . . . . . . . . . . . . . . . . . . . . . . . . . . . . . . . . . . . . 30Setting the Common IICE Parameters . . . . . . . . . . . . . . . . . . . . . . . . . . . . . . . . 30Setting the Individual IICE Parameters . . . . . . . . . . . . . . . . . . . . . . . . . . . . . . . 31Creating a Second IICE . . . . . . . . . . . . . . . . . . . . . . . . . . . . . . . . . . . . . . . . . . . 33
Writing the Instrumented Design . . . . . . . . . . . . . . . . . . . . . . . . . . . . . . . . . . . . . . . 35

LO
Contents
6 Identify for Microsemi Edition Tutorial, November 2014
Chapter 4: Implementing the Design
Synthesis . . . . . . . . . . . . . . . . . . . . . . . . . . . . . . . . . . . . . . . . . . . . . . . . . . . . . . . . . 37Synthesizing the Bus Demo Design . . . . . . . . . . . . . . . . . . . . . . . . . . . . . . . . . . 38
Place and Route . . . . . . . . . . . . . . . . . . . . . . . . . . . . . . . . . . . . . . . . . . . . . . . . . . . . 40
Program the Device . . . . . . . . . . . . . . . . . . . . . . . . . . . . . . . . . . . . . . . . . . . . . . . . . 41
Chapter 5: Debugging Your Design
Launching the Identify Debugger . . . . . . . . . . . . . . . . . . . . . . . . . . . . . . . . . . . . . . . 44
Specifying the JTAG Cable . . . . . . . . . . . . . . . . . . . . . . . . . . . . . . . . . . . . . . . . . . . . 45
Setting Up Triggers and Capturing Data . . . . . . . . . . . . . . . . . . . . . . . . . . . . . . . . . . 47Triggering on a Watchpoint . . . . . . . . . . . . . . . . . . . . . . . . . . . . . . . . . . . . . . . . 47Triggering on a Breakpoint . . . . . . . . . . . . . . . . . . . . . . . . . . . . . . . . . . . . . . . . . 50Using the Complex Counter . . . . . . . . . . . . . . . . . . . . . . . . . . . . . . . . . . . . . . . . 53Cross Triggering . . . . . . . . . . . . . . . . . . . . . . . . . . . . . . . . . . . . . . . . . . . . . . . . . 55
Generating Waveforms . . . . . . . . . . . . . . . . . . . . . . . . . . . . . . . . . . . . . . . . . . . . . . . 58
Identify for Microsemi Edition Tutorial © 2014 Synopsys, Inc.November 2014 7
C H A P T E R 1
Getting Started
The Identify® Microsemi® Edition tool set includes a software instrumentor and a hardware debugger. The combination of these two tools lets you debug your HDL design:
• In the target system,
• At the target speed,
• At the VHDL/Verilog RTL Source level.
The Identify tools enable the debugging of FPGA designs, FPGA-based proto-types, and system-on-a-chip designs. For the first time, you can debug live hardware using intuitive, HDL-based debugging techniques that provide visibility into the internal operation of your system.
The Identify software easily integrates into your existing design flow so that minimal effort is required to begin the debugging of your HDL designs. To better understand how the Identify instrumentor and debugger work and how they function within your HDL design flow, this guide provides comprehen-sive information about navigating through the Identify tools and integrating with your other design flow tools.
This remainder of this chapter describes:
• The Debugging System
• Design Flow
• Tutorial Requirements

LO
Getting Started The Debugging System
© 2014 Synopsys, Inc. Identify for Microsemi Edition Tutorial8 November 2014
The Debugging System
The Identify concept is based on the principle of in-system debugging. Using the Identify tool set allows you to debug your device in the target system, at target speed while still debugging at the HDL level.
The Identify instrumentor captures your device’s internal states by inserting probe hardware (called an IICE™ – Intelligent In-Circuit-Emulator) into your design. The IICE captures internal design states based on user-specified trigger conditions. Data captured at the target device is transferred back to the host computer where it is transformed and displayed by the Identify debugger.
The Identify tool set is a dual-component software system consisting of:
• an Identify instrumentor which inserts and configures the IICE
• an Identify debugger which controls the IICE and displays data from the IICE
The following sections briefly describe these components.

The Debugging System Getting Started
Identify for Microsemi Edition Tutorial © 2014 Synopsys, Inc.November 2014 9
Identify Instrumentor
The Identify instrumentor reads and analyzes the HDL description of a design and provides you with detailed information about the signals that can be sampled and the locations in the source code where breakpoints can be set. This information is collectively referred to as the instrumentation.
IICE Block
The Identify instrumentor uses the HDL design files and your selected instru-mentation information to create the custom IICE. An IICE block is logic that probes the design and communicates with the Identify user interface through the device JTAG port. The IICE is implemented using the logic resources of the device. The Identify instrumentor defines one or more IICE blocks in the design netlist with the modifications necessary to implement and intercon-nect the IICE blocks.
Identify Debugger
The Identify debugger lets you interact with your real hardware at the HDL level. In the Identify debugger, you set trigger conditions to determine when to capture data, and then view the captured data as either annotated source code or as waveforms.

LO
Getting Started Design Flow
© 2014 Synopsys, Inc. Identify for Microsemi Edition Tutorial10 November 2014
Design Flow
Design flows for HDL design and debugging vary according to the type of hardware and device you use. Displayed below is the typical HDL design flow without the Identify tool set on the left and a typical HDL design flow with the Identify tool set on the right.
In the design flow without the Identify tool set, the first step is to create the HDL source files for the design. Next, the design is synthesized to the target device. Once synthesized, the design is placed and routed before it is finally implemented in the target device.
Program
Write HDL
Synthesis
Placeand
Route
Device
Program
Write HDL
Synthesis
Placeand
Route
Device
Instrument
Debug
Design Flow withIdentify Tool Set
Design Flow withoutIdentify Tool set

Tutorial Requirements Getting Started
Identify for Microsemi Edition Tutorial © 2014 Synopsys, Inc.November 2014 11
The design flow with the Identify tool set adds two steps to the standard flow – one step at the beginning and one step at the end. After the HDL source is created, the Identify instrumentor is used to create a debuggable design. This design is then run through the rest of the standard design flow. After the instrumented design has been implemented in the device, the Identify debugger is then used to debug the design in the target system.
Tutorial Requirements
This tutorial guides you through the process of debugging a small HDL design in a real hardware environment. The tutorial teaches you how to generate an instrumented design for debugging and then how to debug that instrumented design.
The tutorial explains how the Identify tools are used in concert with your synthesis and place-and-route flow. However, the tutorial does not provide details and procedures for synthesizing and using place-and-route tools with your instrumented hardware design. For the purposes of this tutorial, it is assumed that you have a working implementation flow. To find out more about these processes, consult your synthesis documentation and vendor place-and-route tool documentation for more information.
Hardware/Software Environments
This tutorial is performed with Microsemi hardware. The tutorial was devel-oped using the following software:
• Identify tool set: Identify H-2012.12M or later
• FPGA synthesis software: Synplify Pro G-2012.09-SP1M or later
Note: Other device families and devices, and board systems can be used.

LO
Getting Started Tutorial Requirements
© 2014 Synopsys, Inc. Identify for Microsemi Edition Tutorial12 November 2014

Identify for Microsemi Edition Tutorial © 2014 Synopsys, Inc.November 2014 13
C H A P T E R 2
The Tutorial Design
The Identify tool set can debug a variety of HDL designs. To better under-stand the debugging process, this guide provides a small HDL design example. The example design is a simple bus demo circuit. The HDL source is written in VHDL and is based on the open-source Wishbone bus. A block diagram of the design is shown below.
TrafficGenerator
TrafficGenerator
WordTransferMaster
Arbiter
BlockTransferMaster
ROM RAM1 RAM 2

LO
The Tutorial Design
© 2014 Synopsys, Inc. Identify for Microsemi Edition Tutorial14 November 2014
The design contains two bus masters connected to three slave devices. The bus masters are the Word Transfer Master and the Block Transfer Master. The slaves are the three memory devices, ROM, RAM1, and RAM2. The bus masters are driven by traffic generators that request random bus transac-tions. The arbiter controls master access to prevent bus conflicts. The arbiter monitors bus requests, and grants bus accesses based on a fair algorithm.
The arbiter uses two clocks. One clock is used by the state machine and the other is used by the other logic modules and also to synchronize with the state-machine clock. The two clocks are used to demonstrate cross-triggering as explained later in this tutorial. The focus of the tutorial is on the arbiter and a 4-bit counter.
For the tutorial, you will instrument the design for an IGLOO PLUS device. You will then debug the design hardware to gain a basic understanding of the Identify tool set and how it integrates into your synthesis environment.
Note: Other supported Microsemi device families and devices can be used.
Design Schematic
The following figure is a schematic representation of the simple bus circuit used for the tutorial design.
1 2
3 4
5
6
9
78
1 - DCM2 - Arbiter3 - Word Transfer Controller4 - Word Transfer Logic5 - RAM 2
6 - ROM7 - RAM 18 - Block Transfer Controller9 - Block Transfer Logic

The Tutorial Design
Identify for Microsemi Edition Tutorial © 2014 Synopsys, Inc.November 2014 15
VHDL Design Files
The bus demo design used for this tutorial is implemented in VHDL. The initial VHDL design files, as loaded into Synplify Pro, are shown in the figure below:
Board Clock Configuration
As previously mentioned, this tutorial was developed using a Microsemi IGLOO PLUS device (AGLP030V2). The bus_demo.vhd file in the tutorial design uses a 50 MHz clock (clk) and a 33 MHz clock (clk_arb) clocks for the design. These frequencies are set by define_clock constraints in the constraint file provided with the tutorial.

LO
The Tutorial Design
© 2014 Synopsys, Inc. Identify for Microsemi Edition Tutorial16 November 2014

Identify for Microsemi Edition Tutorial © 2014 Synopsys, Inc.November 2014 17
C H A P T E R 3
Instrumenting Your Design
The Identify instrumentor selects the design visibility (breakpoints and watchpoints) and special hardware configurations including complex event counters, and sampling and triggering modes for your design. The goal of the instrumentation process is to define an IICE and insert it into your HDL design. The instrumentation flow is:
• Launching the Identify Instrumentor
• Selecting the Instrumentation
• Configuring the IICE
• Writing the Instrumented Design
The HDL design files for the tutorial are included in a tar or zip file in the share subdirectory within the installation directory. Unpack the appropriate file to a local directory and make sure that you have read and write permis-sion for both the directory and files.
Launching the Identify Instrumentor
The Identify instrumentor is launched directly from the Synplify Pro synthesis tool.

LO
Instrumenting Your Design Launching the Identify Instrumentor
© 2014 Synopsys, Inc. Identify for Microsemi Edition Tutorial18 November 2014
Creating a Synplify Project
Before you can launch the Identify instrumentor, you must create the project in Synplify Pro. To create a project:
1. Start the Synplify Pro synthesis tool.
2. Select the Open Project button (just below the large Run button) and click New Project in the dialog box.
3. Click File->Save As from the top menu bar and navigate to the directory where you downloaded the design files. Enter identify_bus_demo.prj as the project name and click Save.
4. Click the Add File button to display the Add Files to Project dialog box. In the dialog box, click <-Add All to select all of the HDL files and then click OK to add the selected files to the project and close the dialog box. If the list of files is not displayed in the dialog box, make sure that Files of type field is set to HDL Files (or All Files).
5. Expand the VHDL (shown) or Verilog folder by clicking on the “+” to the right of the folder to display the list of design files as show below.

Launching the Identify Instrumentor Instrumenting Your Design
Identify for Microsemi Edition Tutorial © 2014 Synopsys, Inc.November 2014 19
6. From the top menu bar, select Project->Implementation Options and, if necessary, select the Device tab. Set the technology in the Technology drop-down menu to Microsemi IGLOO+ and set the device in the adjacent Part drop-down menu to AGLP030V2.
7. Without closing the Implementation Options dialog box, select the Implementation Results tab and make sure that the Result Base Name is bus_demo and that the Result Format is edif (the only selection).
8. Select the VHDL tab and enter work.bus_demo in the Top Level Entity field. Note that it is recommended for the top-level VHDL entity to be in the work library.
LO
Instrumenting Your Design Launching the Identify Instrumentor
© 2014 Synopsys, Inc. Identify for Microsemi Edition Tutorial20 November 2014
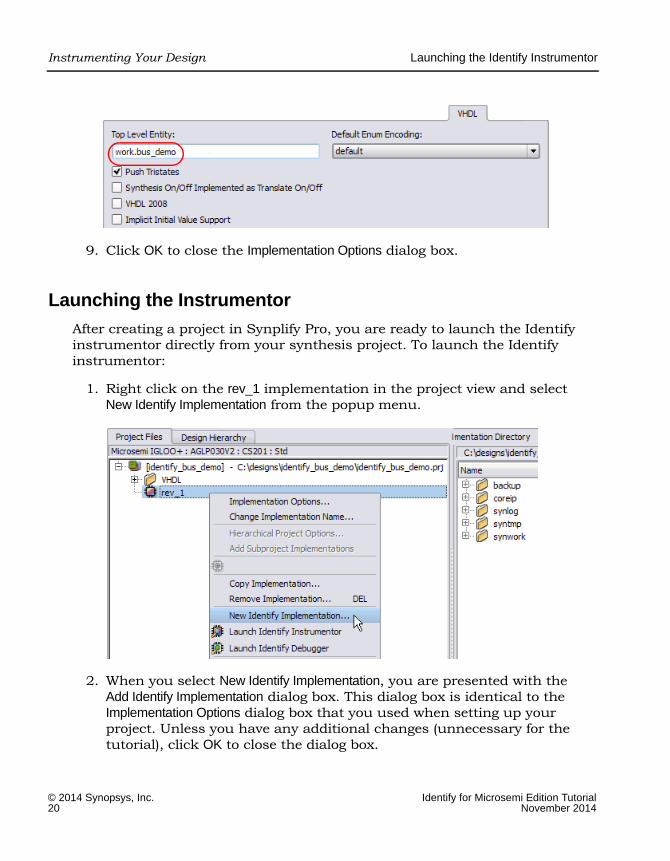
9. Click OK to close the Implementation Options dialog box.
Launching the Instrumentor
After creating a project in Synplify Pro, you are ready to launch the Identify instrumentor directly from your synthesis project. To launch the Identify instrumentor:
1. Right click on the rev_1 implementation in the project view and select New Identify Implementation from the popup menu.
2. When you select New Identify Implementation, you are presented with the Add Identify Implementation dialog box. This dialog box is identical to the Implementation Options dialog box that you used when setting up your project. Unless you have any additional changes (unnecessary for the tutorial), click OK to close the dialog box.

Launching the Identify Instrumentor Instrumenting Your Design
Identify for Microsemi Edition Tutorial © 2014 Synopsys, Inc.November 2014 21
3. When you close the dialog box, an Identify implementation is added to the project as noted by the icon with the magnifying glass.
4. Right click on the Identify implementation and select Launch Identify Instrumentor from the popup menu.
If the synthesis tool detects more than one copy of Identify or if the path to the Identify executable has not been established, the following dialog box appears.

LO
Instrumenting Your Design Launching the Identify Instrumentor
© 2014 Synopsys, Inc. Identify for Microsemi Edition Tutorial22 November 2014
.
Click to select the executable currently displayed or click the Locate Identify Installation radio button, navigate to the Identify installation direc-tory, and click OK.
5. You are next prompted to save the changes to your synthesis tool.
Click OK to save the project and to launch the Identify instrumentor.

Launching the Identify Instrumentor Instrumenting Your Design
Identify for Microsemi Edition Tutorial © 2014 Synopsys, Inc.November 2014 23
Launching the Identify instrumentor from the Synplify Pro synthesis tool:
• Brings up the Identify instrumentor graphical interface.
Note: If you are prompted to select a license type, select the appro-priate type from the list; check the Save as default license type box to avoid the license prompt in future sessions.
• Opens the synthesis project (prj) file in the Identify instrumentor. The list of design files, their work directories, and the device family are automatically extracted from this prj file.
• Automatically compiles the design files in the specified technology (IGLOO+) using the Synplify Pro compiler.
• Displays the design hierarchy and the HDL file content with the poten-tial watchpoints and breakpoints identified for selection.

LO
Instrumenting Your Design Selecting the Instrumentation
© 2014 Synopsys, Inc. Identify for Microsemi Edition Tutorial24 November 2014
Selecting the Instrumentation
After your VHDL design compiles, the instrumentation window displays the top-level entity VHDL code on the right and the hierarchy browser on the left (if the instrumentation window is not displayed, click on the “IICE” tab at the bottom of the project window). The tutorial uses the hierarchy browser to navigate through your design. Clicking on a hierarchical node updates the corresponding section of code in the source code display on the right.
Instrumenting the Arbiter
To instrument the arbiter:
1. Expand the beh block in the hierarchy browser by clicking on the ‘+’ sign adjacent to the block.

Selecting the Instrumentation Instrumenting Your Design
Identify for Microsemi Edition Tutorial © 2014 Synopsys, Inc.November 2014 25
2. In the expanded hierarchy, click on arb_inst (arbiter) to update the instrumentation window with the arbiter entity beginning on line 32.
3. With the arbiter still displayed, click on the clk signal on line 34 (or the adjacent eyeglass icon) to display the watchpoint menu.
4. In the watchpoint menu, click Sample Clock. The eyeglass icon is replaced with the sample clock icon to indicate that the clk signal is now defined as the sample clock for the IICE.

LO
Instrumenting Your Design Selecting the Instrumentation
© 2014 Synopsys, Inc. Identify for Microsemi Edition Tutorial26 November 2014
5. Locate the first occurrence of the curr_state signal on line 46 in the source code display. Select this signal for instrumentation by clicking on the signal name (or the adjacent eyeglass icon) and then selecting Sample and Trigger from the popup menu. The eyeglass icons preceding each occurrence of the curr_state signal in the VHDL code for the arbiter will be green.
When you select a watchpoint instrumentation type from the popup menu, the icon lenses change color according to the type selected as outlined in the following table.
The command that you would enter manually or in a shell script to define the watchpoint signal (signals add -sample -trigger -iice IICE /beh/arb_inst/beh/curr_state) and the cumulative instrumentation to imple-ment the watchpoint are displayed in the console window.
6. To become familiar with the command-line interface, use the console window to set a sample and trigger watchpoint on the next_state signal. At the command prompt, enter:
signals add -sample -trigger -iice IICE /beh/arb_inst/beh/next_state
Check that the eyeglass icon preceding the next_state signal on line 46 is green (sample and trigger).
7. Again using the graphical interface, locate signal grant1 on line 39 and set its watchpoint to Sample Only. The icon lenses are blue for Sample Only.
8. Locate signal grant2 on line 40 and set its watchpoint to Trigger Only. The icon lenses are red for Trigger Only.
Icon Color Watchpoint Selection
Green Sample and trigger
Blue Sample only
Red Trigger only
Clear (unfilled) Not instrumented

Selecting the Instrumentation Instrumenting Your Design
Identify for Microsemi Edition Tutorial © 2014 Synopsys, Inc.November 2014 27
The following figure shows the resulting assigned watchpoints.
Assigning Watchpoints to a Partial Bus
This section shows you how to instrument a partial bus. The section uses the blk_xfer_inst (block_xfer) entity from the tutorial design to illustrate watchpoint assignment. To instrument the partial bus:
1. In the hierarchy browser, click on blk_xfer_inst (block_xfer) to update the instrumentation window with the block_xfer entity.
2. Click on the wb_adr_o bus on line 35 and use the popup menu to select Add partial instrumentation.
3. In the dialog box displayed, enter 7 for the MSB value, enter 5 for the LSB value, and select Sample Only from the drop-down menu for the instrumentation type.

LO
Instrumenting Your Design Selecting the Instrumentation
© 2014 Synopsys, Inc. Identify for Microsemi Edition Tutorial28 November 2014
4. Click OK. The eyeglass icon is replaced with a large P symbol to indicate a partially assigned bus. The symbol is blue to indicate sample only; other sample options are designated by other colors.
Note: A single bit of a bus can be instrumented by designating it as both the LSB and the MSB.
5. Again click on the wb_adr_o bus and note that the previous bit selection is displayed and that you can change the instrumentation options for that selection.
6. Select Add partial instrumentation and, in the dialog box, set MSB to 3, set LSB to 2, and leave the instrumentation options set to Sample and trigger. Click OK and note that the color of the P icon changes to yellow to indicate mixed instrumentation types (Sample only and Sample and trigger).
7. Click on the bus to see both partial instrumentations. Either can be changed from one type to another (or “not instrumented”) using the popup menu.

Selecting the Instrumentation Instrumenting Your Design
Identify for Microsemi Edition Tutorial © 2014 Synopsys, Inc.November 2014 29
Assigning Breakpoints
Breakpoints are used to trigger on reaching a branch in the code rather than triggering on a logic-level transition. For this portion of the tutorial, the arbiter entity is again used to illustrate breakpoint assignment. To assign breakpoints:
1. Again click on arb_inst (arbiter) in the hierarchy browser to update the instrumentation window with the arbiter entity.
2. In the source code display, scroll down to the case statement beginning on line 88. Click on the first five breakpoint buttons in the left margin on lines 90, 91, 93, 95, and 97. The buttons change from clear to green to indicate that they are active.
Similar to the watchpoint selection, the Identify instrumentor displays the commands that you would enter manually or in a shell script to define the breakpoints.
LO
Instrumenting Your Design Configuring the IICE
© 2014 Synopsys, Inc. Identify for Microsemi Edition Tutorial30 November 2014
Configuring the IICE
The IICE settings common to all IICE units for an instrumentation are set in the project window, and the individual IICE settings unique to each IICE in a multi-IICE configuration are set on the IICE Configuration dialog box.
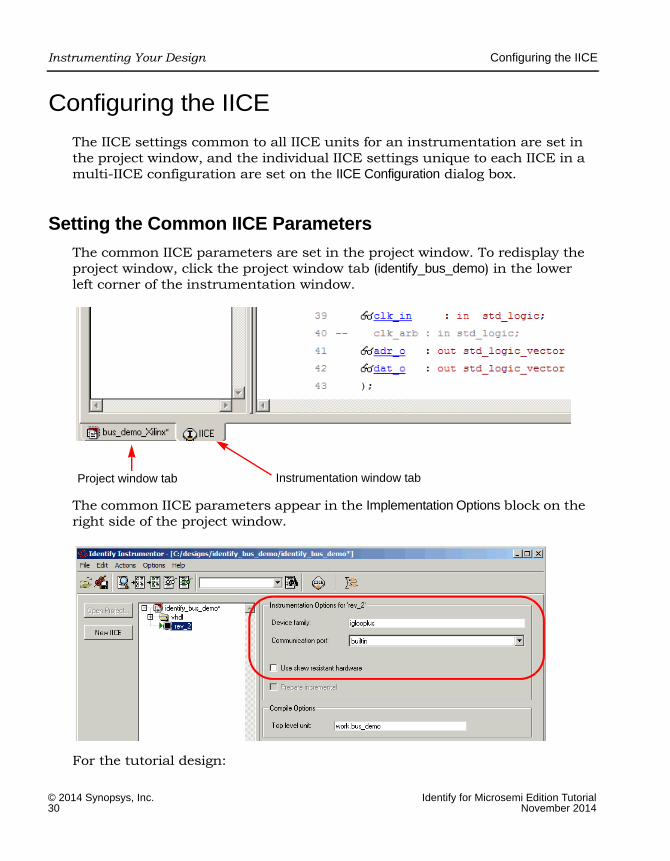
Setting the Common IICE Parameters
The common IICE parameters are set in the project window. To redisplay the project window, click the project window tab (identify_bus_demo) in the lower left corner of the instrumentation window.
The common IICE parameters appear in the Implementation Options block on the right side of the project window.
For the tutorial design:
Project window tab Instrumentation window tab

Configuring the IICE Instrumenting Your Design
Identify for Microsemi Edition Tutorial © 2014 Synopsys, Inc.November 2014 31
• The device family (iglooplus) is specified in the synthesis tool and reported in the Device family field from the -technology entry in the project file.
• Communication between the Identify debugger and the hardware is specified by the JTAG port field. For the tutorial, make sure that builtin is specified.
• Leave the Use skew resistant hardware check box unchecked.
Setting the Individual IICE Parameters
The individual IICE parameters are set by tabs on the IICE Configuration dialog box. Click on the Edit IICE settings icon on the toolbar or select Actions->Configure IICE from the menu to bring up the IICE Sampler tab shown in the following figure.
The IICE Sampler tab defines the current IICE unit, buffer type, sample depth of the data sampling hardware, controls the three optional sampling modes, and defines the sample clock and clock edge.
For the tutorial design:

LO
Instrumenting Your Design Configuring the IICE
© 2014 Synopsys, Inc. Identify for Microsemi Edition Tutorial32 November 2014
• Leave the Buffer type set to internal_memory (only available selection).
• Set the Sample depth to 4096 (use the up/down arrows).
• Leave the Allow qualified sampling check box unchecked.
• Leave the Allow always-armed sampling check box unchecked.
• Leave the Allow data compression check box unchecked.
• Make sure that the Sample clock specifies /beh/arb_inst/clk and that Positive is selected for Clock edge. Note that the sample clock was instrumented at the beginning of the tutorial; to change the clock edge, you must use the IICE Sampler tab.
After you have set and/or verified the above IICE Sampler tab settings, click the IICE Controller tab.
On the IICE Controller tab:
• Make sure that the Complex counter triggering radio button is selected and that the Width is set to 16.
Configuring the IICE Instrumenting Your Design
Identify for Microsemi Edition Tutorial © 2014 Synopsys, Inc.November 2014 33
• Leave the Import external trigger signals field set to 0 (disabled).
• Leave the Export IICE trigger signal check box unchecked.
• The Allow cross-triggering in IICE selection is currently disabled (grayed-out); this selection will be enabled when a second IICE unit is added as described in the next section.
When all of the IICE configuration settings have been made or verified, click the OK button at the bottom of the dialog box.
Creating a Second IICE
A second IICE unit is used with the tutorial to create a trigger event to illus-trate cross triggering. Identify supports multiple instances of IICE units to allow multiple instrumentations of a design to exist concurrently. The individual instrumentations do not interfere with one another and support triggering in different clock domains. To create a second IICE unit:
1. Redisplay the project window by clicking the project window tab (identify_bus_demo) in the lower left corner of the instrumentation window.
2. Click the New IICE button to add the second IICE unit (IICE_0). When you click the button, the instrumentation window is redisplayed with the second IICE tab (IICE_0) active and with all of the watchpoints and breakpoints unselected.
3. Expand the beh block in the hierarchy browser by clicking on the ‘+’ sign adjacent to the block and click blk_xfer_inst (block_xfer).
4. Instrument the wb_clk_i signal on line 43 as the sample clock.
5. Instrument the wb_cyc_o signal on line 38 for sample and trigger.
6. Click the Edit IICE settings icon in the toolbar to open the Configure IICE parameters dialog box.
7. On the IICE Sampler tab, make sure that the Sample depth is set to 128. Note that the Current IICE field reports IICE_0 and that the sample clock is /beh/blk_xfer_inst/wb_clk_i.

LO
Instrumenting Your Design Configuring the IICE
© 2014 Synopsys, Inc. Identify for Microsemi Edition Tutorial34 November 2014
8. Select the IICE Controller tab and make sure that the Simple triggering radio button is selected.
9. Make sure that the Allow cross-triggering in IICE check box is not checked and then click OK to close both tabs.

Writing the Instrumented Design Instrumenting Your Design
Identify for Microsemi Edition Tutorial © 2014 Synopsys, Inc.November 2014 35
Writing the Instrumented Design
To write the instrumented design, select File->Save project instrumentation from the menu or click on the Save project’s activated instrumentation icon on the toolbar. Saving the project automatically adds a set of files to the Identify implementation directory (rev_2). These files are subse-
quently used by the Synplify Pro synthesis tool to insert the instrumented logic into the design netlist.
The information at the bottom of the display reports the total number of instrumented signals to implement in each IICE. To display the FPGA resource estimates for the selected IICE unit, click the IICEs resource estimation icon.
After several seconds, an estimate of the additional resource requirements is reported at the bottom of the display.
The tutorial implements a small design on a large FPGA, and the additional IICE resources are not an issue. Implementing designs that approach the capacity of an FPGA can limit the amount of instrumentation logic (watch-points and breakpoints) that can be included.
For the tutorial, the IICE is configured to use the built-in communications mode. If you had selected the soft JTAG port setting, four extra ports (three input and one output) would have been added to your design. If this was the case, you would have to provide access to these ports on your board to connect the JTAG communication cable to these ports (see the User Guide for more information).
This concludes the instrumentation phase of the tutorial. You can now close the Identify instrumentor.

LO
Instrumenting Your Design Writing the Instrumented Design
© 2014 Synopsys, Inc. Identify for Microsemi Edition Tutorial36 November 2014

Identify for Microsemi Edition Tutorial © 2014 Synopsys, Inc.November 2014 37
C H A P T E R 4
Implementing the Design
At this time, you should have successfully completed the instrumentation of the tutorial design and saved the instrumented project.
Implementing the design involves the following steps:
• Synthesizing the instrumented VHDL or Verilog
• Placing and routing the design to produce a bit file
• Programming the device with the bit file
Synthesis translates the instrumented VHDL or Verilog code to a mapped netlist. Place-and-route tools further process this EDIF netlist to create the implementation of the instrumented design.
Synthesis
The Identify Microsemi Edition tool set is explicitly designed to work with the Synplify Pro synthesis tool. When you save the activated instrumentation for your project at the end of the instrumentation phase, several new files are created. These files include:
• identify.idc – this file is created in the implementation (rev_2) directory and describes instrumentation design constraints. In the synthesis tool, the pre-mapper reads the constraints from this file to insert the instrumen-tation logic into the design

LO
Implementing the Design Synthesis
© 2014 Synopsys, Inc. Identify for Microsemi Edition Tutorial38 November 2014
• syn_dics.cdc – this file is created in the instr_sources subdirectory in the implementation directory and consists of compiler design constraints specific to the instrumentation. At the start of compilation in the synthesis tool, the compiler reads the constraints and adds the appro-priate hyper-source attributes to the gate-level netlist file.
• syn_dics.sdc – this file is created in the instr_sources subdirectory in the implementation directory and includes the timing constraints for the instrumentation logic.
• IICE_mdic2signal.txt and IICE_0_mdic2signal.txt – these text files are created in the top (identify_bus_demo) directory and describe register links for the instrumented signals for each IICE.
Unlike previous Identify releases, the instrumented logic is not inserted into the RTL netlist and is only visible in the gate-level netlist.
Synthesizing the Bus Demo Design
To synthesize the instrumented bus-demo design:
1. In the project view, right click on the identify implementation (rev_2) and select Add Place & Route from the popup menu to display the Add New Place & Route Task dialog box.
2. In the dialog box, make sure that Run Place & Route after synthesis is checked and click OK

Synthesis Implementing the Design
Identify for Microsemi Edition Tutorial © 2014 Synopsys, Inc.November 2014 39
3. In the project view, make sure that pr_1 - Actel P&R is checked in the Identify implementation. The following figure shows the final project view with the added file.
4. Click the Run button or select Run->Run from the menu bar to synthesize the tutorial design. When prompted to save the changes to your project, click Yes.
When synthesis is complete, you can view the inserted comm and IICE blocks in the Technology (srm) view.

LO
Implementing the Design Place and Route
© 2014 Synopsys, Inc. Identify for Microsemi Edition Tutorial40 November 2014
Place and Route
After synthesis, run the resulting (EDIF) netlist file generated by the Synplify Pro synthesis tool through the Libero place and route tool. Running the file of the instrumented design through place and route is identical to running place and route on the original design. Refer to your place and route tool documentation for further information.
If you selected the soft JTAG port setting, four external ports are added to the tutorial design. These ports are:
• identify_jtag_tdi (input serial data IN signal.)
• identify_jtag_tck (input asynchronous clock signal)
• identify_jtag_tms (input control signal)
• identify_jtag_tdo (output serial data OUT signal.)
You must provide proper pin locations for these ports to your place and route tools. These pins must be connected to your JTAG cable to enable communi-cation with the Identify debugger. Please refer to the user guide for more information about this process.
IICE
comm_block
IICE_0

Program the Device Implementing the Design
Identify for Microsemi Edition Tutorial © 2014 Synopsys, Inc.November 2014 41
Program the Device
Programming the target device with the bit file of the instrumented design is identical to programming the target device with the original design’s bit file. Please refer to your programming tool documentation for further information.

LO
Implementing the Design Program the Device
© 2014 Synopsys, Inc. Identify for Microsemi Edition Tutorial42 November 2014

Identify for Microsemi Edition Tutorial © 2014 Synopsys, Inc.November 2014 43
C H A P T E R 5
Debugging Your Design
This chapter shows you how to debug the tutorial design you instrumented earlier. To proceed with debugging, your design must be synthesized, run through place and route, and programmed into the FPGA device. Also, the device must be connected to the host machine using the proper cable and pin connections.
The debugging process consists of setting up the debugging environment, enabling triggers in the IICE, and examining the data downloaded from your hardware. The debug flow is:
• Launching the Identify Debugger
• Specifying the JTAG Cable
• Setting Up Triggers and Capturing Data
• Generating Waveforms

LO
Debugging Your Design Launching the Identify Debugger
© 2014 Synopsys, Inc. Identify for Microsemi Edition Tutorial44 November 2014
Launching the Identify Debugger
You can launch the Identify debugger directly from the Synplify Pro synthesis tool or you can open the Identify debugger from the GUI and then use the Identify debugger Open Project File dialog box to open your synthesis project. Launching the debugger from the Synplify Pro synthesis tool simplifies the procedure by using the currently active Identify implementation.
To launch the Identify debugger from the Synplify Pro synthesis tool:
1. Open the identify_bus_demo project in the Synplify Pro synthesis tool and highlight the Identify implementation in the Project view.
2. With the right mouse button, select Launch Identify Debugger from the popup menu or click the Launch Identify Debugger icon in the top menu bar.
3. When prompted to save your project changes, click OK to launch the Identify debugger.

Specifying the JTAG Cable Debugging Your Design
Identify for Microsemi Edition Tutorial © 2014 Synopsys, Inc.November 2014 45
Launching the Identify debugger from the Synplify Pro synthesis tool:
• Brings up the Identify debugger graphical interface.
• Displays the design hierarchy and the HDL file content with the previ-ously instrumented watchpoints and breakpoints visible.
Only the instrumentation that you entered previously with the Identify instrumentor is displayed in the Identify debugger.
Specifying the JTAG Cable
The type of cable used to communicate with the FPGA must be specified so that the correct protocol is used to communicate with the physical device. The JTAG cable and cable port are set in the Communication settings section of the project window after the project is read in. To restore this window, click the identify_bus_demo tab at the bottom of the window.
The hardware used to develop this tutorial used a flashPro USB cable – your cable type may differ. The Microsemi_BuiltinJTAG setting enables you to use any of the flashPro cables.

LO
Debugging Your Design Specifying the JTAG Cable
© 2014 Synopsys, Inc. Identify for Microsemi Edition Tutorial46 November 2014
After completing the computer-to-board cable interface, use the com check command to verify that the JTAG cable is connected properly and that the Identify debugger recognizes the instrumented design in the JTAG chain. For more information, see Chapter 9, Connecting to the Target System, in the User Guide.
Setting Up Triggers and Capturing Data Debugging Your Design
Identify for Microsemi Edition Tutorial © 2014 Synopsys, Inc.November 2014 47
Setting Up Triggers and Capturing Data
Trigger operations include:
• Triggering on a Watchpoint
• Triggering on a Breakpoint
• Using the Complex Counter
• Cross Triggering
Triggering on a Watchpoint
A watchpoint trigger can be specified on any sampled signal. The Watchpoint Setup dialog box contains a full HDL parser so that any legal VHDL or Verilog expression that evaluates to a constant can be used. When the signal with the watchpoint trigger changes to the value of the watchpoint expression, the Identify debugger triggers.
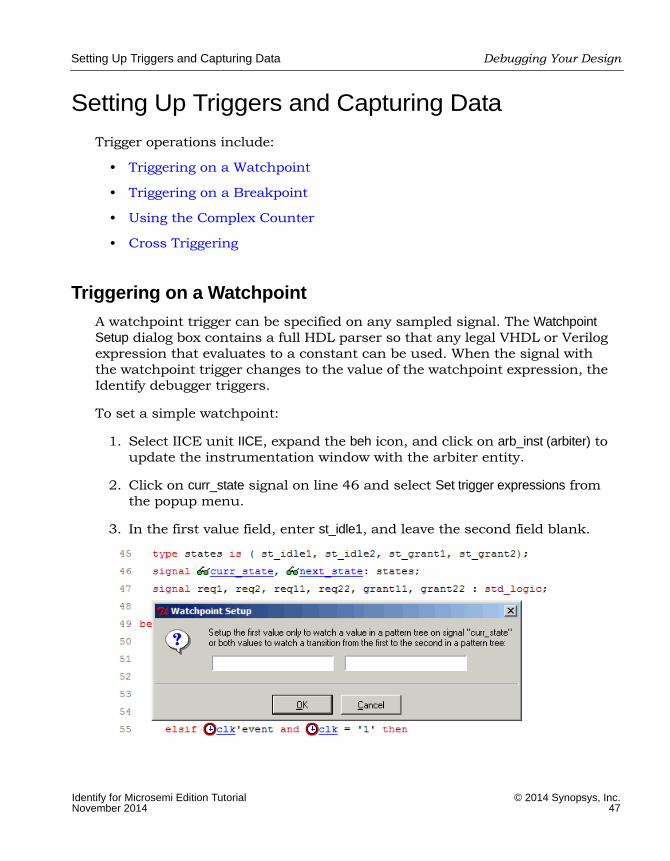
To set a simple watchpoint:
1. Select IICE unit IICE, expand the beh icon, and click on arb_inst (arbiter) to update the instrumentation window with the arbiter entity.
2. Click on curr_state signal on line 46 and select Set trigger expressions from the popup menu.
3. In the first value field, enter st_idle1, and leave the second field blank.
LO
Debugging Your Design Setting Up Triggers and Capturing Data
© 2014 Synopsys, Inc. Identify for Microsemi Edition Tutorial48 November 2014
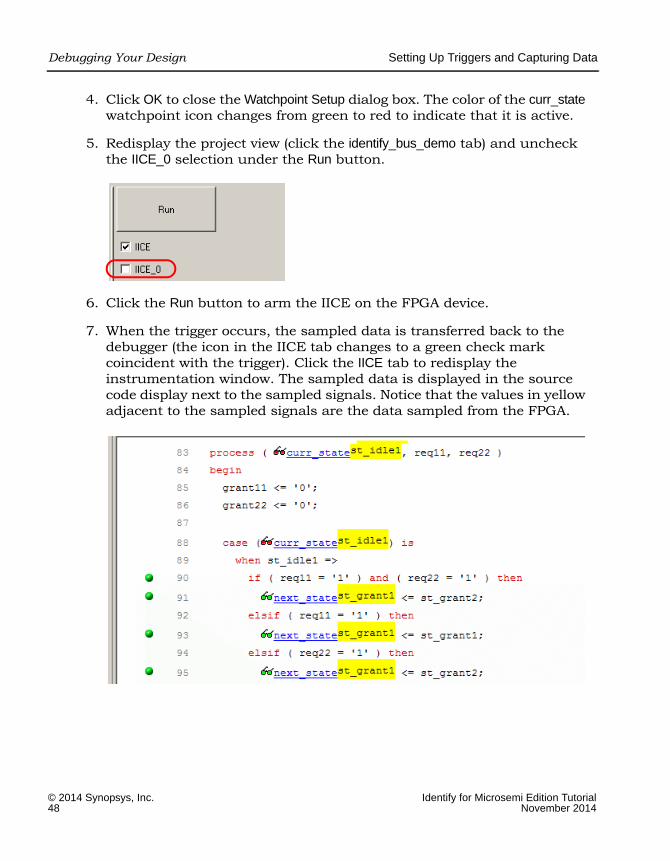
4. Click OK to close the Watchpoint Setup dialog box. The color of the curr_state watchpoint icon changes from green to red to indicate that it is active.
5. Redisplay the project view (click the identify_bus_demo tab) and uncheck the IICE_0 selection under the Run button.
6. Click the Run button to arm the IICE on the FPGA device.
7. When the trigger occurs, the sampled data is transferred back to the debugger (the icon in the IICE tab changes to a green check mark coincident with the trigger). Click the IICE tab to redisplay the instrumentation window. The sampled data is displayed in the source code display next to the sampled signals. Notice that the values in yellow adjacent to the sampled signals are the data sampled from the FPGA.
Setting Up Triggers and Capturing Data Debugging Your Design
Identify for Microsemi Edition Tutorial © 2014 Synopsys, Inc.November 2014 49
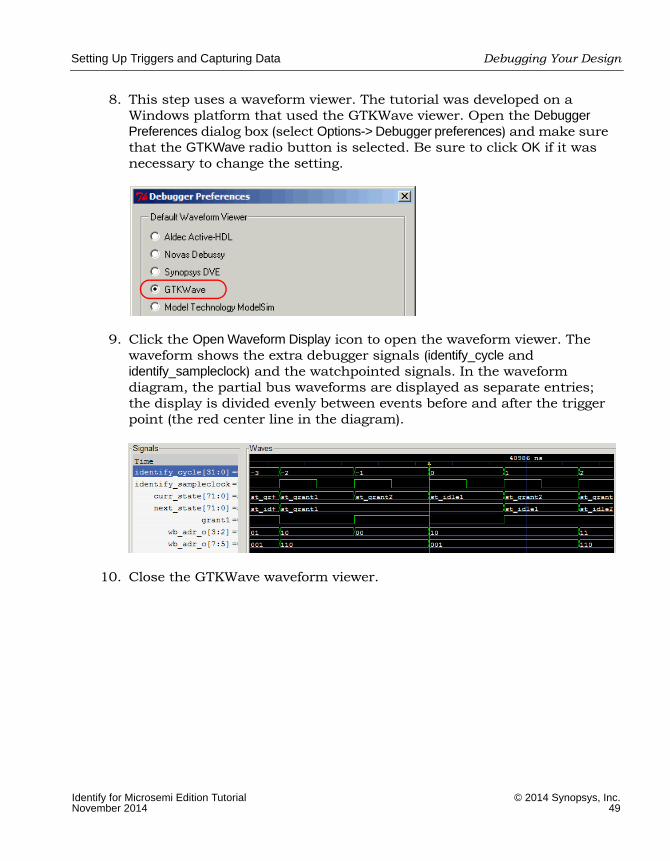
8. This step uses a waveform viewer. The tutorial was developed on a Windows platform that used the GTKWave viewer. Open the Debugger Preferences dialog box (select Options-> Debugger preferences) and make sure that the GTKWave radio button is selected. Be sure to click OK if it was necessary to change the setting.
9. Click the Open Waveform Display icon to open the waveform viewer. The waveform shows the extra debugger signals (identify_cycle and identify_sampleclock) and the watchpointed signals. In the waveform diagram, the partial bus waveforms are displayed as separate entries; the display is divided evenly between events before and after the trigger point (the red center line in the diagram).
10. Close the GTKWave waveform viewer.

LO
Debugging Your Design Setting Up Triggers and Capturing Data
© 2014 Synopsys, Inc. Identify for Microsemi Edition Tutorial50 November 2014
11. From the hierarchy browser, click block_xfer_inst (block_xfer) to view the partially instrumented wb_adr_o bus. The values of the instrumented segments of the bus (bits 7 through 5 and bits 3 and 2) are displayed, while the uninstrumented bits are displayed as question marks (?) to represent an unknown value.
12. Change the trigger position from middle to early using the early, trigger-position button on the left.
13. Select Debug->Run from the menu or click the Arm selected IICE(s) for triggering icon (the running man icon in the menu bar) to generate a new trigger.
14. Open the waveform viewer. The sample time remains unchanged, but the position of the entire waveform shifts so that ninety percent of the samples are visible prior to the trigger (the red line) and ten percent are visible following the trigger.
Triggering on a Breakpoint
The next sequence switches from watchpoint triggering to simple breakpoint triggering. To setup a breakpoint in the arbiter:
1. Close the waveform viewer if you have not already done so.
2. In the hierarchy browser, click arb_inst (arbiter) to redisplay the arbiter in the instrumentation window.
3. Click the curr_state signal and select Watch from the popup menu to toggle the watchpoint off. The lens changes from red to green indicating that you have deactivated the watchpoint trigger.
Early Middle Late

Setting Up Triggers and Capturing Data Debugging Your Design
Identify for Microsemi Edition Tutorial © 2014 Synopsys, Inc.November 2014 51
4. Click on the green breakpoint button below the case statement on line 90. The icon turns red to indicate that the breakpoint has been activated. This breakpoint is set to trigger when the curr_state signal has the value st_idle1 on the positive edge of the sample clock. Other breakpoint buttons can also be used for the breakpoint.
5. Now that you have an active trigger condition, arm the IICE trigger circuits by doing one of the following:
– Clicking the Arm selected IICE(s) for triggering (running man) icon in the menu bar
– Selecting Debug->Run from the top menu
– Redisplaying the project window and then clicking the large Run button
Note: Using the Run button in the project window allows you to indi-vidually select multiple IICE units (necessary when performing cross triggering); the menu selections only arm the active IICE.
The IICE now waits for the trigger to occur. When the trigger occurs, the sampled data is transferred back to the debugger where it is displayed in the source code display next to the sampled signals as shown in the following figure.
LO
Debugging Your Design Setting Up Triggers and Capturing Data
© 2014 Synopsys, Inc. Identify for Microsemi Edition Tutorial52 November 2014
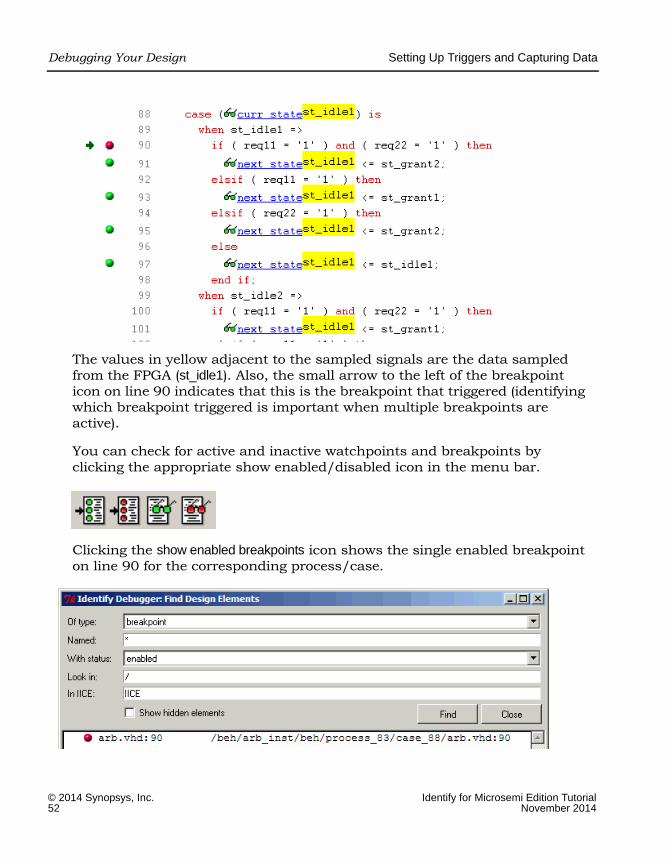
The values in yellow adjacent to the sampled signals are the data sampled from the FPGA (st_idle1). Also, the small arrow to the left of the breakpoint icon on line 90 indicates that this is the breakpoint that triggered (identifying which breakpoint triggered is important when multiple breakpoints are active).
You can check for active and inactive watchpoints and breakpoints by clicking the appropriate show enabled/disabled icon in the menu bar.
Clicking the show enabled breakpoints icon shows the single enabled breakpoint on line 90 for the corresponding process/case.

Setting Up Triggers and Capturing Data Debugging Your Design
Identify for Microsemi Edition Tutorial © 2014 Synopsys, Inc.November 2014 53
As with watchpoint triggering, you can change where the trigger point is in the buffer by selecting one of the Early, Middle, or Late icons and again arming the IICE. The trigger location changes the next time the IICE triggers.
The Cycle display in the middle of the menu bar shows the value zero. This is the point in the sample data buffer where the trigger occurred. By clicking on the up-down arrows on the right, you can increase or decrease the cycle count to display the data values before and after the trigger point.
Using the Complex Counter
The tutorial design is instrumented using a 16-bit complex counter. Up to this point, the design has been debugged without using the counter. The counter is disabled by setting the counter mode to events (the default) and setting the counter value to 1.
There are four, complex counter operating modes:
• cycles – triggers on value n number of clock cycles after the condition.
• events – triggers on the nth iteration of a trigger condition.
• pulsewidth – triggers when the condition has been active for n clock cycles.
• watchdog – triggers when the condition has been inactive for n clock cycles.
For this portion of the tutorial, the complex counter remains in the events mode and uses a large counter value to step through individual debug events. To use the complex counter:
1. Deactivate the previously set breakpoint at line 90.
2. Click on the curr_state watchpoint and select Set trigger expression from the popup menu.
3. Enter st_grant2 in the left box (replacing st_idle1) and click OK.
4. Enter 10000 in the Value field to the right of the Complex Counter Mode field.

LO
Debugging Your Design Setting Up Triggers and Capturing Data
© 2014 Synopsys, Inc. Identify for Microsemi Edition Tutorial54 November 2014
5. Select Debug->Run from the menu or click the Arm selected IICE(s) for triggering (running man) icon to arm the IICE. Note that this run takes a little longer to trigger as it must wait for the 10,000th event (st_grant2) to occur.
6. Set the Complex Counter Mode to cycles and enter 3 in the Value field as shown in the following figure.
7. Click on the curr_state signal and select Set trigger expression. Enter st_idle1 in the left field and st_grant2 in the right field of the Watchpoint Setup dialog box.
8. Select Debug->Run from the menu or click the Arm selected IICE(s) for triggering icon to arm the trigger.
9. View the resulting waveform and verify that the trigger occurs three cycles after the curr_state signal transitions from st_idle1 to st_grant2.

Setting Up Triggers and Capturing Data Debugging Your Design
Identify for Microsemi Edition Tutorial © 2014 Synopsys, Inc.November 2014 55
10. Close the viewer.
11. Set the Complex Counter Mode to pulsewidth.
12. Set the counter Value to 5.
13. Click curr_state, select Set Trigger Expression, and enter st_idle1 in the left field; leave the right field blank and click OK.
14. Select Debug->Run from the menu or click the Arm selected IICE(s) for triggering icon to arm the trigger.
15. View the resulting waveform and note that the trigger occurs on the fifth rising clock edge after the curr_state signal transitions to st_idle1.
16. Close the waveform viewer.
Cross Triggering
Cross triggering (triggering between two IICE units to debug logic across clock domains) is described in this section. The design used with the development of this tutorial has two clock oscillators, a 33 MHz oscillator and a 50 MHz oscillator. Signals between the arbiter and the other logic are synchronized in the design with these clocks.
For this section of the tutorial, you will use IICE_0 which you previously instrumented in the block_xfer module and which is clocked by the 50 MHz oscillator as a trigger for the first IICE unit (IICE). This first IICE unit was instrumented in the arbiter module and is being clocked by the 33 MHz clock. When the arbiter sees the request from the block_xfer module, it changes to state st_grant2 to process the request. Triggering the IICE module occurs when IICE_0 triggers on the request and the state changes.

LO
Debugging Your Design Setting Up Triggers and Capturing Data
© 2014 Synopsys, Inc. Identify for Microsemi Edition Tutorial56 November 2014
To demonstrate cross triggering between clock domains:
1. Select the IICE (left) tab and set the Cross trigger mode to trigger on after-IICE_0.
If the drop-down menu is blank, the Allow cross-triggering in IICE checkbox on the IICE Controller tab for IICE unit IICE has not been checked in the Identify instrumentor and you must go back to the Identify instrumentor and enable the checkbox. Click File->Save activations to save your current settings before exiting the Identify debugger
2. Set the Complex Counter Mode back to events and enter 1 in the Value field.
3. Click on the curr_state signal on line 46 and set the trigger expression to st_grant2, and click OK.
4. Click on the IICE_0 tab and verify that the Cross trigger mode is set to disabled.
5. In the hierarchy window, expand the beh block and select blk_xfer_inst (block_xfer).
6. In the instrumentation window for IICE_0, click on wb_cyc_o on line 38 and select Set trigger expressions from the popup menu to display the

Setting Up Triggers and Capturing Data Debugging Your Design
Identify for Microsemi Edition Tutorial © 2014 Synopsys, Inc.November 2014 57
Watchpoint Setup dialog box. Enter ‘1’ (with the single quote marks) in the first field and click OK; the watchpoint icon turns red to indicate that it is enabled.
7. Open the project window by clicking the identify_bus_demo tab. Select the Run button to arm the two IICE modules. IICE_0 triggers itself when the request is active and also triggers the first IICE unit (IICE). When this IICE triggers, the run is complete.
Note: Using the Run button in the project window allows you to indi-vidually select multiple IICE units (necessary when performing cross triggering); the menu selections only arm the active IICE.
8. Click the IICE tab and note that the run has completed and that values are annotated in the code.
9. Advance and retard the cycle count using the up and down buttons to see the values of the instrumented signals change.
10. Close the debugger. The lab is complete.

LO
Debugging Your Design Generating Waveforms
© 2014 Synopsys, Inc. Identify for Microsemi Edition Tutorial58 November 2014
Generating Waveforms
The data captured from the design can be displayed as waveform data by using a waveform viewer. Viewer setup is controlled by the Debugger Prefer-ences dialog box. Selecting Options->Debugger preferences from the menu bar brings up the dialog box shown below.
The Period field sets the period for the waveform display and is independent of the design speed.
After running the Identify debugger, the waveform viewer is displayed by selecting Window->Waveform from the menu or by clicking the Open Waveform Display icon in the menu bar.
All sampled signals in the design are included in the waveform display. Two additional signals are automatically added to the top of the display. The first signal, identify_cycle, reflects the trigger location in the sample buffer. The second signal, identify_sampleclock, is a reference that shows every clock edge.