microfluidic molecular and cellular detection of …
TRANSCRIPT

The Pennsylvania State University
The Graduate School
MICROFLUIDIC MOLECULAR AND CELLULAR DETECTION OF MALARIA
TOWARDS ELIMINATION
A Dissertation in
Electrical Engineering
by
Gihoon Choi
2020 by Gihoon Choi
Submitted in Partial Fulfillment of the Requirements
for the Degree of
Doctor of Philosophy
August 2020

ii
The dissertation of Gihoon Choi was reviewed and approved by the following:
Weihua Guan
Assistant Professor of Electrical Engineering
Dissertation Advisor
Chair of Committee
Aida Ebrahimi
Assistant Professor of Electrical Engineering
Zhiwen Liu
Professor of Electrical Engineering
Pak Kin Wong
Professor of Biomedical Engineering
Kultegin Aydin
Professor of Electrical Engineering
Head of the Department of Electrical Engineering

iii
ABSTRACT
Malaria is a mosquito-borne disease caused by Plasmodium parasites, predominately in resource-
limiting areas. With the significant progress in malaria controls during the past decade, WHO
endorsed the ambitious goal of achieving malaria elimination. Since low-level malaria infection is
highly distributed in the elimination-phase countries, the elimination strategy involves (1)
identification of asymptomatic carriers to reduce the parasite reservoir and (2) interruption of the
malaria transmission vector.
The work presents the microfluidic tools that facilitate point-of-care nucleic acid testing (NAT) and
cell mechanotyping (i.e., label-free cell deformability sensor and deformability-activated cell
sorting) towards the malaria elimination. While point-of-care NAT opens up extensive remote
diagnostic opportunities in resource-limited regions, cell mechanotyping can be used to explore the
underlying mechanism of the transmission vector.
The thesis will describe the single- and quad-plex point-of-care NAT systems, which deliver highly
sensitive molecular answers within 40 minutes from raw whole blood samples. Scalable parasite
DNA sample preparation and subsequent real-time loop-mediate isothermal amplification (LAMP)
were seamlessly integrated on a single microfluidic reagent compact disc. The combination of the
sensitivity, specificity, cost, and scalable sample preparation suggests effective and accurate
malaria screening in the field.
To provide tools for a microfluidic cell mechanotyping study, we developed a constriction-based
cell deformability sensor. Cell deformability is an excellent label-free biomarker for cell
abnormalities. The sensor indirectly measures the cell deformability by probing the transit time
during cell translocation events at micro-constriction. We successfully evaluated the sensor

iv
performance by achieving the high-throughput parasitemia measurement and parasite stage
determination and demonstrated cell deformability is an excellent label-free biomarker for malaria
infection. Using this biophysical marker, we demonstrated a single-cell-resolved, cytometry-like
deformability-activated cell sorting in the continuous flow to enrich the gametocytes from the crude
blood samples. Finally, we demonstrated the constriction-based multichannel resistive pulse
sensor, integrated with time-division multiplexing accessing (TDMA) methodology to further
improve deformability measurement and deformability-activated sorting throughput with
maintaining the scalability.
We envision that point-of-care NAT and microfluidic cell mechanotyping devices will provide
early and accurate malaria screening in the field and in-depth of understanding of overall malaria
pathophysiology and underlying mechanism of the malaria transmission vector.

v
TABLE OF CONTENTS
LIST OF FIGURES ................................................................................................................. ix
LIST OF TABLES ................................................................................................................... xv
ACKNOWLEDGEMENTS ..................................................................................................... xvi
Chapter 1 Introduction and Overview ................................................................................... 1
1.1. Background .............................................................................................................. 1
1.2. Overview of work presented .................................................................................... 3
Chapter 2 Singleplex Highly Sensitive and Field-deployable Malaria Nucleic Acid Testing for
Low-density Detection ............................................................................................................. 5
2.1. Introduction to point-of-care nucleic acid testing .................................................... 6
2.2. Loop-mediated isotherm amplification assay development ..................................... 7
2.2.1. LAMP master mix ......................................................................................... 7
2.2.2. Validation of LAMP assays for P. falciparum, P. vivax, and pan-plasmodium ...................................................................................................... 10
2.2.3. Thermostability of LAMP reagents ............................................................... 11
2.3. Charge-switchable magnetic bead-based parasite DNA preparation ....................... 13
2.4. Singleplex instrumentation integration .................................................................... 14
2.4.1. Analyzer ......................................................................................................... 14
2.4.2. Microfluidic reagent compact cartridge design and fabrication .................... 17
2.5. Working principle of streamlined DNA sample preparation on the cartridge ......... 19
2.6. Magnetic bead-based P. falciparum gDNA sample preparation on tube ................. 20
2.7. LAMP assay test on the cartridge using purified P. falciparum gDNA ................... 21
2.8. Validation of streamlined sample process using Pf-infected whole blood ............... 23
2.9. Sensitivity estimation with whole blood .................................................................. 24

vi
2.10. Cost analysis ......................................................................................................... 26
2.11. Summary .............................................................................................................. 30
Chapter 3 Multiplex Real-time Fluorescence Nucleic Acid Testing For High-throughput
Malaria Screening .................................................................................................................... 31
3.1. Introduction to high-throughput nucleic acid testing in the field ............................. 32
3.2. Multiplexed instrumentation integration .................................................................. 33
3.2.1. 4-plex analyzer ............................................................................................... 33
3.2.2. 4-plex microfluidic reagent compact disc ...................................................... 35
3.3. Overall testing workflow .......................................................................................... 35
3.4. Robustness of the passive valve on the microfluidic compact disc .......................... 37
3.5. Scalable streamlined sample preparation ................................................................. 39
3.6. Multiplex parallel fluorescence sensing ................................................................... 40
3.7. Whole blood-based Pf, Pv and Pan-Plasmodium identification .............................. 42
3.8. Summary .................................................................................................................. 43
Chapter 4 High-throughput And Label-free Parasitemia Quantification For Malaria-infected
Red Blood Cells ....................................................................................................................... 45
4.1. Introduction to high-throughput parasitemia quantification by pf-iRBC deformability characterization .................................................................................. 46
4.2. Cell deformability sensing principle ........................................................................ 47
4.3. Microfluidic deformability sensor fabrication ......................................................... 49
4.4. Device characterization ............................................................................................ 50
4.5. Differentiating ring stage Pf-iRBCs and hRBCs ....................................................... 51
4.6. Parasitemia quantification ........................................................................................ 52
4.7. The ability for malaria stage differentiation ............................................................. 54
4.8. Summary .................................................................................................................. 57

vii
Chapter 5 Deformability-Activated Cell Sorting (DACS) .................................................... 58
5.1. Introduction to deformability-based sorting ............................................................. 59
5.2. Working principle .................................................................................................... 61
5.3. DACS instrumentation ............................................................................................. 63
5.3.1. Microfluidic DACS device fabrication .......................................................... 63
5.3.2. Testing Apparatus .......................................................................................... 64
5.4. Numerical simulation ............................................................................................... 65
5.4.1. Computational domain of the simulation model ............................................ 65
5.4.2. Factors affecting consecutive sensing and sorting under the worst-case scenario ............................................................................................................. 67
5.5. Validation of hydrodynamic sorting by order .......................................................... 71
5.6. Synthesis of PEGDA hydrogel beads by droplet microfluidics ............................... 72
5.7. PEGDA hydrogel microbeads as deformable gametocyte models ........................... 74
5.8. Deformability-activated sorting: throughput, purity, and efficiency ........................ 76
5.9. Summary .................................................................................................................. 79
Chapter 6 Time-division Multiplexing Accessing (TDMA) Microfluidic Device For High-
throughput Resistive Pulse Sensing ......................................................................................... 80
6.1. Introduction to microfluidic TDMA deformability sensing ..................................... 81
6.2. TDMA working principle ......................................................................................... 82
6.3. Scalability of TDMA ................................................................................................ 83
6.4. TDMA integration .................................................................................................... 84
6.4.1. Microfluidic device fabrication ..................................................................... 84
6.4.2. TDMA hardware ............................................................................................ 86
6.5. Validation of the microfluidic TDMA principle ...................................................... 88
6.5.1. Validation of 8-channel resistive pulse sensing ............................................. 88

viii
6.5.2. Analyzing particle size and concentration ..................................................... 89
6.6. Probing the particle arriving dynamics .................................................................... 93
6.7. Analyzing a mixed population ................................................................................. 94
6.8. Robustness against pore-clogging ............................................................................ 95
6.9. Summary .................................................................................................................. 96
Chapter 7 Conclusion and Perspectives ................................................................................ 97
7.1. Conclusions .............................................................................................................. 97
7.2. Future perspectives ................................................................................................... 100
Bibliography ............................................................................................................................ 103

ix
LIST OF FIGURES
Figure 2-1: Location of the LAMP target sequence and priming sites of Plasmodium falciparum (Pf: Genbank accession no. AJ276844). The core priming sites of inner/outer primers (F3/B3, F2/B2, and F1c/B1c) with additional priming sites of loop primers (LF/LB) are marked on the sequence. ....................................................................................................................................... 8
Figure 2-2: Validation of the species- and genus-specific LAMP assays using laboratory purified Pf and Pv genomic DNA. (A) Amplification curves obtained from real-time PCR. PCR grade water was used as a no template control (NTC). (B) Gel electrophoresis image (2% agarose gel). Ladder-like bands in the gel image confirm the amplicons from species- and genus-specific LAMP reactions. ....................................................................................................................................... 11
Figure 2-3: LAMP reagent thermostability test. (A) The real-time amplification curve for LAMP reagent stored at 4 °C and 25 °C. (B) Extracted amplification threshold time (Tt). At 4 °C storage temperature, the reagent shows a negligible threshold time drift for a week. At 25 °C storage, the reagent shows a drift towards higher Tt (decreased activity) over time, and no amplification is seen after day 3. The dashed line denotes the freshly prepared LAMP reagent. .................................. 12
Figure 2-4: Charge switchable magnetic bead-based method for DNA isolation. (A) pH switchable surface charge of silanol groups at silica surface. (B) DNA binding, purification and elution process on silica surface can be actuated by surrounding pH values. ........................................................ 13
Figure 2-5: Overview of the standalone and mobile nucleic acid testing system (AnyMDx). (A) Schematic diagram of the assembled AnyMDx with the reagent compact cartridge. The whole platform is of a small footprint (12×13×13 cm). The reagent compact cartridge was secured on the rotatable spindle platter. (B) Schematic diagram of functional parts in an exploded view. ......... 14
Figure 2-6: Block diagram of the AnyMDx modules. The platform consists of four main functional modules: mechanical modules (servo motor/spindle platter/compact cartridge), optical modules (LED/optical sensor), thermal modules (Peltier heater/thermal sensor), and data connectivity modules (Bluetooth). Each module was controlled by a microprocessor on a customized PCB board. The diagnostic results can be optionally reported to a smartphone user interface. ............ 15
Figure 2-7: Determination of the threshold time (Tt). A real-time amplification curve (blue) and its differential profile (dRFU/dt, orange). The threshold time (Tt) was determined at the maximum slope of RFU. (Tt: threshold time, t: time, Smax: maximum value of the slope) ............................ 16
Figure 2-8: The feedback-controlled reaction temperature profiles as a function of time. (blue curve: AnyMDx 1, red curve: AnyMDx 2)................................................................................... 17
Figure 2-9: Illustration of reagent compact cartridge. (A) Assembled view of the reagent cartridge. A test unit consists of five chambers: a DNA binding chamber (binding buffer pH 5.0), a washing chamber (washing buffer pH 7.0), a LAMP reaction chamber (master mix, pH 8.8), and two valving chambers. The lysate was prepared by collecting 10 μl of malaria-infected blood into 1 ml of lysis

x
buffer in a microcentrifuge tube. (B) Cross-sectional view of the reagent cartridge showing. All reagents are preloaded on the reagent cartridge in a ready-to-use format. ................................... 18
Figure 2-10: Illustration of integrated sample preparation and amplification steps on the reagent cartridge. By rotating the reagent cartridge against a stationary magnet in a specifically designed control sequence (steps 1-4), the pH-dependent charge switchable magnetic beads were directed from chamber to chamber, which allows for seamlessly integrated DNA binding, purification, elution, and amplification on the reagent cartridge. ...................................................................... 20
Figure 2-11: Illustration of the manual parasite genomic DNA extraction and purification procedures in a microcentrifuge tube. (B) The amplification curve for the manually extracted DNA sample on the AnyMDx instrument. The successful amplification of the tube-extracted DNA samples validates the effectiveness of the magnetic bead-based method. .................................... 21
Figure 2-12: Validation of the LAMP assay and the AnyMDx instrument with laboratory purified DNA samples. (A) Benchmarking amplification curves obtained from the real-time PCR machine. 1x, 0.1x, and 0.01x denotes the dilution factors of the P. falciparum DNA samples (NTC: No template controls, Tt: Threshold time). (B) The amplification profiles acquired from the AnyMDx instrument. (C) Gel-electrophoresis analysis on a 2% agarose gel. The amplicons show a clear ladder-like pattern, the length of which verifies the LAMP assay’s specificity against P. falciparum. (D) Emission visualized under the blue LED (λ=488 nm) illumination for various positive and negative samples. .......................................................................................................................... 22
Figure 2-13: Validation of the AnyMDx system from the whole blood sample to the amplification result with integrated sample preparation on the reagent cartridge. The % value represents the parasitemia of the infected RBCs. (hRBC: healthy RBCs, NTC: No template controls, Tt: Threshold time) .............................................................................................................................................. 24
Figure 2-14: Sensitivity test with Pf-infected whole blood sample (A) Amplification curves for 10-fold serially diluted Pf-infected whole blood samples. Healthy human blood was used as an NTC. (B) The resulting calibration curve for the whole blood sample. Standard deviation values are from triplicates. ...................................................................................................................................... 26
Figure 2-15: DNA amplification profiles of AnyMDx2. The manufacturing of the AnyMDx instrument is repeatable in a cost-effective way. We built the second instrument of AnyMDx (named AnyMDx2) and performed a similar sensitivity experiment (as described in the sensitivity section). Amplification curves from six different parasitemia samples show apparent exponential increases of fluorescence, while that of the negative controls (master mix and hRBC) shows no amplification. (RFU: relative fluorescence unit, hRBC: healthy RBCs, NC: negative control) ... 29
Figure 3-1: Overview of the device. (A) Exploded view of the device, showing the assembly of various components. (B) Schematic of the assembled device and the quadplex microfluidic reagent compact disc. The form factor of the analyzer is palm-sized. The reagent compact disc is secured to the spindle platter. A real-time fluorescence sensing scheme is integrated on the analyzer. .... 34
Figure 3-2: Workflow of the device. In step 1, whole blood is collected into the lysis buffer by the capillary tube. In step 2, the lysate is loaded into the binding chamber of the four testing units. In

xi
step 3, the disc is sealed and inserted into the analyzer, which then performs automated sample preparation and amplification. This automated process consists of four steps: binding (3 min), washing (4 min), elution (3 min), and amplification (40 min). During the amplification process, the real-time fluorescence signal from each testing unit was recorded and analyzed. Finally, in step 4, the testing results are reported. ..................................................................................................... 36
Figure 3-3: Illustration of the pinning effect and photo images of the drop test results. (A) A droplet on a solid surface with a contact angle of θ, which will be increased up to θ+α when moving towards a three-phase edge, where α is a bending angle1. This implies that larger α allows a higher activation barrier for the passive valve. (B) The drop test to evaluate the robustness of the teeth-shaped passive valves on the reagent compact disc under the harsh mechanical vibration. (N denotes the number of drops) ........................................................................................................................................ 38
Figure 3-4: Validation of the optical sensing uniformity. (A) With fluorescent calcein dye, the RFU distribution for the four optical channels was evaluated at a series of calcein concentration. A linear dependence of the RFU on the calcein concentration was observed in the range of 0.625-125 μM. The RFU variation from the four channels is small. (B) With Pf genomic DNA at constant concertation, the variations of the amplification threshold time (Tt) obtained from the real-time curve is ~1.5 min. (C) Amplification curves for 10-fold serially diluted Pf genomic DNA samples. The bottom plot shows the calibration curve for the Pf genomic DNA. Standard deviation values are from triplicates. ....................................................................................................................... 41
Figure 3-5: Species- and genus-specific tests using spiked whole blood samples. (A) The reagent compact disc was configured as species-specific tests. The testing unit 1 and 2 contains Pf- and Pv- specific primer sets, respectively. The testing unit 3 has a genus-specific primer set. Testing unit 4 is for internal negative control. (B) The result from a representative set of samples (i.e., Pf, Pv, mixed, and healthy). A threshold of 100 RFU (dashed line) is experimentally determined for positive and negative differentiation. The species information for a particular infected whole blood sample can be derived from four qualitative results on the single microfluidic disc (each row). . 43
Figure 4-1: Deformability sensor for highly-throughput and label-free parasitemia quantification. (b) The equivalent circuit model for the sensor. ........................................................................... 48
Figure 4-2: (a) Current traces measured with the mixed microbeads of 5 µm and 10 µm in diameters. (b) The scattering plot and the corresponding histogram for the measurement. ........................... 50
Figure 4-3: The current trace for the Pf-iRBC sample at 12% parasitemia. (b)-(c) The scattering plot of dwell time and current dip for the pure RBC sample (b) and the Pf-iRBC sample at 12% parasitemia (c). (d-e) Histogram plot of dwell time for the pure RBC sample (d) and the Pf-iRBC sample at 12% parasitemia (e). ..................................................................................................... 51
Figure 4-4: (a) Scattering plot of dwell time versus ΔI for RBCs with parasitemia of 12%, of 6%, 3%, 1.5%, 0.75%, 0.375%, 0.1875% and the healthy RBCs. (b) Parasitemia determined by the microfluidic deformability sensor versus the parasitemia determined by the microscopy. .......... 53
Figure 4-5: Scattering plot of transit time versus ionic current dip for the Pf-RBCs with various parasitemia for (a) ring and (b) trophozoite Pf-iRBC. Corresponding parasitemia determined by the

xii
microfluidic deformability sensor and the microscopy method for (c) ring and (d) trophozoite Pf-iRBC. Reprinted from ref. [127], Copyright 2017, with permission from Elsevier. .................... 54
Figure 4-6: Scattering plot of the current dip versus the translocation time and the corresponding histograms for (a) healthy RBCs, (b) 12% infected ring stage iRBCs, and (c) a mixture of the ring, trophozoite, and schizont stage parasites in RBCs. ...................................................................... 55
Figure 4-7: The analysis for the Pf-iRBCs at different stages during the intraerythrocytic cycles. (a) Scattering plot of transit time versus ionic current dip for the Pf-iRBC during the intraerythrocytic cycle at various time spots. (b) The parasitemia quantified by the deformability sensor and microscope during the intraerythrocytic cycles. (c) Comparison of parasitemia between the deformability sensor and the microscope. Reprinted from ref. [127], Copyright 2017, with permission from Elsevier. ............................................................................................................. 56
Figure 5-1: Deformability-activated particle sorting device principle. (A) A top-down image of the microfluidic chip with various functional parts (scale bar: 50 µm). Two sorting flows (S1 and S2) were connected to the same pressure source and independently controlled by fast-response solenoid valves (V1 and V2). The inset illustrates the micro-constriction structure for deformability sensing. (B) Transit time-based deformability measurement. (C) Hydrodynamic sorting mechanism by programming the solenoid valves V1 and V2. The left and right columns are the simulated streamlines and the observed fluorescent dye (1 mM calcein) under different combinations of pneumatic valve status. ................................................................................................................. 62
Figure 5-2: Detailed system diagram for the deformability activated sorting device. The real-time deformability sensing algorithm detects the particle transit time within a rolling sampling window, which is used to trigger a fast-switching solenoid valve for sorting. ............................................ 65
Figure 5-3: (A) Computational domain of the simulation, (B) Illustration of two adjacent particles in a continuous flow. Ts represents time spacing between particles, Vp is the particle velocity in the microfluidic channel. The minimum Ts (Tsmin) determines the maximum sorting throughput (1/Tsmin). The constant Vp is assumed for the particles traveling on the identical streamline. H, L, and W are height, length, and width of the fluidic channel in the sorting area. ............................ 67
Figure 5-4: Factors affecting consecutive sensing and sorting under the worst-case scenario. (A) Time sequence of the pressure profile for driving the two sorting flows (red for S1 and blue for S2) under the worst-case scenario. Tsens: sensing time, 𝜏𝜏: system relaxation time, Tvalve: valve pulse off time, and Ts: particle spacing time. (B) Successful sorting regions in the Tvalve - Ts plot. Successful sorting is defined as the case when the device can handle the worst-case scenario, that is when consecutive particles are alternately directed into different outlets. 1/Tsmin corresponds to the highest sorting throughput. (C) Tsmin as a function of the sample flow rate. (D) Tsmin as a function of the sorting pressure. (E) Tsmin as a function of the system relaxation time. .............................. 68
Figure 5-5: Simulation results of consecutive sorting with varying parameters. (A) Successful sorting of consecutive particles. (B) Unsuccessful sorting occurs because sorting cannot catch up with the fast appearing particles. (C) Unsuccessful sorting happens because excessive sorting pressure causes backflow. ............................................................................................................. 70

xiii
Figure 5-6: Validation of the hydrodynamic sorting by order. A single-layer microfluidic device (height and width at the constriction region are 40 and 18 µm, respectively) is used to test the particle deflection. The frames shown are in sequence. Fluorescent dye (bright area) was used to visualize the sample flow deflection (scale bar: 100 µm). ............................................................ 72
Figure 5-7: Synthesis of uniformly sized PEDGA hydrogel microbeads using microfluidic droplet generator. (A) Uniform-sized water-in-oil emulsion (scale bar: 50 µm). (B) Synthesized PEDGA hydrogel microbeads under bright-field microscopy (scale bar: 20 µm). (C) fluorescence image of PEDGA hydrogel microbeads (scale bar: 20 µm). ....................................................................... 73
Figure 5-8: Microscope images of in-house fabricated 12.5% PEGDA hydrogel beads. The bead size variation before the filtration comes from the pressure variations in the microfluidic droplet generator chip. After the filtration, uniform beads with diameters of ~14 µm were obtained. .... 73
Figure 5-9: Agarose bead synthesis using a microfluidic droplet generator. (1) Generation of agarose beads in mineral oil, (2) Agarose beads after gelation, (3) Agarose beads after washing, and dispensed into PBS solution. We found the agarose beads start to coalesce with each other after washing and dispensed into PBS solution. After about 1 hour, these agarose beads were fully dissolved into the PBS at room temperature. This behavior is likely due to our agarose beads were not strongly cross-linked. .............................................................................................................. 74
Figure 5-10: Characterization of the deformable PEGDA hydrogel beads. (A) Ionic current time traces (left), and the enlarged view of a single representative particle with the transit time denoted (right). (B) Distribution of the transit time of model deformability particles at different PEGDA concentrations (N= 1243 (7.5%), 1243 (10%), 604 (12.5%), 765 (15%), and 928 (17.5%)). The bin size is 1.1 ms. (C) Correlation between transit time and PEGDA concentration. ........................ 76
Figure 5-11: Device validation with deformability PEGDA hydrogel beads. The rigid particles (with the dye added, bright edge) and soft particles (dark) are marked with red and yellow circles, respectively. The pulse duration of the sorting signal was 40 ms in this experiment (scale bar: 100 µm). ............................................................................................................................................... 77
Figure 6-1: TDMA resistive pulse sensor working principles. (a) Time-division multiple access block diagrams. (b) Illustration of the demultiplexing algorithm. The serial signal from the multiplexer output was reconstructed for each channel. (c) Microscope images of the 8-plexed device. The enlarged image illustrates the particle translocation through the sensing pore. A micro-filter is placed upstream to reduce the potential debris. ................................................................ 83
Figure 6-2: Time trace for the 10 µm beads. (a) Representative ionic current dips (b) Enlarged the view of the current dip (red box from Figure 6-2a). The pulse has a transit time of ~8 ms and a current dip of 22 nA. (c) Histogram of transit time for 10 µm beads. The distribution shows a mean transit time of 8 ± 2.7 ms (N = 227). ............................................................................................ 84
Figure 6-3: 8-channel microfluidic device layout. The enlarged view showed the resistive pulse sensing unit, which has micropore with width, length, and height of 18 µm, 20 µm, and 35 µm, respectively. The customized tygon tubes with Ag/AgCl electrodes embedded were inserted into

xiv
common inlet and outlets on the microfluidic devices. The outlets were grounded, while the inlet was biased at a constant voltage (400 mV). .................................................................................. 85
Figure 6-4: TDMA hardware design. (a) Electronic schematic diagram. The system includes trans-impedance amplifier circuits, multiplexers, and counter circuits. DAQ provides the bias voltage for ionic current measurement and a clock signal for the 3-bit counter. External DC power source was used to provide the supply voltage for op-amps, multiplexer, JK flip-flop, and AND gate. (b) PCB layout. The PCB has dimensions of 95×62 mm and is shielded by the Faraday cage to reduce the environmental noise. ..................................................................................................................... 87
Figure 6-5: Validation of TDMA resistive pulse sensor. (a) Reconstructed current time trace for each of the eight channels. (b) Cross-correlation among different sensing channels. .................. 89
Figure 6-6: Validation of custom-built peak detection algorithm. The algorithm continuously finds the local minimum value and signal baseline. The current dip was calculated by subtracting the local minimum value from the signal baseline. Minimum peak values for individual resistive pulses were marked by blue circles. ........................................................................................................ 91
Figure 6-7: Particle size and concentration measurement. (a) Histograms of the calculated particle diameters from each individual sensing channel (NCh1:131, NCh2: 309, NCh3:104, NCh4: 97, NCh5:124, NCh6: 94, NCh7:102, NCh8: 223). Distribution of the entire particle diameter data set was plotted with Gaussian-fit (NAll: 1184). (b) Calculated concentration as a function of the counted particles. The error bars correspond to the Poisson noise. The actual polystyrene particle concentration (~2.4×10⁵ particles/ml) is indicated by the red dashed line. .......................................................................... 92
Figure 6-8: Particle translocation dynamics. (a) The normalized distribution of bead interarrival time in different channels, with exponential fits to the distributions (λch1: 3.12 s-1, λch2: 0.98 s-1, λch3: 0.79 s-1, λch4: 0.83 s-1, λch5 1.21 s-1, λch6: 0.88 s-1, λch7: 1.88 s-1, and λch8: 1.13 s-1). (b) Cumulative counted particle numbers versus the elapsed time. ....................................................................... 94
Figure 6-9: Discriminating particles of different sizes. (a) Reconstructed current time trace for each of the eight channels. (b) Enlarged view of ionic current in channel 4 (red) showing representative pulses from a mixture of 10 µm and 15 µm diameter particles. (c) Distribution of the particle size, with Gaussian-fit. A clear two population was observed. (N10µm: 1233 and N15µm: 355). (d) Microscope images showing the pore-clogging in channels 6 and 7 (Scale bar: 20 µm). ............ 95

xv
LIST OF TABLES
Table 2-1: Primer sets for the genus-, P. falciparum-, and P. vivax-specific LAMP amplification 8
Table 2-2: Reagent setup of the LAMP master mix. .................................................................... 9
Table 2-3: Cost breakdown for the AnyMDx instrument ............................................................. 27
Table 2-4: Disposable reagent compact disc cost per test............................................................. 28
Table 4-1: Summary of the microfluidic deformability characterization devices. ....................... 47
Table 5-2: Summary of the microfluidic deformability-based cell sorting devices. ..................... 60
Table 5-3: Effective sorting parameters used in the numerical simulation. .................................. 67
Table 5-4: Sorting performance metrics using model soft and rigid beads. ................................. 78

xvi
ACKNOWLEDGEMENTS
First of all, I would like to express my sincere gratitude to my research advisor, Dr. Weihua Guan,
for allowing me to conduct research and providing priceless guidance throughout my Ph.D.
program. He has taught me the methodology to carry out the research and to present the research
works as clearly as possible. It was a great privilege and honor to work and study under his guidance
as his first Ph.D. student. I am incredibly thankful for what he has offered me.
For this dissertation, I would like to thank my defense committee members: Dr. Zhewen Liu, Dr.
Aida Ebrahimi, and Dr. Pak Kin Wong for their time, guidance, and constructive comments. I also
would like to acknowledge Dr. Liwang Cui, Dr. Jun Miao, Dr. Sony Shrestha, and Xiaolian Li
in the department of entomology for sharing their knowledge and skills, that are required for
malaria-related research. I have appreciated their collaboration. In regards to the hydrogel bead
fabrication, I thank Dr. Lauren Zarzar, who shared her knowledge and helpful tips.
The work presented in this dissertation was supported in part by the National Institutes of
Health (NIH) under Grant U19AI089672 and National Science Foundation (NSF) under grant
No. ECCS-171083, 1710831, 1902503, and 1912410. Also, Penn State Award ‘Materials
Matter at the Human Level’ was also acknowledged. The views and opinions of the author
expressed herein do not state or reflect those of federal fundings, and shall not be used for
advertising or product endorsement purposes.
Finally, I am incredibly grateful to my family for their love, prayers, caring, and sacrifices. I
am very much thankful to my wife, Jina, for her love, understanding, prayers, and continuing
support to complete this research work.
Gihoon Choi

Chapter 1 Introduction and Overview
1.1. Background
Malaria is a mosquito-borne disease caused by Plasmodium parasites, predominately in resource-
limiting areas of low- and middle-income countries. According to the World Health Organization
(WHO), there were 216 million new cases, and 445,000 deaths in 2016 and approximately 2.7
billion people remain at risk globally, with most of the disease burden falling on resource-
constrained countries in Africa and sub-Saharan Africa [20]. Among five parasite species, P.
falciparum (Pf) and P. vivax (Pv) pose the greatest threat to the human. Pf is the most prevalent
malaria parasite on the African continent. Pv is the dominant malaria parasite in most countries
outside of sub-Saharan Africa. Increased malaria control efforts have resulted in a dramatic
reduction (40%) in the global malaria incidence over the past decade [20]. The WHO thus endorsed
the ambitious goal of achieving worldwide malaria elimination and eradication [20].
Malaria is caused by the infection of protozoan parasites of the Plasmodium species. During the
malaria life cycle, parasites invade red blood cells (RBCs) and undergo asexual replication. This
proliferation phase leads to a significant fraction of infected RBCs, which is the primary cause of
the pathology of malaria. Therefore, accurate and timely diagnosis and antimalarial treatment can
deter parasite growth and proliferation. After the asexual stage, only a small percentage of parasites
undergo sexual conversion to form gametocytes. Therefore, the detection of circulating
gametocytes in the bloodstream is quite challenging [21]. Although gametocytes do not cause any
clinical symptoms, they are responsible for malaria transmission to the mosquito [22, 23].

2
Consequently, the restriction of gametocyte maturation provides unique opportunities for malaria
intervention [23].
The low-level malaria infection is highly distributed in the malaria elimination-phase countries
(low prevalence setting) [20, 21]; thus, the malaria elimination strategy involves (1) identification
and treatment of asymptomatic carriers to reduce the parasite reservoir and (2) interruption of the
malaria transmission. To this end, the effectiveness of elimination strategies highly depends on
low-cost access to sensitive and specific malaria screening tests. More specifically, diagnostic
devices require detection limit lower than 2 parasites/µl for identifying asymptomatic carriers and
sexual stage gametocytes [20, 21]. However, current field-deployable technologies are limited to
achieve this level of sensitivity [24-26]. Besides, the underlying mechanism of the transmission
vector is unclear yet due to the rarity of gametocytes in the bloodstream [21, 23].
This thesis mainly focuses on microfluidic technologies that can resolve the aforementioned unmet
requirements and expedite the global efforts towards malaria elimination. The main contribution of
this thesis is as follows.
First, we provide a point-of-care nucleic acid testing (NAT) device to bring highly sensitive malaria
diagnosis to the field. While NAT has been extensively used for identifying low-level infection, it
is often inaccessible in remote settings due to the complicated steps of the nucleic acid sample
process. To bring the nucleic acid testing to the field, we integrated an energy-efficient magnetic
interaction-based streamlined sample process on a lab-on-a-disc platform. Unprecedently
integrated system has attributes of excellent sensitivity, specificity, cost, and scalability, suggesting
a useful and accurate detection of asymptomatic carriers in the field.
Second, we offer microfluidic cell mechanotyping tools (i.e., cell deformability sensor, and
deformability-activated cell sorting), which enable careful study on the pathophysiology of

3
malaria-infected red blood cells. We demonstrated that the cell deformability could be used as a
potential label-free biomarker to probe cell abnormalities and infection status. The transit time-
based cell deformability measurement facilitates rapid parasitemia analysis and parasite stage
determination. We also demonstrated the single-cell-resolved, cytometry-like deformability-
activated sorting (DACS) in the continuous flow to enrich the cells of a particular deformability
property from a heterogeneous sample. We envision that the DACS device will allow enriching
gametocytes based on their mechanical biomarker. Furthermore, it will promote biologists to
understand the underlying mechanism of the malaria transmission vector.
1.2. Overview of work presented
The first part of the thesis (Chapter 2 and Chapter 3) discusses the efforts to develop a fully
integrated "sample-to-answer" mobile NAT platform for highly sensitive and specific malaria
diagnosis in the field. Chapter 2 describes the initial version of the NAT platform as a proof-of-
concept. The novel strategy for the streamlined sample process, including nucleic acid extraction,
purification, amplification, and real-time fluorescence detection is discussed. It is demonstrated
that the system has a superior detection limit with whole blood samples. This is promising for
identifying asymptomatic carriers in the field. Chapter 3 describes the 4-plex NAT device that can
perform species-specific tests in parallel. The system is particularly useful for tracking malaria
transmission profile and their species. The second part of the work (Chapter 4 to Chapter 6)
discusses the efforts to provide microfluidic cell mechanotyping tools to explore the underlying
mechanism of malaria diseases and progression. Chapter 4 presents a rapid and label-free
microfluidic cell deformability sensor. The device uses cell deformability as a promising label-free
biomarker to quantify parasitemia and to differentiate the parasite development stage in the
bloodstream. Chapter 5 describes the "first-of-its-kind" microfluidic Deformability-Activated Cell

4
Sorting (DACS) device to collect the cells of interest based on their biophysical properties. One of
the grand challenges of a constriction-based cell deformability sensor is channel clogging. Besides,
we have explored that speed of cell deformability characterization is a rate-limiting factor for the
high-throughput deformability-activated cell sorting. Chapter 6 presents a novel scalable Time-
Division Multiplexing Accessing (TDMA) microfluidic deformability sensor array as a solution to
address the rate-limiting factor for high-throughput deformability-activated cell sorting. Finally,
Chapter 7 offers conclusions based on the work presented in the preceding chapters and
perspectives for future development.

5
Chapter 2 Singleplex Highly Sensitive and Field-deployable Malaria Nucleic Acid Testing for Low-density Detection
In this chapter, we demonstrated a standalone, “sample-in-answer-out” molecular diagnostic
system (AnyMDx) to enable a highly sensitive and quantitative molecular analysis of blood-born
malaria in low resource areas. The system consists of a durable battery-powered analyzer and a
disposable microfluidic compact cartridge loaded with reagents ready for use. A low power thermal
module and a novel fluorescence-sensing module are integrated into the analyzer for real-time
monitoring of loop-mediated isothermal nucleic acid amplification (LAMP) of target parasite
DNA. With 10 µl of a raw blood sample, the AnyMDx system automates the nucleic acid sample
preparation and subsequent LAMP and real-time detection. Under the laboratory conditions with
whole-blood samples spiked with cultured Plasmodium falciparum, we achieved a detection limit
of ~0.6 parasites/µl, much lower than those for the conventional microscopy and rapid diagnostic
tests (~50-100 parasites/µl). The turnaround time from the sample to the answer is less than 40
minutes. The AnyMDx is user-friendly, requiring minimal technological training. The analyzer and
the disposable reagent cartridge are cost-effective, making AnyMDx a potential tool for malaria
molecular diagnosis under field settings for malaria elimination.

6
2.1. Introduction to point-of-care nucleic acid testing
Toward effective malaria control, rapid, accurate, and highly sensitive diagnosis is essential for
delivering effective chemotherapies. Currently, malaria diagnosis under field settings relies
exclusively on traditional microscopy (thin and thick blood smears) and immunological rapid
diagnostic tests (RDTs, detecting antigens in human blood) with a detection limit of 50 – 100
parasites/μL [25, 27, 28]. Such a detection limit would inevitably miss malaria cases with much
lower parasitemias, which are especially common in asymptomatic parasite carriers [29-32]. Thus,
malaria diagnostic tools with significantly improved sensitivity are urgently needed for endemic
settings, especially for regions planning for malaria elimination.
Modern nucleic acid testing (NAT) methods of malaria detection enable much higher sensitivity
with a detection limit of <1 parasite/μL depending on the assay type [28, 31, 33-35], which is highly
desirable for identifying asymptomatic infections [27, 31, 36]. Sensitive detections of malaria
parasites in these subpopulations, which are considered as essential reservoirs of transmission, are
particularly important for malaria elimination [31, 37]. Among various molecular amplification
assays (recombinase polymerase amplification [38, 39], helicase dependent amplification [40]),
loop-mediated isothermal DNA amplification (LAMP) has emerged as a promising technology for
field use due to its simplicity, rapidness, sensitivity, and specificity [28, 41-54]. The major
advantages of using LAMP include its high specificity, robustness against inhibitors, and fast
amplification [55-57]. Unfortunately, most LAMP-based diagnosis still involves bulky and costly
peripheral equipment, and skilled technicians are often required for manually operating the
instrument [28, 58] and performing multiple steps of sample preparation [59-62]. Moreover,
necessary infrastructures such as electricity for powering instruments are often limited in remote
malaria clinical settings [63-65]. Therefore, there is a strong desire to develop a molecular
diagnostic system that can be more easily deployed to remote malaria-endemic areas. Although

7
extensive efforts have been undertaken towards this goal [66, 67], a true “sample-in-answer-out”
NAT system with real-time quantitative capability has yet to be developed.
A field-deployable molecular malaria diagnostic platform should possess the following attributes:
i) standalone and portable for field applications; ii) true sample-in-answer-out without much user
intervention; iii) seamlessly integrated and automated DNA sample preparation, iv) real-time
quantitative fluorescence detection; v) rapid and suitable for diagnosis in clinical settings, and vi)
much higher sensitivity allowing detection at low parasitemias.
Here we report the design of a molecular diagnostic system for malaria, named AnyMDx, which
consists of a small-footprint analyzer and disposable microfluidic compact cartridge that are
preloaded with molecular reagents for the LAMP assay. With minimal manual work, the AnyMDx
could deliver sensitive molecular diagnostic results directly from a small volume of blood samples
within 40 minutes without any requirement of laboratory infrastructures. The standalone and user-
friendly AnyMDx instrument is highly promising for sensitive malaria diagnosis in field settings.
2.2. Loop-mediated isotherm amplification assay development
2.2.1. LAMP master mix
The LAMP reaction mix consists of isothermal buffer (20 mM Tris-HCl, 10 mM (NH4)2SO4, 50
mM KCl, 2 mM MgSO4, 0.1% Tween 20, pH 8.8), species-specific primer set (5 pmol F3 and B3,
40 pmol FIP and BIP, 20 pmol LF and LB, Table 2-1), MgSO4, calcein, MnCl2,
deoxyribonucleotide triphosphates (dNTPs), Bst 2.0 DNA polymerase, DNA template, and PCR
grade H2O (Table 2-2). The LAMP assay was performed at a constant temperature (65°C
maintained by the analyzer) (see Figure 2-8). Six target-specific primers targeting the mitochondrial

8
gene were synthesized (Integrated DNA Technologies) to specifically amplify the 213-bp region
of the P. falciparum DNA (Figure 2-1 and Table 2-1) [68, 69]. For pan-Plasmodium detection, we
adopted a primer set targeting the mitochondrial gene common to all Plasmodium species [68]. For
Pv-specific detection, we used a primer set targeting the cox1 gene of Pv [70]. All primer sets were
listed in Table 2-1. It is noteworthy the Pv primers used here could also cross-react with P. knowlesi
species [70]. The primer set we used in this study is the same as those reported previously [68]
[70].
Figure 2-1: Location of the LAMP target sequence and priming sites of Plasmodium falciparum (Pf: Genbank accession no. AJ276844). The core priming sites of inner/outer primers (F3/B3, F2/B2, and F1c/B1c) with additional priming sites of loop primers (LF/LB) are marked on the sequence.
Table 2-1: Primer sets for the genus-, P. falciparum-, and P. vivax-specific LAMP amplification
Species Primer Sequence (5’ → 3’)
Plasmodium genus
[68]
F3 TCGCTTCTAACGGTGAACT
B3c AATTGATAGTATCAGCTATCCATAG
FIP (F1c – F2) GGTGGAACACATTGTTTCATTTGATCTCATTCCAATGGAACCTTG
BIP (B1 – B2c) GTTTGCTTCTAACATTCCACTTGCCCGTTTTGACCGGTCATT
LF CACTATACCTTACCAATCTATTTGAACTTG
LB TGGACGTAACCTCCAGGC
9
P. falciparum
[68]
F3 CTCCATGTCGTCTCATCGC
B3c AACATTTTTTAGTCCCATGCTAA
FIP (F1c – F2) ACCCAGTATATTGATATTGCGTGACAGCCTTGCAATAAATAATATCTAGC
BIP (B1 – B2c) AACTCCAGGCGTTAACCTGTAATGATCTTTACGTTAAGGGC
LF CGGTGTGTACAAGGCAACAA
LB GTTGAGATGGAAACAGCCGG
P. vivax
[70]
F3 GGTACTGGATGGACTTTATAT
B3c GGTAATGTTAATAATAGCATTACAG
FIP (F1c – F2) CCAGATACTAAAAGACCAACCCACCATTAAGTACATCACT
BIP (B1 – B2c) GCTAGTATTATGTCTTCTTTCACTTAATATACCAAGTGTTAAACC
LF GATAACATCTACTGCAACAGG
LB CTACTGTAATGCATCTAAGATC
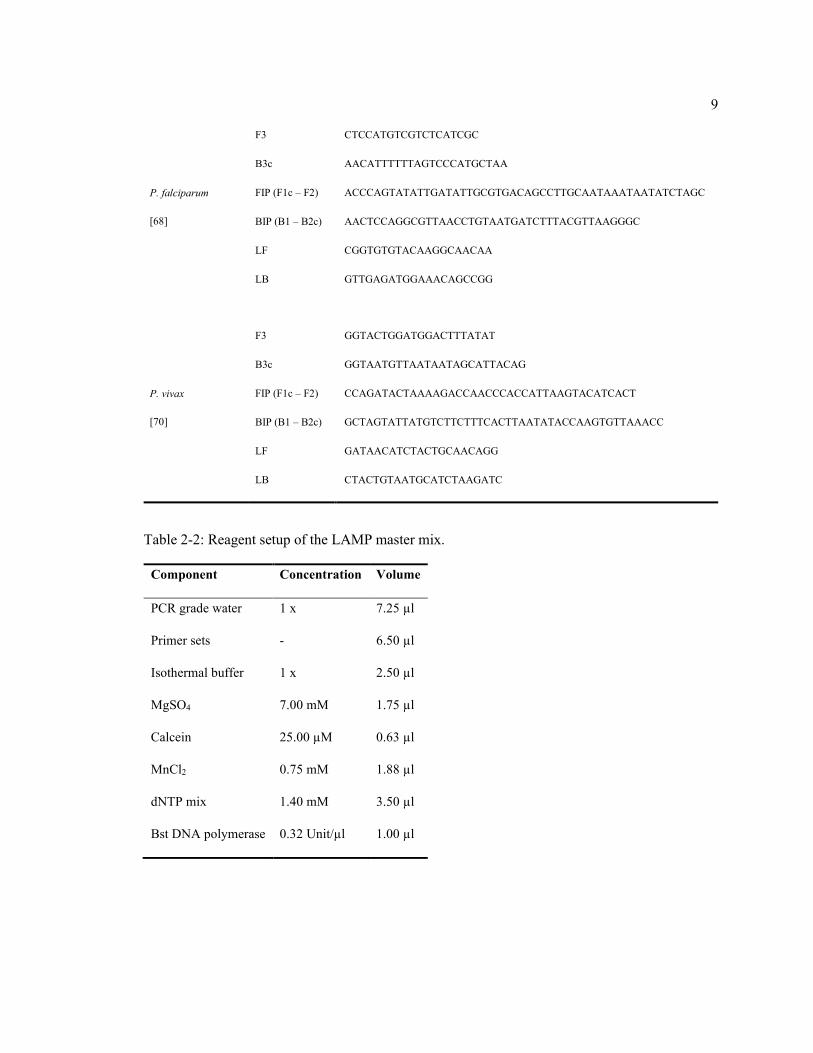
Table 2-2: Reagent setup of the LAMP master mix.
Component Concentration Volume
PCR grade water 1 x 7.25 µl
Primer sets - 6.50 µl
Isothermal buffer 1 x 2.50 µl
MgSO4 7.00 mM 1.75 µl
Calcein 25.00 µM 0.63 µl
MnCl2 0.75 mM 1.88 µl
dNTP mix 1.40 mM 3.50 µl
Bst DNA polymerase 0.32 Unit/µl 1.00 µl

10
2.2.2. Validation of LAMP assays for P. falciparum, P. vivax, and pan-plasmodium
To validate the LAMP primer sets for specifically detecting Pf, Pv, and pan-Plasmodium, we
performed a cross-reactivity test using extracted Pf and Pv genomic DNA on a benchtop real-time
PCR instrument (Bio-Rad CFX96). Pf genomic DNA is obtained from P. falciparum cultured blood
sample. Pv-infected blood samples were obtained from BEI Resources Repository (MRA-369 Pv
strain Achiote, and MRA-383 Pv strain Chesson). Each analysis was performed with triplicates. As
shown in Figure 2-2A, P. falciparum- and P. vivax- specific assays can pick up the corresponding
genomic sample specifically without cross-reactivity. In contrast, the pan-Plasmodium assays can
pick up any Plasmodium species (P. falciparum and P. vivax). No amplification was observed with
the negative control (PCR grade water). We performed gel electrophoresis in 2% agarose gel to
further evaluate each amplicon (Figure 2-2B). A clear ladder-like pattern with multiple bands of
different molecular sizes was observed due to the stem-loop DNA structures with several inverted
repeats within LAMP amplicons [71]. The length of the bands showed confirmative agreement
with the length of the target sequence (213-, 127-, and 220-bp bands were expected from P.
falciparum, P. vivax, and pan-Plasmodium products respectively) [68].

11
2.2.3. Thermostability of LAMP reagents
Although most of our experiments used liquid phase reagents loaded into the disc immediately
before use, the reagents could also be preloaded before use. We studied the thermostability of
LAMP reagents (especially Bst 2.0 DNA polymerase) when stored at 25 ºC (ambient temperature)
and at 4 ºC (refrigerator temperature) to evaluate their applicability for field use. During a week-
long test, LAMP reagents stored at 25 ºC and 4 ºC were assessed every 24 hours to detect the model
Pf genomic DNA. These experiments were done in 3 repetitions. As shown in Figure 2-3, the
enzymes and reagents were found to retain sufficient activity to achieve successful DNA
amplification when stored at 4°C for a week. There was no significant shift in the average threshold
time for reagents stored at 4°C for one week. In contrast, when stored at 25 ºC, although the
Figure 2-2: Validation of the species- and genus-specific LAMP assays using laboratory purified Pf and Pv genomic DNA. (A) Amplification curves obtained from real-time PCR. PCR grade water was used as a no template control (NTC). (B) Gel electrophoresis image (2% agarose gel). Ladder-like bands in the gel image confirm the amplicons from species- and genus-specific LAMP reactions.

12
enzymes and reagents were active and could efficiently amplify DNA in less than 50 min for 3 days
(no activity afterward), the threshold time (Tt) needed to obtain the positive/negative results were
delayed (Figure 2-3B). These results indicate that a qualitative yes/no amplification could be
achievable for reagents storage at room temperature. However, for a consistent real-time
quantitative LAMP detection, cold-chain transport and storage of the prefilled microfluidic reagent
disc would be preferred. The stability issue could also be addressed by using reagent lyophilization.
It was found the lyophilized reagents could remain stable for 24 months when stored at 4 °C, 28
days at 25 °C, and 2 days at 37 °C [72].
Figure 2-3: LAMP reagent thermostability test. (A) The real-time amplification curve for LAMP reagent stored at 4 °C and 25 °C. (B) Extracted amplification threshold time (Tt). At 4 °C storage temperature, the reagent shows a negligible threshold time drift for a week. At 25 °C storage, the reagent shows a drift towards higher Tt (decreased activity) over time, and no amplification is seen after day 3. The dashed line denotes the freshly prepared LAMP reagent.

13
2.3. Charge-switchable magnetic bead-based parasite DNA preparation
The common challenges for most point-of-care nucleic acid testing device stemmed from high-
quality and scalable nucleic acid sample preparation. In our preliminary study, we explored charge
switchable magnetic bead-based method for DNA extraction (Figure 2-4). We first performed a
reference experiment to confirm compatibility of ChargeSwitch forensic DNA
extraction/purification kit in the tube. Since the surface charge polarity of the magnetic beads is pH
dependent, and the surface charge polarity of DNA is negative for a wide range of pH values, the
magnetic beads can attract or repel the nucleic acids by the different pH values of the preloaded
buffer solution (Figure 2-4B).
Figure 2-4: Charge switchable magnetic bead-based method for DNA isolation. (A) pH switchable surface charge of silanol groups at silica surface. (B) DNA binding, purification and elution process on silica surface can be actuated by surrounding pH values.
14
2.4. Singleplex instrumentation integration
2.4.1. Analyzer
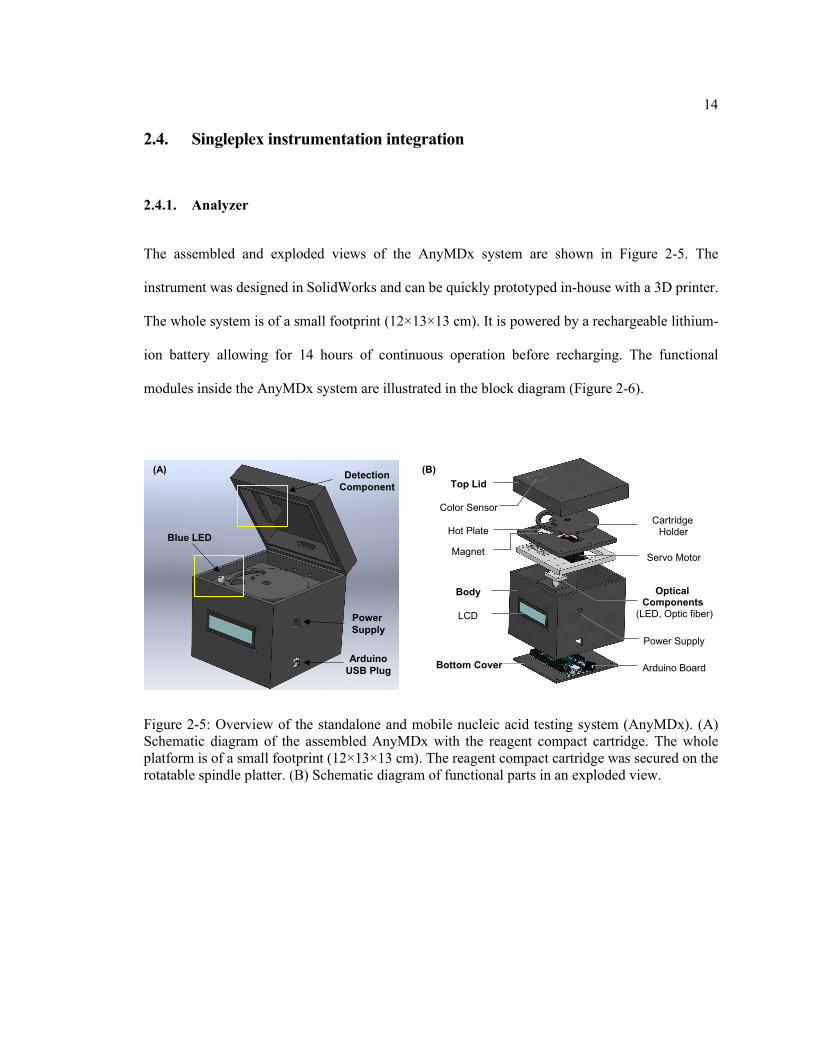
The assembled and exploded views of the AnyMDx system are shown in Figure 2-5. The
instrument was designed in SolidWorks and can be quickly prototyped in-house with a 3D printer.
The whole system is of a small footprint (12×13×13 cm). It is powered by a rechargeable lithium-
ion battery allowing for 14 hours of continuous operation before recharging. The functional
modules inside the AnyMDx system are illustrated in the block diagram (Figure 2-6).
Figure 2-5: Overview of the standalone and mobile nucleic acid testing system (AnyMDx). (A) Schematic diagram of the assembled AnyMDx with the reagent compact cartridge. The whole platform is of a small footprint (12×13×13 cm). The reagent compact cartridge was secured on the rotatable spindle platter. (B) Schematic diagram of functional parts in an exploded view.
Detection Component
Blue LED
Power Supply
ArduinoUSB Plug
Top Lid
Body
Bottom Cover
Hot Plate
LCD
Magnet
Arduino Board
Color Sensor
Optical Components
(LED, Optic fiber)
Servo Motor
Cartridge Holder
Power Supply
(B)(A)

15
Real-time optical subsystem. On the excitation side, the LED light source (λ= 488 nm, C503B-
BCN-CV0Z0461, Newark) was guided towards the reaction chamber through a polymer optical
fiber (#02-538, Edmund). The optical fiber and LED were self-aligned by a customized adapter to
achieve optimal light coupling efficiency. On the detection side, the emission light from the LAMP
reaction chamber was coupled to the optical sensor (TCS34725, Digi-Key) by the optical fiber. The
incidence of the excitation LED light is perpendicular to the optical sensor to minimize the
diffracted excitation light into the optical sensor and thus increasing the signal-to-noise ratio.
During the amplification process, the fluorescence readings were acquired every 2.5 seconds. The
first 5 min of the signal was averaged to obtain the background noise level, which was then
subtracted from the raw fluorescence readings to form a processed signal. The processed signal was
further smoothed by averaging a fixed number of consecutive data points. We defined a threshold
Figure 2-6: Block diagram of the AnyMDx modules. The platform consists of four main functional modules: mechanical modules (servo motor/spindle platter/compact cartridge), optical modules (LED/optical sensor), thermal modules (Peltier heater/thermal sensor), and data connectivity modules (Bluetooth). Each module was controlled by a microprocessor on a customized PCB board. The diagnostic results can be optionally reported to a smartphone user interface.

16
time (Tt) at the time when the slope of measured RFU (dRFU/dt) reached the peak (Figure 2-7).
The threshold RFU value was experimentally determined at 400 for positive/negative decision.
Thermal subsystem. For the feedback thermal control system, a Peltier heater was bonded to the
backside of the aluminum heating plate by thermal paste. A micro-thermistor was embedded inside
of the aluminum heating plate for real-time temperature monitoring. The desired reaction
temperature was maintained by the feedback control during the DNA amplification process to
maintain a desired constant temperature. To evaluate the temperature fluctuation, the temperature
was monitored for 60 minutes by an external independent thermocouple module (NI-9211, National
Instruments). Figure 2-8 shows the temperature on the aluminum heating plate can reach the set
temperature (65 °C) within 40 seconds and continuously maintain a temperature between 64.5 °C
to 66.5°C.
Figure 2-7: Determination of the threshold time (Tt). A real-time amplification curve (blue) and its differential profile (dRFU/dt, orange). The threshold time (Tt) was determined at the maximum slope of RFU. (Tt: threshold time, t: time, Smax: maximum value of the slope)

17
Mechanical and interfacing subsystems. An embedded microcontroller unit (MCU) operates the
whole system to perform all necessary isothermal assay steps, including automated sample
preparation, nucleic acid amplification, and real-time detection. An LCD provides a user-friendly
interface for instrument status and data display. Besides, a low power Bluetooth module was
incorporated for easy data connectivity.
2.4.2. Microfluidic reagent compact cartridge design and fabrication
The microfluidic compact cartridge consists of the top (0.8 mm thick), spacer (1.6 mm thick), and
bottom (0.8 mm thick) poly (methyl methacrylate) (PMMA) layers laminated with adhesive solvent
(Figure 2-9). Each layer was designed in AutoCAD (diameter of 9.6 cm) and patterned by a CO2
laser cutter (Epilog Helix 24 Laser System) with a power of 100%, a speed of 30% (for the
top/bottom of 0.8 mm thick) and 60% (for the spacer of 0.8 mm thick), and a frequency of 5000
Hz. The patterned top, spacer, and bottom polymethyl methacrylate (PMMA) layers were initially
Figure 2-8: The feedback-controlled reaction temperature profiles as a function of time. (blue curve: AnyMDx 1, red curve: AnyMDx 2)
0 10 20 30 40 50 6020
25
50
60
70
Tem
pera
ture
(o C)
Time (min)
AnyMDx1 AnyMDx2

18
washed with detergent to remove residues from laser cutting, then laminated with adhesive solvent.
The assembled cartridge was cleaned twice with 2% sodium hypochlorite (NaOCl) and distilled
water, respectively, to eliminate inhibitory substances, which could cause chemical interference.
Each assembled cartridge accommodates three independent testing units. Each unit consists of five
chambers: a DNA binding chamber (with an inlet for sample input), a washing chamber, a reaction
chamber, and two valving chambers (Figure 2-9). The valving chambers were filled with FC-40 oil
or air. The FC-40 oil, which seals the LAMP reaction chamber, helped prevent master mix
evaporation during the thermal process. The air-filled valve was surface treated with water-oil
repellent to create a barrier for the amphiphilic lysis buffer. The inlets for sample input were sealed
by pressure-sensitive adhesive (PSA) tapes (3M Scotch 3650).
Figure 2-9: Illustration of reagent compact cartridge. (A) Assembled view of the reagent cartridge. A test unit consists of five chambers: a DNA binding chamber (binding buffer pH 5.0), a washing chamber (washing buffer pH 7.0), a LAMP reaction chamber (master mix, pH 8.8), and two valving chambers. The lysate was prepared by collecting 10 μl of malaria-infected blood into 1 ml of lysis buffer in a microcentrifuge tube. (B) Cross-sectional view of the reagent cartridge showing. All reagents are preloaded on the reagent cartridge in a ready-to-use format.
LAMP mix
Washingbuffer
Magnetic bead
Lysate(A)
FC-40 Air
FC-40
TopSpacerBottom
Beads
LAMP Master Mix
Air
(B)Washing
Buffer Lysate

19
2.5. Working principle of streamlined DNA sample preparation on the cartridge
We used a commercially available DNA purification kit (Invitrogen ChargeSwitch® forensic DNA
purification kit) for isolating P. falciparum DNA from whole blood lysates. The lysis buffer,
binding buffer, and washing buffer were used as received. The LAMP master mix was prepared
before running the experiments. All reagents were in the liquid phase when loaded onto the
cartridge. The reagents-loaded cartridge was stored in the fridge at 4°C. The reagents were stable
for at least 3 days under this storage condition. The 10 µl of human whole blood samples spiked
with cultured P. falciparum were collected into a 1.5 ml microcentrifuge tube containing 1000 µl
of lysis buffer and 10 µl proteinase K. After incubating at room temperature for 2 min, 180 µl
lysates were introduced into the binding chamber through the inlet hole. There are three
independent testing units on the compact cartridge. Each testing unit on the compact cartridge
consists of (1) 30 µl binding buffer and 10 µl magnetic beads in the binding chamber, (2) 150 µl
washing buffer in the washing chamber, and (3) 25 µl LAMP master mix in the reaction chamber
(Figure 2-9A). Since the surface charge polarity of the magnetic beads is pH-dependent, and the
surface charge polarity of DNA is negative for a wide range of pH values [73], the magnetic beads
can attract or repel the nucleic acids by the different pH values of the preloaded buffer solution
(Figure 2-4 and Figure 2-10). The magnetic beads were actuated by rotating the compact cartridge
against a stationary magnet. In a control sequence, the DNA-carrying beads were directed into the
different chambers until the target DNAs were eluted in the reaction chamber (Figure 2-10). The
optimal rotation speed is experimentally determined by monitoring the magnetic bead motion.
Although a faster rotation is preferred to reduce the whole processing time, the DNA-carrying
magnetic beads might be lost from chamber to chamber if the rotation speed is too high. There is a
tradeoff between the sample preparation efficiency and the whole process time. The whole process

20
can automatically prepare high-quality DNA samples from the human whole blood in less than 10
minutes.
2.6. Magnetic bead-based P. falciparum gDNA sample preparation on tube
We performed a reference experiment to confirm the compatibility of the ChargeSwitch forensic
DNA extraction/purification kit. To validate the magnetic bead-based DNA extraction/purification
method, we manually carried out tube-level sample preparation by pipetting (Figure 2-11A). In step
1, 20 µl of the cultured malaria-infected blood sample was initially dispensed to the tube, which
contains 1 ml of lysis buffer and 10 µl of Proteinase K. This mixture was incubated at room
temperature for 2 minutes to lyse the malaria parasites and RBCs. In step 2, 200 µl of purification
buffer and 20 µl of magnetic beads were introduced by pipetting. In this step, the negatively charged
target DNA bind to the positively charged magnetic beads (pH 5.0). In step 3, the DNA-carrying
magnetic beads were enriched by a permanent magnet, and the remaining supernatant was removed.
Figure 2-10: Illustration of integrated sample preparation and amplification steps on the reagent cartridge. By rotating the reagent cartridge against a stationary magnet in a specifically designed control sequence (steps 1-4), the pH-dependent charge switchable magnetic beads were directed from chamber to chamber, which allows for seamlessly integrated DNA binding, purification, elution, and amplification on the reagent cartridge.

21
Then 500 µl of washing buffer was introduced to remove possible inhibitors. In step 4, 150 µl of
elution buffer was used to unbind the DNA from the magnetic beads due to charge repulsion (pH
8.8). In step 5, 1 µl of purified DNA was introduced to the LAMP master mix, which was
transferred to the reagent cartridge and was run on the AnyMDx instrument for real-time
amplification. All amplification curves of infected RBC samples showed clear exponential DNA
amplification between 25 to 35 minutes (Figure 2-11B). This result confirms the success of the
magnetic bead-based method for malaria DNA extraction and purification.
2.7. LAMP assay test on the cartridge using purified P. falciparum gDNA
To validate the designed LAMP assay and the module level function (fluidic, thermal, mechanical,
optical) of the AnyMDx instrument, the LAMP assay in the microfluidic reagent cartridge on the
AnyMDx system was compared side-by-side with a real-time PCR using purified P. falciparum
genomic DNA sample. To this end, purified P. falciparum genomic DNA (gDNA) was 10-fold
serially diluted with Tris-EDTA buffer. LAMP master mix without P. falciparum gDNA was used
Figure 2-11: Illustration of the manual parasite genomic DNA extraction and purification procedures in a microcentrifuge tube. (B) The amplification curve for the manually extracted DNA sample on the AnyMDx instrument. The successful amplification of the tube-extracted DNA samples validates the effectiveness of the magnetic bead-based method.
(A)
①
Lysis buffer: 1 mlProteinase K: 10 µl
Lysate (1030 µl)
Wash buffer: 500 µl
③②
Purification Buffer: 200 µlMagnetic beads: 20 µl
④
Elution buffer: 150 µl
Purified DNA (1 µl)
⑤
Master mix: 24 µl
Blood (20 µl)
Magnetic beads Malaria infected RBC Parasite genomic DNA
0 10 20 30 40 50 600
400
800
1200
1600
RFU
Time (min)
0.002% 0.02% 0.2% hRBC NC
AnyMDx(B)
0.002% 0.02% 0.2%3032343638
Tt (m
in)
Parasitemia

22
as a no template control (NTC). As shown in Figure 2-12A, the assay was firstly validated by a
benchtop real-time PCR machine (MJ Research DNA Engine Opticon). A sharp increase in RFU
values was observed from three diluted DNA samples, while the negative control showed no
increase in RFU values (Figure 2-12A). The real-time performance of AnyMDx on the same sample
sets is shown in Figure 2-12B, which demonstrated a distinguishable fluorescence threshold
between positive and negative samples within 30 minutes. Besides, the result of the AnyMDx
system was quantitative though the standard deviations are higher for low concentration samples.
An inversely proportional relationship between the threshold time and the DNA concentrations (R2
= 0.9998) was observed (Figure 2-12B inset). Note that AnyMDx has a linear region from 0.01 x
to 1 x while the real-time PCR machine saturates at 1x concentration. This discrepancy might occur
due to the dynamic range differences in the optical detectors and the thermal coupling efficiency in
these two systems.
Figure 2-12: Validation of the LAMP assay and the AnyMDx instrument with laboratory purified DNA samples. (A) Benchmarking amplification curves obtained from the real-time PCR machine. 1x, 0.1x, and 0.01x denotes the dilution factors of the P. falciparum DNA samples (NTC: No template controls, Tt: Threshold time). (B) The amplification profiles acquired from the AnyMDx instrument. (C) Gel-electrophoresis analysis on a 2% agarose gel. The amplicons show a clear ladder-like pattern, the length of which verifies the LAMP assay’s specificity against P. falciparum. (D) Emission visualized under the blue LED (λ=488 nm) illumination for various positive and negative samples.
0 10 20 30 40 50 60
0
500
1000
1500
2000
Time (min)
RFU
0.01x 0.1x 1x NTC
AnyMDx
0 10 20 30 40 50 600
1
2
3
4
5
6
0.01x 0.1x 1x NC
RFU
Time (min)
Real-Time LAMP
(A) (B)
0.01x 0.1x 1x
14
15
16
Tt (m
in)
Dilution Factor
0.01x 0.1x 1x20
22
24
26
28
Tt (m
in)
Dilution Factor

23
To further evaluate if the amplicons were specifically from the designed targets, we performed gel
electrophoresis analysis of the amplicons in 2% agarose gel. As shown in Figure 2-12C, the LAMP
amplicons showed a clear ladder-like pattern with multiple bands of different molecular sizes due
to its inverted-repeat structures [74]. More specifically, the length of the observed bands
corresponds to the integral times of the target sequence (213 bp), indicating the amplified products
were specific for the target sequence. Also, strong green emission (implying positive reactions) can
be easily recognized by the naked eyes in the PCR tube under blue LED illumination in the dark
environment (Figure 2-12D). From these results, we successfully verified the LAMP assay against
P. falciparum genomic DNA and the modular function of the AnyMDx system.
2.8. Validation of streamlined sample process using Pf-infected whole blood
High-quality nucleic acid sample preparation is the bottleneck for most “sample-in-answer-out”
molecular analysis.[75] Before we prepared the sample on the reagent cartridge, the pH-switchable
magnetic beads-based method for DNA isolation was validated first in test tubes from the blood
sample using the same reagents as on the reagent compact cartridge. Successful amplification of
the tube-extracted DNA samples confirmed the effectiveness of the magnetic bead-based method
(Figure 2-11). Afterward, we evaluated sample preparation in the reagent compact cartridge and
the compatibility of the purified DNA with the subsequent LAMP assay. To test the DNA
extraction efficiency on the reagent compact cartridge, we examined P. falciparum-infected blood
samples of different parasitemia (0.2%, 0.02%, and 0.002%, prepared by dilution with healthy
blood at 45% hematocrit), which were assessed by Giemsa-stained blood smears test prior to
experiment. The infected blood samples were directly lysed in the collection tubes before loading
into the reagent compact cartridge (Figure 2-10B). The following DNA binding, purification,
elution, and the amplification were automatically carried out by the AnyMDx system (Figure

24
2-10C). As shown in Figure 2-13, the real-time amplification data for various parasitemia showed
a clear quantitative trend, as compared to the lack of amplification signals in the negative control.
Though quantitative analysis is not always required for point-of-care applications, it is valuable in
many situations, for example, in determining the effectiveness of antimalarial therapy for malaria
patients.[76] These results fully verified that the AnyMDx system could work in a “sample-in-
answer-out” fashion by seamlessly integrating high-quality DNA preparation and real-time
amplification on a single reagent compact cartridge.
2.9. Sensitivity estimation with whole blood
To evaluate the analytical sensitivity of our device in the real-world settings, we 10-fold diluted the
Pf-infected whole blood with healthy blood to create mock samples with 10-6% to 1% parasitemia.
The parasite DNA samples were automatically prepared on the compact disc. Each parasitemia
Figure 2-13: Validation of the AnyMDx system from the whole blood sample to the amplification result with integrated sample preparation on the reagent cartridge. The % value represents the parasitemia of the infected RBCs. (hRBC: healthy RBCs, NTC: No template controls, Tt: Threshold time)
0 5 10 15 20 25 30 35 40 45 50 55 600
200
400
600
800
1000
1200
1400
RFU
Time (min)
0.2% 0.02% 0.002% NTC hRBC
“Blood Sample-In-Answer-out” Test
0.002% 0.02% 0.2%22232425262728
Tt (m
in)
Parasitemia

25
sample was performed in triplicates, together with negative control on a single disc (four reactions
per run). As shown in Figure 2-14A, a whole blood sample with parasitemia higher than 10-5%
could be identified. Since parasitemia is the ratio of the parasitized RBCs to the total RBCs, 10-5 %
parasitemia would correspond to 0.5 parasites/μl (normal RBC count is ~5×10⁶ cells/μl [26]).
Although a rigorous report of the limit of detection (i.e., analytical sensitivity) requires a statistical
comparison with the analytical blank and should be expressed as a probability with confidence
intervals [77], a quick eyeball of the data shown in Figure 2-14A suggests the whole blood
sensitivity is around 0.5 parasites/μl. WHO estimates that analytical sensitivity needs to be lower
than 2 parasites/μl for identifying low-level infection in a pre-elimination setting [78]. This
sensitivity achieved in our device is comparable to other NAT methods (1-5 parasites/μl) [79] and
suitable for detecting low-level asymptomatic carriers [25, 27, 80]. No amplification was observed
for the healthy whole blood sample, which suggests the background human genomic DNA has
negligible interferences. The amplification threshold time (Tt) was extracted for each parasitemia,
and the results were shown in Figure 2-14B. The inversely proportional relationship between Tt and
parasitemia confirmed that the quantitative ability is still valid with whole blood samples. It is
interesting to note that the calibration curve shown in Figure 2-14B is not exactly linear which is
likely because the DNA extraction efficiency is nonlinear for different cell numbers [81].

26
2.10. Cost analysis
The most significant advantage of the molecular test is their ability to detect extremely low-level
malaria infections, which are often challenging for microscopy and RDTs. Nevertheless, the
greatest hurdle for deploying a molecular analysis in resource-limited areas is its relatively high
cost and the infrastructure investment. The AnyMDx system aimed to address this issue by
delivering a sensitive malaria molecular test cost-effectively. The prototype AnyMDx instrument
presented in this work could be built for a total amount of ~$176 (see Table 2-3 for cost breakdown).
The disposable reagent compact cartridge (including the sample preparation and the amplification
reagents) costs ~$1.14 per each test (see Table 2-4). Note that this cost analysis is only to provide
a ballpark figure to the interested researchers to replicate the system. Reduced cost for scaled
Figure 2-14: Sensitivity test with Pf-infected whole blood sample (A) Amplification curves for 10-fold serially diluted Pf-infected whole blood samples. Healthy human blood was used as an NTC. (B) The resulting calibration curve for the whole blood sample. Standard deviation values are from triplicates.
(A) (B)
02 100 %
02 10-1 %
02 10-2 %
02 10-3 %
02
RFU
( x10
0 )
10-4 %
02 10-5 %
02 10-6 %
0 20 40 6002
Time (min)
Whole blood (NTC)
10-6 10-4 10-2 100
20
30
40
50
60
T t (m
in)
Parasitemia (%)

27
manufacturing, increased cost for medical device regulation, and licensing cost is not included in
this analysis since this is beyond the scope of this study. The low cost of this sensitive molecular
test provides an excellent opportunity for the field applications of this mobile molecular diagnostic
system. Moreover, the manufacturing of the AnyMDx instrument is highly scalable in a cost-
effective way. The AnyMDx system could be easily reproduced within a day in ordinary lab
settings.
Table 2-3: Cost breakdown for the AnyMDx instrument
System Vendor Description Part# Function Unit
Cost ($)
Unit
Qty.
Ext
Cost ($)
Bluetooth Adafruit Bluetooth Low Energy (BLE 4.0) 1697 Bluetooth 19.95 1 19.95
Electronics Adafruit Arduino Mega 2560 R3 DEV-1106 Microcontroller 45.95 1 45.95
Electronics Adafruit 36-pin stripe male header 392 Headpins 4.95 0.083 0.41
Electronics Newark Detector Switch 83T2715 Switch 0.27 1 0.27
Electronics Sparkfun DC Barrel Power Jack/Connector PRT-00119 Power Connector 1.25 1 1.25
Electronics Newark Through-Hole Resistor, 10 kΩ 38K0328 Temperature control 0.09 3 0.26
Electronics Adafruit Shield Stacking Headers for Arduino 85 Wire Sockets 1.95 0.33 0.64
Electronics Newark Through-Hole Resistor, 100 Ω 38K0326 Resistors for LED 0.09 2 0.18
Electronics Adafruit Premium Male/Male Jumper Wires 758 Wires 3.95 0.75 2.96
Electronics Newark Diode, Standard, 1A, 50A 78K2043 Diode 0.07 1 0.07
Electronics Newark Trimmer Potentiometer, 10kΩ 16F7158 LCD adjustment 1.65 1 1.65
Enclosure Mcmaster Adjustable-Friction Hinge 1791A44 Hinge 6.72 2 13.44
Enclosure Amazon FLASHFORGE ABS Filament 90003001 3D platform material 18.50 0.3 5.55
Enclosure Sparkfun Metric Pan Head Machine Screws 92005A033 For holding LCD 3.67 0.04 0.15
Enclosure Mcmaster Acrylic Sheet, 1/8" Thick, 12" x 24" 8505K12 Holding plates 13.46 0.375 5.05
Enclosure Thorlabs Screws (M4 cap screw) W8S038 For holding hinge 3.25 0.04 0.13
Enclosure Thorlabs Screws (M3 set screw) SS3M6 For holding color sensor 9.25 0.0006 0.01
Enclosure Home Depot Screw Assortment Kit 800934 Hold plates 6.50 0.034 0.22
LCD Sparkfun Basic 16x2 Character LCD LCD-00709 LCD 15.95 1 15.95
Magnets Mcmaster Neodymium Disc Magnet Nickel 58605K33 Holding magnetic beads 2.69 1 2.69

28
Optics Adafruit Color Sensor 1334 Detection 7.95 1 7.95
Optics Edmund Optical Plastic Light Guide2 #02-538 Guiding light 2.55 0.06 0.15
Optics Newark CREE LED, Blue, T-1 3/4 (5mm) 04R6674 Fluorescence excitation 0.21 1 0.21
Optics Mcmaster Dispensing Needle 75165A551 Holding optic fiber 13.00 0.02 0.26
Servo Adafruit Standard Size - High Torque Servo 1142 Actuation of spindle platter 19.95 1 19.95
Thermal Thermoelectric Cold Plate CP-0.91-0.91 Heating Stage 5.75 1 5.75
Thermal Digikey Peltier Heater 102-1667-ND Heater 16.00 1 16.00
Thermal Newark N Channel Power MOSFET 63J7707 Switch for Peltier heater 1.66 1 1.66
Thermal Newark Thermistor 95C0606 Temperature sensing 7.34 1 7.34
Thermal Newark Capacitor 470uF 65R3137 Power Stabilizing 0.11 1 0.11
Total Cost $ 176.16
Table 2-4: Disposable reagent compact disc cost per test.
Reagents Vendor Function Stock Vol (ml) Unit Cost ($)
Vol.
(µl)/rxn Ext Cost/rxn
NEB Isothermal Buffer NEB LAMP master mix 6 24.00 2.5 0.010
F3 IDT LAMP master mix 1.4 9.22 0.25 0.002
B3 IDT LAMP master mix 1.5 10.22 0.25 0.002
FIP IDT LAMP master mix 1.0 7.14 2.00 0.013
BIP IDT LAMP master mix 1.4 9.18 2.00 0.013
LF IDT LAMP master mix 1.7 11.86 1.00 0.007
LB IDT LAMP master mix 1.3 8.61 1.00 0.007
MgSO4 NEB LAMP master mix 6 20.00 1.75 0.006
Calcein Sigma-Aldrich LAMP master mix 8000 133.00 0.63 0.000
MnCl2 Sigma-Aldrich LAMP master mix 100 62.60 1.88 0.001
dNTP Mix Thermo Fisher LAMP master mix 3.2 107.00 3.50 0.117
2.0 Bst polymerase NEB LAMP master mix 1 264.00 1.00 0.264

29
The instrument-to-instrument variation was small enough to deliver the same quality of quantitative
molecular analysis (Figure 2-15). As a result, we envision that the AnyMDx would enable cost-
effective malaria molecular diagnosis in resource-limited regions by decreasing the cost, increasing
the ease of use, and maintaining high sensitivity.
UltraPure Water VWR LAMP master mix 20 91.88 7.25 0.033
Lysis Buffer Invitrogen Sample Prep. 800 142.00 1000.00 0.178
Purification Buffer Invitrogen Sample Prep. 20 28.97 30.00 0.043
Wash Buffer Invitrogen Sample Prep. 100 144.84 150.00 0.217
Proteinase K Invitrogen Sample Prep. 1 1.45 10.00 0.014
Magnetic Beads Invitrogen Sample Prep. 2 2.90 10.00 0.014
Acrylic Glue ePlastics Compact disc 118 9.69 1.5 0.041
1/32" Acrylic Sheet ePlastics Compact disc - 14.98 - 0.098
1/16" Acrylic Sheet ePlastics Compact disc - 17.72 - 0.058
Total Cost $ 1.14
Figure 2-15: DNA amplification profiles of AnyMDx2. The manufacturing of the AnyMDx instrument is repeatable in a cost-effective way. We built the second instrument of AnyMDx (named AnyMDx2) and performed a similar sensitivity experiment (as described in the sensitivity section). Amplification curves from six different parasitemia samples show apparent exponential
0 10 20 30 40 50 600
500
1000
1500
2000
2% 0.2% 0.02% 0.002% 0.0002% 0.00002% hRBC NC
RFU
Time (min)
AnyMDx 2
10-510-410-310-210-1 1002022242628303234
Tt (m
in)
Parasitemia (%)

30
2.11. Summary
In summary, we developed a field-deployable mobile molecular diagnostic system for rapid and
accurate diagnosis of malaria infection in resource-limited areas at the point of need. The AnyMDx
system seamlessly integrated all nucleic acid testing steps from sample preparation to real-time
amplification and detection. The standalone and user-friendly system works in an “insert-and-test”
fashion and could specifically detect P. falciparum species in 40 minutes from a whole blood
sample. The sensitivity against P. falciparum was ~0.6 parasites/µl, which is important for
identifying asymptomatic parasite carriers who will otherwise be missed by microscopy or RDT
[25, 31, 82]. The cost-effective system allows for the deployment of a benchtop-quality malaria
nucleic acid testing into the remote areas for malaria elimination. Moreover, the modular design of
a separate reagent compact cartridge and a durable analyzer makes the system versatile. As a
platform technology, the AnyMDx design should create a new paradigm of molecular diagnosis
towards a variety of infectious diseases at the point of care.
increases of fluorescence, while that of the negative controls (master mix and hRBC) shows no amplification. (RFU: relative fluorescence unit, hRBC: healthy RBCs, NC: negative control)

Chapter 3 Multiplex Real-time Fluorescence Nucleic Acid Testing For High-throughput Malaria Screening
In Chapter 2, I have discussed the singleplex field-deployable mobile nucleic acid testing device
for sensitive malaria detection. Although the singleplex system allows excellent diagnostic
performance, throughput is still limited for field use. This chapter will present a multiplexed real-
time fluorescence nucleic acid testing device for high-throughput malaria detection. The 4-plex
device consists of a compact analyzer and a disposable microfluidic reagent compact disc. The
parasite DNA sample preparation and subsequent real-time LAMP detection were seamlessly
integrated on a single microfluidic compact disc, driven by energy-efficient, non-centrifuge based
magnetic field interactions. Each disc contains four parallel testing units, which could be configured
either as four identical tests or as four species-specific tests. When configured as species-specific
tests, it could identify two of the most life-threatening malaria species (P. falciparum and P. vivax).
The NAT device is capable of processing four samples simultaneously within 50 min turnaround
time. The combination of the sensitivity, specificity, cost, and scalable sample preparation suggests
the multiplexed real-time fluorescence LAMP device could be particularly useful for malaria
screening in the field settings.

32
3.1. Introduction to high-throughput nucleic acid testing in the field
Malaria elimination program requires a diagnostic device that can facilitate case management,
active community surveillance, and parasite screening of asymptomatic carriers [21, 83]. Due to its
excellent sensitivity, NATs have been considered as a strong candidate for malaria diagnosis.
However, the turnaround time for most NATs requires hours to several days from sample collection
to test results [84]. Although most NAT assay takes less than an hour, the primary reason for slow
turnaround time is blood sample transport from a clinical site to a centralized laboratory where
NATs are available [84].
Modification to make NATs more appropriate for low-resource point-of-care setting have been
reported to reduce turnaround time by eliminating the sample transfer time [85]. For instance,
recently described illumigene Malaria LAMP assay showed ‘sample-to-answer’ turnaround time
in less than an hour with a throughput of 10 test/run using a manual blood sample preparation step
with an incubator reader [86]. Despite significant effort and progress towards field deployment of
malaria NATs assays, test throughput is still restricted by the manual nucleic acid sample
preparation from raw peripheral blood [79, 87]. Current sample preparation usually involves
lengthy or error-prone manual processes such as gravity-driven filtration [86], centrifugation [88].
For the promising NAT technologies to be used as high-throughput malaria screening tests in the
field, the DNA extraction method should be simple, rapid, scalable, fully automated, free of cross-
contamination, and seamlessly integrated with the amplification for immediate analysis.
In this chapter, we present a multiplexed real-time fluorescence LAMP device suitable for high-
throughput field detection of Pf and Pv with automated and scalable sample preparation capability.
The device uses a non-centrifugal method for solid-phase DNA extraction by actuating the DNA-
carrying magnetic beads against the stationary reagent droplets. The device consists of a palm-sized
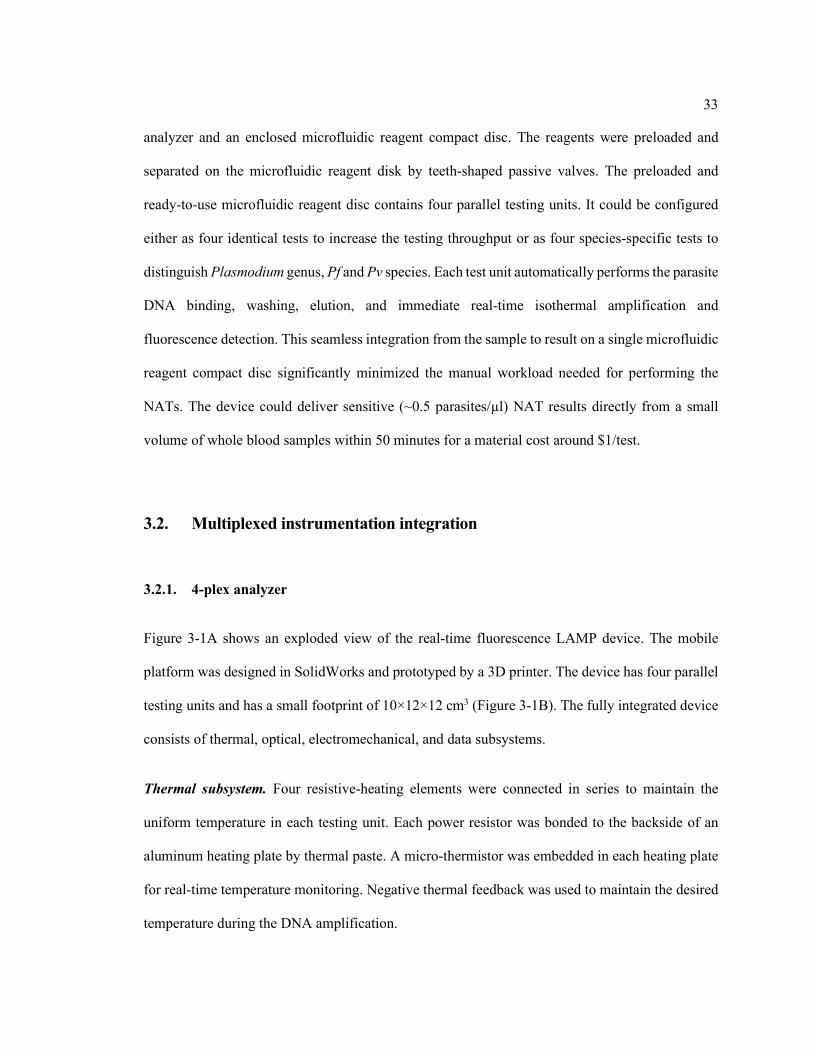
33
analyzer and an enclosed microfluidic reagent compact disc. The reagents were preloaded and
separated on the microfluidic reagent disk by teeth-shaped passive valves. The preloaded and
ready-to-use microfluidic reagent disc contains four parallel testing units. It could be configured
either as four identical tests to increase the testing throughput or as four species-specific tests to
distinguish Plasmodium genus, Pf and Pv species. Each test unit automatically performs the parasite
DNA binding, washing, elution, and immediate real-time isothermal amplification and
fluorescence detection. This seamless integration from the sample to result on a single microfluidic
reagent compact disc significantly minimized the manual workload needed for performing the
NATs. The device could deliver sensitive (~0.5 parasites/µl) NAT results directly from a small
volume of whole blood samples within 50 minutes for a material cost around $1/test.
3.2. Multiplexed instrumentation integration
3.2.1. 4-plex analyzer
Figure 3-1A shows an exploded view of the real-time fluorescence LAMP device. The mobile
platform was designed in SolidWorks and prototyped by a 3D printer. The device has four parallel
testing units and has a small footprint of 10×12×12 cm3 (Figure 3-1B). The fully integrated device
consists of thermal, optical, electromechanical, and data subsystems.
Thermal subsystem. Four resistive-heating elements were connected in series to maintain the
uniform temperature in each testing unit. Each power resistor was bonded to the backside of an
aluminum heating plate by thermal paste. A micro-thermistor was embedded in each heating plate
for real-time temperature monitoring. Negative thermal feedback was used to maintain the desired
temperature during the DNA amplification.

34
Optical subsystem. For real-time tracking of the DNA amplification, we used four LED light
sources (λ=488nm). Each of them was directed towards individual reaction chambers through
polymer optical fibers. Each LED was connected with a potentiometer to ensure the uniformity of
the excitation light. The incidence of the excitation LED lights was perpendicular to the optical
sensors to minimize the excitation interference (zoomed illustration in Figure 3-1B).
Electromechanical subsystem. A customized printed circuit board (PCB) with an embedded
microcontroller unit (MCU) operates the whole device from sample preparation to the result report.
A rechargeable 9V portable Lithium-ion battery powers the entire system and could last for >15
hours before recharging.
Data subsystem. The fluorescence intensity from four optical sensing units was sampled at a
constant interval and displayed on the LCD touchscreen in real-time. A built-in moving average
algorithm smoothed the signal with background noise removed. The threshold time (Tt) was
obtained when the slope of RFU (dRFU/dt) reached the peak (Figure 2-7).
Figure 3-1: Overview of the device. (A) Exploded view of the device, showing the assembly of various components. (B) Schematic of the assembled device and the quadplex microfluidic reagent
(B)(A)
Excitation
Detection
12 cm
12 c
m
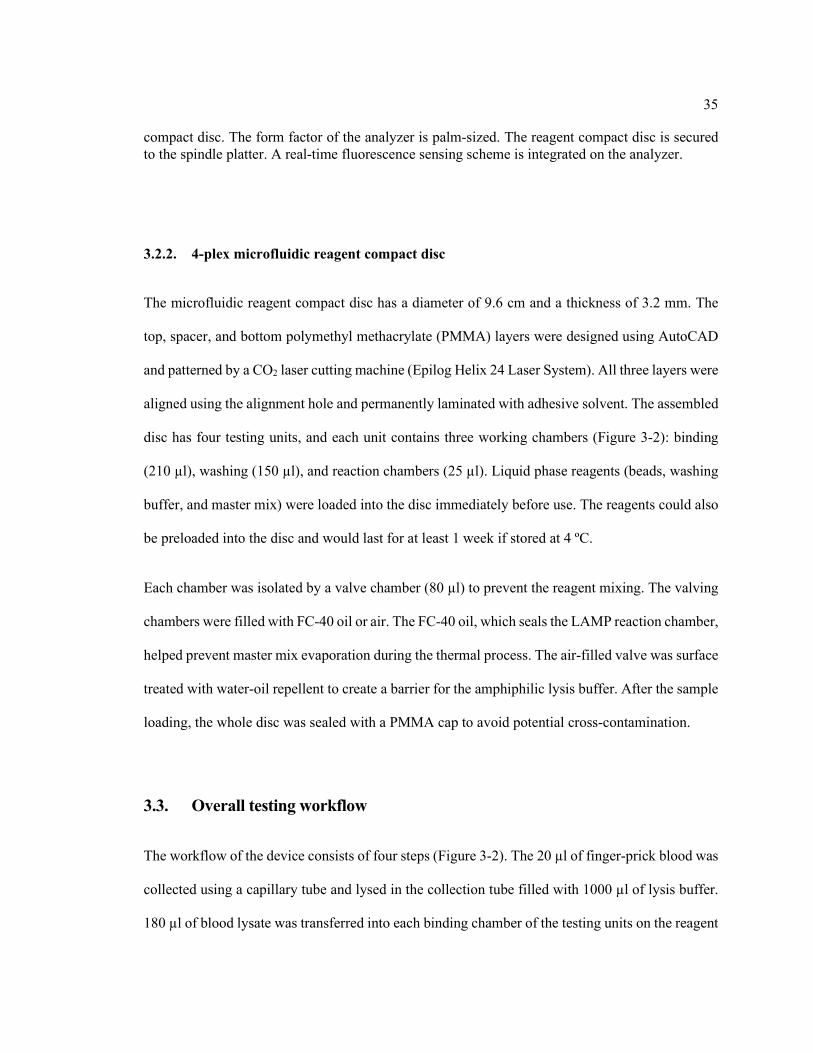
35
3.2.2. 4-plex microfluidic reagent compact disc
The microfluidic reagent compact disc has a diameter of 9.6 cm and a thickness of 3.2 mm. The
top, spacer, and bottom polymethyl methacrylate (PMMA) layers were designed using AutoCAD
and patterned by a CO2 laser cutting machine (Epilog Helix 24 Laser System). All three layers were
aligned using the alignment hole and permanently laminated with adhesive solvent. The assembled
disc has four testing units, and each unit contains three working chambers (Figure 3-2): binding
(210 µl), washing (150 µl), and reaction chambers (25 µl). Liquid phase reagents (beads, washing
buffer, and master mix) were loaded into the disc immediately before use. The reagents could also
be preloaded into the disc and would last for at least 1 week if stored at 4 ºC.
Each chamber was isolated by a valve chamber (80 µl) to prevent the reagent mixing. The valving
chambers were filled with FC-40 oil or air. The FC-40 oil, which seals the LAMP reaction chamber,
helped prevent master mix evaporation during the thermal process. The air-filled valve was surface
treated with water-oil repellent to create a barrier for the amphiphilic lysis buffer. After the sample
loading, the whole disc was sealed with a PMMA cap to avoid potential cross-contamination.
3.3. Overall testing workflow
The workflow of the device consists of four steps (Figure 3-2). The 20 µl of finger-prick blood was
collected using a capillary tube and lysed in the collection tube filled with 1000 µl of lysis buffer.
180 µl of blood lysate was transferred into each binding chamber of the testing units on the reagent
compact disc. The form factor of the analyzer is palm-sized. The reagent compact disc is secured to the spindle platter. A real-time fluorescence sensing scheme is integrated on the analyzer.

36
compact disc. After loading the sample, the disc was sealed with PSA tape and inserted into the
mobile analyzer for a streamlined nucleic acid sample preparation and amplification process
(enlarged view of step 3 in Figure 3-2). During the amplification, the fluorescence intensity data
were recorded on a non-volatile memory card and displayed on the LCD screen in real-time. Users
also have an option to receive the results using a smartphone.
Figure 3-2: Workflow of the device. In step 1, whole blood is collected into the lysis buffer by the capillary tube. In step 2, the lysate is loaded into the binding chamber of the four testing units. In step 3, the disc is sealed and inserted into the analyzer, which then performs automated sample preparation and amplification. This automated process consists of four steps: binding (3 min), washing (4 min), elution (3 min), and amplification (40 min). During the amplification process, the real-time fluorescence signal from each testing unit was recorded and analyzed. Finally, in step 4, the testing results are reported.

3.4. Robustness of the passive valve on the microfluidic compact disc
One major challenge in applying microfluidics towards point-of-care testing is the need for
peripheral tubing and pumping systems to drive the liquid movement [89, 90]. One exception is the
centrifugal-type microfluidic platform, where the reagent can be preloaded and driven by
centrifugal forces[91]. The preloaded reagents rely on passive valves to prevent mixing[92, 93].
However, fluid control and separation in the centrifugal platform were challenging because an
identical centrifugal force field is applied to all of the liquids on the disc within which a different
flow rate is needed [90, 94]. In addition, centrifugal force is non-linear and requires rotational
frequencies in the range of several thousand revolutions per minute (RPM).[91] The electrical
power needed to drive this motion is tremendous.
The microfluidic reagent disc used in the system does not rely on the centrifugal force to move the
liquid. Instead, we actuate the DNA-carrying magnetic beads against the stationary reagent
droplets. The reagents were preloaded and separated on the microfluidic reagent disc by teeth-
shaped passive valves (Figure 2-10). Structural pinning effect [95, 96] and modified surface tension
are the underlying principles that enable the teeth-shaped valves to securely hold the liquid in each
chamber. The pinning effect refers to the fact that a sharp bending angle (α) of the teeth structure
radically increases the liquid/vapor interface area and raises the activation energy, which prevents
fluid from overcoming the barrier (Figure 3-3A) [95]. The enhanced surface tension is another
important aspect of our passive valve structure. The valve surface was treated with water-oil
repellent to increase the activation barrier by introducing a higher surface tension [95], which also
helps circumvent cross-contamination during sample preparation.

38
To demonstrate the robustness of the passive valve for preventing the reagents from mixing under
the harsh mechanical vibration, we performed a drop test on the microfluidic compact disc. Three
different colors of food dyes were preloaded into each reagent chamber for visualization of any
liquid movement. Each reagent-loading hole was sealed with pressure-sensitive adhesive (PSA) to
prevent leakage. The disc was dropped from a height of 20 cm along a guiding rod towards a rigid
surface for 25 times. The disc was inspected every five drops with naked eyes to confirm the
functionality of the valve. The result showed that the teeth-shaped valve endured 25 consecutive
drops without reagents mixing (Figure 3-3). Besides, the robustness of the passive valve was also
validated through hand agitation to the microfluidic disc.
Figure 3-3: Illustration of the pinning effect and photo images of the drop test results. (A) A droplet on a solid surface with a contact angle of θ, which will be increased up to θ+α when moving towards a three-phase edge, where α is a bending angle1. This implies that larger α allows a higher activation barrier for the passive valve. (B) The drop test to evaluate the robustness of the teeth-shaped passive valves on the reagent compact disc under the harsh mechanical vibration. (N denotes the number of drops)
(A) (B)
θα
θ+α
α
① ② ③
④ ⑤ ⑥
N=0 N=5 N=10
N=15 N=20 N=25

39
3.5. Scalable streamlined sample preparation
One of the significant challenges for NATs at the point of care is related to the front end of the
assays - nucleic acid extraction from raw samples [87]. For malaria mass screening applications,
the ideal sample preparation should be simple, scalable, and easy-to-operate. We realized a
streamlined process for preparing four samples in parallel on a single enclosed microfluidic disc.
In contrast to the conventional lab-on-a-disk devices that rely on energy-hungry centrifugal forces
[91, 97] [98], our device operates with a non-centrifugal and energy-efficient magnetic interaction
method. The process for each sample consists of the following three steps: binding, washing, and
elution (step 3 of Figure 3-2). The negatively charged parasite DNAs first bind to the pH-sensitive
charge-switchable magnetic beads (ChargeSwitch® Forensic DNA Purification Kits, Invitrogen) at
pH 5. During the binding process (~3 min), the reagent compact disc was rotated back and forth
slowly to ensure thorough mixing of the beads and the lysate. The DNA-binding magnetic beads
were then transferred to the washing chamber by magnetic actuation. The washing process lasts for
about 4 min, and the magnetic beads with purified DNAs were further transferred to the reaction
chamber (LAMP master mix). The LAMP master mix has a pH of 8.8, which switches the surface
charge of the magnetic beads towards negative. The negatively charged DNAs were therefore
repelled off from the magnetic beads and eluted into the master mix. After that, the residual
magnetic beads were removed from the reaction chamber before initiating the LAMP reaction. The
entire sample preparation was multiplexed for four samples and could be finished in less than 10
minutes with minimal user intervention. The sample numbers could be easily scaled up if needed
in the future.

40
3.6. Multiplex parallel fluorescence sensing
Uniformity. For the quadruplex parallel NAT device, the fluorescence sensing consistency among
different channels is essential for quantitative measurement. We tested fluorescent calcein dye at
various known concentrations. At each concentration, identical calcein aliquots were loaded into
the four reaction chambers for fluorescence intensity measurement. Figure 3-4A shows the relative
fluorescence unit (RFU) distribution from each optical channel at different concentrations. The
quantitative uniformity among the four channels is excellent, as seen by the small standard
deviation for the RFU values. Moreover, as expected, the mean fluorescence intensity was
proportional to the calcein concentration, and a 2-fold calcein concentration difference could be
discriminated (inset in Figure 3-4A). To further validate the fluorescence sensing uniformity during
the real-time LAMP process, four identical 1 μl of Pf genomic DNA was directly loaded into each
reaction chamber, and the real-time amplification curve was monitored (Figure 3-4B). We repeated
each test three times. As shown in the inset of Figure 3-4B, the variation of threshold time (Tt)
among different fluorescence sensing channels was ~1.5 minutes. These results validate the
fluorescence sensing uniformity among different optical channels.
Quantitative. A series of 10-fold dilutions of Pf genomic DNA in Tris-EDTA buffer was used to
validate the quantitative ability of the device. For each concentration, a set of three identical Pf
genomic DNA samples and one internal negative control were loaded into each of the four reaction
chambers on the disc. The DNA sample volume is 1 μl, and the LAMP master mix is 24 μl. Figure
3-4C shows real-time amplification results from various concentrations of Pf genomic DNA. The
mean and standard deviation of the amplification threshold time (Tt) was obtained from the
triplicates for each concentration. As shown in the bottom subplot of Figure 3-4C, a clear linear
relationship was observed between Tt and the dilution factor, which could be used as a reference

41
curve for quantification. The quantitative ability is important for assessing parasite load in the
blood, a useful indicator for determining the proper antimalarial drug dosage [99 ].
Figure 3-4: Validation of the optical sensing uniformity. (A) With fluorescent calcein dye, the RFU distribution for the four optical channels was evaluated at a series of calcein concentration. A linear dependence of the RFU on the calcein concentration was observed in the range of 0.625-125 μM. The RFU variation from the four channels is small. (B) With Pf genomic DNA at constant concertation, the variations of the amplification threshold time (Tt) obtained from the real-time curve is ~1.5 min. (C) Amplification curves for 10-fold serially diluted Pf genomic DNA samples.

42
3.7. Whole blood-based Pf, Pv and Pan-Plasmodium identification
To evaluate the specificity of the device, we prepared whole blood samples spiked randomly with
Pf and Pv. Those sample’s species information is recorded but blinded to the tester. The reagent
compact disc was configured as species-specific tests, as shown in Figure 3-5A. Each test disc
incorporates an internal negative control unit to monitor the test quality. A threshold of 100 RFU
is experimentally determined to differentiate positive and negative results. Figure 3-5B shows the
result from a representative set of samples (i.e., Pf, Pv, mixed, and healthy). The species
information for a particular infected whole blood sample can be derived from four qualitative
results on the single microfluidic disc. For example, the Pf-infected sample (first row of Figure
3-5B) can be identified by the Pf-specific assay as well as the genus-specific assay. In contrast, the
mixed infection sample can be detected when Pf-, Pv-, and genus-specific assays all show positive.
Since Pf and Pv are the two most prevalent species that pose the greatest threat to the human,
identification of these major malaria parasite species in the field could provide the malaria
transmission profile to the healthcare workers and enable the effective malaria eradication strategy
[79].
The bottom plot shows the calibration curve for the Pf genomic DNA. Standard deviation values are from triplicates.
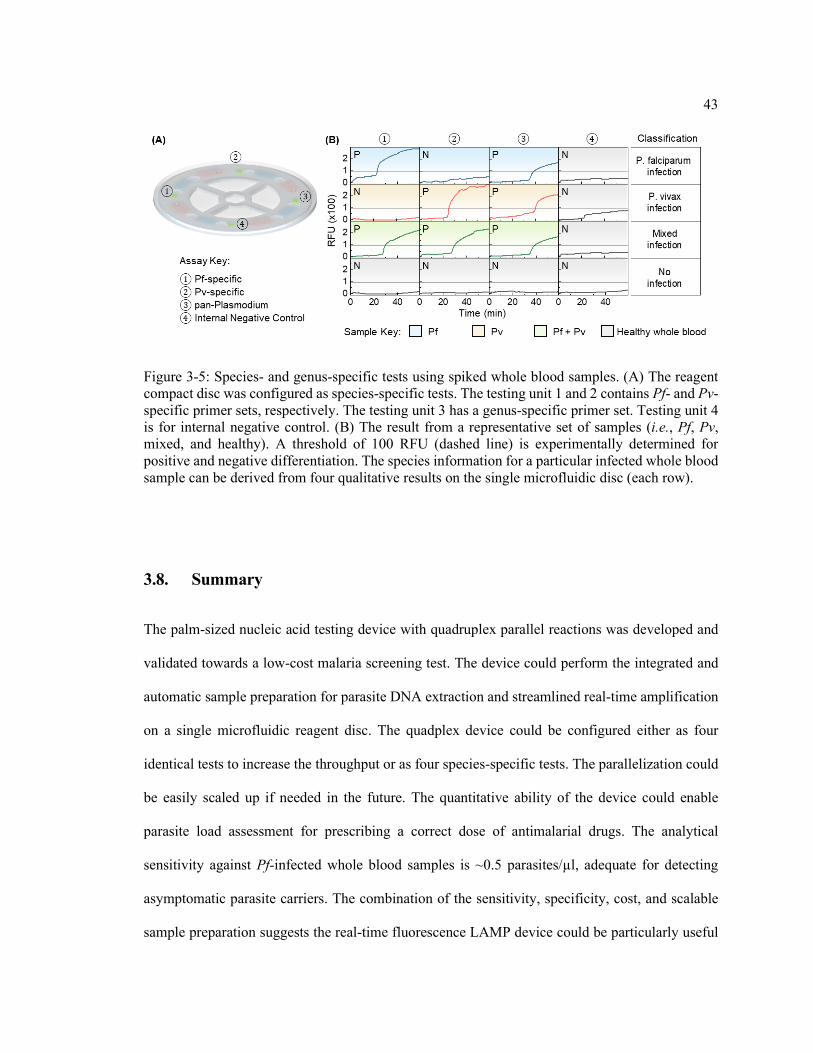
43
3.8. Summary
The palm-sized nucleic acid testing device with quadruplex parallel reactions was developed and
validated towards a low-cost malaria screening test. The device could perform the integrated and
automatic sample preparation for parasite DNA extraction and streamlined real-time amplification
on a single microfluidic reagent disc. The quadplex device could be configured either as four
identical tests to increase the throughput or as four species-specific tests. The parallelization could
be easily scaled up if needed in the future. The quantitative ability of the device could enable
parasite load assessment for prescribing a correct dose of antimalarial drugs. The analytical
sensitivity against Pf-infected whole blood samples is ~0.5 parasites/µl, adequate for detecting
asymptomatic parasite carriers. The combination of the sensitivity, specificity, cost, and scalable
sample preparation suggests the real-time fluorescence LAMP device could be particularly useful
Figure 3-5: Species- and genus-specific tests using spiked whole blood samples. (A) The reagent compact disc was configured as species-specific tests. The testing unit 1 and 2 contains Pf- and Pv- specific primer sets, respectively. The testing unit 3 has a genus-specific primer set. Testing unit 4 is for internal negative control. (B) The result from a representative set of samples (i.e., Pf, Pv, mixed, and healthy). A threshold of 100 RFU (dashed line) is experimentally determined for positive and negative differentiation. The species information for a particular infected whole blood sample can be derived from four qualitative results on the single microfluidic disc (each row).

44
for malaria screening in the field settings. Considering the limited reagent lifetime at room
temperature, the challenge of storage and transport of the liquid phase on the microfluidic reagent
disc needs to be addressed in our future studies, preferably with reagent lyophilization.

Chapter 4 High-throughput And Label-free Parasitemia Quantification For Malaria-infected Red Blood Cells
As a potential label-free mechanical biomarker [100-105], the RBC deformability is highly relevant
to the malaria infection status, thus it can be used as an indicator for understanding malaria
pathophysiology. Although precise cell deformability at single cell level can be achieved using
conventional methods (e.g., micropipette aspiration [106], optical stretching [107], atomic force
microscopy (AFM) [108], and magnetic bead-based rheology [109]), widespread use of cell
mechanotyping in cell screening and medical diagnosis is still hampered by the low throughput
(10-102 cells/hour).
In Chapter 4, we will discuss a high throughput and label-free cell deformability microfluidic sensor
for quantitative parasitemia measurement and stage determination of Plasmodium falciparum-
infected red blood cells (Pf-iRBCs). The cell deformability is measured by evaluating the
translocation time when each cell squeezes through a microscale constriction. More than 30,000
RBCs can be analyzed for parasitemia quantification in under 1 min with a throughput ~500 cells/s.
Moreover, the device can also differentiate various malaria stages (ring, trophozoite, and schizont
stage) due to their varied deformability. As compared to the microscopy and flow cytometry, this
microfluidic deformability sensor would allow for label-free and rapid malaria parasitemia
quantification and stage determination at a low-cost.

46
4.1. Introduction to high-throughput parasitemia quantification by pf-iRBC deformability characterization
Parasitemia is a critical parameter for quantifying the parasite load in the organism and indicates
the degree of an active parasitic infection. Quantitative measurement of parasitemia and stage
determination is important in many phases of malaria assessment, such as the diagnosis and the
therapy follow-up, particularly in the chronic phase [110].
The microscopy-based morphology analysis remains the gold standard for parasitemia
quantification. Although this approach can identify parasitemia as low as 0.001% [111], it has
several drawbacks, including the reliance of an expert reading Giemsa-stained blood smears,
subjectivity, low reproducibility and relatively low speed (5 mins/slide) [112]. The flow cytometry
was developed to overcome the speed limitation of the microscopy. However, the high cost of the
instrumentation and the labeling process limits its widespread usage [113]. Besides, both
microscopy and flow cytometry would require a time-consuming staining process for labeling.
It is well known that Pf-iRBCs become increasingly rigid (less deformable) as they mature [114],
thus the deformability has the potential to be used as a mechanical biomarker to distinguish the
healthy and the infected RBCs at various stages. To date, various microfluidic-based methods have
been developed to interrogate cell deformability. For example, non-physical constraint-based
interrogation (hydrodynamic pressure, e.g., inertial microfluidics [115], and real-time
deformability cytometry [116]), and physical constraint-based interrogation (e.g., single micropore
[117], single microchannel [118, 119], and arrayed microchannels [120-122]). Despite success in
the qualitative measurement of Pf-iRBCs deformability properties, a high throughput quantitative
parasitemia measurement has yet to be developed.

47
In this chapter, we discuss a novel a label-free strategy for quantitative and high-throughput
parasitemia measurement and stage determination for Pf-iRBCs using microfluidic cell
deformability sensor. The microfluidic sensor is capable of analyzing more than 30,000 RBCs
within 1 min (throughput ~ 500 cells/s). Moreover, the device is able to differentiate various malaria
stages among the ring, trophozoite, and schizont stage. We envision that the deformability sensor
will enable careful study on the pathophysiology of malaria-infected red blood cells.
4.2. Cell deformability sensing principle
Figure 4-1a shows the schematic and the corresponding equivalent circuit model for the
microfluidic deformability sensor. The device consists of a well-engineered micropore constriction
(5×5 µm2) for the cell to squeeze through. The loading channel’s cross-sectional area (1000×25
µm2) is much larger than that of the micropore to reduce the hydrodynamic and electrical resistance.
The electrical resistance of the microfluidic sensor is mainly dominated by the micropore
constriction (i.e., Rgap is much larger than other resistances in Figure 4-1b. For a reason, significant
ionic current drop occurs during a single cell translocation event due to the reduced conductance at
the constriction.
Table 4-1: Summary of the microfluidic deformability characterization devices.
DC RT-DC iMCS SMR Deformability
Sensor
Cell Compression Hydrodynamic
Stretching Hydrodynamic
Stretching Collision Constriction Constriction
Deformability Index Aspectio ratio Circularity Aspect ratio (Passage time)-1 Transit time Detection Imaging Imaging Imaging Cantilever Electrical Analysis Offline Real-time Real-time Offline Offline
Throughput (cell/s) 2,000 – 65,000 100 450 1 500 Physical Contact No No Yes Yes Yes
Ref. [115, 123] [116, 124] [125] [126] [127]

48
For electrical measurement, we typically applied a constant voltage (600 mV DC) across the
micropore constriction. The ionic current was monitored as each single individual RBC
translocating through the micropore. The ionic current traces were recorded by an amplifier
(Axopatch 200B, Molecular Devices, USA). The analog output of the amplifier was sampled with
a 16-bit DAQ card (NI PCI-6363, National Instruments, USA) and a data acquisition software
(LabVIEW) (Figure 4-1a). The sampling rate for the measurement was 100 kHz. A custom-built
MATLAB (MathWorks) program was developed to analyze the data off-line. The translocation
time (dwell time) was extracted from each cell when translocating the micropore. The time
threshold to differentiate the hRBC and the Pf-iRBCs was set by the mean value plus three times
sigma of the hRBC dwell time (a Gaussian distribution).
Figure 4-1: Deformability sensor for highly-throughput and label-free parasitemia quantification. (b) The equivalent circuit model for the sensor.
Inlet
Outlet
RBCs In
Filter(a)
(b)
A/D
Electrode
Micropore
Electrode
RCell
Rgap
CCell
CPDMS
RSalt
CDL RDL
Electrical Double layer
CDLRDL
Electrical Double layer
FilterAmp

49
The micropore has a slightly smaller size than that of the RBCs, RBCs have to squeeze through the
micro-constrictions. As a cell pass through a micropore, the friction, which is a normal force to the
channel, determines the velocity of cell at micropore [128]. This normal force depends on cell
deformability. The higher normal force causes higher friction and slows down the cell transit
velocity, leading to a longer translocation time for stiff cells. Therefore, the cell translocation time
can be considered as an indirect indicator for the cell deformability. For example, the rigid Pf-
iRBCs will spend more time (on average) squeezing through the micro-constriction than the more
deformable healthy RBCs (hRBCs). The applied pressure, cell size, deformability, elastic modulus,
pore size, and the surface properties of PDMS and cells are all friction factors [129]. Parameters
other than the cell deformability remain constant for a given experimental setup for consistency.
4.3. Microfluidic deformability sensor fabrication
The cell deformability sensor was designed in a layout editor and printed on a transparent mask.
The polydimethylsiloxane (PDMS) replica was cast out from the SU8 mold. The casting mold was
fabricated by a standard double layer lithography process on a 4-inch silicon wafer. SU8 photoresist
with a thickness of 5 μm and 25 μm were used for the micropore area and loading channel area,
respectively.
The Au/Cr electrodes (20 nm adhesive Cr layer and 80 nm Au layer) were evaporated on cover
glass (thickness ~ 130 μm, Ted Pella) through a laser machined Polymethylmethacrylate (PMMA)
shadow mask. To enhance the signal-to-noise ratio, the microelectrodes were positioned close to
the micropore area. The PDMS replica was permanently bonded to the cover glass through oxygen
plasma treatment.

50
4.4. Device characterization
A mixture of polystyrene microbeads with diameters of 5 µm and 10 µm (with a concentration of
1×10⁵/ml and 3×10⁴/ml, respectively) were used to validate the microfluidic device and the testing
apparatus (Figure 4-1). Figure 4-2a shows the current trace for the mixed microbeads. Figure 4-2b
shows the scatter plot and the histogram of the dwell time versus current dip amplitude (ΔI). Two
separate populations can be clearly observed, representing the two different sized microbeads. The
percentage of each polystyrene beads measured from the device was consistent with the pre-mixed
ratio. This confirmed the functionality of the microfluidic device and the testing apparatus.
Figure 4-2: (a) Current traces measured with the mixed microbeads of 5 µm and 10 µm in diameters. (b) The scattering plot and the corresponding histogram for the measurement.

51
4.5. Differentiating ring stage Pf-iRBCs and hRBCs
To validate the microfluidic sensor for differentiating ring stage Pf-iRBCs and hRBCs, the ring
stage Pf-iRBCs at 12% parasitemia and the control pure hRBCs were tested. To prepare the Pf-
iRBCs, we synchronized the cultured parasite with 5% D-sorbitol to ensure the ring-stage. Prior to
the electrical sensing measurement, 12% parasitemia was confirmed by standard Giemsa staining
thin smear microscopy method. A mixture of Pf-iRBCs and uninfected RBCs were mixed with 1×
phosphate buffer saline (PBS) for electrical measurement. The sample loading pressure applied to
the microfluidic device was 1-1.5 psi (corresponding to a flow rate of ~180 µm/ms), leading to a
measurement throughput ~500 cells /s in our devices.
Figure 4-3: The current trace for the Pf-iRBC sample at 12% parasitemia. (b)-(c) The scattering plot of dwell time and current dip for the pure RBC sample (b) and the Pf-iRBC sample at 12% parasitemia (c). (d-e) Histogram plot of dwell time for the pure RBC sample (d) and the Pf-iRBC sample at 12% parasitemia (e).

52
Figure 4-3a shows a typical current trace, where the translocation time and the current dip for every
single cell can be extracted. Figure 4-3b shows the scattering plot of the dwell time and current dip
for the pure RBCs (100% hRBCs), while Figure 4-3c shows the case for the sample at 12%
parasitemia (i.e., ~12% Pf-iRBCs and ~88% hRBCs). A clear two populations were shown in
Figure 4-3c, representing the Pf-iRBCs and hRBCs in samples at 12% parasitemia.
4.6. Parasitemia quantification
The microfluidic cell deformability sensor can not only qualitatively differentiate ring stage Pf-
iRBCs and hRBCs, but also quantitatively determine the parasitemia. With 2× serial dilution of the
Pf-iRBCs sample at 12% parasitemia, parasitemias of 12%, of 6%, 3%, 1.5%, 0.75%, 0.375%, and
0.1875% were prepared. These samples were tested with the microfluidic cell deformability sensor,
and translocation time for each parasitemia sample exhibited a similar two-peaked normal
distribution.
Figure 4-4 shows the scattering plot of the transit time and current dips for ring Pf-iRBCs samples’
translocation events. A decreasing population with larger translocation time was observed when
the sample parasitemia was reduced (Figure 4-4a). The percentage of the Pf-iRBC population in
each sample was obtained by counting the cells of translocation time below a certain threshold. The
threshold was determined by the mean value plus three times sigma of the control sample with pure
hRBC (a Gaussian distribution). The parasitemia determined by this method was benchmarked with
that determined by the microscopy (Figure 4-4b). The agreement between these two methods
demonstrates the microfluidic cell deformability sensor can be used for parasitemia quantification.
More than 30,000 RBCs can be analyzed within 1 min. As a comparison, the microfluidic cell
deformability sensor is much faster than the microscopy with speed ~ 5 mins/slide [112].

53
Figure 4-4: (a) Scattering plot of dwell time versus ΔI for RBCs with parasitemia of 12%, of 6%, 3%, 1.5%, 0.75%, 0.375%, 0.1875% and the healthy RBCs. (b) Parasitemia determined by the microfluidic deformability sensor versus the parasitemia determined by the microscopy.

54
Yang et al. further explored the qualitative ability of the deformability sensor with trophozoite stage
Pf-iRBC [127]. The more population with longer transit time was observed as parasitemia increases
(Figure 4-5b). The parasitemia determined by deformability sensor and microscopy agreed to each
other with excellent linearity (R2>98%, Figure 4-5c & d). Such results further confirm the
parasitemia quantification ability with the trophozoite stage Pf-iRBC.
4.7. The ability for malaria stage differentiation
In the intraerythrocytic cycle, the P. falciparum parasites evolve from the ring stage to the
trophozoite and finally to the schizont stage. During this process, the stiffness of the red blood cells
increases monotonically from 8 µN/m to 16 µN/m at the ring stage and finally to 53 µN/m at the
schizont stage [114]. Therefore, the dwell time of the Pf-iRBCs is expected to increase as parasites
develop into late stages. We performed the translocation time analysis for the Pf-iRBCs at different
stages using the microfluidic sensors. Figure 4-6 shows the dwell time for three different samples,
(1) the healthy RBCs (Figure 4-6a-b), (2) the mixture of healthy and ring-stage-only Pf-iRBCs
(Figure 4-6c-d), and (3) the mixture of healthy and ring, trophozoite, and schizont stage Pf-iRBCs
(Figure 4-6e-f). A clear right-shift of the dwell time can be observed from Figure 4-6a to Figure
4-6e. Sub-populations of Pf-iRBCs at different stages were distinguishable by multi-peak Gaussian
fitting of the dwell time distribution. This observation is consistent with the fact that Pf-iRBCs
become stiffer as parasites develop into late stages. As a result, the red blood cell deformability
could be used as a potential mechanical biomarker to differentiate malaria at different stages.
Figure 4-5: Scattering plot of transit time versus ionic current dip for the Pf-RBCs with various parasitemia for (a) ring and (b) trophozoite Pf-iRBC. Corresponding parasitemia determined by the microfluidic deformability sensor and the microscopy method for (c) ring and (d) trophozoite Pf-iRBC. Reprinted from ref. [127], Copyright 2017, with permission from Elsevier.

55
To further evaluate the sensor’s stability to monitoring the stiffness change during an
intraerythrocytic cycle (~ 48 hours), Yang et al. continuously monitored the 2% P. falciparum
parasites with the interval of 5~8 hours [127]. The collected transit time data was used to analyze
the iRBCs deformability and parasitemia evolution and to benchmark with the microscopy method.
A right-shift of the transit time can be observed as culture time increases, implying the parasite
evolution from the ring stage and to the late stage of trophozoite and schizont (Figure 4-7a). The
result is again consistent with the fact that Pf-iRBCs become stiffer as parasites grow during the
intraerythrocytic cycle. However, the clear turning point from stage to stage was not observed
during the intraerythrocytic period (Figure 4-7a). This is probably because the asynchronous Pf-
iRBCs contained various stages of Pf-iRBCs at a specific time [130]. This also explains the gradual
parasitemia increase during the intraerythrocytic cycle (Figure 4-7b). Ideally, parasitemia would
Figure 4-6: Scattering plot of the current dip versus the translocation time and the corresponding histograms for (a) healthy RBCs, (b) 12% infected ring stage iRBCs, and (c) a mixture of the ring, trophozoite, and schizont stage parasites in RBCs.

56
not increase for one proliferation cycle (~48 hr). However, increases in parasitemia were also
observed with thin smear microscopy with high linearity (R2>96%, Figure 4-7c) because the
asynchronous Pf-iRBCs already completed the first proliferation cycle and infected more hRBCs
[130].
Figure 4-7: The analysis for the Pf-iRBCs at different stages during the intraerythrocytic cycles. (a) Scattering plot of transit time versus ionic current dip for the Pf-iRBC during the intraerythrocytic cycle at various time spots. (b) The parasitemia quantified by the deformability sensor and microscope during the intraerythrocytic cycles. (c) Comparison of parasitemia between the deformability sensor and the microscope. Reprinted from ref. [127], Copyright 2017, with permission from Elsevier.

57
4.8. Summary
This work demonstrated an electrofluidic sensor for accurate and quantitative parasitemia
measurements. This microfluidic device uses the deformability as the mechanical biomarker to
differentiate the healthy RBCs and P. falciparum-infected RBCs. The electrofluidic sensor was
able to quantify the parasitemia in a very short amount of time (<1 min) by analyzing a large
population of red blood cells (>30 k) in high throughput (~ 500 cells/s) manner. Moreover, the
electrofluidic sensor is able to differentiate various malaria stages. As compared to the microscopy
and flow cytometry, this microfluidic device would allow for label-free, rapid, and low-cost malaria
parasitemia quantification and stage determination.

Chapter 5 Deformability-Activated Cell Sorting (DACS)
Gametocyte maturation in P. falciparum is a critical step in the transmission of malaria [21, 22],
thus realizing gametocytes in the bloodstream would be a powerful tool for surveillance in malaria
elimination setting [21]. However, one of the biggest challenges to recognize gametocyte in the
blood is its rarity.
In Chapter 4, we demonstrated that mechanical properties could be an excellent label-free
biomarker for recognizing malaria-infected RBCs. However, the current deformability
measurement device has not been integrated with deformability-based cell sorting, which is
essential for concentrating gametocytes. In this chapter, we will discuss the first single-particle-
resolved cytometry-like deformability-activated cell sorting (DACS) in the continuous flow on a
microfluidic chip. Compared with existing deformability-based sorting techniques, the microfluidic
device presented in this work measures the deformability and immediately sorts the cells one-by-
one in real-time. It integrates the transit-time-based deformability measurement and active
hydrodynamic sorting onto a single chip. We identified the critical factors that affect the sorting
dynamics by modeling and experimental approaches. We found that the device throughput is
determined by the summation of sensing, buffering, and sorting time. The total time of ~100 ms is
used for analyzing and sorting a single particle, leading to a throughput of 600 particles/min. We
synthesized poly (ethylene glycol) diacrylate (PEGDA) hydrogel beads as the deformability model
for device validation and performance evaluation. A deformability-activated sorting purity of 88%
and an average efficiency of 73% were achieved.

59
5.1. Introduction to deformability-based sorting
Gametocyte concentration is informative for predicting parasite transmission potential to mosquito
[131]. Assessing the number of parasite present in the bloodstream is of interest to identify the
source of gametocyte carriers and to disrupt malaria transmission [132]. While molecular detection
of gametocytes could be a possible approach, genetic characterization is often limited because
gametocytes comprise a small fraction of the total parasites in the bloodstream [21]. Realizing a
fraction of gametocytes in the blood requires separation from asexual parasites and enrichment. In
addition to gametocyte density, gametocyte production time and their lifespan are critical factors
affecting malaria transmission [133]. Therefore, a reliable biomarker that can sort gametocyte, as
well as monitor gametocyte production, is urgently needed.
Several studies reported that matured stage gametocytes are more deformable than the asexual stage
parasites-invaded RBCs [134, 135]. This implies that cell deformability can be used as a label-free
biomarker for gametocyte separation and enrichment. Various microfluidic deformability-based
passive particle separation devices have reported (e.g., inertial microfluidics [7], pinch flow
fractionation [136, 137], acoustofluidics [138], and deterministic lateral displacement [114, 139,
140]). While these passive methods are effective and have good throughput, the quantitative
deformability information of an individual cell is inaccessible (see Table 5-2). A fluorescence-
activated cell sorting (FACS)-like device that measures the single particle deformability in real-
time and actively sorts the particles with a particular deformability property is highly desirable and
has yet to be developed. In recognition of this critical need, we here demonstrated a microfluidic
single-particle-resolved, cytometry-like deformability-activated sorting device. The device
seamlessly integrates single-particle deformability sensing and active hydrodynamic sorting into a
single microfluidic chip.

60
Tabl
e 5-
1: S
umm
ary
of th
e m
icro
fluid
ic d
efor
mab
ility
-bas
ed c
ell s
ortin
g de
vice
s.
M
icro
- fil
trat
ion
D
iago
nal
Rid
ge
DL
D*
Iner
tial
RC
T*
Rat
chet
s O
pto-
flu
idic
s A
cous
to-
fluid
ics
Hyd
ro-
dyna
mic
s Se
para
tion
ty
pe
Bul
k B
ulk
Bul
k B
ulk
Bul
k B
ulk
Act
ive
Act
ive
Act
ive
Sepa
ratio
n m
echa
nism
si
ze
excl
usio
n ce
ll co
mpr
essi
on
stre
amlin
e
arou
nd
mic
ropo
st
arra
y
lift f
orce
s, se
cond
ary
flow
s tra
ppin
g Ir
reve
rsib
le
ratc
het
mec
hani
sm
optic
al fo
rce
(ref
ract
ive
inde
x d
iffer
ence
)
acou
stic
ra
diat
ion
forc
e
Hyd
ro-
dyna
mic
pu
sh-p
ull
Sepa
ratio
n cr
iteri
a si
ze,
defo
rmab
ility
si
ze,
defo
rmab
ility
si
ze,
defo
rmab
ility
si
ze,
defo
rmab
ility
si
ze,
defo
rmab
ility
si
ze,
defo
rmab
ility
D
efor
m
-abi
lity
Def
orm
-a
bilit
y D
efor
m
-abi
lity
Thr
ough
put
(cel
ls/m
in)
104
104
107
106
105
103
1 10
3 60
0
Puri
ty (%
) 80
- 99
65
– 9
9 90
- 98
80
-
62 –
95
73 –
75
50.3
- 91
.3
~ 88
E
nric
hmen
t (f
old)
14
0 - 2
32
185
- 10
0 - 3
00
183
210
~3
~10
~8
Ref
. [1
-3]
[4, 5
] [6
] [7
, 8]
[9-1
2]
[13-
16]
[17]
[1
8]
[19]
D
LD: d
eter
min
istic
late
ral d
ispla
cem
ent
RC
T: re
setta
ble
cell
trapp
ing

Compared to existing deformability-based sorting techniques, the demonstrated microfluidic
device measures the deformability and immediately sorts the deformable particles one-by-one in
real-time. The deformability is measured by evaluating the transit time during which an individual
particle squeezes through a microscale constriction [141], while the active particle sorting is
implemented by hydrodynamic flow control. We studied the factors affecting the sorting dynamics
in a continuous flow by carrying out both modeling and experiments. To validate the device and
evaluate its performance, we synthesized PEGDA hydrogel beads as the deformability model cells.
We demonstrated a sorting purity of 88% and an efficiency of 73%. We achieved single-particle
processing (analyzing and sorting) time of 100 ms, corresponding to a throughput of 600
particles/min. We envision that the real-time deformability-activated cell sorting (DACS) can be
used to increase parasite detectability on gametocytes that commonly circulate at low densities.
5.2. Working principle
Figure 5-1A shows the schematic of a device that integrates single-particle deformability sensing
and sorting into a continuous-flow microfluidic chip. A buffering region was included to reduce
the crosstalk between the consecutive sensing and sorting. The deformability sensing was indirectly
performed by the previously validated constriction-based transit time measurement [118, 141-144].
Briefly, soft particles take less time to squeeze through the sensing pore, while rigid particles take
more time (Figure 5-1B). Therefore, the transit time is an indicative measurement of the particle
deformability. Immediately after measuring the particle transit time, a threshold-based triggering
signal was used for sorting.
The sorting was achieved by a hydrodynamic push-pull mechanism through pneumatic control.
Hydrodynamic sorting minimizes the potential damage to cell viability and requires no specific

62
buffer solutions [145, 146]. Two identical sorting channels (S1 and S2) were filled with buffer
solutions and connected to two independently controlled high-speed solenoid valves (V1 and V2,
response time ~8 ms). Both valves were connected to the same pressure source (typically
approximately 0.3 psi). The pressure that drives each sorting channel was mediated by a solenoid
valve to generate digital V1-V2 combinations of 00, 01, 10, and 11 (note that 00 is not used since
the residue pressure is not well defined when the valve is off). Both valves were normally on (case
of 11); thus, the default flow in the sorting region was focused on the middle of the channel and
directed to the waste outlet (middle case in Figure 5-1C). If the transit time was shorter than the
sorting threshold (soft particle), V1 was activated (turned off, status 0) by a voltage pulse to
temporally direct the streamlines towards outlet 1 (top case in Figure 5-1C). The opposite action
was taken for rigid particles (bottom case in Figure 5-1C).
Figure 5-1: Deformability-activated particle sorting device principle. (A) A top-down image of the microfluidic chip with various functional parts (scale bar: 50 µm). Two sorting flows (S1 and S2) were connected to the same pressure source and independently controlled by fast-response solenoid valves (V1 and V2). The inset illustrates the micro-constriction structure for deformability sensing. (B) Transit time-based deformability measurement. (C) Hydrodynamic sorting mechanism by programming the solenoid valves V1 and V2. The left and right columns are the simulated streamlines and the observed fluorescent dye (1 mM calcein) under different combinations of pneumatic valve status.
(A) (B)
V1 ON
V2 ON
V1 ON
V2 ON
V1 ON
V2 OFF
V1 ON
V2 OFF
V1 OFF
V2 ON
V1 OFF
V2 ONCur
rent
Time
Soft
Time
Cur
rent
None
Time
Cur
rent
Rigid
(C)
Sorting
V1
V2
Sample InWaste
Outlet 2
SoftRigid
Buffering
Outlet 1
Sensing
S1
S2
P
P

63
5.3. DACS instrumentation
5.3.1. Microfluidic DACS device fabrication
The photomask was designed using CAD software and printed on a transparent film. The SU-8
mold was fabricated by a two-step lithography process on a 4-inch silicon wafer. The regions with
heights of 80 µm (loading/buffer/sorting area) and 15 µm (constriction micropore area) were
created using SU-8 2050 and 2010, respectively, and confirmed with a profilometer. The designed
constriction pore width was 14 µm, optimized for our synthesized Poly(ethylene glycol) diacrylate
particles (diameter of ~14 µm). A 10:1 w/w mixture of base and curing agent for
polydimethylsiloxane (PDMS) (Sylgard, Dow Corning, USA) was prepared. It was optional to add
Triton X-100 (EMD Millipore) with a volume ratio of 0.5% to increase the wettability of the
microfluidic channels [147]. Before bonding, fluidic inlets and outlets were punched using a
stainless needle (diameter of 0.75 mm). The resulting PDMS stamps were permanently bonded to
glass slides (100 µm thickness, Ted Pella) by oxygen plasma treatment.
To avoid the double-layer capacitance effect, we used custom-built Ag/AgCl electrodes to measure
electrical signal. Ag/AgCl electrodes were fabricated by chloriding 0.375 mm Ag wires (Warner
Instruments, Hamden, USA) in a 1 M KCl solution. A small hole was punched from the outside
wall of the tygon tubing, and Ag/AgCl electrodes were threaded through this hole into the inside
of the tube, followed by epoxy sealing. This customized tubing provides both electrical and fluidic
access to the microfluidic device.

64
5.3.2. Testing Apparatus
Transit-time-based deformability sensing. The electrical measurement was performed inside a
customized Faraday cage to provide shielding from environmental noise. A syringe pump (Harvard
Apparatus PHD 2000) was used to introduce the sample into the microfluidic chip. A total of 500
mV was applied across the sensing pore, and the ionic current was continuously monitored by a
trans-impedance amplifier (DHPCA-100, FEMTO, Germany). The analog output of the amplifier
was sampled at 1 MHz with a 16-bit DAQ card (NI PCIe-6351, National Instruments). The data
were processed online using a real-time algorithm (LabVIEW) to extract the particle transit time
and the current dip when individual particles translocate the micropore (Figure 5-2).
Deformability triggered sorting. Electrically activated 3-way normally open solenoid valves
(S10MM-31-24-2, Pneumadyne) were used for pneumatic control. Both solenoid valves were
connected to a piezoelectric micropump (Elveflow AF1, France) with constant pressure (usually
from 0.3 to 0.5 psi). The solenoid valves were turned off through a DAQ-generated pulse, triggered
by comparing the transit time against a gating threshold time. The pulse duration was set to 40 ms.
Note that sensing and sorting occurred in real-time through custom-built LabVIEW pr(Figure 5-2).
Pressure source
ON/OFF
High-speedsolenoid valves
DAQTIA
I/V
Rf
DAQ (Vbias)
Real-time transit time extraction
for deformability
Deformability-based
sorting trigger
Ag/AgClelectrodes
RchannelRpore
Microfluidic device layout
ON/OFF

65
5.4. Numerical simulation
5.4.1. Computational domain of the simulation model
A two-dimensional computational domain (Figure 5-3A) was used to explore the effect of the
parameters (e.g., sample flow rate, sorting pressure, the spacing between particles, and pressure
relaxation time) on the sorting performance. The Navier-Stokes equations (Eq. 1) and particle
tracing equations (Eq. 2) were used to model the particle motion in the microfluidic channel
network during the hydrodynamic actuation.
𝜌𝜌𝑓𝑓𝜕𝜕𝜕𝜕𝜕𝜕𝜕𝜕
= ∇ ∙ −𝑝𝑝𝑝𝑝 + 𝜇𝜇∇U + (∇U)T
𝛻𝛻 ∙ 𝜕𝜕 = 0 (Incompressible flow)
(Eq. 1)
where ρf is the fluid density, µ is dynamic viscosity, t is time, U is the fluid velocity, p is applied
pressure, and I is identity tensor. Constant volume flow rate boundary condition was used at the
sample inlet. The time-dependent pressure was applied in parallel sorting flows based on the sorting
configuration. To include hydrodynamic impedance (resistance and capacitance) in the model, a
characteristic time 𝜏𝜏 (pressure relaxation time) was added in the time-dependent pressure profile.
The atmospheric pressure is applied as the outlet boundary condition.
Figure 5-2: Detailed system diagram for the deformability activated sorting device. The real-time deformability sensing algorithm detects the particle transit time within a rolling sampling window, which is used to trigger a fast-switching solenoid valve for sorting.

66
The particle motion was explained by the drag force exerted on the particle. The governing equation
for particle tracing is as follows:
𝑚𝑚𝑝𝑝𝑑𝑑𝑣𝑣𝑝𝑝𝑑𝑑𝜕𝜕
= 𝐹𝐹𝐷𝐷
𝐹𝐹𝐷𝐷 = 1𝜏𝜏𝑝𝑝𝑚𝑚𝑝𝑝𝜕𝜕 − 𝑣𝑣𝑝𝑝 , 𝜏𝜏𝑝𝑝 = 𝜌𝜌𝑝𝑝𝑑𝑑𝑝𝑝2
18𝜇𝜇
(Eq. 2)
where FD is the drag force, νp is particle velocity, mp is particle mass, ρp is particle density, and dp
is particle diameter. The particles were assumed to be a circular shape with a density of 1050 kg/m3
and a diameter of 5 µm.
The particle spacing time Ts is related to the sample concentration as C = 1/𝑊𝑊𝑊𝑊𝑊𝑊 , where W is the
width, L is length, and H is the height of the channel (Figure 5-3B). The velocity of the particle Vp
is 𝑉𝑉𝑝𝑝 = 𝑊𝑊/𝑇𝑇𝑠𝑠, where Ts is time spacing between adjacent particles. Vp can also be expressed in terms
of volume flow rate as 𝑉𝑉𝑝𝑝 = 𝑉/(𝑊𝑊𝑊𝑊), where 𝑉 is the volume flow rate. Therefore, the particle
spacing time Ts can be written as 𝑇𝑇𝑠𝑠 = 1/(𝐶𝐶𝑉𝑉).
Table 5-1 summarizes all parameters and boundary conditions used in this study.
L W
H
(A) (B)
Ts VP
Outlet 2
Waste
Outlet 1
Sample mass flow Sorting
flow
Sorting flow
5 µm Microfluidic channel
Particle 1Particle 2

67
5.4.2. Factors affecting consecutive sensing and sorting under the worst-case scenario
While the device principle is straightforward, it involves many coupled processes that need to be
synchronized in the continuous flow. To gain deep insight into the proper experimental setup and
ensure device reliability, we set out to study the device sorting dynamics when operated under the
worst-case scenario. The worst-case scenario is defined as the case in which consecutive particles
are alternately directed to two sorting outlets, that is, the 1st and 3rd particles are directed to outlet
1, while the 2nd and 4th particles are directed to outlet 2, and so on. In this case, it takes the longest
time to deflect the flow to achieve correct sorting.
Figure 5-3: (A) Computational domain of the simulation, (B) Illustration of two adjacent particles in a continuous flow. Ts represents time spacing between particles, Vp is the particle velocity in the microfluidic channel. The minimum Ts (Tsmin) determines the maximum sorting throughput (1/Tsmin). The constant Vp is assumed for the particles traveling on the identical streamline. H, L, and W are height, length, and width of the fluidic channel in the sorting area.
Table 5-2: Effective sorting parameters used in the numerical simulation.
Symbol Parameter Value Unit µf Fluid dynamic viscosity 8.90 × 10⁻⁴ Pa.s ρf Fluid density 997 Kg/m3 ρp Particle density 1050 Kg/m3 Dp Particle diameter 5 µm 𝑉 Volume flow rate Variable µl/h p Pressure for sorting flow Variable psi Ts Time interval between particles Variable Sec Tsmin Minimum Ts Variable Sec Tvalve Valve response time Variable Sec Tsens Sensing time window Variable Sec 𝜏𝜏 Pressure relaxation time Variable Sec

68
Figure 5-4A shows the time-dependent pressure that drives the flow in the sorting channels S1 and
S2. In this schematic, it was assumed that successive particles arrive at the sensing pore with a
periodic interval Ts (time 1, 4, and 7). Specifically, at time 1, the first particle enters the sensing
pore. It then takes a time span of Tsens to complete the deformability measurement. Note that Tsens
should be longer than the intrinsic particle transit time to achieve a reliable measurement. At the
end of the deformability sensing (time spot 2), V1 is pulsed off with a duration Tvalve. This off-
duration can be programmed by the triggering voltage pulse. Note that the pressure that drives the
S1 channel does not immediately drop to zero when the valve is turned off. A relaxation time 𝜏𝜏 is
always needed for the transition. This relaxation time comes from the hydrodynamic capacitance
Figure 5-4: Factors affecting consecutive sensing and sorting under the worst-case scenario. (A) Time sequence of the pressure profile for driving the two sorting flows (red for S1 and blue for S2) under the worst-case scenario. Tsens: sensing time, 𝜏𝜏: system relaxation time, Tvalve: valve pulse off time, and Ts: particle spacing time. (B) Successful sorting regions in the Tvalve - Ts plot. Successful sorting is defined as the case when the device can handle the worst-case scenario, that is when consecutive particles are alternately directed into different outlets. 1/Tsmin corresponds to the highest sorting throughput. (C) Tsmin as a function of the sample flow rate. (D) Tsmin as a function of the sorting pressure. (E) Tsmin as a function of the system relaxation time.

69
in the system and the solenoid valve response time. At time 3, V1 resumes normal ‘on’ status.
Again, the pressure that drives the S1 channel does not immediately jump to full pressure when the
valve is turned on. After another relaxation time 𝜏𝜏, the device is ready for the next particle. At time
4, the second particle enters the sensing pore, and similarly, V2 is closed off by the triggering pulse
to direct this particle into the opposite outlet.
With the sequence shown in Figure 5-4A, we varied the simulation parameters and evaluated
whether consecutive sorting could be successfully performed under the worst-case scenario (Figure
5-5). We examined different combinations of valve actuation time Tvalve and particle spacing time
Ts. Figure 5-4B illustrates the successful parameter region on the Ts - Tvalve map with a sample flow
rate of 10 μl/hr, sorting pressure of 0.5 psi, and 𝜏𝜏 of 20 ms. As shown in Figure 5-4B, there is a
lower limit of Tvalve for correct sorting regardless of the particle spacing time Ts. This lower limit of
the valve pulse time is determined by the system relaxation time 𝜏𝜏 (usually 10-20 ms). This can be
easily understood by the fact that Tvalve shorter than 𝜏𝜏 will not lead to the required stable ‘off’
pressure for flow deflection. Figure 5-4B also shows that there is a lower limit of Ts (denoted by
Tsmin). This means that two successive particles cannot be too close to each other for sorting under
the worst-case scenario. In addition, it is clear from Figure 5-4B that the upper limit of Tvalve is
dependent on Ts. This is not surprising since keeping the valve actuated longer than the particle
interarrival time would lead to the particle being incorrectly sorted.

70
The Tsmin annotated in Figure 5-4B essentially determines the sorting throughput (i.e., 1/Tsmin is the
highest achievable throughput). With the aim of improving the operation throughput, we studied
the effect of the sample flow rate, sorting pressure, and system relaxation time on Tsmin. Figure 5-4C
shows that the throughput can be enhanced with a higher sample flow rate. However, the sample
flow rate cannot be arbitrarily high since the sorting cannot catch up with the fast-appearing
individual particles (Figure 5-5B). In our experiment, the sample flow rate was set to 10-20 µl/hr.
Figure 5-4D shows that the throughput can also be enhanced by using a high sorting pressure. This
is because the high pressure leads to high flow velocity in the sorting channel, which can deflect
the particle faster at the sorting junction. However, there is an upper limit of the sorting pressure,
beyond which particle backflow occurs (Figure 5-5C). In our experiment, the sorting pressure was
Figure 5-5: Simulation results of consecutive sorting with varying parameters. (A) Successful sorting of consecutive particles. (B) Unsuccessful sorting occurs because sorting cannot catch up with the fast appearing particles. (C) Unsuccessful sorting happens because excessive sorting pressure causes backflow.
(A) Successful sorting (sorting pressure 0.5 psi, sample flow rate 10 µl/hr)
(B) Unsuccessful sorting (sorting pressure 0.5 psi, sample flow rate 40 µl/hr)
(C) Unsuccessful sorting (sorting pressure 5 psi, sample flow rate 10 µl/hr)
T0 T1 T2 T3
T0 T1 T2 T3
T0 T1 T2 T3

71
set to 0.3-0.5 psi. Figure 5-4E shows that a smaller system relaxation time 𝜏𝜏 can help enhance the
throughput. Therefore, use of a fast-response solenoid valve and reduction of the system
capacitance are preferred. Our system has a relaxation time of approximately 10-20 ms.
5.5. Validation of hydrodynamic sorting by order
To experimentally validate the simulation results, we prepared a polystyrene bead (Polyscience)
sample of concentration 106/ml with 1 mM calcein and 0.05% Tween-20 added and buffered in 1×
PBS. The calcein dye was added for flow streamline visualization. The sorting algorithm was
modified such that the beads were sequentially sorted to the opposite outlets based on their passing
order in the sensing region. For example, the 1st, 3rd, and 5th would be directed to outlet 1, while the
2nd, 4th, and 6th would be directed to outlet 2. The sample flow rate was 10 µl/hr, the sorting pressure
was 0.5 psi, and the trigger pulse was set to 40 ms for the solenoid valve (Tvalve=40 ms). The sorting
dynamics were recorded using a high-speed CCD camera with a frame rate of 125 fps. Figure 5-6
shows the sequential particle deflection in the intended sorting sequence. Under the default
condition, the sorting flow pinched the sample flow (bright streamlines) into the center of the
channel and was directed towards the waste outlet. To deflect the 1st and 3rd beads, V1 was closed,
resulting in bead deflection towards outlet 1. Reversing the valve configuration drove the 2nd and
4th beads into outlet 2. This directional motion was described in the Zweifach-Fung effect [148],
where the particle moved towards the branch with a higher flow rate at the bifurcation. Guided by
the simulation results, this sorting-by-order experiment laid out the correct sorting parameter region
and paved the way for the following deformability-activated particle sorting.

72
5.6. Synthesis of PEGDA hydrogel beads by droplet microfluidics
Poly(ethylene glycol) diacrylate (PEGDA, MW 700 Da) was first dissolved in deionized water to
yield the desired concentration (w/w). The thermal initiator Ammonium persulfate (APS, VWR)
was added to the PEGDA precursor solution at a 10% (w/v) concentration. The resulting solution
was used as an aqueous phase to synthesize water-in-oil microdroplets (Figure 5-7). The oil phase
consists of mineral oil (Sigma-Aldrich) and 1% Span 80 (w/w). The aqueous phase and oil phase
were introduced using a piezoelectric micropump (AF1, Elveflow, France) with pressures set at 2.3
psi and 4.5 psi, respectively. The synthesized droplets were harvested into a 1.5 ml tube and
incubated at 40 °C for 12 hours for polymerization. To remove the oil, we performed sequential
washing steps, using PBS with 0.05% Tween-20. Finally, the bead-containing solution was filtered
using a cell strainer with a mesh size of 15 μm (43-50015-03, pluriSelect, Germany). After
filtration, the uniform-sized beads were confirmed with the microscope (Figure 5-8).
Figure 5-6: Validation of the hydrodynamic sorting by order. A single-layer microfluidic device (height and width at the constriction region are 40 and 18 µm, respectively) is used to test the particle deflection. The frames shown are in sequence. Fluorescent dye (bright area) was used to visualize the sample flow deflection (scale bar: 100 µm).
2nd bead
4th bead3rd bead
1st bead
T0 = 0 s T1 = 0.24 s T2 = 6.46 s T3 = 6.58 s
T6 = 10.48 s T7 = 10.56 s T8 = 14.62 s T9 = 14.66 s

73
Figure 5-7: Synthesis of uniformly sized PEDGA hydrogel microbeads using microfluidic droplet generator. (A) Uniform-sized water-in-oil emulsion (scale bar: 50 µm). (B) Synthesized PEDGA hydrogel microbeads under bright-field microscopy (scale bar: 20 µm). (C) fluorescence image of PEDGA hydrogel microbeads (scale bar: 20 µm).
Figure 5-8: Microscope images of in-house fabricated 12.5% PEGDA hydrogel beads. The bead size variation before the filtration comes from the pressure variations in the microfluidic droplet generator chip. After the filtration, uniform beads with diameters of ~14 µm were obtained.
Precursorsolution
Mineral Oil
Mineral Oil
Nozzle (10 µm)
(A) (B)
(C)
Before filtration After filtration
30 µm30 µm

74
5.7. PEGDA hydrogel microbeads as deformable gametocyte models
For various deformability studies, a major challenge is the lack of model particles with defined
deformability properties. While agarose beads were previously used for this purpose [149], we were
not able to make stable agarose beads in PBS for long-term measurements (Figure 5-9). To address
this issue, we switched to alternative materials. It is well known that the extent of polymeric
network cross-linking is related to the material mechanical properties [150, 151]. Therefore, we
manufactured customized deformable particles using PEGDA hydrogel microbeads as a
gametocyte model at various PEGDA concentrations (7.5%, 10%, 12.5%, 15%, 17.5% (w/w)).
These hydrogel beads were synthesized in-house using droplet microfluidics to ensure uniform size
distributions (see Figure 5-7 and Figure 5-8). Prior to the experiment, synthesized PEGDA beads
were filtered using a 15 µm mesh cell strainer for monodispersed samples in size. The bead size
uniformity was also confirmed with optical imaging analysis (Figure 5-8). Our synthesized PEGDA
beads were found to be very stable after months of storage.
Figure 5-9: Agarose bead synthesis using a microfluidic droplet generator. (1) Generation of agarose beads in mineral oil, (2) Agarose beads after gelation, (3) Agarose beads after washing, and dispensed into PBS solution. We found the agarose beads start to coalesce with each other after washing and dispensed into PBS solution. After about 1 hour, these agarose beads were fully dissolved into the PBS at room temperature. This behavior is likely due to our agarose beads were not strongly cross-linked.
2) After gelation 3) Adding PBS1) 1% Agarose droplet generation
100 µm 20 µm 20 µm

75
Figure 5-10 shows the results for the transit-time-based characterization of the model particles with
different PEGDA concentrations. Figure 5-10A illustrates the representative current traces. Single-
particle events were clearly observable. The transit time and current dip from each particle can be
extracted. The right panels in Figure 5-10A show representative events at different PEGDA
concentrations. Similar ionic current dips were observed for different PEGDA concentrations,
expected from the uniform particle size (Figure 5-7 and Figure 5-8). On the other hand, the transit
time becomes longer when increasing the PEGDA concentration (as can be clearly seen from the
representative cases in Figure 5-10A). Figure 5-10B shows the transit time distribution for the
model particles with different PEGDA concentrations. A clear right-shift of the transition time was
visible when increasing the PEGDA concentration. To quantify the relationship, Figure 5-10C plots
the transit time as a function of the PEGDA concentration. A linear relationship was observed,
similar to observations made in previous studies using agarose gel beads [149]. This well-
established relationship between the transit time and the PEGDA concentration confirms that the
transit time could be used as an effective deformability marker. It is interesting to note that the
transit time variance increases when increasing the PEGDA concentration (Figure 5-10C). This
observation is in good agreement with previous results on direct mechanical characterization [152].
We believe that the PEGDA-based deformability model particles would find various applications
in future cell-mechanotyping-related research [129].

76
5.8. Deformability-activated sorting: throughput, purity, and efficiency
To evaluate our single-particle-resolved deformability-activated sorting, we used 7.5% and 14%
PEGDA hydrogel microbeads to represent two populations of particles of different deformability.
Both model particles have a mean diameter of 14 µm. To distinguish these two populations under
the microscope, 1 mM calcein dye was added to the 14% PEGDA hydrogel microbeads (rigid
particles, red dashed circles in Figure 5-11). Each model particle was independently adjusted to a
concentration of 2×10⁶/ml by adding PBS with 0.05% Tween-20. To prepare a mixed sample
containing both populations, equal volumes from each model particle-containing solution were
mixed thoroughly before loading to the microfluidic chip. The sensing window (Tsens) was set to 60
Figure 5-10: Characterization of the deformable PEGDA hydrogel beads. (A) Ionic current time traces (left), and the enlarged view of a single representative particle with the transit time denoted (right). (B) Distribution of the transit time of model deformability particles at different PEGDA concentrations (N= 1243 (7.5%), 1243 (10%), 604 (12.5%), 765 (15%), and 928 (17.5%)). The bin size is 1.1 ms. (C) Correlation between transit time and PEGDA concentration.

77
ms since the particles had a transit time range of 5-25 ms (Figure 5-11B). To enhance the sorting
purity, the sorting algorithm was programmed to sort only particles with well-defined transit time
signals. Once the transit time (i.e., cell deformability) was measured, a corresponding solenoid
valve was trigged with a pulse duration of 40 ms (Tvalve) to actuate the sorting. The transit time
threshold was set to 10 ms to distinguish between the soft and rigid populations.
Due to the fluorescent dye in the 14% PEGDA hydrogel beads, we were able to trace the particles
by imaging to determine if the soft and rigid particles were correctly sorted. Figure 5-11 shows the
representative images of three particles sequentially passing through the deformability sensing pore
and then being sorted. As shown, it takes approximately 300 ms to correctly sort these three
particles, leading to a throughput of approximately 600 particles/min.
Table 5-2 summarizes the sorting results. It was found that ~88% sorting purities were achieved
for both soft and rigid particles. The incorrect sorting was mainly due to the insufficient time gap
(Ts) between consecutive particles. Our system has a relaxation time of approximately 20 ms. It
Figure 5-11: Device validation with deformability PEGDA hydrogel beads. The rigid particles (with the dye added, bright edge) and soft particles (dark) are marked with red and yellow circles, respectively. The pulse duration of the sorting signal was 40 ms in this experiment (scale bar: 100 µm).
T0 = 0 ms T1 = 33 ms T2 = 198 ms
T3 = 231 ms T4 = 297 ms T5 = 330 ms
Bead 1 sorted to rigid channel
Bead 2 sorted to soft channel
Bead 3 sorted to rigid channel
123
SoftRigid 1
23 2
2
3
33
3
3rd bead analyzedReady for sorting
2nd bead analyzedReady for sorting
1st bead analyzedReady for sorting

78
takes approximately 40 ms for the sorting pressure to fully stabilize between high and low levels.
Therefore, the minimal particle spacing time (Tsmin annotated in Figure 5-4B) is 40 ms. Any two
particles too close to each other could be sorted incorrectly. This observation matches the
simulation results, which indicated that minimal Ts is required for successful sorting under the
worst-case scenario.
Table 5-2 also shows the sorting efficiency for soft and rigid particles at 81.35% and 65.83%,
respectively. The average sorting efficiency for both types is 73%. The sorting efficiency was
mostly affected by the variations of the particle travel time between the buffering region and the
sorting region (Figure 5-1A) due to the parabolic laminar flow velocity profiles. If the time it takes
for a particle to travel from the buffering region to the sorting region is mismatched with the sorting
pulse ‘off’ time, the corresponding particle will be directed to the waste channel. A straightforward
solution to this issue is to decrease the channel width of the buffering region (and extend the length
to produce a contact travel time). Another factor that affects the sorting efficiency is the accuracy
of the transit time measurement since this is the basis for the trigging signal. When the transit time
measurement is uncertain (e.g., multiple or partial peaks within the sampling window), our
algorithm ignores this particular particle, and no sorting action is taken. This contributes to some
of the particles being directed into the waste channel, which reduces the sorting efficiency.
Table 5-3: Sorting performance metrics using model soft and rigid beads.
Outlet Target # of soft beads # of rigid beads Purity (%) a Efficiency (%) b
Outlet 1 Soft 205 28 87.98 81.35
Waste - 24 67 - -
Outlet 2 Rigid 23 183 88.83 65.83 a Purity defined as the particle fraction appearing at each collection outlet where the particles were intended to be. b Efficiency defined as the ratio of target particles at the desired outlets to those at the inlet.

79
5.9. Summary
In summary, we demonstrated a first-of-its-kind, single-particle-resolved, cytometry-like
deformability-activated sorting in continuous flow on a microfluidic chip. Compared to the bulk-
based deformability separation methods and traditional micropipette aspiration single-particle
deformability measurement, the demonstrated device stands out in terms of the tradeoff between
the throughput and the single-particle resolution. Both modeling and experimental results reveal
that there is a lower limit of the particle spacing (and thus an upper limit of the throughput) for
correct deformability-activated sorting. With the well-characterized PEGDA hydrogel beads, we
demonstrated an operation throughput of ~600 particles/min, which can be further improved by
reducing the system relaxation time. In addition, multiplexed channels could also be implemented
in the future to further enhance sorting throughput. We demonstrated a sorting purity of ~88% and
an efficiency of ~73%, which can be improved by introducing better particle spacing. For future
validation with polydisperse biological cells, an on-chip size filtration should be incorporated to
ensure that the cell size is suitable for squeeze-based deformability sensing.

80
Chapter 6 Time-division Multiplexing Accessing (TDMA) Microfluidic Device For High-throughput Resistive Pulse Sensing
We demonstrated “first-of-its-kind” deformability-activated cell sorting (DACS) for gametocyte
enrichment in Chapter 5. While evaluating the sorting performance, we found that deformability-
based sensing is a rate-limiting step for deformability-activated cell sorting. To address this
limitation, multiple pore-based cell deformability sensing integrated with DACS can be considered.
However, the scalability of deformability sensing array is often limited by the cost because each
fluidic channel would require an independent measuring unit. An ideal multiplexed deformability
sensor should have a single output to interface with the single-input instrument easily.
In Chapter 6, we present a microfluidic time-division multiplexing accessing (TDMA) resistive
pulse sensing, in which the deformability of malaria-infected RBCs can be analyzed through a
scalable number of microfluidic channels. With an eight-channel microfluidic device and
polystyrene particles as a gametocyte model, we successfully demonstrated the single-end
multiplexed resistive pulse sensing with excellent scalability. Besides, the availability of multiple
sensing pores provides a robust mechanism to overcome the clogging issue, allowing the analysis
to continue even when some of the pores are clogged. We envision this microfluidic TDMA
approach could facilitate the future development of multiplexed deformability sensor and high-
throughput DACS.

81
6.1. Introduction to microfluidic TDMA deformability sensing
High-throughput cell deformability sensing and deformability-activated sorting is essential for
analysis of rare gametocyte in the bloodstream. In this regard, multichannel deformability sensing
system have a clear advantage in terms of faster data collection and analysis throughput. The
integration of multiple channels into the same device also enables the analysis of the same sample
with different experimental parameters such as pore size. Besides, multiple pores also help to keep
the analysis running even one or few of the pores are clogged, a grand challenge in pore-based
resistive pulse sensors[153, 154]. In recognition of these benefits, efforts to simultaneously record
multiple channels will address the rate-limiting factor of deformability-activated cell sorting (i.e.,
deformability sensing, see section 5.8) and enable high-throughput and reliable sorting for
gametocyte enrichment. However, the scalability of the channel numbers is limited by the cost
because each fluidic channel would require an independent measuring unit. An ideal multiplexed
resistive pulse sensor should have a single output to interface with the single-input instrument
easily. To this end, one method employs the frequency division multiplexing for multichannel,
single-output resistive pulse sensing. Signals from multiple channels are modulated by an AC
signal with a single frequency and then recovered by digital bandpass filtering[155]. Another
method emulates the radio communication technique of code-division multiple access (CDMA) to
achieve an all-electronic, single-output interface[156]. As particles traverse encoding electrodes,
orthogonal digital codes are generated. Software algorithms were used to decode the output signal
to correlate each resistive pulse with its channel of origin.
Herein, we reported a microfluidic time-division multiplexing accessing (TDMA) single-end
resistive pulse sensor, which can be used for multiplexed gametocyte deformability sensing. In the
cellular communication field, TDMA allows multiple users to communicate with a base station
over a common channel through time-sharing[157]. The microfluidic TDMA resistive pulse sensor

82
adopts a similar principle to multiplex the signal from many different fluidic channels. With a
single-ended data acquisition, signals from each channel can be reconstructed for particle analysis
in the corresponding channels. We successfully demonstrated a low-cost eight-channel resistive
pulse sensor for detecting polystyrene particles as a model gametocyte. Further scaling up the
multiplexity is straightforward and within reach. We also found that the multiplexed TDMA device
is able to continue the analysis even when a few channels are clogged, solving one of the most
significant challenges in pore-based resistive pulse sensor. We anticipate this single-ended time-
shared approach would facilitate the future development of multiplexed deformability sensor and
high-throughput deformability-activated cell sorting.
6.2. TDMA working principle
Figure 6-1a shows the block diagram of the microfluidic TDMA system designed to interface the
N-channel microfluidic resistive pulse sensor. The integrated TDMA system consists of the trans-
impedance amplifiers, an analog multiplexer, analog-to-digital converter (A/D), and demultiplexer.
The multiplexer sequentially reads the amplified analog signals from each sensing channel with a
switching frequency of fs. In other words, each channel is sampled every N/fs second (i.e., the period
of a single TDMA frame, the top panel in Figure 6-1b) and digitalized by an A/D for data
acquisition. A demultiplexing algorithm reconstructs the signal for each channel using the scheme
shown in Figure 6-1b. It is noteworthy that there is a tradeoff between the channel multiplexity N
and the effective channel sampling frequency using a fixed switching frequency.

83
6.3. Scalability of TDMA
In our proof-of-principle study, we implemented an eight-channel microfluidic device with a
circular layout (Figure 6-1c). All eight channels have separated outlets, yet share a common inlet
(Figure 6-1c). A micro-filter structure is designed near the common inlet to remove the potential
debris. In a typical experiment, the polystyrene particle translocation time was in the range of 8±2.7
ms (Figure 6-2). To resolve the single particle translocation event, each channel should have a
minimum sampling frequency higher than the Nyquist frequency (250 Hz). We used a switching
Figure 6-1: TDMA resistive pulse sensor working principles. (a) Time-division multiple access block diagrams. (b) Illustration of the demultiplexing algorithm. The serial signal from the multiplexer output was reconstructed for each channel. (c) Microscope images of the 8-plexed device. The enlarged image illustrates the particle translocation through the sensing pore. A micro-filter is placed upstream to reduce the potential debris.

84
frequency fs of 200 kHz for the eight-channel implementation. The equivalent single-channel
sampling frequency is 25 kHz, sufficient for resolving the single particle translocation. In fact, the
channel multiplexity can be scaled up to 800 if we work at the minimal Nyquist frequency. Note
that this TDMA principle could also be extended to microfluidic deformability sensors, in which
single-molecule translocation is usually much faster. For a typical dwell time as short as ~100 µs
(Figure 4-2 in Chapter 4), the same 200 kHz switching frequency is sufficient to resolve ten
channels.
6.4. TDMA integration
6.4.1. Microfluidic device fabrication
An eight-channel microfluidic device was designed using CAD software (Figure 6-3). The
photomask was printed on transparent film (CAD/Art Services, Inc.). The casting mold was
fabricated on a 4-inch silicon wafer using SU-8 2025 (MicroChem) through a standard lithography
Figure 6-2: Time trace for the 10 µm beads. (a) Representative ionic current dips (b) Enlarged the view of the current dip (red box from Figure 6-2a). The pulse has a transit time of ~8 ms and a current dip of 22 nA. (c) Histogram of transit time for 10 µm beads. The distribution shows a mean transit time of 8 ± 2.7 ms (N = 227).

85
process. The mold height of ~35 µm was confirmed with a profilometer. The width and length of
the micropore were optimized to ~18 µm and ~20 µm respectively. The microfluidic device was
fabricated using polydimethylsiloxane (PDMS) (Dow Corning). A 10:1 w/w mixture of base and
curing agent was cast onto the SU-8 wafer mold, degassed, and cured at 80°C for an hour. After
demolding the patterned PDMS, inlet and outlets were punched using a stainless needle (ϕ = 0.75
mm). The resulting PDMS stamps and glass slides (100 µm thickness, ted-Pella) were treated with
oxygen plasma and in contact to form irreversibly covalent bonding between two materials.
Figure 6-3: 8-channel microfluidic device layout. The enlarged view showed the resistive pulse sensing unit, which has micropore with width, length, and height of 18 µm, 20 µm, and 35 µm, respectively. The customized tygon tubes with Ag/AgCl electrodes embedded were inserted into

86
6.4.2. TDMA hardware
The TDMA hardware circuit was implemented on a custom printed circuit board (PCB) (OSH
Park), which includes trans-impedance amplifiers (TL072, Texas Instruments), analog multiplexer
(ADG406, Analog Devices), and counter (dual negative-edge-triggered JK flip-flop: 74LS73,
Texas Instruments; 2-input AND gate: DM7408, Fairchild SemiconductorTM) (Figure 6-4). Eight
sensing units from the microfluidic device were connected to trans-impedance amplifiers. A
feedback resistor (R= 1 MΩ with 5% tolerance) was used to set the gain. The amplifier outputs
were connected as inputs to the multiplexer. The multiplexer channels were periodically selected
by a log2(N) bit synchronous counter. The sampling frequency for each TDMA frame was
synchronized to the multiplexer switching frequency. The analog voltage output from multiplexer
was sampled at 200 kHz with 16-bit DAQ card (NI PCIe-6351, National Instruments) and stored
through a data acquisition software (LabVIEW, National Instruments). The recorded data were
demultiplexed using MATLAB (MathWorks) program. All electronic components and
microfluidic device were placed in customized Faraday cage to shield the environment noise.
common inlet and outlets on the microfluidic devices. The outlets were grounded, while the inlet was biased at a constant voltage (400 mV).

87
Figure 6-4: TDMA hardware design. (a) Electronic schematic diagram. The system includes trans-impedance amplifier circuits, multiplexers, and counter circuits. DAQ provides the bias voltage for ionic current measurement and a clock signal for the 3-bit counter. External DC power source was used to provide the supply voltage for op-amps, multiplexer, JK flip-flop, and AND gate. (b) PCB layout. The PCB has dimensions of 95×62 mm and is shielded by the Faraday cage to reduce the environmental noise.
(b)
(a)

88
6.5. Validation of the microfluidic TDMA principle
6.5.1. Validation of 8-channel resistive pulse sensing
To validate the 8-channel microfluidic resistive pulse sensor and the TDMA scheme, we tested
polystyrene particles (coefficient variance <10%, Polyscience) of 10 µm diameter at a
concentration of ~2.4×10⁵ particles/ml. The polystyrene particles were mixed with 1x PBS buffer
(1X, pH 7.4) with 0.05% Tween-20 (TEKnova) to avoid particle aggregation. Prior to sample
loading, the microfluidic channels were prefilled with electrolyte (1x PBS with 0.05% Tween-20)
for electrical measurement. The prepared sample was introduced into the inlet of the microfluidic
device with a flow rate of 200 µl/hr using a syringe pump (Harvard Apparatus PHD 2000). The
signal from each of the eight channels was sequentially switched at 200 kHz into one single output
by the TDMA hardware. The digitalized combined signal was then demultiplexed to reconstruct
the time trace signal for each channel. Figure 6-5a shows the demultiplexed current time traces for
all eight channels. Apparent ionic current dips, corresponding to individual particle translocation
events, could be easily observed from all channels. These current dips were uniform in magnitude
due to the introduced monodisperse particles.
One of the concerns in TDMA resistive pulse sensing is the interference due to the signal leakage
in analog switching networks. The current dips in Figure 6-5a appear in random sequence, implying
that each channel can independently analyze the particles without crosstalk among channels. To
quantify the channel-to-channel crosstalk, we performed the cross-correlation analysis of ionic
current profiles among eight sensing channels and extracted the Pearson correlation coefficient.
Figure 6-5b shows the heatmap of the correlation between channels. The inter-channel correlation
is quite small (with coefficient ranging from -0.25 to 0.32), confirming the signal integrity in each
channel. Interestingly, the correlation seems alternating between the positive and negative value

89
for channels separated by odd and even numbers, which is likely due to the characteristics of the
switching networks.
6.5.2. Analyzing particle size and concentration
To further validate the multiplexed sensing, we analyzed the particle size and concentration from
obtained resistive pulses during particle translocation events. As a particle sizing model, Gregg and
Steidley’s expression was suitable for the case when sphere diameter is approaching to the orifice
diameter. The expression was derived from the following relation,
𝑅𝑅 = ρ𝑑𝑑𝑑𝑑𝐴𝐴(𝑑𝑑)
(1)
where R is the resistance of the tube, and A(z) is the cross-sectional area of the tube where the area
does not contain the sphere. The tube is centered on the z-axis; thus, particles flow toward the z-
Figure 6-5: Validation of TDMA resistive pulse sensor. (a) Reconstructed current time trace for each of the eight channels. (b) Cross-correlation among different sensing channels.

90
direction. The current density across the orifice cross-section is assumed to be uniform. To
incorporate the varying A(z), 𝐴𝐴(𝑑𝑑) = π𝐷𝐷𝑜𝑜2/4 for empty orifice and 𝐴𝐴(𝑑𝑑) = π4𝐷𝐷𝑜𝑜2 − 𝑑𝑑𝑠𝑠
2 + 4𝑑𝑑2
for the sphere containing orifice were substituted into the (Do: diameter of orifice, ds: diameter of
the sphere). Since the model was derived from Eq. (1), a uniform current density is desired across
the cross-section of the orifice for optimal estimation (e.g., particle size comparable to the orifice
diameter). Based on this rationale, we chose Gregg and Steidleye’s model since our polystyrene
bead diameter is similar to the sensing pore diameter.
The relative resistance changes (ΔR/R) caused by particle translocation at a sensing pore is
described by the following particle sizing equation [158],
∆𝑅𝑅𝑅𝑅
=𝐷𝐷𝑊𝑊
arcsin(𝑑𝑑/𝐷𝐷)
1 − (𝑑𝑑/𝐷𝐷)2− 𝑑𝑑𝐷𝐷
(2)
where d is particle diameter, D and L are cylindrical orifice diameter and length, respectively. For
the rectangular micropore, we substitute D = (4×W×H/π)1/2, where W and H are a sensing pore
width and a height, respectively. ΔR/R was extracted from the data using MATLAB (MathWorks),
and particle diameters were obtained by Eq. (2). Note this particle sizing model does not take into
consideration the correction factor [158] and thus can lead to uncertainty in size determination.
To calculate the particle concentration, total particle counts from the eight sensing units were
divided by the total introduced sample volume. The total particle counts were extracted by counting
the resistive pulses using the peak-detection algorithm in MATLAB (Figure 6-6). The total
introduced sample volume was obtained from the multiplying volume flow rate by the elapsed time.

91
To test the multiplexed TDMA resistive pulse sensor for particle sizing, we extracted the relative
resistance changes (ΔR/R) from the detected resistive peaks in Figure 6-5a. To determine the
particle size, we applied the particle sizing model using Eq. (2). Figure 6-7a shows the particle
diameter distribution in each channel, together with a combined distribution from all channels. The
combined distribution follows a Gaussian distribution with a mean value of ~9.5±0.54 µm. The
calculated particle diameter is comparable, yet smaller than the actual particle size (10 µm). The
under-estimation of the particle diameter may come from the fact that the particle sizing model
assumes particles pass through the centerline of the pore [159]. Motion displacement from the
center axis could cause the underestimation. It was also observed that the mean particle diameter
Figure 6-6: Validation of custom-built peak detection algorithm. The algorithm continuously finds the local minimum value and signal baseline. The current dip was calculated by subtracting the local minimum value from the signal baseline. Minimum peak values for individual resistive pulses were marked by blue circles.

92
varies among eight individual channels (Figure 6-7a). This is likely due to the channel-to-channel
size variation during the device fabrication and during the experiments (e.g., adsorption of small
debris near the pore region). Strategies to improve each of these issues could help to narrow the
size distribution.
Since each current dip event represents a single particle and the particle arriving events follow the
Poisson process (Figure 6-8), the particle concentration at 95% confidence interval was calculated
as (n ± 1.96(n) ½)/(vT), where n is the total number of particles counted from all 8 channels, T is the
total elapsed time, and v is the volume flow rate. The relative uncertainty of inferring the
concentration is proportional to n-1/2. Figure 6-7b shows the calculated concentration as a function
of total counted particles. After counting about 1000 particles, the calculated concentration
converges to that of the input sample (2.4×10⁵ particles/ml) with little uncertainty. The standard
deviation is mainly because particle arriving dynamics to the individual microconstrictions follows
the non-homogenous Poisson process (see Section 6.6 for details). To minimize the deviation,
symmetric flow streamlines from an inlet to multiple outlets through all constictions are required.
Figure 6-7: Particle size and concentration measurement. (a) Histograms of the calculated particle diameters from each individual sensing channel (NCh1:131, NCh2: 309, NCh3:104, NCh4: 97, NCh5:124, NCh6: 94, NCh7:102, NCh8: 223). Distribution of the entire particle diameter data set was plotted with

93
6.6. Probing the particle arriving dynamics
A quick eyeball on the current time traces in Figure 6-5a reveals that the particle translocation
frequency varies among different channels. To probe the particle arriving dynamics, we examined
the event inter-arrival time distribution for each channel. As shown in Figure 6-8a, the inter-arrival
time distribution shows a remarkable exponential distribution for each channel, indicating a Poisson
process [160]. Each channel was fitted with an exponential distribution, 𝑃𝑃(𝜕𝜕) = 𝜆𝜆𝑒𝑒−𝜆𝜆𝜆𝜆, where λ is
the expected particle translocation rate. As shown in Figure 6-8a, the particle arriving rates among
different channels ranges from 0.79 s-1 to 3.12 s-1, implying the introduced particles prefer certain
channels. This is likely because the effective dimension for each sensing pore is not perfectly
identical due to variations in the fabrication and the potential adsorption during the experiment.
This creates asymmetric streamlines that lead the particles into preferred channels.
Gaussian-fit (NAll: 1184). (b) Calculated concentration as a function of the counted particles. The error bars correspond to the Poisson noise. The actual polystyrene particle concentration (~2.4×10⁵ particles/ml) is indicated by the red dashed line.

94
To further examine whether the observed Poisson process is homogenous or nonhomogeneous, we
plotted the accumulative particle number versus the elapsed time. As shown in Figure 6-8b, the
slope of the curve (i.e., the translocation rate) is different among channels, consistent with what we
observed from Figure 6-8a. However, the slope of the curve for each channel shows a clear time-
dependence. This indicates the translocation rate for sub-processes indeed varies. Therefore, the
particle translocation process of our experiment is a nonhomogeneous Poisson process.
6.7. Analyzing a mixed population
To test the microfluidic multiplexed TDMA resistive pulse sensor for analyzing a mixed
population, we prepared a mixed sample containing 10 μm and 15 μm polystyrene particles
(coefficient variance <10%, Polyscience) with concentrations of ~2.4×10⁵ ml-1 and ~0.8×10⁵ ml-1,
respectively. Figure 6-9a shows the demultiplexed current time traces for all eight channels, and
Figure 6-9b shows an enlarged section from channel 4 (red boxed area). As expected, we observed
two distinct levels of current dips corresponding to the two size populations. Other channels also
show similar two population characteristics. Using the particle sizing model Eq. (2) and combing
events from all channels, the particle sizes were calculated, and their distribution is shown in Figure
6-9c. The particle size distribution shows evident two populations with a mean value of 9.31 ± 0.40
μm (10 μm particle population) and 12.46 ± 0.48 μm (15 μm particle population), respectively. The
underestimation for each population is likely due to the same reason, as we saw in Figure 6-7a. The
particle numbers counted for each population is 1233 and 355, the ratio of which (~3.47) is close
Figure 6-8: Particle translocation dynamics. (a) The normalized distribution of bead interarrival time in different channels, with exponential fits to the distributions (λch1: 3.12 s-1, λch2: 0.98 s-1, λch3: 0.79 s-1, λch4: 0.83 s-1, λch5 1.21 s-1, λch6: 0.88 s-1, λch7: 1.88 s-1, and λch8: 1.13 s-1). (b) Cumulative counted particle numbers versus the elapsed time.

95
to that of the input concentration value (~3), confirming the discriminative ability between these
two populations.
6.8. Robustness against pore-clogging
While we did not see any clogging issue when testing the 10 μm sized particles (Figure 6-5a), a
clear feature observed in Figure 6-9a when testing the 15 μm sized particles is that two out of eight
channels (channel 6 and 7) show no particle translocation events. We examined the sensing pores
using a microscope after the experiment. It was found that channel 6 and 7 were indeed clogged by
particle jamming at the pore (Figure 6-9d). This is not surprising since the pore cross-section is of
dimension 18 µm×20 µm×35 µm (W×L×H). When 15 μm sized particles were introduced, the
chance for clogging becomes much higher. Such irreversible clogging is a well-known issue for
Figure 6-9: Discriminating particles of different sizes. (a) Reconstructed current time trace for each of the eight channels. (b) Enlarged view of ionic current in channel 4 (red) showing representative pulses from a mixture of 10 µm and 15 µm diameter particles. (c) Distribution of the particle size, with Gaussian-fit. A clear two population was observed. (N10µm: 1233 and N15µm: 355). (d) Microscope images showing the pore-clogging in channels 6 and 7 (Scale bar: 20 µm).

96
single-channel resistive pulse sensors that limits its flexibility in real-world applications[153, 154].
In contrast, the TDMA multichannel resistive pulse sensor allows the analysis to continue even
when some of the pores are clogged (Figure 6-9c).
6.9. Summary
By introducing the time-division multiple access technique in the telecommunication field into the
microfluidic field, we developed and demonstrated the multiplexed microfluidic resistive pulse
sensor, which can be adapted for multiplexed gametocyte deformability sensing. The microfluidic
TDMA resistive pulse sensing technology allows each channel to transmit its temporal signal in
rapid succession to a single electrical outlet, using a defined time slot with a defined order, which
can then be used to recover the signal from each channel by a simple demultiplexing algorithm.
With the prototyped TDMA instrumentation and the eight-channel microfluidic device, we
validated the multiplexed microfluidic TDMA principle. Besides, the availability of multiple
sensing pores provides a robust mechanism to fight against the clogging issue, allowing the analysis
to continue, which is otherwise not possible in single-channel devices. While the TDMA resistive
pulse sensing technology is validated in microfluidic devices in this study, we expect this proof-of-
concept could be well extended to future development of high-throughput deformability-activated
cell sorting.

Chapter 7 Conclusion and Perspectives
7.1. Conclusions
This dissertation presents novel microfluidic methods to achieve molecular and cellular detection
of malaria for elimination. The demand for screening of asymptomatic infections and surveillance
of transmission has been steadily increased. Besides, the effort of understanding the underlying
mechanism of malaria pathophysiology is greatly helpful for researches in drug development. To
this end, advanced translational technologies such as microfluidic lab-on-a-chip are of high
importance to bring practical malaria elimination strategy to the field. Despite the extensive
technological efforts, following two aspects have not been fully resolved yet:
(1) There is an unmet need for existing diagnostic devices that fulfill Affordable, Sensitive,
Specific, User-friendly, Rapid and robust, Equipment-free, and Deliverable to end-users
(ASSURED) criteria.
(2) There is a lack of tools to investigate the degree of illness and to understand the underlying
mechanism of malaria transmission.
The thesis suggests novel technological solutions to tackle such demands with the following
approaches: (1) lab-on-a-disc nucleic acid testing and (2) cell-based detection using microfluidic
cell mechanotyping.
In the effort to deliver a highly sensitive diagnostic system in the field, we developed a "sample-
to-answer" nucleic acid testing platform. The unprecedently integrated system facilitates
streamlined parasite DNA extraction, purification, and real-time detection on a single reagent

98
compact disc. For the automated sample process, energy-efficient magnetic interaction was
implemented to move the nucleic acid bearing magnetic beads to the desired liquid chambers in the
reagent disc without fluid motion. We demonstrated that the device could deliver molecular
answers from a small volume of the raw blood sample with a detection limit of ~0.5 parasites/µl in
40 minutes. This level of sensitivity is sufficient for identifying asymptomatic parasite carriers in
the field.
The technological effort to improve the scalability and throughput of the field-deployable nucleic
acid testing is accomplished by the development of a multiplexed nucleic acid testing platform.
The system performs the entire DNA sample preparation for four samples and subsequent LAMP-
based nucleic acid tests in parallel with minimal user intervention. We demonstrated the system's
ability to identify two malaria species (P. falciparum and P. vivax), which are the majority of fatal
infections in malaria elimination-phase countries. This technological advancement enables high-
throughput, sensitive, and species-specific malaria detection for mass screening and surveillance
of transmission as well as epidemiological studies to understand species prevalence and co-
infection patterns.
As an effort to investigate the life cycle and malaria pathophysiology, novel microfluidic cell
mechanotyping was suggested. We explored the label-free mechanical biomarker (i.e., cell
deformability) using a cell deformability sensor. It was found that cell deformability is an excellent
indicator to determine the red blood cell states in parasite-invasion. Using this mechanical
biomarker, we demonstrated the ability of parasitemia quantification and parasite stage
differentiation in the asexual cycle. The microfluidic platform offers numerous benefits, such as
rapid data collection (~500 cell/sec), label-free, and secure sample handling in a cell-friendly liquid
environment. These benefits allow a wide range of engineering applications (e.g., multiplexed cell
detection and hydrodynamic cell sorting) that can be used for cell mechanotyping research.

99
Upon the development of a cell deformability sensor, a further effort was made to collect cells of
interest based on their mechanical properties. The seamless integration of transit-time-based
deformability sensor and hydrodynamic sorting onto a single microfluidic chip enables the single-
cell-resolved real-time deformability-activated sorting in a continuous flow. The active sorting
allows the comparison experiment that requires a sorting condition to be varied within the same
device. Besides, the individual cell's quantitative deformability information is accessible. We
analyzed the factors affecting the sorting dynamics (i.e., sample flow rate, sorting flow pressure,
and system relaxation time) with modeling and experimentally evaluated the sorting performance
(i.e., throughput, purity, and efficiency). We found that the device throughput is determined by the
summation of sensing, buffering, and sorting time. This DACS system has potential usage in
detecting and enriching a rare population of mature gametocytes in the bloodstream.
Regarding the constriction-based cell deformability sensor, we realized the need for developing a
multichannel system that enables both fast data collection and high throughput analysis. However,
the scalability of the channel numbers is limited by the cost because each fluidic channel would
require an independent measuring unit. In the effort to rectify this limitation, the time-division
multiple access (TDMA) technique in the telecommunication field was combined with the
microfluidics resistive pulse sensing. Through time-sharing, TDMA allows multiple sensing units
to monitor cell translocation event with a single-ended data acquisition. This scalable technique
would serve as a building block for large-scale integration of future multiplexed deformability
sensor and high-throughput deformability-activated cell sorting.
In summary, the significant contributions of this thesis are as follows:
(1) We provided an unprecedently integrated sample-to-answer mobile nucleic acid testing device
for highly sensitive detection of asymptomatic carriers in the resource-limited area.

100
(2) We improved throughput and scalability of the mobile nucleic acid testing device that can
perform four species-specific nucleic acid tests in parallel on a single test disc.
(3) We experimentally realized that cell deformability is a promising label-free biomarker for rapid
parasitemia measurement and parasite stage determination.
(4) We demonstrated a first-of-its-kind, single-cell-resolved, cytometry-like deformability-
activated cell sorting in continuous flow on a single microfluidic chip.
(5) We provided a novel microfluidic TDMA resistive pulse sensing technique for scalable and
high-throughput cell mechanotyping.
7.2. Future perspectives
Several important aspects should be addressed in the future research.
In response to the lack of highly sensitive field-deployable point-of-care diagnostics, we
successfully developed a sample-to-answer nucleic acid testing device. The system offers the
benefits of a rapid diagnostic test (RDT) (i.e., fast, low-cost, minimal training, and minimal sample
handling) and lab-based nucleic acid testing (NAT) (i.e., high sensitivity and specificity).
Therefore, the system is particularly useful for screening potential carriers who may be highly
contagious and seek private self-testing at home before visiting public hospitals. The integrated
isothermal amplification assay and automation of magnetic bead-based sample handling by
programmable magnetic interaction on a microfluidic chip can be easily extended for many other
infectious virus such as HIV, Zika, and COVID-19.

101
Second, we have evaluated the technical performance of the device with a mimicked malaria-
infected sample (e.g., malaria cultured red blood cells mixed with whole blood and parasite DNA
spiked whole blood sample). However, the measure of diagnostic accuracy has not been carefully
studied yet. This often involves the assessment of diagnostic performance (e.g., receiver-operating
characteristics, detection threshold, and diagnostic sensitivity and specificity), which is conducted
by the comparison of the diagnostic results from the proposed device and a reference standard
technique such as PCR using clinical samples. The proof-of-concept ultracompact and self-
sustainable nucleic acid testing device is ready to be deployed in the field for evaluating diagnostic
performance.
On the microfluidic cell mechanotyping, there exists exciting technological advancements and real-
world applications that have not been explored.
First, all constriction-based cell deformability characterization is only valid under the assumption
of identical cell size. However, the non-uniformity of the cell size distribution is typical for
biological samples, limiting the reliable and comparable deformability measurements. To decouple
the size factor from cell deformability measurement, we can consider independent cell size and
deformability measurement using two-stage micro-constrictions as two measurement units [161].
Second, physical measures of cell mechanotyping such as cell compressibility, elastic modulus,
stiffness, and deformability are new to clinicians and biologists, who are more familiar with FACS-
based molecular assays. Combining capabilities for measuring deformability and fluorescence will
provide multi-dimensional information, addressing the specificity issues, and accelerate the
adoption of deformability sensor [124]. Such a hybrid setup will be useful where correlational
studies between molecular properties and mechanics of specific target cells are required, such as
drug screening.

102
Third, it is essential to improve the throughput of the deformability-activated cell sorting system
for rapid cell enrichment. It was found that the minimum resolvable cell spacing determines the
sorting throughput. Various hydrodynamic spacing and ordering techniques (e.g., single-cell
dispensing [162] and inertial microfluidics [163, 164]) can enhance the sorting throughput.
Multiplexed deformability-activated cell sorting system using TDMA resistive pulse sensing
method can also be considered as scalable approaches.
Fourth, the thesis successfully demonstrated the deformability-activated cell sorting with
synthesized hydrogel beads as deformable model cells. It would be a more promising technology
if the device can sort the actual biological cells, such as gametocyte. Deformability-based sorting
validation using gametocyte would be particularly useful for testing the efficacy of a transmission-
blocking drug [132].
Overall, microfluidic lab-on-a-chip diagnostic technology has a bright future. A combination of
multidisciplinary knowledge such as electronics, microfluidics, optics, and biochemistry maximize
the benefits for ideal biomedical sensing systems in terms of sensitivity, specificity, accessibility,
turnaround time, and cost. Microfluidic molecular and cellular detection strategies presented in this
dissertation guide advanced translational technologies that are clinically useful for malaria
diagnosis and treatment in the elimination-phase setting.

Bibliography
[1] M. Islam, R. Mezencev, B. McFarland, H. Brink, B. Campbell, B. Tasadduq, E. K. Waller, W. Lam, A. Alexeev, and T. Sulchek, "Microfluidic cell sorting by stiffness to examine heterogenic responses of cancer cells to chemotherapy," Cell Death Dis, vol. 9, no. 2, p. 239, Feb 14 2018
[2] N. K. Gill, C. Ly, K. D. Nyberg, L. Lee, D. Qi, B. Tofig, M. Reis-Sobreiro, O. Dorigo, J. Rao, R. Wiedemeyer, B. Karlan, K. Lawrenson, M. R. Freeman, R. Damoiseaux, and A. C. Rowat, "A scalable filtration method for high throughput screening based on cell deformability," Lab Chip, vol. 19, no. 2, pp. 343-357, Jan 15 2019
[3] Y. N. Cheng, X. Y. Ye, Z. S. Ma, S. Xie, and W. H. Wang, "High-throughput and clogging-free microfluidic filtration platform for on-chip cell separation from undiluted whole blood," Biomicrofluidics, vol. 10, no. 1, Jan 2016
[4] M. Islam, H. Brink, S. Blanche, C. DiPrete, T. Bongiorno, N. Stone, A. Liu, A. Philip, G. H. Wang, W. Lam, A. Alexeev, E. K. Waller, and T. Sulchek, "Microfluidic Sorting of Cells by Viability Based on Differences in Cell Stiffness," Scientific reports, vol. 7, May 17 2017
[5] G. H. Wang, W. B. Mao, R. Byler, K. Patel, C. Henegar, A. Alexeev, and T. Sulchek, "Stiffness Dependent Separation of Cells in a Microfluidic Device," Plos One, vol. 8, no. 10, Oct 16 2013
[6] D. Holmes, G. Whyte, J. Bailey, N. Vergara-Irigaray, A. Ekpenyong, J. Guck, and T. Duke, "Separation of blood cells with differing deformability using deterministic lateral displacement," Interface Focus, vol. 4, no. 6, Dec 6 2014
[7] S. C. Hur, N. K. Henderson-MacLennan, E. R. B. McCabe, and D. Di Carlo, "Deformability-based cell classification and enrichment using inertial microfluidics," Lab Chip, vol. 11, no. 5, pp. 912-920, 2011
[8] W. Lee, P. Tseng, and D. D. Carlo, Microtechnology for cell manipulation and sorting. New York, NY: Springer Berlin Heidelberg, 2017, p. 14.
[9] Y. H. Chang, C. J. Huang, and G. B. Lee, "A tunable microfluidic-based filter modulated by pneumatic pressure for separation of blood cells," Microfluid Nanofluid, vol. 12, no. 1-4, pp. 85-94, Jan 2012
[10] S. B. Huang, M. H. Wu, and G. B. Lee, "A tunable micro filter modulated by pneumatic pressure for cell separation," Sensors and Actuators B-Chemical, vol. 142, no. 1, pp. 389-399, Oct 12 2009
[11] W. Beattie, X. Qin, L. Wang, and H. S. Ma, "Clog-free cell filtration using resettable cell traps," Lab Chip, vol. 14, no. 15, pp. 2657-2665, Aug 7 2014
[12] X. Qin, S. Park, S. P. Duffy, K. Matthews, R. R. Ang, T. Todenhofer, H. Abdi, A. Azad, J. Bazov, K. N. Chi, P. C. Black, and H. S. Ma, "Size and deformability based separation of circulating tumor cells from castrate resistant prostate cancer patients using resettable cell traps," Lab Chip, vol. 15, no. 10, pp. 2278-2286, 2015
[13] Q. Guo, S. P. Duffy, K. Matthews, E. Islamzada, and H. S. Ma, "Deformability based Cell Sorting using Microfluidic Ratchets Enabling Phenotypic Separation of Leukocytes Directly from Whole Blood," Scientific reports, vol. 7, Jul 26 2017

104
[14] Q. Guo, S. P. Duffy, K. Matthews, X. Y. Deng, A. T. Santoso, E. Islamzada, and H. S. Ma, "Deformability based sorting of red blood cells improves diagnostic sensitivity for malaria caused by Plasmodium falciparum," Lab Chip, vol. 16, no. 4, pp. 645-654, 2016
[15] E. S. Park, C. Jin, Q. Guo, R. R. Ang, S. P. Duffy, K. Matthews, A. Azad, H. Abdi, T. Todenhofer, J. Bazov, K. N. Chi, P. C. Black, and H. S. Ma, "Continuous Flow Deformability-Based Separation of Circulating Tumor Cells Using Microfluidic Ratchets," Small, vol. 12, no. 14, pp. 1909-1919, Apr 13 2016
[16] E. Islamzada, K. Matthews, Q. Guo, A. T. Santoso, S. P. Duffy, M. D. Scott, and H. Ma, "Deformability based sorting of stored red blood cells reveals donor-dependent aging curves," Lab Chip, vol. 20, no. 2, pp. 226-235, Jan 21 2020
[17] C. Faigle, F. Lautenschlager, G. Whyte, P. Homewood, E. Martin-Badosa, and J. Guck, "A monolithic glass chip for active single-cell sorting based on mechanical phenotyping," Lab on a Chip, vol. 15, no. 5, pp. 1267-1275, 2015
[18] A. A. Nawaz, M. Urbanska, M. Herbig, M. Notzel, M. Krater, P. Rosendahl, C. Herold, N. Toepfner, M. Kubankova, R. Goswami, S. Abuhattum, F. Reichel, P. Muller, A. Taubenberger, S. Girardo, A. Jacobi, and J. Guck, "Intelligent image-based deformation-assisted cell sorting with molecular specificity," Nat Methods, vol. 17, no. 6, pp. 595-599, Jun 2020
[19] G. Choi, R. Nouri, L. Zarzar, and W. Guan, "Microfluidic deformability-activated sorting of single particles," Microsystems & Nanoengineering, vol. 6, no. 1, pp. 1-9, 2020
[20] WHO, "World Malaria Report 2016," World Malaria Report 2016, pp. 1-255, 2016 [21] N. Kolluri, C. M. Klapperich, and M. Cabodi, "Towards lab-on-a-chip diagnostics for
malaria elimination," Lab Chip, vol. 18, no. 1, pp. 75-94, Jan 7 2018 [22] M. Aingaran, R. Zhang, S. K. Law, Z. L. Peng, A. Undisz, E. Meyer, M. Diez-Silva, T. A.
Burke, T. Spielmann, C. T. Lim, S. Suresh, M. Dao, and M. Marti, "TY Host cell deformability is linked to transmission in the human malaria parasite Plasmodium falciparum," Cell Microbiol, vol. 14, no. 7, pp. 983-993, Jul 2012
[23] C. P. Nixon, "Plasmodium falciparum gametocyte transit through the cutaneous microvasculature: A new target for malaria transmission blocking vaccines?," Hum Vacc Immunother, vol. 12, no. 12, pp. 3189-3195, 2016
[24] H. C. Slater, A. Ross, A. L. Ouedraogo, L. J. White, C. Nguon, P. G. T. Walker, P. Ngor, R. Aguas, S. P. Silal, A. M. Dondorp, P. La Barre, R. Burton, R. W. Sauerwein, C. Drakeley, T. A. Smith, T. Bousema, and A. C. Ghani, "Assessing the impact of next-generation rapid diagnostic tests on Plasmodium falciparum malaria elimination strategies," Nature, vol. 528, no. 7580, pp. S94-S101, Dec 3 2015
[25] C. Wongsrichanalai, M. J. Barcus, S. Muth, A. Sutamihardja, and W. H. Wernsdorfer, "A review of malaria diagnostic tools: Microscopy and rapid diagnostic test (RDT)," American Journal of Tropical Medicine and Hygiene, vol. 77, no. 6, pp. 119-127, Dec 2007
[26] A. Moody, "Rapid diagnostic tests for malaria parasites," Clin Microbiol Rev, vol. 15, no. 1, pp. 66-78, Jan 2002
[27] S. S. Modak, C. A. Barber, E. Geva, W. R. Abrams, D. Malamud, and Y. S. Ongagna, "Rapid Point-of-Care Isothermal Amplification Assay for the Detection of Malaria without Nucleic Acid Purification," Infectious diseases, vol. 9, pp. 1-9, 2016
[28] H. Hopkins, I. J. Gonzalez, S. D. Polley, P. Angutoko, J. Ategeka, C. Asiimwe, B. Agaba, D. J. Kyabayinze, C. J. Sutherland, M. D. Perkins, and D. Bell, "Highly Sensitive Detection of Malaria Parasitemia in a Malaria-Endemic Setting: Performance of a New Loop-Mediated Isothermal Amplification Kit in a Remote Clinic in Uganda," J Infect Dis, vol. 208, no. 4, pp. 645-652, Aug 15 2013

105
[29] B. Aydin-Schmidt, W. P. Xu, I. J. Gonzalez, S. D. Polley, D. Bell, D. Shakely, M. I. Msellem, A. Bjorkman, and A. Martensson, "Loop Mediated Isothermal Amplification (LAMP) Accurately Detects Malaria DNA from Filter Paper Blood Samples of Low Density Parasitaemias," Plos One, vol. 9, no. 8, p. e103905, Aug 8 2014
[30] T. Leslie, A. Mikhail, I. Mayan, M. Anwar, S. Bakhtash, M. Nader, C. Chandler, C. J. M. Whitty, and M. Rowland, "Overdiagnosis and mistreatment of malaria among febrile patients at primary healthcare level in Afghanistan: observational study," Brit Med J, vol. 345, p. e4389., Jul 24 2012
[31] L. Wu, L. L. van den Hoogen, H. Slater, P. G. T. Walker, A. C. Ghani, C. J. Drakeley, and L. C. Okell, "Comparison of diagnostics for the detection of asymptomatic Plasmodium falciparum infections to inform control and elimination strategies," Nature, vol. 528, no. 7580, pp. S86-S93, Dec 3 2015
[32] C. W. Pirnstill and G. L. Cote, "Malaria Diagnosis Using a Mobile Phone Polarized Microscope," Sci Rep-Uk, vol. 5, p. 13368, Aug 25 2015
[33] G. Snounou, S. Viriyakosol, X. P. Zhu, W. Jarra, L. Pinheiro, V. E. Dorosario, S. Thaithong, and K. N. Brown, "High-Sensitivity of Detection of Human Malaria Parasites by the Use of Nested Polymerase Chain-Reaction," Mol Biochem Parasit, vol. 61, no. 2, pp. 315-320, Oct 1993
[34] E. T. Han, R. Watanabe, J. Sattabongkot, B. Khuntirat, J. Sirichaisinthop, H. Iriko, L. Jin, S. Takeo, and T. Tsuboi, "Detection of four Plasmodium species by genus- and species-specific loop-mediated isothermal amplification for clinical diagnosis," J Clin Microbiol, vol. 45, no. 8, pp. 2521-8, Aug 2007
[35] V. Reddy, V. Ravi, A. Desai, M. Parida, A. M. Powers, and B. W. Johnson, "Utility of IgM ELISA, TaqMan real-time PCR, reverse transcription PCR, and RT-LAMP assay for the diagnosis of Chikungunya fever," Journal of medical virology, vol. 84, no. 11, pp. 1771-8, Nov 2012
[36] U. Morris, M. Khamis, B. Aydin-Schmidt, A. K. Abass, M. I. Msellem, M. H. Nassor, I. J. Gonzalez, A. Martensson, A. S. Ali, A. Bjorkman, and J. Cook, "Field deployment of loop-mediated isothermal amplification for centralized mass-screening of asymptomatic malaria in Zanzibar: a pre-elimination setting," Malaria J, vol. 14, pp. 1-6, May 17 2015
[37] B. Greenwood and T. Mutabingwa, "Malaria in 2002," Nature, vol. 415, no. 6872, pp. 670-672, Feb 7 2002
[38] S. Kersting, V. Rausch, F. F. Bier, and M. von Nickisch-Rosenegk, "Rapid detection of Plasmodium falciparum with isothermal recombinase polymerase amplification and lateral flow analysis," Malaria J, vol. 13, p. 99, Mar 15 2014
[39] M. S. Cordray and R. R. Richards-Kortum, "A paper and plastic device for the combined isothermal amplification and lateral flow detection of Plasmodium DNA," Malaria J, vol. 14, p. 472, Nov 26 2015
[40] Y. Li, N. Kumar, A. Gopalakrishnan, C. Ginocchio, R. Manji, M. Bythrow, B. Lemieux, and H. M. Kong, "Detection and Species Identification of Malaria Parasites by Isothermal, tHDA Amplification Directly from Human Blood without Sample Preparation," J Mol Diagn, vol. 15, no. 5, pp. 634-641, Sep 2013
[41] E. T. Han, R. Watanabe, J. Sattabongkot, B. Khuntirat, J. Sirichaisinthop, H. Iriko, L. Jin, S. Takeo, and T. Tsuboi, "Detection of four Plasmodium species by genus- and species-specific loop-mediated isothermal amplification for clinical diagnosis," J Clin Microbiol, vol. 45, no. 8, pp. 2521-2528, Aug 2007
[42] S. D. Polley, Y. Mori, J. Watson, M. D. Perkins, I. J. Gonzalez, T. Notomi, P. L. Chiodini, and C. J. Sutherland, "Mitochondrial DNA Targets Increase Sensitivity of Malaria

106
Detection Using Loop-Mediated Isothermal Amplification," J Clin Microbiol, vol. 48, no. 8, pp. 2866-2871, Aug 2010
[43] M. Safavieh, M. K. Kanakasabapathy, F. Tarlan, M. U. Ahmed, M. Zourob, W. Asghar, and H. Shafiee, "Emerging Loop-Mediated Isothermal Amplification-Based Microchip and Microdevice Technologies for Nucleic Acid Detection," Acs Biomater-Sci Eng, vol. 2, no. 3, pp. 278-294, Mar 2016
[44] E. C. Oriero, J. P. van Geertruyden, D. C. Nwakanma, U. D'Alessandro, and J. Jacobs, "Novel techniques and future directions in molecular diagnosis of malaria in resource-limited settings," Expert Rev Mol Diagn, vol. 15, no. 11, pp. 1419-1426, Nov 2 2015
[45] R. Abdul-Ghani, "Towards rapid genotyping of resistant malaria parasites: could loop-mediated isothermal amplification be the solution?," Malar J, vol. 13, p. 237, 2014
[46] K. Goyal, H. Kaur, A. Sehgal, and R. Sehgal, "RealAmp Loop-Mediated Isothermal Amplification as a Point-of-Care Test for Diagnosis of Malaria: Neither Too Close nor Too Far," J Infect Dis, vol. 211, no. 10, p. 1686, May 15 2015
[47] U. Morris, M. Khamis, B. Aydin-Schmidt, A. K. Abass, M. I. Msellem, M. H. Nassor, I. J. Gonzalez, A. Martensson, A. S. Ali, A. Bjorkman, and J. Cook, "Field deployment of loop-mediated isothermal amplification for centralized mass-screening of asymptomatic malaria in Zanzibar: a pre-elimination setting," Malaria journal, vol. 14, p. 205, 2015
[48] M. S. Hsiang, B. Greenhouse, and P. J. Rosenthal, "Point of care testing for malaria using LAMP, loop mediated isothermal amplification," J Infect Dis, vol. 210, no. 8, pp. 1167-9, Oct 15 2014
[49] J. C. Patel, N. W. Lucchi, P. Srivastava, J. T. Lin, R. Sug-Aram, S. Aruncharus, P. K. Bharti, M. M. Shukla, K. Congpuong, W. Satimai, N. Singh, V. Udhayakumar, and S. R. Meshnick, "Field evaluation of a real-time fluorescence loop-mediated isothermal amplification assay, RealAmp, for the diagnosis of malaria in Thailand and India," J Infect Dis, vol. 210, no. 8, pp. 1180-7, Oct 15 2014
[50] E. T. Han, "Loop-mediated isothermal amplification test for the molecular diagnosis of malaria," Expert Rev Mol Diagn, vol. 13, no. 2, pp. 205-18, Mar 2013
[51] R. Singh, D. Savargaonkar, R. Bhatt, and N. Valecha, "Rapid detection of Plasmodium vivax in saliva and blood using loop mediated isothermal amplification (LAMP) assay," The Journal of infection, vol. 67, no. 3, pp. 245-7, Sep 2013
[52] R. Surabattula, M. P. Vejandla, P. C. Mallepaddi, K. Faulstich, and R. Polavarapu, "Simple, rapid, inexpensive platform for the diagnosis of malaria by loop mediated isothermal amplification (LAMP)," Experimental parasitology, vol. 134, no. 3, pp. 333-40, Jul 2013
[53] J. Sirichaisinthop, S. Buates, R. Watanabe, E. T. Han, W. Suktawonjaroenpon, S. Krasaesub, S. Takeo, T. Tsuboi, and J. Sattabongkot, "Evaluation of loop-mediated isothermal amplification (LAMP) for malaria diagnosis in a field setting," Am J Trop Med Hyg, vol. 85, no. 4, pp. 594-6, Oct 2011
[54] J. Sattabongkot, T. Tsuboi, E. T. Han, S. Bantuchai, and S. Buates, "Loop-mediated isothermal amplification assay for rapid diagnosis of malaria infections in an area of endemicity in Thailand," J Clin Microbiol, vol. 52, no. 5, pp. 1471-7, May 2014
[55] N. Tomita, Y. Mori, H. Kanda, and T. Notomi, "Loop-mediated isothermal amplification (LAMP) of gene sequences and simple visual detection of products," Nat Protoc, vol. 3, no. 5, pp. 877-882, 2008
[56] M. Goto, E. Honda, A. Ogura, A. Nomoto, and K. I. Hanaki, "Colorimetric detection of loop-mediated isothermal amplification reaction by using hydroxy naphthol blue," Biotechniques, vol. 46, no. 3, pp. 167-172, Mar 2009

107
[57] T. Notomi, Y. Mori, N. Tomita, and H. Kanda, "Loop-mediated isothermal amplification (LAMP): principle, features, and future prospects," J Microbiol, vol. 53, no. 1, pp. 1-5, Jan 2015
[58] S. Britton, Q. Cheng, and J. S. McCarthy, "Novel molecular diagnostic tools for malaria elimination: a review of options from the point of view of high-throughput and applicability in resource limited settings," Malaria J, vol. 15, p. 88, Feb 16 2016
[59] J. Kim, M. Johnson, P. Hill, and B. K. Gale, "Microfluidic sample preparation: cell lysis and nucleic acid purification," Integr Biol, vol. 1, no. 10, pp. 574-586, 2009
[60] F. B. Myers, R. H. Henrikson, J. Bone, and L. P. Lee, "A Handheld Point-of-Care Genomic Diagnostic System," Plos One, vol. 8, no. 8, p. e70266, Aug 1 2013
[61] S. C. Liao, J. Peng, M. G. Mauk, S. Awasthi, J. Z. Song, H. Friedman, H. H. Bau, and C. C. Liu, "Smart cup: A minimally-instrumented, smartphone-based point-of-care molecular diagnostic device," Sensor Actuat B-Chem, vol. 229, pp. 232-238, Jun 28 2016
[62] C. C. Liu, M. G. Mauk, R. Hart, M. Bonizzoni, G. Y. Yan, and H. H. Bau, "A Low-Cost Microfluidic Chip for Rapid Genotyping of Malaria-Transmitting Mosquitoes," Plos One, vol. 7, no. 8, p. e42222, Aug 3 2012
[63] S. Choi, "Powering point-of-care diagnostic devices," Biotechnol Adv, vol. 34, no. 3, pp. 321-330, May 2016
[64] G. Abel, "Current status and future prospects of point-of-care testing around the globe," Expert Rev Mol Diagn, vol. 15, no. 7, pp. 853-855, Jul 2015
[65] W. E. Jung, J. Han, J. W. Choi, and C. H. Ahn, "Point-of-care testing (POCT) diagnostic systems using microfluidic lab-on-a-chip technologies," Microelectron Eng, vol. 132, pp. 46-57, Jan 25 2015
[66] K. Yang, H. Peretz-Soroka, Y. Liu, and F. Lin, "Novel developments in mobile sensing based on the integration of microfluidic devices and smartphones," Lab Chip, vol. 16, no. 6, pp. 943-958, 2016
[67] J. Hu, X. Y. Cui, Y. Gong, X. Y. Xu, B. Gao, T. Wen, T. J. Lu, and F. Xu, "Portable microfluidic and smartphone-based devices for monitoring of cardiovascular diseases at the point of care," Biotechnol Adv, vol. 34, no. 3, pp. 305-320, May-Jun 2016
[68] S. D. Polley, Y. Mori, J. Watson, M. D. Perkins, I. J. Gonzalez, T. Notomi, P. L. Chiodini, and C. J. Sutherland, "Mitochondrial DNA targets increase sensitivity of malaria detection using loop-mediated isothermal amplification," J Clin Microbiol, vol. 48, no. 8, pp. 2866-71, Aug 2010
[69] G. Choi, D. Song, S. Shrestha, J. Miao, L. Cui, and W. Guan, "A field-deployable mobile molecular diagnostic system for malaria at the point of need," Lab Chip, vol. 16, no. 22, pp. 4341-4349, Nov 1 2016
[70] S. Britton, Q. Cheng, M. J. Grigg, C. B. Poole, C. Pasay, T. William, K. Fornace, N. M. Anstey, C. J. Sutherland, C. Drakeley, and J. S. McCarthy, "Sensitive Detection of Plasmodium vivax Using a High-Throughput, Colourimetric Loop Mediated Isothermal Amplification (HtLAMP) Platform: A Potential Novel Tool for Malaria Elimination," Plos Neglect Trop D, vol. 10, no. 2, p. e0004443, Feb 2016
[71] T. Notomi, H. Okayama, H. Masubuchi, T. Yonekawa, K. Watanabe, N. Amino, and T. Hase, "Loop-mediated isothermal amplification of DNA," Nucleic Acids Res, vol. 28, no. 12, p. E63, Jun 15 2000
[72] H. W. Chen and W. M. Ching, "Evaluation of the stability of lyophilized loop-mediated isothermal amplification reagents for the detection of Coxiella burnetii," Heliyon, vol. 3, no. 10, p. e00415, Oct 2017
[73] K. Y. Lien, C. J. Liu, Y. C. Lin, P. L. Kuo, and G. B. Lee, "Extraction of genomic DNA and detection of single nucleotide polymorphism genotyping utilizing an integrated

108
magnetic bead-based microfluidic platform," Microfluid Nanofluid, vol. 6, no. 4, pp. 539-555, Apr 2009
[74] T. Notomi, H. Okayama, H. Masubuchi, T. Yonekawa, K. Watanabe, N. Amino, and T. Hase, "Loop-mediated isothermal amplification of DNA," Nucleic Acids Res, vol. 28, no. 12, pp. e63-e63, Jun 15 2000
[75] A. M. Foudeh, T. F. Didar, T. Veres, and M. Tabrizian, "Microfluidic designs and techniques using lab-on-a-chip devices for pathogen detection for point-of-care diagnostics," Lab Chip, vol. 12, no. 18, pp. 3249-3266, 2012
[76] M. A. Lee, C. H. Tan, L. T. Aw, C. S. Tang, M. Singh, S. H. Lee, H. P. Chia, and E. P. H. Yap, "Real-time fluorescence-based PCR for detection of malaria parasites," J Clin Microbiol, vol. 40, no. 11, pp. 4343-4345, Nov 2002
[77] G. L. Long and J. D. Winefordner, "Limit of detection. A closer look at the IUPAC definition," Anal. Chem., vol. 55, no. 7, pp. 712A–724A, 1983
[78] WHO, "World Malaria Report 2017," pp. 1-196, 2017 [79] N. Kolluri, C. M. Klapperich, and M. Cabodi, "Towards lab-on-a-chip diagnostics for
malaria elimination," Lab on a chip, vol. 18, pp. 75-94, Nov 10 2018 [80] H. Hopkins, I. J. Gonzalez, S. D. Polley, P. Angutoko, J. Ategeka, C. Asiimwe, B. Agaba,
D. J. Kyabayinze, C. J. Sutherland, M. D. Perkins, and D. Bell, "Highly sensitive detection of malaria parasitemia in a malaria-endemic setting: performance of a new loop-mediated isothermal amplification kit in a remote clinic in Uganda," J Infect Dis, vol. 208, no. 4, pp. 645-52, Aug 15 2013
[81] C. Katevatis, A. Fan, and C. M. Klapperich, "Low concentration DNA extraction and recovery using a silica solid phase," Plos One, vol. 12, no. 5, p. e0176848, May 5 2017
[82] B. Moonen, J. M. Cohen, R. W. Snow, L. Slutsker, C. Drakeley, D. L. Smith, R. R. Abeyasinghe, M. H. Rodriguez, R. Maharaj, M. Tanner, and G. Targett, "Malaria Elimination 3 Operational strategies to achieve and maintain malaria elimination," Lancet, vol. 376, no. 9752, pp. 1592-1603, Nov 6 2010
[83] D. Bell, A. E. Fleurent, M. C. Hegg, J. D. Boomgard, and C. C. McConnico, "Development of new malaria diagnostics: matching performance and need," Malar J, vol. 15, no. 1, p. 406, Aug 11 2016
[84] M. L. Wilson, "Laboratory diagnosis of malaria: conventional and rapid diagnostic methods," Arch Pathol Lab Med, vol. 137, no. 6, pp. 805-11, Jun 2013
[85] M. S. Cordray and R. R. Richards-Kortum, "Emerging nucleic acid-based tests for point-of-care detection of malaria," Am J Trop Med Hyg, vol. 87, no. 2, pp. 223-230, Aug 2012
[86] N. W. Lucchi, M. Gaye, M. A. Diallo, I. F. Goldman, D. Ljolje, A. B. Deme, A. Badiane, Y. D. Ndiaye, J. W. Barnwell, V. Udhayakumar, and D. Ndiaye, "Evaluation of the Illumigene Malaria LAMP: A Robust Molecular Diagnostic Tool for Malaria Parasites," Scientific reports, vol. 6, p. 36808, Nov 9 2016
[87] M. A. Dineva, L. MahiLum-Tapay, and H. Lee, "Sample preparation: a challenge in the development of point-of-care nucleic acid-based assays for resource-limited settings," The Analyst, vol. 132, no. 12, pp. 1193-9, Dec 2007
[88] M. Sema, A. Alemu, A. G. Bayih, S. Getie, G. Getnet, D. Guelig, R. Burton, P. LaBarre, and D. R. Pillai, "Evaluation of non-instrumented nucleic acid amplification by loop-mediated isothermal amplification (NINA-LAMP) for the diagnosis of malaria in Northwest Ethiopia," Malar J, vol. 14, p. 44, 2015
[89] A. W. Martinez, S. T. Phillips, G. M. Whitesides, and E. Carrilho, "Diagnostics for the Developing World: Microfluidic Paper-Based Analytical Devices," Anal Chem, vol. 82, no. 1, pp. 3-10, Jan 1 2010

109
[90] L. X. Kong, K. Parate, K. Abi-Samra, and M. Madou, "Multifunctional wax valves for liquid handling and incubation on a microfluidic CD," Microfluid Nanofluid, vol. 18, no. 5-6, pp. 1031-1037, May 2015
[91] M. Madou, J. Zoval, G. Y. Jia, H. Kido, J. Kim, and N. Kim, "Lab on a CD," Annual Review of Biomedical Engineering, vol. 8, pp. 601-628, 2006
[92] J. M. Park, Y. K. Cho, B. S. Lee, J. G. Lee, and C. Ko, "Multifunctional microvalves control by optical illumination on nanoheaters and its application in centrifugal microfluidic devices," Lab Chip, vol. 7, no. 5, pp. 557-564, 2007
[93] R. Gorkin, J. Park, J. Siegrist, M. Amasia, B. S. Lee, J. M. Park, J. Kim, H. Kim, M. Madou, and Y. K. Cho, "Centrifugal microfluidics for biomedical applications," Lab Chip, vol. 10, no. 14, pp. 1758-1773, 2010
[94] R. Burger, P. Reith, V. Akujobi, and J. Ducree, "Rotationally controlled magneto-hydrodynamic particle handling for bead-based microfluidic assays," Microfluid Nanofluid, vol. 13, no. 4, pp. 675-681, Oct 2012
[95] L. C. Gao and T. J. McCarthy, "Contact angle hysteresis explained," Langmuir, vol. 22, no. 14, pp. 6234-6237, Jul 4 2006
[96] D. Oner and T. J. McCarthy, "Ultrahydrophobic surfaces. Effects of topography length scales on wettability," Langmuir, vol. 16, no. 20, pp. 7777-7782, Oct 3 2000
[97] T. H. Kim, J. Park, C. J. Kim, and Y. K. Cho, "Fully Integrated Lab-on-a-Disc for Nucleic Acid Analysis of Food-Borne Pathogens," Analytical chemistry, vol. 86, no. 8, pp. 3841-3848, Apr 15 2014
[98] L. X. Kong, A. Perebikovsky, J. Moebius, L. Kulinsky, and M. Madou, "Lab-on-a-CD: A Fully Integrated Molecular Diagnostic System," Jala-J Lab Autom, vol. 21, no. 3, pp. 323-355, Jun 2016
[99] L. Dormond, K. Jaton, S. de Valliere, B. Genton, and G. Greub, "Malaria real-time PCR: correlation with clinical presentation," New Microbes New Infect, vol. 5, pp. 10-2, May 2015
[100] W. C. Lee, H. Shi, Z. Y. Poon, L. M. Nyan, T. Kaushik, G. V. Shivashankar, J. K. Y. Chan, C. T. Lim, J. Han, and K. J. Van Vliet, "Multivariate biophysical markers predictive of mesenchymal stromal cell multipotency," P Natl Acad Sci USA, vol. 111, no. 42, pp. E4409-E4418, Oct 21 2014
[101] D. Di Carlo, "A Mechanical Biomarker of Cell State in Medicine," Jala-J Lab Autom, vol. 17, no. 1, pp. 32-42, Feb 2012
[102] D. H. Kim, P. K. Wong, J. Park, A. Levchenko, and Y. Sun, "Microengineered Platforms for Cell Mechanobiology," Annu Rev Biomed Eng, vol. 11, pp. 203-233, 2009
[103] M. Musielak, "Red blood cell-deformability measurement: Review of techniques," Clin Hemorheol Micro, vol. 42, no. 1, pp. 47-64, 2009
[104] E. M. Darling and D. Di Carlo, "High-Throughput Assessment of Cellular Mechanical Properties," Annu Rev Biomed Eng, vol. 17, pp. 35-62, 2015
[105] W. W. Xu, R. Mezencev, B. Kim, L. J. Wang, J. McDonald, and T. Sulchek, "Cell Stiffness Is a Biomarker of the Metastatic Potential of Ovarian Cancer Cells," Plos One, vol. 7, no. 10, p. e46609, Oct 4 2012
[106] J. D. Pajerowski, K. N. Dahl, F. L. Zhong, P. J. Sammak, and D. E. Discher, "Physical plasticity of the nucleus in stem cell differentiation," P Natl Acad Sci USA, vol. 104, no. 40, pp. 15619-15624, Oct 2 2007
[107] I. Sraj, C. D. Eggleton, R. Jimenez, E. Hoover, J. Squier, J. Chichester, and D. W. M. Marr, "Cell deformation cytometry using diode-bar optical stretchers," J Biomed Opt, vol. 15, no. 4, p. 047010, Jul-Aug 2010

110
[108] S. E. Cross, Y. S. Jin, J. Rao, and J. K. Gimzewski, "Nanomechanical analysis of cells from cancer patients," Nat. Nanotechnol., vol. 2, no. 12, pp. 780-783, Dec 2007
[109] J. Guck, S. Schinkinger, B. Lincoln, F. Wottawah, S. Ebert, M. Romeyke, D. Lenz, H. M. Erickson, R. Ananthakrishnan, D. Mitchell, J. Kas, S. Ulvick, and C. Bilby, "Optical deformability as an inherent cell marker for testing malignant transformation and metastatic competence," Biophys. J., vol. 88, no. 5, pp. 3689-3698, May 2005
[110] A. E. Bianco, F. L. Battye, and G. V. Brown, "Plasmodium-Falciparum - Rapid Quantification of Parasitemia in Fixed Malaria Cultures by Flow-Cytometry," Experimental parasitology, vol. 62, no. 2, pp. 275-282, Oct 1986
[111] T. F. Kong, W. J. Ye, W. K. Peng, H. W. Hou, Marcos, P. R. Preiser, N. T. Nguyen, and J. Han, "Enhancing malaria diagnosis through microfluidic cell enrichment and magnetic resonance relaxometry detection," Sci Rep-Uk, vol. 5, Jun 17 2015
[112] W. R. Prescott, R. G. Jordan, M. P. Grobusch, V. M. Chinchilli, I. Kleinschmidt, J. Borovsky, M. Plaskow, M. Torrez, M. Mico, and C. Schwabe, "Performance of a malaria microscopy image analysis slide reading device," Malar J, vol. 11, p. 155, May 06 2012
[113] A. K. Bei, T. M. DeSimone, A. S. Badiane, A. D. Ahouidi, T. Dieye, D. Ndiaye, O. Sarr, O. Ndir, S. Mboup, and M. T. Duraisingh, "A flow cytometry-based assay for measuring invasion of red blood cells by Plasmodium falciparum," Am J Hematol, vol. 85, no. 4, pp. 234-237, Apr 2010
[114] H. W. Hou, A. A. S. Bhagat, A. G. L. Chong, P. Mao, K. S. W. Tan, J. Y. Han, and C. T. Lim, "Deformability based cell margination-A simple microfluidic design for malaria-infected erythrocyte separation," Lab Chip, vol. 10, no. 19, pp. 2605-2613, 2010
[115] D. R. Gossett, H. T. K. Tse, S. A. Lee, Y. Ying, A. G. Lindgren, O. O. Yang, J. Y. Rao, A. T. Clark, and D. Di Carlo, "Hydrodynamic stretching of single cells for large population mechanical phenotyping," Proceedings of the National Academy of Sciences of the United States of America, vol. 109, no. 20, pp. 7630-7635, May 15 2012
[116] O. Otto, P. Rosendahl, A. Mietke, S. Golfier, C. Herold, D. Klaue, S. Girardo, S. Pagliara, A. Ekpenyong, A. Jacobi, M. Wobus, N. Topfner, U. F. Keyser, J. Mansfeld, E. Fischer-Friedrich, and J. Guck, "Real-time deformability cytometry: on-the-fly cell mechanical phenotyping," Nature Methods, vol. 12, no. 3, pp. 199-+, Mar 2015
[117] V. Faustino, D. Pinho, T. Yaginuma, R. C. Calhelha, I. C. F. R. Ferreira, and R. Lima, "Extensional flow-based microfluidic device: deformability assessment of red blood cells in contact with tumor cells," Biochip J, vol. 8, no. 1, pp. 42-47, Mar 20 2014
[118] Y. Zheng, E. Shojaei-Baghini, A. Azad, C. Wang, and Y. Sun, "High-throughput biophysical measurement of human red blood cells," Lab Chip, vol. 12, no. 14, pp. 2560-2567, 2012
[119] E. Du, S. Ha, M. Diez-Silva, M. Dao, S. Suresh, and A. P. Chandrakasan, "Electric impedance microflow cytometry for characterization of cell disease states," Lab Chip, vol. 13, no. 19, pp. 3903-3909, 2013
[120] Q. Guo, S. J. Reiling, P. Rohrbach, and H. S. Ma, "Microfluidic biomechanical assay for red blood cells parasitized by Plasmodium falciparum," Lab Chip, vol. 12, no. 6, pp. 1143-1150, 2012
[121] W. J. Zhang, K. Kai, D. S. Choi, T. Iwamoto, Y. H. Nguyen, H. L. Wong, M. D. Landis, N. T. Ueno, J. Chang, and L. D. Qin, "Microfluidics separation reveals the stem-cell-like deformability of tumor-initiating cells," P Natl Acad Sci USA, vol. 109, no. 46, pp. 18707-18712, Nov 13 2012
[122] M. J. Rosenbluth, W. A. Lam, and D. A. Fletcher, "Analyzing cell mechanics in hematologic diseases with microfluidic biophysical flow cytometry," Lab Chip, vol. 8, no. 7, pp. 1062-1070, 2008

111
[123] J. S. Dudani, D. R. Gossett, H. T. K. Tse, and D. Di Carlo, "Pinched-flow hydrodynamic stretching of single-cells," Lab Chip, vol. 13, no. 18, pp. 3728-3734, 2013
[124] P. Rosendahl, K. Plak, A. Jacobi, M. Kraeter, N. Toepfner, O. Otto, C. Herold, M. Winzi, M. Herbig, Y. Ge, S. Girardo, K. Wagner, B. Baum, and J. Guck, "Real-time fluorescence and deformability cytometry," Nat Methods, vol. 15, no. 5, pp. 355-358, May 2018
[125] Y. X. Deng, S. P. Davis, F. Yang, K. S. Paulsen, M. Kumar, R. S. DeVaux, X. H. Wang, D. S. Conklin, A. Oberai, J. I. Herschkowitz, and A. J. Chung, "Inertial Microfluidic Cell Stretcher (iMCS): Fully Automated, High-Throughput, and Near Real-Time Cell Mechanotyping," Small, vol. 13, no. 28, p. 1700705, Jul 26 2017
[126] S. Byun, S. Son, D. Amodei, N. Cermak, J. Shaw, J. H. Kang, V. C. Hecht, M. M. Winslow, T. Jacks, P. Mallick, and S. R. Manalis, "Characterizing deformability and surface friction of cancer cells," Proc Natl Acad Sci U S A, vol. 110, no. 19, pp. 7580-5, May 7 2013
[127] X. Yang, Z. Chen, J. Miao, L. Cui, and W. Guan, "High-throughput and label-free parasitemia quantification and stage differentiation for malaria-infected red blood cells," Biosensors & bioelectronics, vol. 98, pp. 408-414, Dec 15 2017
[128] H. W. Hou, Q. Li, G. Lee, A. Kumar, C. Ong, and C. T. Lim, "Deformability study of breast cancer cells using microfluidics," Biomed Microdevices, vol. 11, no. 3, pp. 557-564, 2009
[129] K. D. Nyberg, M. B. Scott, S. L. Bruce, A. B. Gopinath, D. Bikos, T. G. Mason, J. W. Kim, H. S. Choi, and A. C. Rowat, "The physical origins of transit time measurements for rapid, single cell mechanotyping," Lab Chip, vol. 16, no. 17, pp. 3330-3339, 2016
[130] A. F. Cowman and B. S. Crabb, "Invasion of red blood cells by malaria parasites," Cell, vol. 124, no. 4, pp. 755-766, Feb 24 2006
[131] J. Bradley, W. Stone, D. F. Da, I. Morlais, A. Dicko, A. Cohuet, W. M. Guelbeogo, A. Mahamar, S. Nsango, H. M. Soumare, H. Diawara, K. Lanke, W. Graumans, R. Siebelink-Stoter, M. van de Vegte-Bolmer, I. Chen, A. Tiono, B. P. Goncalves, R. Gosling, R. W. Sauerwein, C. Drakeley, T. S. Churcher, and T. Bousema, "Predicting the likelihood and intensity of mosquito infection from sex specific Plasmodium falciparum gametocyte density," Elife, vol. 7, May 31 2018
[132] L. Grignard, B. P. Goncalves, A. M. Early, R. F. Daniels, A. B. Tiono, W. M. Guelbeogo, A. Ouedraogo, E. M. van Veen, K. Lanke, A. Diarra, I. Nebie, S. B. Sirima, G. A. Targett, S. K. Volkman, D. E. Neafsey, D. F. Wirth, T. Bousema, and C. Drakeley, "Transmission of molecularly undetectable circulating parasite clones leads to high infection complexity in mosquitoes post feeding," Int J Parasitol, vol. 48, no. 8, pp. 671-677, Jul 2018
[133] N. B. Henry, S. S. Serme, G. Siciliano, S. Sombie, A. Diarra, N. Sagnon, A. S. Traore, S. B. Sirima, I. Soulama, and P. Alano, "Biology of Plasmodium falciparum gametocyte sex ratio and implications in malaria parasite transmission," Malar J, vol. 18, no. 1, p. 70, Mar 12 2019
[134] M. Tibúrcio, M. Niang, G. Deplaine, S. Perrot, E. Bischoff, P. A. Ndour, F. Silvestrini, A. Khattab, G. Milon, and P. H. David, "A switch in infected erythrocyte deformability at the maturation and blood circulation of Plasmodium falciparum transmission stages," Blood, The Journal of the American Society of Hematology, vol. 119, no. 24, pp. e172-e180, 2012
[135] M. Aingaran, R. Zhang, S. K. Law, Z. Peng, A. Undisz, E. Meyer, M. Diez‐Silva, T. A. Burke, T. Spielmann, and C. T. Lim, "Host cell deformability is linked to transmission in the human malaria parasite Plasmodium falciparum," Cell Microbiol, vol. 14, no. 7, pp. 983-993, 2012

112
[136] M. Yamada, M. Nakashima, and M. Seki, "Pinched flow fractionation: Continuous size separation of particles utilizing a laminar flow profile in a pinched microchannel," Anal Chem, vol. 76, no. 18, pp. 5465-5471, Sep 15 2004
[137] M. Podenphant, N. Ashley, K. Koprowska, K. U. Mir, M. Zalkovskij, B. Bilenberg, W. Bodmer, A. Kristensen, and R. Marie, "Separation of cancer cells from white blood cells by pinched flow fractionation," Lab Chip, vol. 15, no. 24, pp. 4598-4606, 2015
[138] H. Wang, Z. Z. Liu, D. M. Shin, Z. G. Chen, Y. Cho, Y. J. Kim, and A. Han, "A continuous-flow acoustofluidic cytometer for single-cell mechanotyping," Lab Chip, vol. 19, no. 3, pp. 387-393, Feb 7 2019
[139] J. McGrath, M. Jimenez, and H. Bridle, "Deterministic lateral displacement for particle separation: a review," Lab Chip, vol. 14, no. 21, pp. 4139-4158, 2014
[140] Z. Liu, Y. Lee, J. Jang, Y. Li, X. Han, K. Yokoi, M. Ferrari, L. Zhou, and L. Qin, "Microfluidic cytometric analysis of cancer cell transportability and invasiveness," Scientific Report, vol. 5, p. 14272, Sep 25 2015
[141] X. N. Yang, Z. F. Chen, J. Miao, L. W. Cui, and W. H. Guan, "High-throughput and label-free parasitemia quantification and stage differentiation for malaria-infected red blood cells," Biosensors & bioelectronics, vol. 98, pp. 408-414, Dec 15 2017
[142] Y. Zheng, J. Nguyen, C. Wang, and Y. Sun, "Electrical measurement of red blood cell deformability on a microfluidic device," Lab Chip, vol. 13, no. 16, pp. 3275-3283, 2013
[143] A. Adamo, A. Sharei, L. Adamo, B. Lee, S. Mao, and K. F. Jensen, "Microfluidics-Based Assessment of Cell Deformability," Anal. Chem., vol. 84, no. 15, pp. 6438-6443, Aug 7 2012
[144] Y. Zhou, D. H. Yang, Y. N. Zhou, B. L. Khoo, J. Han, and Y. Ai, "Characterizing Deformability and Electrical Impedance of Cancer Cells in a Microfluidic Device," Anal. Chem., vol. 90, no. 1, pp. 912-919, Jan 2 2018
[145] C. W. Shields, C. D. Reyes, and G. P. Lopez, "Microfluidic cell sorting: a review of the advances in the separation of cells from debulking to rare cell isolation," Lab Chip, vol. 15, no. 5, pp. 1230-1249, 2015
[146] C. H. Chen, S. H. Cho, F. Tsai, A. Erten, and Y. H. Lo, "Microfluidic cell sorter with integrated piezoelectric actuator," Biomed Microdevices, vol. 11, no. 6, pp. 1223-1231, Dec 2009
[147] J. Seo and L. P. Lee, "Effects on wettability by surfactant accumulation/depletion in bulk polydimethylsiloxane (PDMS)," Sensors and Actuators. B: Chemical, vol. 119, no. 1, pp. 192-198, Nov 24 2006
[148] V. Doyeux, T. Podgorski, S. Peponas, M. Ismail, and G. Coupier, "Spheres in the vicinity of a bifurcation: elucidating the Zweifach-Fung effect," J Fluid Mech, vol. 674, pp. 359-388, May 2011
[149] K. D. Nyberg, K. H. Hu, S. H. Kleinman, D. B. Khismatullin, M. J. Butte, and A. C. Rowat, "Quantitative Deformability Cytometry: Rapid, Calibrated Measurements of Cell Mechanical Properties," Biophysical Journal, vol. 113, no. 7, pp. 1574-1584, Oct 2017
[150] F. R. Kersey, T. J. Merkel, J. L. Perry, M. E. Napier, and J. M. DeSimone, "Effect of Aspect Ratio and Deformability on Nanoparticle Extravasation through Nanopores," Langmuir, vol. 28, no. 23, pp. 8773-8781, Jun 12 2012
[151] P. J. Flory, Principles of polymer chemistry (The George Fisher Baker non-resident lectureship in chemistry at Cornell University). Ithaca,: Cornell Univ. Press, 1953, p. 672.
[152] T. J. Merkel, S. W. Jones, K. P. Herlihy, F. R. Kersey, A. R. Shields, M. Napier, J. C. Luft, H. L. Wu, W. C. Zamboni, A. Z. Wang, J. E. Bear, and J. M. DeSimone, "Using mechanobiological mimicry of red blood cells to extend circulation times of hydrogel microparticles," P Natl Acad Sci USA, vol. 108, no. 2, pp. 586-591, Jan 11 2011

113
[153] S. L. N. Maas, J. de Vrij, E. J. van der Vlist, B. Geragousian, L. van Bloois, E. Mastrobattista, R. M. Schiffelers, M. H. M. Wauben, M. L. D. Broekman, and E. N. M. Nolte-'t Hoen, "Possibilities and limitations of current technologies for quantification of biological extracellular vesicles and synthetic mimics," J Control Release, vol. 200, pp. 87-96, Feb 28 2015
[154] R. M. M. Smeets, U. F. Keyser, N. H. Dekker, and C. Dekker, "Noise in solid-state nanopores," Proceedings of the National Academy of Sciences of the United States of America, vol. 105, no. 2, pp. 417-421, Jan 15 2008
[155] A. V. Jagtiani, J. Carletta, and J. Zhe, "A microfluidic multichannel resistive pulse sensor using frequency division multiplexing for high throughput counting of micro particles," Journal of Micromechanics and Microengineering, vol. 21, no. 6, p. 065004, 2011/04/21 2011
[156] R. Liu, N. Wang, F. Kamili, and A. F. Sarioglu, "Microfluidic CODES: a scalable multiplexed electronic sensor for orthogonal detection of particles in microfluidic channels," Lab Chip, vol. 16, no. 8, pp. 1350-1357, Apr 21 2016
[157] L. H. Ozarow, S. Shamai, and A. D. Wyner, "Information-Theoretic Considerations for Cellular Mobile Radio," Ieee T Veh Technol, vol. 43, no. 2, pp. 359-378, May 1994
[158] R. W. Deblois and C. P. Bean, "Counting and Sizing of Submicron Particles by the Resistive Pulse Technique," Rev Sci Instrum, vol. 41, no. 7, pp. 909-916, 1970
[159] E. C. Gregg and K. D. Steidley, "Electrical Counting and Sizing of Mammalian Cells in Suspension," Biophys. J., vol. 5, no. 4, pp. 393-405, 1965
[160] A. Meller and D. Branton, "Single molecule measurements of DNA transport through a nanopore," Electrophoresis, vol. 23, no. 16, pp. 2583-2591, 2002
[161] Y. Zheng, J. Nguyen, C. Wang, and Y. Sun, "Electrical measurement of red blood cell deformability on a microfluidic device," Lab Chip, vol. 13, no. 16, pp. 3275-83, Aug 21 2013
[162] R. H. Cole, S. Y. Tang, C. A. Siltanen, P. Shahi, J. Q. Zhang, S. Poust, Z. J. Gartner, and A. R. Abate, "Printed droplet microfluidics for on demand dispensing of picoliter droplets and cells," Proc Natl Acad Sci U S A, vol. 114, no. 33, pp. 8728-8733, Aug 15 2017
[163] R. Ramji, M. Wang, A. A. S. Bhagat, D. Tan Shao Weng, N. V. Thakor, C. Teck Lim, and C.-H. Chen, "Single cell kinase signaling assay using pinched flow coupled droplet microfluidics," Biomicrofluidics, vol. 8, no. 3, p. 034104, 2014
[164] Y. Deng, S. P. Davis, F. Yang, K. S. Paulsen, M. Kumar, R. Sinnott DeVaux, X. Wang, D. S. Conklin, A. Oberai, J. I. Herschkowitz, and A. J. Chung, "Inertial Microfluidic Cell Stretcher (iMCS): Fully Automated, High-Throughput, and Near Real-Time Cell Mechanotyping," Small, vol. 13, no. 28, Jul 2017

114
VITA
Gihoon Choi
Education
• Ph.D. candidate in Electrical Engineering The Pennsylvania State University, University Park, Pennsylvania, USA
• Master in Electrical and Computer Engineering The State University of New York at Binghamton, Binghamton, USA
• Bachelor in Electrical Engineering The State University of New York at Binghamton, Binghamton, USA
Selected Journal Publication (6 of 12)
• G. Choi, R. Nouri, L. Zarzar, and W. Guan, “Microfluidic Deformability Activated Sorting of Single Particles,” Microsystems & Nanoengineering, 6, 11, 2020
• Z. Tang, G. Choi, R. Nouri, and W. Guan, “Nanopore digital counting of LAMP amplicons for nucleic acid testing,” Nano Letters, 19 (11), pp. 7927-7934, 2019
• G. Choi, E. Murphy, and W. Guan, “Microfluidic time-division multiplexing accessing (TDMA) resistive pulse sensor for particle analysis,” ACS Sensors, 4, pp. 1957-1963, 2019
• W. Zhang, Y. Hu, G. Choi, S. Lang, M. Liu, and W. Guan, “Microfluidic multiple cross-correlated Coulter counter for improved particle size analysis,” Sensors and Actuators B: Chemical, 296, 126615, 2019
• G. Choi, T. Prince, J. Miao, L. Cui, and W. Guan, “Sample-to-answer palm-sized nucleic acid testing device towards low-cost malaria mass screening,” Biosensors and Bioelectronics, 115, 83, 2018
• G. Choi, D. Song, S. Shrestha, J. Miao, L. Cui, and W. Guan, “A field-deployable mobile molecular diagnostic system for malaria at the point of need,” Lab Chip, 16, pp. 4341, 2016
Selected Conference Presentation (3 of 11)
• G. Choi, E. Murphy, and W. Guan, “Time-division multiplexed resistive pulse sensor on a microfluidic chip,” IEEE Sensors, Oct. 27-30, 2019, Montreal, Canada
• G. Choi, R. Nouri, and W. Guan, “Microfluidic Deformability-activated Cell Sorting (DACS). BMES Annual Meeting,” Oct. 16-19, 2019, Philadelphia, USA
• G. Choi and W. Guan, “Non-centrifugal microfluidic nucleic acid testing on lab-on-a-disc,” Transducers 2019, Jun. 23-27, 2019, Berlin, Germany (Outstanding Oral Paper Award Finalist)
Award
• Outstanding Paper Award Finalist in Oral Category (Transducers 2019) • Outstanding MS Researcher Award (2015)