microbial source tracking in the dungeness watershed, washington · 2018-09-23 · microbial source...
TRANSCRIPT

PNWD-4054-2
Microbial Source Tracking in the Dungeness Watershed, Washington DL Woodruff NK Sather VI Cullinan SLSargeant Battelle Pacific Northwest Division Richland, Washington 99352 Prepared for Jamestown S’Klallam Tribe in fulfillment of Task 1 (Microbial Source Tracking Study) of the Dungeness River Watershed Final Workplan for the EPA Targeted Watershed Grant Program (2004), and a Washington State Department of Ecology Centennial Grant September 2009
PNWD-4054-2
Microbial Source Tracking in the Dungeness Watershed, Washington DL Woodruff NK Sather VI Cullinan SL Sargeant Battelle Pacific Northwest Division Richland, Washington 99352 Prepared for Jamestown S’Klallam Tribe in fulfillment of Task 1 (Microbial Source Tracking Study) of the Dungeness River Watershed Final Workplan for the EPA Targeted Watershed Grant Program (2004), and a Washington State Department of Ecology Centennial Grant September 2009

Microbial Source Tracking in the Dungeness Watershed September 2009
v
Executive Summary
Two microbial source tracking (MST) studies were conducted in the lower Dungeness watershed and
Dungeness Bay in order to determine the sources of fecal coliform pollution that have been impacting the
water quality and shellfish harvesting activities for more than a decade. Between 2006 and 2009, two
independent and sequential studies were conducted by Battelle – Pacific Northwest Division’s Marine
Sciences Laboratory in Sequim Washington under contract to the Jamestown S’Klallam Tribe. The first
study (Phase 1 – Ribotyping) was implemented through an EPA Targeted Watershed grant awarded to the
Tribe, and was aimed at determining predominant sources of bacterial contamination at selected stations
in the lower watershed and Bay through a genotypic DNA-based ribotyping approach. The second study
(Phase 2 – Bacteroides Target-specific PCR) was implemented through a Washington State Department
of Ecology Centennial grant and designed to collect additional information regarding the presence of
human and ruminant sources from an expanded number of stations in the freshwater and marine
environment. The results of both studies are reported here.
The Phase 1 Ribotyping study was initiated in May 2006. Environmental samples were collected for
ribotyping analysis from four freshwater stations (MAT0.1, MC0.3, GSS, BD-7) in the lower Dungeness
watershed, two marine stations in Dungeness Bay (DOH-113, DOH-108) where water and underlying
sediment were collected, and wrack (detrital algae) from the nearby shoreline. Sampling occurred once a
month for 13 months and was completed in May 2007. The ribotyping methodology is a library-
dependent approach, meaning that fragments of DNA from the bacteria E. coli are cultivated from an
environmental sample such as water and are then matched to DNA fragments for E. coli cultivated from
known fecal sources in a host reference library. During our study, additional fecal samples were collected
from 45 known local animal and bird species and added to the preexisting reference library database
managed by the Institute of Environmental Health, Inc.
There were 1164 E. coli isolates ribotyped during the Phase 1 study. Of those, the percentage of
matched sources was relatively high (92%) with 34 species or groups identified in the watershed. While
the Dungeness watershed contains typical non-point sources of bacterial contamination, it also contains
diverse and unusual sources such as marine mammals and non-native game farm animals. The
predominant sources of fecal coliform contamination in the Dungeness from all matrix types (e.g. water,
sediment, wrack) in the freshwater and marine environments were, in rank order, avian (19.6%), gull
(12.5%), waterfowl (9.7%), raccoon (9.2%), unknown (7.3%), human-derived (7.1%), rodent (6.3%) and
dog (4.3%). When bird groups were combined, they represented in total about 42% of samples collected
and analyzed throughout the study. They occurred from at least 85% of the sampling events at all
freshwater and marine water stations and from at least 56% of marine sediment sampling station events.
When grouped together, wild mammal sources represented about 26% of isolates collected and
included raccoons, rodents, deer, elk, beaver, otter, rabbit and marine mammals. Domestic animal and
farm animal groups each represented about 7% of isolates. Source types representing animals from the
Olympic Game Farm, Inc. were also found during the study, including bear, bison, burro, prairie dog and
yak. Together, these sources accounted for about 2.5% of the total isolates collected. Game farm source
types were present 46% of the time at MAT0.1, the freshwater station located on the Game Farm near the
mouth of Matriotti Creek. These occurrences were detected throughout the year.

Microbial Source Tracking in the Dungeness Watershed September 2009
vi
Human-derived sources included onsite sewage disposal systems, sewage treatment plant waste, and
direct human sources. Human-derived sources were found at all freshwater stations, all marine water
stations and one marine sediment station. These sources represented between 3 and 15% of the isolates
for any given station. They were present throughout the year, occurring in 25 to 69% of the sampling
events by station. Matriotti Creek (MAT0.1) had the highest frequency of occurrence of human sources,
occurring during 9 out of 13 sampling events. Meadowbrook Creek (MC0.3) and a bluff ditch station
(BD-7) also had human-derived sources present at least half of the time.
While there were no statistically significant trends through time during the study year, the proportion
of wild mammals and game farm sources, when combined, increased slightly during the wet season
(October through March). This trend may indicate the possible influence of surface runoff events. In
general, freshwater source host organisms such as wild mammals, and domestic and farm animals were
found consistently in marine water, sediment and wrack, indicating the conveyance of these sources into
the marine environment.
The Phase 2 Bacteroides target-specific polymerase chain reaction (PCR) study was conducted over a
shorter time period, between December 2008 and January 2009. This study had fewer sampling events (3
in total), however encompassed more stations in the lower watershed and Bay. A total of 21 stations were
sampled during the study, with some sampled more than once. The Bacteroides methodology is a library-
independent approach. This method amplifies known DNA biomarkers from Bacteroides, a fecal
indicator bacteria, to match with Bacteroides DNA in water samples. The (PCR method is used to
amplify the biomarker by replicating a target DNA sequence. The biomarkers available for this study
included human and ruminant (e.g. cattle, bison, deer, goat).
A total of 42 samples were collected during Phase 2 and analyzed by EPA Region 10. Overall, there
were relatively few samples that were identified as human or ruminant. Seventeen samples contained the
general Bacteroides-only marker, indicating a fecal source other than human or ruminant. Two out of 42
samples were identified as ruminant-only and were collected from sites not sampled during Phase 1 (Bluff
Seep-8 and Cooper Creek). Two additional samples were positive for human sources, from Meadowbrook
Slough (MS0.3) and Meadowbrook Creek (MC0.2), also sites that were not included in the Phase 1 study.
One sample from Cassalery Creek tested positive for both human and ruminant sources. The remaining
20 samples did not contain any Bacteroides fecal indicator bacteria. While the overall samples collected
as part of Phase 2 of the study yielded few samples containing Bacteroides, the detection of human and/or
ruminant-derived source bacteria occurring at sites not sampled during Phase 1 indicates a wider spread
of these sources throughout the lower watershed.
The Phase 2 Bacteroides PCR study complemented the Phase 1 ribotyping study. The Phase 1 study
identified a large variety of sources, while the Phase 2 study confirmed the presence of human and
ruminant biomarkers from a larger region in the lower Dungeness watershed. Each of the microbial
source tracking methods used in these studies had discrete strengths and weaknesses. While it is
generally recognized that MST methods are still evolving and have not been standardized, both
methodologies proved helpful in understanding the underlying sources of fecal contamination in the
watershed. The ribotyping study (Phase 1) was comprehensive in nature and had a relatively high
percentage match to identifiable sources (92%). However, it was more expensive and final test results
were not available for close to a year after the last sampling event, making it an impractical technique for
routine application. The Bacteroides study (Phase 2) was a smaller scaled study and less expensive on a
per sample basis due to the library-independent approach and cultivation of the host organism is not

Microbial Source Tracking in the Dungeness Watershed September 2009
vii
required. The results were accurate based on blind samples submitted, and the turnaround time for
sample analysis and reporting was on the order of several months. However, only two primers (human
and ruminant) were available for use in this study. In the future, the Bacteroides approach could be
greatly enhanced by the incorporation of additional primers.
Overall, these methods were successful in providing empirical scientific evidence of the predominant
sources of fecal contamination in the lower Dungeness watershed and Bay. While some of these
contamination sources may be difficult to manage (i.e. birds and wild mammals), the microbial source
tracking study also provided evidence of sources in the watershed that can be controlled or mitigated for,
such as human-derived sources that can be considered a public health risk. Results of the combined
studies provide the basis for continued education and public outreach regarding sources of bacterial
contamination in the Dungeness watershed. For example, the scientific knowledge gained from this study
provides the opportunity for resource managers to strengthen on-site septic system management programs
and ensure they are aimed at reducing bacteria levels in the watershed. In addition, the results of the
microbial source tracking study provide the basis for re-evaluation of the progress made toward achieving
the goals of the Clean Water Strategy and Water Cleanup Detailed Implementation Plan and for making
adjustments to current or future monitoring plans or cleanup strategies. While these results should not be
extrapolated to other geographic regions, information gained from the overall approach, the application of
these tools, and lessons learned can be applied to other watersheds.

Microbial Source Tracking in the Dungeness Watershed September 2009
ix
Acknowledgments
We gratefully acknowledge the funding support and contributions that made this work possible:
Funding sources: U.S. Environmental Protection Agency’s Targeted Watershed Initiative
grant to the Jamestown S’Klallam Tribe and a Washington State Department of Ecology
Centennial grant to the Jamestown S’Klallam Tribe
Greg Ma and Mansour Samadpour with the Institute for Environmental Health for analysis of
ribotype samples
Stephanie Harris with the EPA Region 10 Laboratory in Manchester, Washington for PCR
analysis of environmental samples
Washington State Department of Health (Greg Combs), Clallam County Environmental
Health Department (Liz Maier, Janine Reed, Belinda Pero), U.S. fish and Wildlife Service
(Pam Sanguinetti), Graysmarsh Farm (Jessica Coyle) and the Jamestown S’Klallam Tribe
(Lori DeLorm, Aleta Erickson, Bob DeLorm) for help with field sample collection and
laboratory analysis of environmental samples.
Program support from the Jamestown S’Klallam Tribe (Shawn Hines, Hansi Hals, Pam
Edens, Aleta Erickson, Lyn Muench), EPA Region 10 (Bevin Horn), Washington State
Department of Ecology (Debbie Sargeant, Tammy Riddell, Scott Collyard), Clallam
Conservation District (Joe Holtrop, Gary Dougherty) and Clallam County (Andy Brastad, Liz
Maier, Janine Reed)
Technical, administrative and contractual support from the Pacific Northwest National
Laboratory/Battelle Northwest Division (Chaeli Judd, Jan Slater, Rhonda Karls, Carolyn
Suslick, Susan Ennor, Katie Hartman, Chris Morgan)
Insightful and helpful reviews of the report were provided by Liz Maier, Andy Brastad,
Janine Reed, Joe Holtrop, Stephanie Harris, Hansi Hals and Shawn Hines.


Microbial Source Tracking in the Dungeness Watershed September 2009
xi
Acronyms and Abbreviations
CFU colony forming unit
BMP best management practice
DNA deoxyribonucleic acid
DOE Department of Ecology
DOH Department of Health
EPA Environmental Protection Agency
FC fecal coliform
IEH Institute of Environmental Health
MST microbial source tracking
PCR polymerase chain reaction
QAPP Quality Assurance Project Plan
TMDL Total Maximum Daily Load
TSS total suspended sediments
TWG Targeted Watershed grant


Microbial Source Tracking in the Dungeness Watershed September 2009
xiii
Contents
Executive Summary ............................................................................................................................ v
Acknowledgments .............................................................................................................................. ix
Acronyms and Abbreviations ............................................................................................................ xi
1.0 Introduction ............................................................................................................................. 1.1
1.1 Background ..................................................................................................................... 1.1
1.2 Study Area and Land Use ................................................................................................ 1.3
1.3 Potential Pollution Sources ............................................................................................. 1.5
1.4 Microbial Source Tracking .............................................................................................. 1.6
1.5 Project Objectives and Approach .................................................................................... 1.7
1.6 Report Contents and Organization .................................................................................. 1.9
2.0 Study Design and Methodology .............................................................................................. 2.1
2.1 Phase 1 – Targeted Watershed Grant (Ribotyping Study) .............................................. 2.1
2.1.1 Sampling Sites ...................................................................................................... 2.1
2.1.2 Field Sampling Approach ..................................................................................... 2.3
2.1.3 Analytical Methodology ....................................................................................... 2.6
2.1.4 Quality Assurance ................................................................................................ 2.7
2.2 Phase 2 – Centennial Grant (Bacteroides Target-Specific PCR study)........................... 2.7
2.2.1 Sampling Stations ................................................................................................. 2.7
2.2.2 Field Sampling Approach ..................................................................................... 2.8
2.2.3 Analytical Methodology ..................................................................................... 2.10
2.2.4 Quality Assurance/Quality Control .................................................................... 2.11
2.3 Data Analysis ................................................................................................................ 2.12
3.0 Results ..................................................................................................................................... 3.1
3.1 Phase 1 – Ribotyping....................................................................................................... 3.1
3.1.1 Source types found ............................................................................................... 3.2
3.1.2 Analysis by Functional Groups ............................................................................ 3.6
3.1.3 Frequency of occurrence ...................................................................................... 3.7
3.1.4 Freshwater stations ............................................................................................... 3.8
3.1.5 Marine water stations ........................................................................................... 3.9
3.1.6 Marine sediment and wrack stations .................................................................. 3.10
3.1.7 Human-derived Sources ..................................................................................... 3.11
3.2 Phase 2 – Bacteroides Target-specific PCR .................................................................. 3.15
3.2.1 Analysis of human and ruminant biomarkers ..................................................... 3.15
3.2.2 Quality Control Assessment ............................................................................... 3.17
3.2.3 Water Quality (fecal coliform and total suspended sediments) .......................... 3.18
4.0 Discussion ................................................................................................................................ 4.1

Microbial Source Tracking in the Dungeness Watershed September 2009
xiv
5.0 Conclusions and Recommendations ........................................................................................ 5.5
6.0 References ............................................................................................................................... 6.1
Microbial Source Tracking in the Dungeness Watershed September 2009
xv
Figures
Figure 1.1 Shellfish Harvest Closure Areas and Department of Health Sampling Stations in
Dungeness Bay ........................................................................................................................ 1.2
Figure 1.2 Overview of Olympic Peninsula Showing Dungeness Watershed ............................... 1.3
Figure 1.3 Land Use/Land Cover Attributes in the Dungeness Watershed ................................... 1.5
Figure 2.1 Microbial Source Tracking Stations Sampled During the Phase 1–Ribotyping Study. 2.1
Figure 2.2 Microbial Source Tracking Stations Sampled During the Phase 2 –
BacteroidesTarget-Specific PCR Study ................................................................................... 2.8
Figure 3.1 Distribution of total number of isolates from all stations based on source type. .......... 3.5
Figure 3.2 Distribution of total number of isolates from all stations based on functional groups. 3.7
Figure 3.3 Distribution of the total number of isolates from freshwater stations based on
functional groups. .................................................................................................................... 3.9
Figure 3.4 Distribution of the total number of isolates from marine water stations based on
functional groups. .................................................................................................................. 3.10
Figure 3.5 Distribution of the number of isolates from marine sediment stations based on
functional groups. .................................................................................................................. 3.11
Figure 3.6 Human-derived source isolates combined (human, septage, sewage) between May
2006 and May 2007 for each freshwater station. ................................................................... 3.13
Figure 3.7 Human-derived source isolates between May 2006 and May 2007 for the two marine
water stations (upper graphs) and the two sediment stations (lower graphs). ....................... 3.14

Microbial Source Tracking in the Dungeness Watershed September 2009
xvi
Tables
Table 2.1 Source fecal samples collected from the Dungeness Watershed Study Area ................. 2.4
Table 2.2 Stations, locations, and dates of target-specific PCR samples for the Phase 2 sampling.2.9
Table 3.1 Sample inventory by station and event from Phase 1 including number of
environmental samples collected and number of isolates typed by IEH from each sampling
event shown in parentheses ( ). ................................................................................................ 3.2
Table 3.2 Number of unidentified isolates and percent match from each station and matrix type . 3.3
Table 3.3 Number of isolates by source type, station and matrix (e.g. freshwater, marine water,
sediment, wrack) ...................................................................................................................... 3.4
Table 3.4 List of source types assigned to functional groups ......................................................... 3.6
Table 3.5 Frequency of occurrence (percent) of functional groups by station based on the number
of sampling events or possible occurrences ............................................................................. 3.8
Table 3.6 Number and proportion of human-derived isolates found at each station over the
duration of the study. ............................................................................................................. 3.12
Table 3.7 Summary of Phase 2 analysis of FC concentration, total suspended sediments, salinity
and target-specific PCR analysis for presence of Bacteroides human and ruminant
biomarkers. ............................................................................................................................ 3.16

Microbial Source Tracking in the Dungeness Watershed September 2009
1.1
1.0 Introduction
For the past several decades, the Dungeness River, its tributaries, and Dungeness Bay (collectively
referred to as the Dungeness watershed) on the Olympic Peninsula in Washington State have experienced
a decline in water quality. The decline in part, has included elevated levels of fecal coliform (FC)
bacteria. This condition has placed the lower Dungeness River and several of its tributaries on
Washington State’s 303(d) list of impaired waters for bacteria violations, and resulted in downgrades in
marine water quality classifications in Dungeness Bay that have led to the closure of shellfish harvest
areas. A variety of responses and remedial actions have been undertaken by local agencies, Jamestown
S’Klallam Tribe, and state and federal agencies in an effort to understand the sources of FC pollution and
develop strategies to reduce the bacteria levels.
Between 2006 and 2008, researchers at Battelle—Pacific Northwest Division’s Marine Sciences
Laboratory in Sequim, Washington, under contract to the Jamestown S’Klallam Tribe conducted two
independent microbial source tracking studies in order to determine what the predominant sources of fecal
coliform pollution are in the Dungeness watershed. These studies were called out as recommendations in
the Clean Water Strategy for addressing Bacteria Pollution in Dungeness Bay and Watershed and Water
Cleanup Detailed Implementation Plan (Hempleman and Streeter 2004). They were implemented
through an EPA Targeted Watershed grant awarded to the Tribe in 2004 and a Washington State
Department of Ecology Centennial Grant awarded to the Tribe in 2006. The results of both studies are
reported here.
1.1 Background
Since 1991, elevated levels of FC bacteria in Matriotti Creek, have been monitored and documented
by the collective efforts of Clallam County, the Clallam Conservation District, and the Jamestown
S’Klallam Tribe. In 1996, Matriotti Creek was placed on Washington’s 303(d) list of impaired waters
because of FC violations. In 1997, the Washington State Department of Health (DOH) reported
increasing levels of FC bacteria in Dungeness Bay near the mouth of the Dungeness River (DOH 1998).
In response to this, the Jamestown S’Klallam Tribe initiated water quality monitoring of several
tributaries adjacent to the bay, hoping to find a definitive source that would explain the elevated bacteria
levels. When it was determined that a number of tributaries were not meeting the water-quality standards
for FC bacteria, it became evident that the poor water quality may be due to a variety of diffuse sources in
the Dungeness River, its tributaries, and Dungeness Bay, exhibiting a classic case of nonpoint source
pollution.
In 1998, the Washington State Department of Ecology (DOE) agreed to conduct a Total Maximum
Daily Load (TMDL) study on Matriotti Creek and several other freshwater tributaries in the lower
Dungeness watershed, in order to develop targeted reduction levels for FC and prioritize bacterial
pollution control actions. In cooperation with the Jamestown S’Klallam Tribe and Clallam County, DOE
began a year of monitoring in November 1999 in the Lower Dungeness River. As a result of that study,
TMDL recommendations included a stringent FC target for the Dungeness River and bacteria loading
reductions for the tributaries leading to Dungeness Bay (Sargeant 2002). The FC targets were more
stringent than current freshwater standards because the intent was to achieve shellfish-harvestable FC
results, which necessitate a stricter standard.

Microbial Source Tracking in the Dungeness Watershed September 2009
1.2
During the freshwater TMDL study, elevated FC levels in the bay continued to persist. In 2000, the
high bacteria levels caused a reclassification by DOH of 300 acres of the bay near the mouth of the
Dungeness River from Approved for Shellfish Harvest to Prohibited for Shellfish Harvest. An additional
100 acres were downgraded in 2001. In 2003, DOH changed the classification of the inner Bay to
Conditionally Approved for Shellfish Harvest. This required the inner bay to be closed annually during
the rainy season from November 1st through January 31
st (Melvin 2003) (Figure 1.1). These closures are
currently still in effect. As a result of the continued concern in the bay, a circulation study was conducted
with particular emphasis placed on understanding FC sources and transport pathways (Rensel 2003).
Figure 1.1 Shellfish Harvest Closure Areas and Department of Health Sampling Stations in Dungeness
Bay
After the downgrade of the shellfish harvest areas, DOH initiated a closure response process. This
included convening a Response Team, now called the Clean Water Workgroup that was formed in 2001,
and developing a shellfish protection district (Clean Water District) by Clallam County. The Clean Water
Workgroup developed a response plan, the Clean Water Strategy for Addressing Bacterial Pollution in
Dungeness Bay and Watershed (Clean Water Workgroup 2002). In the Clean Water Strategy, a microbial
source tracking study was identified as a high priority project. Based on that recommendation, a
feasibility study was conducted in 2003 to review potential microbial source tracking methods that would

Microbial Source Tracking in the Dungeness Watershed September 2009
1.3
be applicable to the Dungeness watershed (Woodruff and Evans 2003). Two of the molecular methods
included in that review were implemented and are the focus of this report.
1.2 Study Area and Land Use
The Dungeness watershed is located on the Olympic Peninsula near Puget Sound in Washington State
(Figure 1.2). The major freshwater tributary to Dungeness Bay is the Dungeness River, which originates
in the Olympic Mountains and flows 32 miles through wilderness, forested, agricultural, and residential
areas into the bay. The upper two-thirds of the watershed are in the Olympic National Park and Olympic
National Forest. The lower portion of the watershed flows predominantly through private land. The
watershed lies in the rain shadow of the Olympic Mountains, where annual precipitation varies from 15
inches in the lower watershed to approximately 80 in. at the headwaters of the Dungeness River (Clallam
County 1993).
Figure 1.2 Overview of Olympic Peninsula Showing Dungeness Watershed
The Dungeness River is the primary freshwater tributary flowing into Dungeness Bay. The bay is
partly enclosed within a sand spit that extends approximately 5 miles eastward into the Strait of Juan de
Fuca and is home to the Dungeness National Wildlife Refuge. The U.S. Fish and Wildlife Service
manages approximately 131 hectares within the bay as a wildlife refuge that provides habitat for a
multitude of migrating birds and marine mammals. Recreational enthusiasts enjoy kayaking, wind
surfing, and bird watching in the bay. A limited fishery is used by multiple groups including Tribal,
Microbial Source Tracking in the Dungeness Watershed September 2009
1.4
commercial, and recreational fisherman. The bay has historically been used for shellfish harvesting by
both Tribal and non-Tribal residents.
The lower Dungeness watershed has become increasingly dominated by residential land use with less
emphasis on agricultural use of the land (Figure 1.3). Although the City of Sequim is on a sewer system,
residences and commercial establishments in the unincorporated areas of the watershed use onsite sewage
treatment systems. In addition, over 40% of homes in the area are located on or near a water body (e.g.,
Dungeness Bay, Dungeness River, Strait of Juan de Fuca, wetlands, creeks, and irrigation ditches) and
many of those homes use onsite septic disposal systems. The Dungeness River is the source of water for
an extensive irrigation network that serves agriculture, hobby farm, and residential community use. In the
Dungeness basin, there are well over 100 miles of irrigation ditches, creating a complex network of
surface water conveyance through the Dungeness valley. For over 20 years, local and regional
institutions have worked collaboratively to maintain and restore ecosystem functions in the Dungeness
watershed. However, as the area has been slowly converted from forest to agricultural and residential
land uses, the challenges of maintaining healthy ecosystem function have increased.

Microbial Source Tracking in the Dungeness Watershed September 2009
1.5
Figure 1.3 Land Use/Land Cover Attributes in the Dungeness Watershed
1.3 Potential Pollution Sources
In recent years, human-induced impacts have impaired the natural function of the river and bay. A
variety of watershed health problems have ensued, resulting in the listing of salmonid species under the
Endangered Species Act and closure of Dungeness Bay to shellfish harvesting beginning in 2000
(Sargeant- 2004) due to high levels of FC bacteria. As floodplain development continues in the region,
issues of storm water runoff, failing septic systems, and impaired in-stream flows persist.
Microbial Source Tracking in the Dungeness Watershed September 2009
1.6
Within the Dungeness watershed, potential pollution sources of FC bacteria are primarily from
diffuse (non-point) and diverse sources. These include but are not limited to the following, in
alphabetical order:
avian (waterfowl, gulls, etc…)
failing septic systems
farm animals (cattle, horses)
farm-raised non-native wildlife (yak, bison, etc…)
marine mammals (seals, sea lions)
pets (dogs, cats, rabbits)
recreational boaters
wildlife (raccoon, deer, elk, rodents).
1.4 Microbial Source Tracking
Protection from pathogenic microbes is a concern in waters used for drinking water, recreation, and
fish and shellfish harvesting. This is commonly assessed by monitoring for the presence of indicator
bacteria such as fecal coliform, E. coli or fecal enterococci. These microorganisms are associated with
fecal material from humans and other warm blooded animals, and their presence in water may indicate the
presence of enteric (intestinal) pathogens. Detecting indicator bacteria and tracking them to their source is
also of interest in light of current TMDL requirements. TMDL’s are used to establish the maximum
pollutant load that a water body can receive and still meet water quality standards. However nonpoint
sources of fecal pollution from agricultural practices, wildlife, and storm water runoff are exceedingly
difficult to track to source of origin. Without understanding the sources of non-point pollution and
developing mitigation strategies where practical, it is extremely difficult to meet TMDL targets. In recent
years microbial source tracking (MST) methods have been used to inform bacterial TMDL programs in
order to track predominant source(s) of non-point fecal pollution impacting surface waters (Santo
Domingo et al. 2007; Stoeckel and Harwood 2007; USEPA 2005).
Various MST approaches have been developed to associate specific types of animals, birds, or human
sources with fecal pollution of natural waters. In general MST methods can be divided into two broad
categories. The first are ―cultivation-dependent‖ methods, meaning they rely on the culture of the target
bacteria with further analysis based on some aspect of a bacteria’s DNA sequence (genotypic or
molecular approach), or some measure of a trait that is expressed (phenotypic or biochemical approach).
These culture dependent methods usually rely on selective cultivation of indicator bacteria such as E. coli
or Enterococcus sp. from water samples as well as from known fecal sources that are used to construct a
host reference library of signature ―fingerprints‖ for comparison. The second broad category of MST
methods includes ―cultivation-independent‖ methods which directly analyze samples from the
environment using a molecular approach and don’t require the culture of the target bacteria or the
development of a source library. These methods are used with bacteria that are not easily cultivated in the
laboratory, but are still considered common genera occurring in intestines of animals (e.g. Bacteroides,
Bifidobacterium) (USEPA 2005).
Microbial Source Tracking in the Dungeness Watershed September 2009
1.7
In the Dungeness watershed we used two MST approaches to address recommendations provided in
the Clean water Strategy for Addressing Bacteria Pollution in Dungeness Bay and Watershed, and Water
Cleanup Detailed Implementation Plan (Streeter and Hempleman 2004). For the Phase 1 study we used a
ribotyping method which is a cultivation-dependent, host-library dependent approach. For the follow-on
Phase 2 study we used a Bacteroides target-specific method, which is a cultivation-independent approach
that doesn’t require the development of a host-reference library for comparison.
The ribotyping method used in the Phase 1 study is a genetic fingerprinting approach. It is based on
the premise that the DNA fingerprint of the E. coli bacteria living within the gut or intestine of a
particular species of animal, although genetically similar to other species, has certain unique differences
in the DNA sequence that can be used to match to an E. coli bacteria from an unknown source (e.g. water
or sediment sample). Hence this method requires a large database of known or typed source E. coli
isolates that is used for comparison against unknown sources of E. coli. The ribotyping method is a
multiple step process that involves restriction enzyme digestion of genomic DNA, separation of DNA
fragments by gel electrophoresis, immobilization of fragments to a solid matrix and subsequent
hybridization using a labeled probe of the E. coli rRNA genes. Fragments of ribosomal RNA from E. coli
that are cultivated from an environmental sample such as water or sediment are then matched to RNA
fragments from E. coli cultivated from known fecal sources in a host reference library.
The Bacteroides target-specific PCR approach used during the Phase 2 study is cultivation –
independent method. This method amplifies known DNA biomarkers from Bacteroides to match with
Bacteroides DNA in water samples. The polymerase chain reaction (PCR) method is used to amplify the
biomarker by replicating a target DNA sequence such that it can be visualized after gel electrophoresis
and staining. While a number of primers have been developed, only several are readily available. This
study used primers that were available to the EPA Manchester Laboratory to identify human and ruminant
sources of Bacteroides.
1.5 Project Objectives and Approach
This report focuses on the results of two independent and sequential studies aimed at determining the
source (host organisms) of FC bacterial contamination in the Dungeness watershed and bay. The first
study (referred to as Phase 1 – Ribotyping Study in this report) is part of a U.S. Environmental Protection
Agency (EPA) Targeted Watershed grant awarded to the Jamestown S’Klallam Tribe and its partners in
2004. The second study (referred to as Phase 2 – Bacteroides Target-specific PCR Study) was funded
through a Washington State Centennial grant awarded to the Jamestown S’Klallam Tribe in 2004. The
Tribe contracted with Battelle – Pacific Northwest Division to conduct these studies.
The Phase1 ribotyping study was one of three tasks conducted under the EPA Targeted Watershed
grant that focused efforts on surface water cleanup in the lower Dungeness watershed. The EPA Targeted
Watershed grant program was established in 2003 to encourage innovative community-based approaches
and management techniques to protect and restore clean water in the nation’s watersheds. The Dungeness
Targeted Watershed grant focused efforts between 2004 and 2009 on the following tasks as part of the
Initiative that are ultimately related to surface water restoration activities in the watershed:
Task 1 a MST study to more precisely define pollutant sources in the lower Dungeness watershed and
Dungeness Bay (the focus of this report);

Microbial Source Tracking in the Dungeness Watershed September 2009
1.8
Task 2 innovative best management practice (BMP) demonstrations (and market-based incentives for
BMP implementation) related to water quality treatment including a mycoremediation treatment
demonstration, septic system maintenance, and water conservation; and
Task 3 an Effectiveness Monitoring study, to compare the effectiveness of various BMP demonstrations
within the watershed and examine the historic context within the watershed.
Task 1, under the Targeted Watershed grant, was a MST study aimed at more precisely defining FC
bacteria sources in the watershed. This study used a ribotyping approach to address questions raised from
earlier TMDL studies in the lower river (Sargeant 2002) and the bay (Sargeant 2004). Sites were selected
in these two regions and sampled over a one-year time period to characterize the predominant sources
(host animals) of E. coli bacteria and to assess the potential for mitigation. Specific objectives for Phase 1
included the following:
Characterize the predominant sources of FC bacteria in the lower Dungeness watershed and
Dungeness Bay.
Determine the predominant sources of FC at key specific sites and examine the differences
between sites.
Determine if and/or what temporal trends may exist based on the time period sampled (1 year).
Determine what sources may be controllable.
Use results from this study for public outreach, mitigation where practical, and improvement of
the design of future water-quality monitoring projects.
The second study (referred to as Phase 2 – Bacteroides Target-Specific PCR in this report) was
funded through a Washington State Centennial grant awarded to the Jamestown S’Klallam Tribe. This
study used a Bacteroides target-specific PCR (polymerase chain reaction) methodology to focus on
confirming the presence/absence of human and ruminant sources at selected stations in the Dungeness
watershed. Most of the stations sampled during the Phase 1 study were included in the Phase 2 sampling
plan along with additional sites of concern or interest, based on the results of the first study. Phase 2 was
conducted approximately one and a half years after Phase 1 ended and was of shorter duration. Specific
objectives for Phase 2 included the following:
Verify the presence or absence of human and ruminant sources at previous Phase 1 MST
monitoring stations in the watershed.
Determine the presence or absence of human and ruminant sources at additional selected
monitoring stations in the watershed.
Assess the spatial extent of human and /or ruminant sources in Dungeness Bay during the
Shellfish Harvest Conditional Closure time period.
Assess the presence of human and/or ruminant sources from freshwater seeps located along inner
Dungeness Bay.
Use the results of the study to target specific waste-reduction BMPs.
Foster community education and outreach regarding sources of human fecal contamination in the
Dungeness watershed.
Microbial Source Tracking in the Dungeness Watershed September 2009
1.9
1.6 Report Contents and Organization
The Phase 1 and Phase 2 methods (Section 2.0) and results (Section 3.0) are reported as independent
studies. The discussion (Section 4.0), and conclusions and recommendations (Section 5.0) are based on
the combined and collective knowledge gained from each independent study and reported as an integrated
effort.

Microbial Source Tracking in the Dungeness Watershed September 2009
2.1
2.0 Study Design and Methodology
2.1 Phase 1 – Targeted Watershed Grant (Ribotyping Study)
The sampling stations, sampling approach, analytical methodology and quality assurance objectives
for the Phase 1 - Targeted Watershed Grant Ribotyping Study are described below.
2.1.1 Sampling Sites
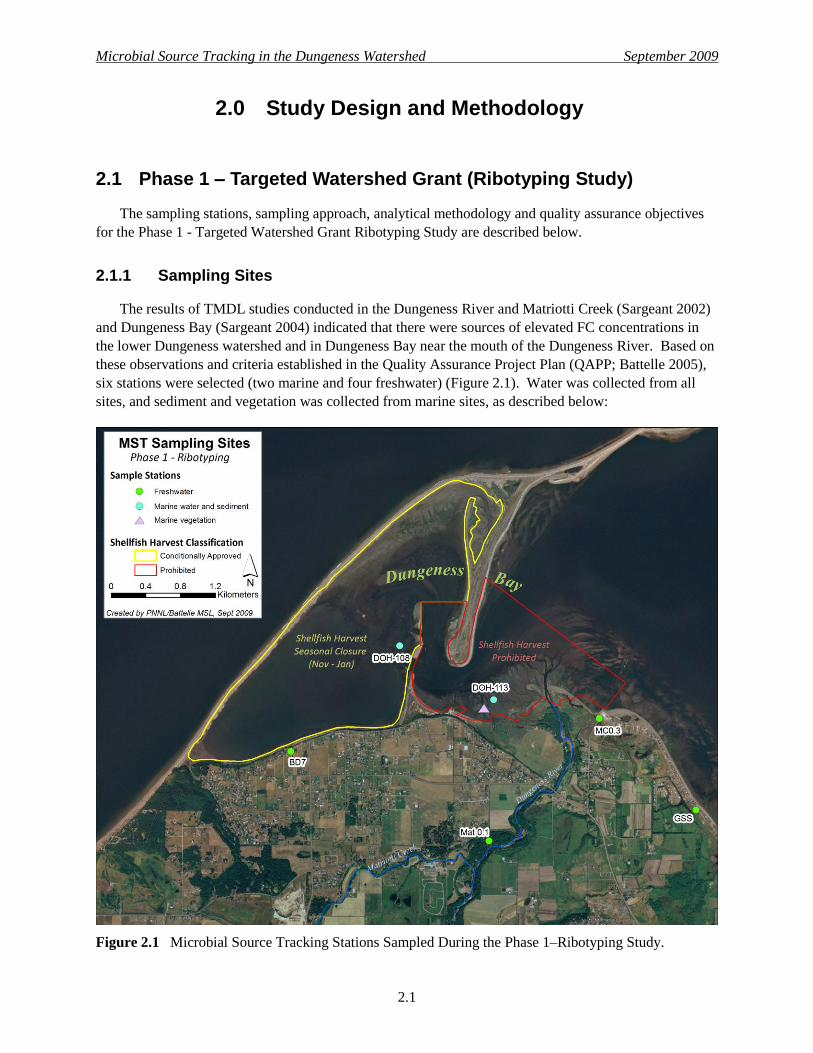
The results of TMDL studies conducted in the Dungeness River and Matriotti Creek (Sargeant 2002)
and Dungeness Bay (Sargeant 2004) indicated that there were sources of elevated FC concentrations in
the lower Dungeness watershed and in Dungeness Bay near the mouth of the Dungeness River. Based on
these observations and criteria established in the Quality Assurance Project Plan (QAPP; Battelle 2005),
six stations were selected (two marine and four freshwater) (Figure 2.1). Water was collected from all
sites, and sediment and vegetation was collected from marine sites, as described below:
Figure 2.1 Microbial Source Tracking Stations Sampled During the Phase 1–Ribotyping Study.

Microbial Source Tracking in the Dungeness Watershed September 2009
2.2
Freshwater Stations
o MAT 0.1 (Matriotti Creek, river mile 0.1) – This sampling station was located on the Olympic
Game Farm at the mouth of Matriotti Creek, just before the creek enters the Dungeness River.
Land uses in the sub-basin include residential, commercial, cropland, and livestock, including
beef and dairy cattle, horses and the Olympic Game Farm, which is a large wild animal park.
Matriotti Creek was also used as a conveyance for the irrigation water in recent past, a practice
that rarely occurs today. This site was included in the Lower Dungeness TMDL study
(Sargeant 2002).
o MC 0.3 (Meadowbrook Creek, river mile 0.3) – This sampling station was located near the
mouth of Meadowbrook Creek before it enters Dungeness Bay. Land uses in the sub-basin
include a horse farm near the mouth (no longer in use), a brackish tidal marsh used by birds,
agricultural, residential, and some commercial use in the local community of Dungeness. All
residences and commercial properties are on onsite sewage treatment systems. This site was
included in the Lower Dungeness TMDL study (Sargeant 2002).
o GSS (Golden Sands Slough) – This sampling station was located in a small drainage of
constructed canals supporting a residential development close to Dungeness Bay. The canal is
connected to the bay by an approximate 250-ft long concrete culvert under Three Crabs Road.
Access to the bay is sometimes blocked by debris, creating flooding in some areas. The land
use there is residential, with some lots served by septic systems and others using holding tanks.
This site was included in the Lower Dungeness TMDL study (Sargeant 2002). The sampling
location is just south of Three Crabs Road.
o BD7 (Bluff Ditch #7) – This sampling station was in an irrigation ditch that empties into
Dungeness Bay. The ditch is periodically dry, however historically it had more flow than other
Marine Drive ditches in the same vicinity. The ditch occasionally conveys storm water during
the rainy season. It was included in the Dungeness Bay TMDL study (Sargeant 2004).
Marine Stations
o DOH-113 water – This sampling station was located just off the mouth of the Dungeness River;
it contains both marine and freshwater (Dungeness River) influences. This station is located in
the Prohibited shellfish closure area. It was included in the Dungeness Bay TMDL study
(Sargeant 2004).
o DOH -113 sediment –The upper 3 cm of sediment were collected using a grab sampler, and
was co-located with the DOH-113 water sample station.
o DOH-113 vegetation – This sampling station was a wrack line of detrital vegetation (primarily
the green alga Ulva sp. and eelgrass Zostera marina) located along the upper fringe of the
intertidal region of outer Dungeness Bay. The collection was seasonal and location varied
slightly over time within the vicinity of DOH-113, depending on the presence or absence of
detrital wrack.
o DOH-108 water – This sampling site was located on inner Dungeness Bay just west of Cline
Spit. This site contains primarily marine influenced water. It is located within the Conditional
shellfish closure area. It is included in the Dungeness Bay TMDL study (Sargeant 2004).
Microbial Source Tracking in the Dungeness Watershed September 2009
2.3
o DOH-108 sediment – The upper 3 cm of sediment were collected using a grab sampler, and
was co-located with the DOH-108 water sample station.
2.1.2 Field Sampling Approach
The sampling design consisted of three primary field efforts that were conducted per an approved
Quality Assurance Project Plan (Battelle 2005) during 2006 and 2007:
Collection of fecal source samples for addition to source library. Samples representing the
distribution and variety of animals, birds, marine mammals, and human sources that occur in the
Dungeness watershed were collected. These samples were added to the DNA source library of the
Institute of Environmental Health Laboratory (IEH) in Seattle. Collections occurred throughout the
course of the overall study.
Collection of test samples (water, marine sediment and marine vegetation) for ribotyping analysis.
Test sampling of water, marine sediment and marine vegetation occurred on a monthly basis
between May 2006 and May 2007, a total of 13 months, from each of the 6 study stations (Figure
2.1).
Collection of water samples for FC analysis. Water sampling for FC occurred in conjunction with
the test sample collection for ribotyping and was coordinated with the Effectiveness Monitoring
component (Task 3) of the EPA Targeted Watershed grant.
2.1.2.1 Collection of Fecal Source Samples for the DNA Library
To improve the percentage of DNA matches between E. coli in test samples and E. coli of known
source types, an inventory of fecal samples representing local species of birds, wildlife, domestic animals,
marine mammals, and human sources (septic systems) from the Dungeness watershed and the greater
Olympic Peninsula region was collected and shipped to IEH for inclusion in its extensive DNA library
database.
Fresh fecal samples were collected aseptically in sterile containers and delivered the same day or
shipped overnight on ice to IEH. Samples were collected only when they were positively identified as
belonging to a known species. Only one sample was collected from each individual animal.
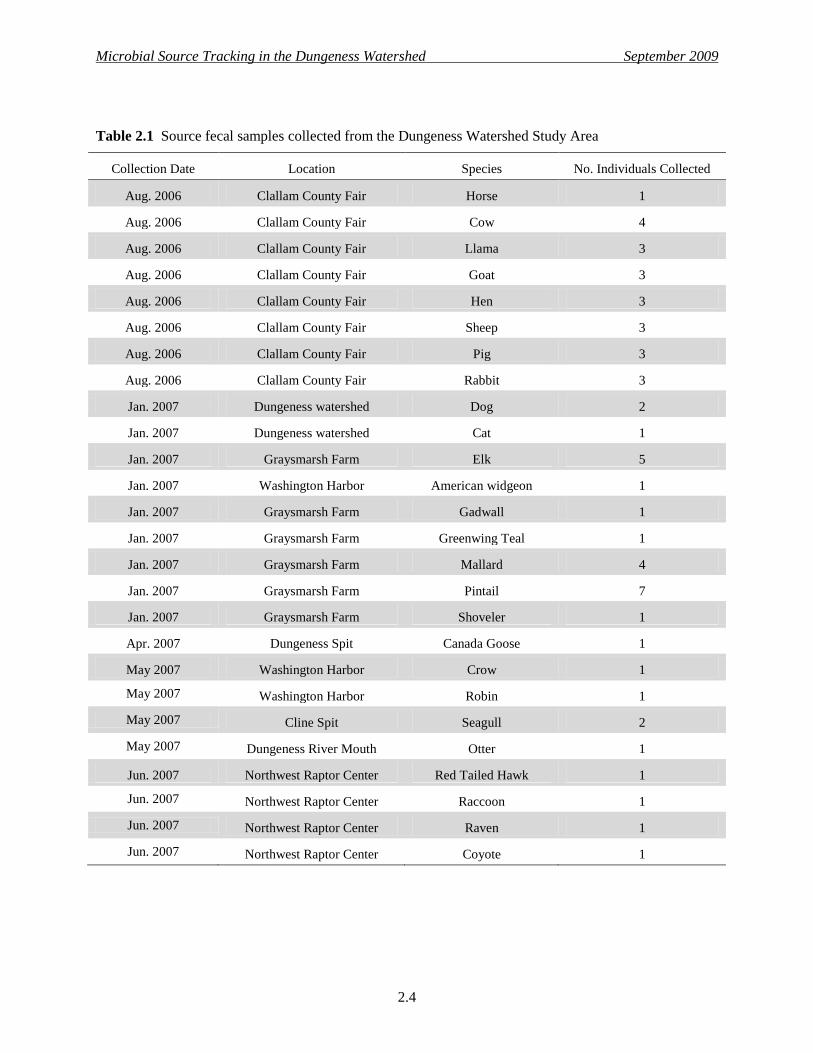
The collection of local source samples began in August 2006 and continued through September 2007,
spanning the general timeframe of the target test sample collections (i.e., water, sediment, wrack/detrital
marine vegetation). We anticipated collecting between 50 and 100 source samples during the study. We
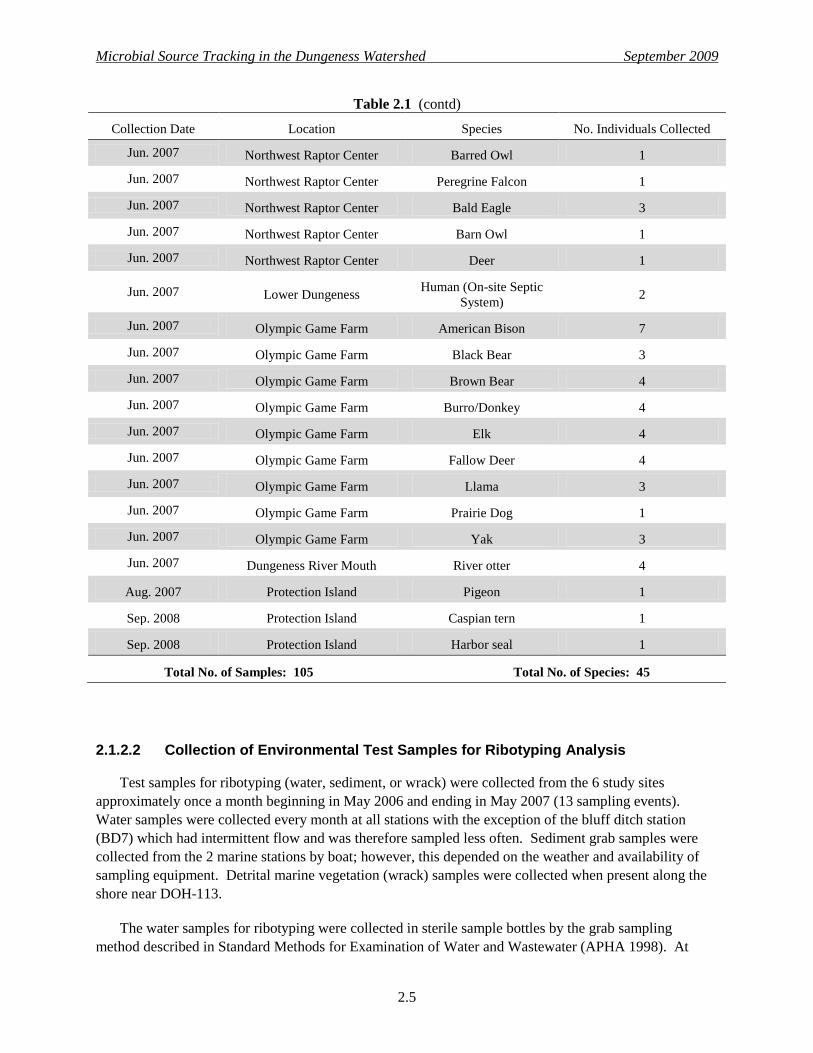
collected a total of 105 samples from 42 local species, representing a variety of host animals and birds
present in the region and spanning the geographic range of the Dungeness watershed, and extending out
to Protection Island. Table 2.1 lists the source samples collected from our study region.
Microbial Source Tracking in the Dungeness Watershed September 2009
2.4
Table 2.1 Source fecal samples collected from the Dungeness Watershed Study Area
Collection Date Location Species No. Individuals Collected
Aug. 2006 Clallam County Fair Horse 1
Aug. 2006 Clallam County Fair Cow 4
Aug. 2006 Clallam County Fair Llama 3
Aug. 2006 Clallam County Fair Goat 3
Aug. 2006 Clallam County Fair Hen 3
Aug. 2006 Clallam County Fair Sheep 3
Aug. 2006 Clallam County Fair Pig 3
Aug. 2006 Clallam County Fair Rabbit 3
Jan. 2007 Dungeness watershed Dog 2
Jan. 2007 Dungeness watershed Cat 1
Jan. 2007 Graysmarsh Farm Elk 5
Jan. 2007 Washington Harbor American widgeon 1
Jan. 2007 Graysmarsh Farm Gadwall 1
Jan. 2007 Graysmarsh Farm Greenwing Teal 1
Jan. 2007 Graysmarsh Farm Mallard 4
Jan. 2007 Graysmarsh Farm Pintail 7
Jan. 2007 Graysmarsh Farm Shoveler 1
Apr. 2007 Dungeness Spit Canada Goose 1
May 2007 Washington Harbor Crow 1
May 2007 Washington Harbor Robin 1
May 2007 Cline Spit Seagull 2
May 2007 Dungeness River Mouth Otter 1
Jun. 2007 Northwest Raptor Center Red Tailed Hawk 1
Jun. 2007 Northwest Raptor Center Raccoon 1
Jun. 2007 Northwest Raptor Center Raven 1
Jun. 2007 Northwest Raptor Center Coyote 1
Microbial Source Tracking in the Dungeness Watershed September 2009
2.5
Table 2.1 (contd)
Collection Date Location Species No. Individuals Collected
Jun. 2007 Northwest Raptor Center Barred Owl 1
Jun. 2007 Northwest Raptor Center Peregrine Falcon 1
Jun. 2007 Northwest Raptor Center Bald Eagle 3
Jun. 2007 Northwest Raptor Center Barn Owl 1
Jun. 2007 Northwest Raptor Center Deer 1
Jun. 2007 Lower Dungeness Human (On-site Septic
System) 2
Jun. 2007 Olympic Game Farm American Bison 7
Jun. 2007 Olympic Game Farm Black Bear 3
Jun. 2007 Olympic Game Farm Brown Bear 4
Jun. 2007 Olympic Game Farm Burro/Donkey 4
Jun. 2007 Olympic Game Farm Elk 4
Jun. 2007 Olympic Game Farm Fallow Deer 4
Jun. 2007 Olympic Game Farm Llama 3
Jun. 2007 Olympic Game Farm Prairie Dog 1
Jun. 2007 Olympic Game Farm Yak 3
Jun. 2007 Dungeness River Mouth River otter 4
Aug. 2007 Protection Island Pigeon 1
Sep. 2008 Protection Island Caspian tern 1
Sep. 2008 Protection Island Harbor seal 1
Total No. of Samples: 105 Total No. of Species: 45
2.1.2.2 Collection of Environmental Test Samples for Ribotyping Analysis
Test samples for ribotyping (water, sediment, or wrack) were collected from the 6 study sites
approximately once a month beginning in May 2006 and ending in May 2007 (13 sampling events).
Water samples were collected every month at all stations with the exception of the bluff ditch station
(BD7) which had intermittent flow and was therefore sampled less often. Sediment grab samples were
collected from the 2 marine stations by boat; however, this depended on the weather and availability of
sampling equipment. Detrital marine vegetation (wrack) samples were collected when present along the
shore near DOH-113.
The water samples for ribotyping were collected in sterile sample bottles by the grab sampling
method described in Standard Methods for Examination of Water and Wastewater (APHA 1998). At

Microbial Source Tracking in the Dungeness Watershed September 2009
2.6
each station, 5 independent grab samples (500 ml or 1 L) were collected approximately 2 minutes apart.
Samples were placed on ice and delivered the same day or shipped via overnight delivery service to the
IEH in accordance with the QAPP guidelines (Battelle 2005).
The surface sediment samples (~ upper 3 cm) were collected by boat at the 2 marine stations using a
clean grab sampler or core sampler. Each sample was homogenized using a sterile spatula and portioned
equally into 5 sterile containers. These were placed on ice and delivered to IEH for ribotyping in
accordance with the QAPP guidelines (Battelle 2005).
Marine detrital wrack samples were collected on 9 dates throughout the course of the study near
station DOH-113. The samples were primarily composed of either detrital Zostera marina (eelgrass) or
Ulva sp. (green algae) that had washed up on shore and were decomposing. Up to 5 independent samples
were collected per sampling event and placed in sterile containers. These were placed on ice and
delivered to IEH for ribotyping analysis in accordance with the QAPP guidelines (Battelle 2005).
2.1.2.3 Collection of Water Samples for Fecal Coliform Analysis
At the time of sample collection for ribotyping analysis, additional surface water grab samples were
collected from the 6 MST sites in sterile sample bottles using the standard grab sampling methods (APHA
1998). These samples were transported on ice to the Clallam County Environmental Health Laboratory
and analyzed for FC concentration within 6 hours of their receipt in accordance with QAPP protocol
(Battelle 2005).
2.1.3 Analytical Methodology
Laboratory analyses were performed per an approved QAPP (Battelle 2005), as described below.
2.1.3.1 E. coli Ribotyping Analysis
Water samples were well homogenized by shaking, then a portion was filtered and tested for FC using
the membrane-filtration method described in Standard Methods for the Examination of Water and
Wastewater (APHA 1998). Typical FC colonies were confirmed as E. coli by purifying on MacConkey
agar and testing for typical indologenesis and the lack of citrate use. E.coli-confirmed isolates were then
ribotyped using the procedure described below. For each water sample collected, the target goal for
ribotyping was a minimum of 2 E. coli isolates. Hence for each sampling event and station, the goal was
10 E. coli isolates (5 samples X 2 E. coli per sample)
Sediment samples were homogenized by stirring them with a sterile tongue blade, then a portion was
weighed and diluted for enrichment in FC selective media. Detrital vegetation samples were weighed and
diluted for homogenization and enrichment in FC selective media. Cultures were tested for typical E. coli
morphology on MacConkey agar. Selected colonies were positively identified as E. coli by biochemical
testing for typical indologenesis and lack of citrate use. These isolates were then ribotyped following the
MST ribotyping procedure. For each independent sample, the goal was selection of at least 2 E. coli
isolates for ribotyping.
Microbial Source Tracking in the Dungeness Watershed September 2009
2.7
Confluent culture growth from E. coli isolates was collected in Tris/EDTA, lysed with sodium
dodecyl sulfate followed by proteinase K, and extracted by phenol-chloroform. The DNA was
precipitated with ethanol, washed and dried, and finally resuspended in distilled water. The extracted
DNA samples were held at -20°C for batching purposes.
The extracted DNA was digested with the restriction endonucleases (EcoR1 and PvuII) for 2 hours at
35°C. The resultant digestion products were separated by agarose gel electrophoresis, then DNA
fragments were transferred for Southern Blotting. Blots were visualized by autoradiograms, and the
resulting patterns recorded in an alphanumeric pattern for comparison to the IEH DNA source library.
2.1.3.2 Fecal Coliform Analysis
Samples were analyzed at the Clallam County Environmental Health Laboratory, an accredited
Washington Department of Ecology laboratory, for FC bacteria using the membrane-filtration method
(Standard Method 9222D; APHA 1998). The resulting data was used to determined effectiveness of the
projects in the Targeted Watershed grant and complemented the information derived from the ribotyping
analysis.
2.1.4 Quality Assurance
All field samples were collected and handled according to procedures outlined in the QAPP (Battelle
2005) including labeling of containers and logging of sample information on field logs. A Chain of
Custody form accompanied all samples shipped or delivered to IEH. All samples were shipped on ice and
were accepted in good condition, according to protocol. Samples were logged in upon arrival at IEH and
given a unique sample number for identification purposes. All methodologies for characterizing E. coli
isolates followed IEH standardized protocols and specified QAPP guidelines for this project (Battelle
2005).
2.2 Phase 2 – Centennial Grant (Bacteroides Target-Specific PCR study)
The sampling stations, field sampling approach, analytical methodology and quality assurance
objectives for the Phase 2 – Centennial Grant (Bacteroides target-specific PCR study) are described
below.
2.2.1 Sampling Stations
The objective of the Phase 2 study was to further define and confirm the results from the Phase 1
study and to expand the number of sites tested in the lower Dungeness watershed and Dungeness Bay.
An alternative MST methodology was used for this phase. This Bacteroides target-specific PCR method
used two biomarkers (human and ruminant), to further define locations of sources that could be
potentially controlled. Sampling locations are shown in Figure 2.2.

Microbial Source Tracking in the Dungeness Watershed September 2009
2.8
2.2.2 Field Sampling Approach
During Phase 2, water samples for target-specific biomarker analysis were collected three times
(twice in December 2008 and once during January 2009). This type of analysis does not require a source
library collection as in Phase 1. To meet contractual obligations, the sampling window was shortened
during this phase. Table 2.2 lists the sample stations, their descriptions, and when they were sampled.
Figure 2.2 Microbial Source Tracking Stations Sampled During the Phase 2 – BacteroidesTarget-
Specific PCR Study

Microbial Source Tracking in the Dungeness Watershed September 2009
2.9
Table 2.2 Stations, locations, and dates of target-specific PCR samples for the Phase 2 sampling.
Sample
Station
Label.
Sampling Event Coordinates
Location Description 12/2/08 12/11/08 01/06/09 Latitude Longitude
DOH 110 48.151167 -123.1535 Dungeness Bay Marine, cond. approved
DOH 111 48.14955 -123.1658 Dungeness Bay Marine, cond. approved
DOH 112 48.147417 -123.1797 Dungeness Bay Marine, cond. approved
DOH 108 48.155483 -123.1528 Dungeness Bay Marine, cond. approved
DOH 109 48.161433 -123.1668 Dungeness Bay Marine, cond approved
DOH 107 48.172233 -123.1452 Dungeness Bay Marine, cond. Approved
DOH 113 48.155267 123.13597 River Mouth Brackish water
DOH 104 48.1534 123.14399 River Mouth Brackish water
DOH 114 48.15665 123.1231 Dung Bay (Outer) Marine water
DOH 103 48.16415 123.1359 Dung. Bay (Outer) Marine water
DOH 102 48.14765 123.104 Jamestown Marine water
DOH 101 48.13944 123.094 Jamestown Marine water
DOH 182 48.15441 123.116 Jamestown Marine water
Seep-1 48.147851 123.171 Inner Bay seeps FW unregulated seep
Seep-2 48.147337 123.172 Inner Bay seeps FW unregulated seep
Seep-3 48.14609 123.178 Inner Bay seeps FW unregulated seep
Seep-4 48.14615 123.17884 Inner Bay seeps FW unregulated seep
Seep-5 48.14611 123.179 Inner Bay seeps FW unregulated seep
Seep-6 48.14603 123.180 Inner Bay seeps FW unregulated seep
CAS 48.12659 123.1000 Casselary Creek Casselary Crk at Jamestown
Rd
CC 48.13754 123.10128 Cooper Creek at the end of 3 Crabs Rd.
MC 0.3 48.150946 -123.122 Meadowbrook Crk at
3 Crabs
Mixed ag., residential,
wetland
GSS 48.141508 -123.1071 Golden Sands Slough
off 3 Crab
Residential and vacation
home-sites
MAT 0.1 48.13826 -123.1388 Matriotti Crk, at Game
Farm
Exotic animal farm, ag.,
residential
DUN 0.2 48.148353 -123.1263 Dungeness R. mouth Mixed ag. and residential
DUN 0.05 48.152388 -123.1292 Dungeness R. Mouth Mixed ag. and residential
MS 0.3 48.147637 -123.1252 Meadowbrook Slough Upper reach – residential
MC 2.0 48.139911 -123.1226 Meadowbrook Creek Mixed ag. and residential
MC 1.75t 48.140171 -123.1225 Meadowbrook trib. roadside ditch, primarily ag
BD 3 48.149374 -123.1614 Bluff Ditch-3 Thornton and Marine Drive
– resid. area.
- Denotes the station was sampled for PCR analysis.
Microbial Source Tracking in the Dungeness Watershed September 2009
2.10
2.2.2.1 Collection of Samples for Target-Specific PCR Analysis
Following the QAPP protocol (Battelle and EPA 2008), surface water samples were collected using a
sampling wand or hand dipping following Standard Methods 9060A and 9060B (APHA 1998)
procedures. Sterile pre-cleaned 250 ml containers were supplied by EPA Manchester Laboratory. Marine
stations were sampled by boat. All other stations were sampled from shore. Seep samples were collected
at the base of the bluff along inner Dungeness Bay. Care was taken to only sample freely flowing water
and not contact the bluff sediment. Samples were collected on December 2, 2008 (10 marine stations, 6
seep stations), December 12, 2008 (9 freshwater stations), and January 6, 2009 (5 marine stations, 11
freshwater stations) (Table 2.2, Figure 2.2). Fourteen of these stations were sampled on two of the three
dates. Samples were placed on ice and delivered to the EPA Manchester Laboratory on the same day they
were collected. A temperature control was included in each transported cooler.
2.2.2.2 Collection of Water Samples for Fecal Coliform Analysis
At the time of sample collection for PCR analysis, additional surface water grab samples for FC
analysis were collected in sterile containers from each site in the same manner as described above
following the standard protocol (APHA 1998). The samples were transported on ice to the Clallam
County Environmental Health Laboratory and analyzed for FC concentration within 6 hour of their
receipt according to QAPP protocol (Battelle and USEPA 2008).
2.2.2.3 Collection of Total Suspended Sediment Samples
At each site, 500 ml of water was collected for analysis of total suspended sediments (TSS). These
samples were collected from each station during all events. Samples were kept cold and transported to
the Battelle Marine Sciences Laboratory for analysis. All TSS samples were collected after PCR and FC
samples were taken, and care was taken to avoid disturbing the sample site or artificially creating turbid
conditions. Salinity was measured at marine sites using a handheld refractometer. Temperature was
measured at all sites.
2.2.3 Analytical Methodology
The laboratory methodology for the Phase 2 Bacteroides target-specific study is described below.
2.2.3.1 Target-Specific PCR Analysis
A Bacteroides target-specific polymerase chain reaction methodology (Field et al. 2003, Dick et al.
2005) was used to analyze all water samples from the Phase 2 study. The USEPA Manchester Laboratory
followed procedures developed by the USEPA Office of Research and Development for the DNA
extraction, PCR and gel electrophoresis. Human primers (HF183 and HF134) and ruminant primers
(CF193 and CF128) were used for this study. The procedures are referenced in the QAPP (Battelle and
USEPA 2008) and outlined below based on a Final Data Report Memorandum (USEPA 2009):
Sample filtration within 8 hours of sample collection
Filter placed in sterile tube; preservative added and frozen at -20°C
DNA extraction/purification performed using FastDNA® kit

Microbial Source Tracking in the Dungeness Watershed September 2009
2.11
Test each sample for the presence of the appropriate DNA target using master mix and primer sets
specific to DNA segments associated with Bacteroides (general), human Bacteroides and ruminant
Bacteroides. Five primer sets were utilized: 1 general, 2 human sets and 2 ruminant sets of target
DNA sequences.
Visualization of amplified DNA product using gel electrophoresis and ultraviolet trans-
illumination. A sample was considered negative for the presence of Bacteroides if all five
concentrations of the DNA extract from the sample (processed from previous steps) provided
negative results. If at least one of the five concentrations of the DNA extract produced a positive
result with one or both of the Bacteroides human primer sets, the sample was considered to be
positive for human fecal contamination. If at least one of the five concentrations of the DNA
extract produced a positive result with one or both of the Bacteroides ruminant primer sets, the
sample was considered to be positive for ruminant fecal contamination.
2.2.3.2 Fecal Coliform Analysis
Water samples collected for FC analysis during December 2008 were analyzed at the Clallam County
Environmental Health Laboratory using the membrane filtration method, (ASTM 9222D, APHA 1998).
Samples collected during the January 2009 event were analyzed by Twiss Analytical, Inc. in Poulsbo,
Washington, using the membrane-filtration method. In addition to using these data to better understand
the overall concentrations of FC at a site, the data were used as a screening tool for PCR analysis. The
initial target cutoff of 14 CFU/100 ml, below which PCR analysis would not be done, was modified
during this study to include all samples (see results section).
2.2.3.3 Total Suspended Sediment Analysis
Total suspended sediment concentration was determined for all water samples at the Battelle Marine
Sciences Laboratory based on the Standard Methods 2540C (APHA 1998) protocol for TSS.
Approximately 500 ml of sample water was filtered through pre-tared Whatman GF/F filters. Filters were
dried and weighed to obtain a concentration of sediment (mg/l).
2.2.4 Quality Assurance/Quality Control
All field samples were collected and handled according to procedures outlined in the QAPP (Battelle
and USEPA 2008) including labeling of containers and logging of sample information on field logs. A
Chain of Custody form accompanied all samples sent or delivered to respective laboratories. A
temperature control sample accompanied samples delivered to the USEPA Manchester Lab. All samples
were accepted with temperature controls below 10°C at the time of sample delivery. To ensure the use of
the proper aseptic technique during sampling, a transfer blank was included in the delivery of samples to
USEPA Manchester. To assess method accuracy, two ―blind‖ water samples labeled as Source #1 and
Source #2, containing fecal material from sources known only to the collector, were submitted to the
Manchester laboratory.
In accordance with guidelines presented in the QAPP (Battelle and USEPA 2008), the following
quality control activities were conducted during the PCR laboratory analysis: filtration controls, PCR
amplification controls (positive and negative), replicate analysis (analyst and method precision), method
accuracy (blind sample control), and specificity.

Microbial Source Tracking in the Dungeness Watershed September 2009
2.12
2.3 Data Analysis
The Phase 1 – ribotyping E. coli test samples were analyzed based on the proportion of total isolates
typed. As such the data needs to be viewed qualitatively, with an understanding that the study was
designed to determine what the predominant sources of fecal pollution were in the Dungeness watershed.
It was not designed to quantify fecal loading of the sources. Sources were categorized into functional
groups with similar characteristics (e.g., domestic animals) and proportions of isolates were analyzed
based on sampling station and date. Non-parametric statistical tests were used to examine associations of
source groups between stations, dates and sample types. Regression analysis was used to evaluate
whether proportions were generally increasing or decreasing through time, and to compare proportions
between the wet (October through March) and dry (April through September) seasons. The data was also
examined based on frequency of occurrence during the 13 sampling events for a given functional group.
The Phase 2 - Bacteroides data were also presented as a proportion of matches based on the total
samples analyzed. This included the proportion of samples that contained Bacteroides, the proportion of
samples containing at least 1 human biomarker and the proportion of samples containing at least 1
ruminant marker. Although differences were noted between sample events, the data were not evaluated
statistically due to the small number of samples collected over time.

Microbial Source Tracking in the Dungeness Watershed September 2009
3.1
3.0 Results
The results from each phase of the study are presented separately. Phase 1 results discuss the EPA
Targeted Watershed ribotyping study. Phase 2 results discuss the Department of Ecology Centennial
Bacteroides target-specific PCR study.
3.1 Phase 1 – Ribotyping
The Phase 1 – ribotyping E. coli test samples were analyzed based on the proportion of total isolates
typed. As such the data needs to be viewed qualitatively, with an understanding that the study was
designed to determine what the predominant sources of fecal pollution were in the Dungeness watershed.
It was not designed to quantify fecal loading of the sources.
As discussed in the introduction, the ribotyping approach used in this study is based on matching the
genetic fingerprint of E. coli bacteria strains isolated from environmental samples (e.g. water, sediment
and wrack) to E. coli from fecal samples of known host source species. The DNA library-based approach
is dependent on having an extensive library of E. coli ribotypes from strains that were isolated from the
feces of known host species. The IEH E. coli DNA library contains over 120,000 isolates and included
the addition of local source samples from 45 animal and bird species in the Dungeness watershed (Table
2.1). We analyzed the data in several different ways including:
Number of isolates by source type
Frequency of occurrence of source type
Compositing of sources into functional groupings
Temporal trends
Human-derived source patterns
While this data was examined in several ways, it should be viewed overall as a qualitative
characterization of the E. coli sources in the watershed. Because MST methodologies are still evolving,
there are a number of assumptions and limitations inherent in these techniques. For this study in
particular, it should be noted that while a known number of E.coli isolates were typed for each given
sampling event (e.g. usually 10 to 15 isolates), it was not necessarily representative of the entire
population of E. coli bacteria in a particular sample which could be range widely from sample to sample
(e.g. several orders of magnitude).

Microbial Source Tracking in the Dungeness Watershed September 2009
3.2
3.1.1 Source types found
During the Phase 1 study a total of 472 environmental samples were collected (e.g. water, sediment,
wrack) and 1164 E. coli isolates were ribotyped. Table 3.1 includes the number of isolates that were
typed from each date and sample location. The target number of samples for each event was 5. These
targets were met for all marine and freshwater sampling events, with the exception of the irrigation ditch
station (BD-7) which was dry on occasion. Marine sediment and wrack were more difficult to collect,
and wrack was not always present along the shoreline.
Table 3.1 Sample inventory by station and event from Phase 1 including number of environmental
samples collected and number of isolates typed by IEH from each sampling event shown in
parentheses ( ).
Location Freshwater Marine Water Marine Sediment
Wrack
(Marine
Vegetation)
DATE MAT 0.1 BD-7 MC 0.3 GSS DOH-
108 DOH-113 DOH-108 DOH-113 DOH-113
5/18/2006 5 (16) 5 (16) 5 (15) 5 (16) 5 (1) 5 (15) 0 0 0
6/21/2006 5 (16) 0 5 (10) 5 (1) 5 5 (2) 5 (21) 5 (26) 5 (12)
7/6/2006 5 (15) 5 (16) 5 (16) 5 (16) 5 (5) 5 (15) 0 5 5 (2)
8/29/2006 5 (16) 5 (16) 5 (16) 5 (16) 5 (1) 5 (15) 0 0 5
9/12/2006 5 (16) 5 (16) 5 (15) 5 (16) 5 (15) 5 (4) 5 (10) 0 5
10/30/2006 5 (15) 0 5 (16) 5 (16) 5 (7) 5 (10) 1 1 5
11/20/2006 5 (16) 0 5 (16) 5 (15) 5 (16) 5 (15) 0 1 5
12/4/2006 5 (16) 5 (14) 5 (15) 5 (16) 5 (16) 5 (15) 0 0 5
1/23/2007 5 (16) 5 (15) 5 (16) 5 (16) 5 (16) 5 (15) 2 (10) 2 0
2/8/2007 5 (16) 5 (15) 5 (16) 5 (16) 5 (16) 5 (16) 5 (26) 5 (21) 0
3/13/2007 5 (15) 5 (16) 5 (16) 5 (16) 5 (8) 5 (16) 5 (12) 5 (13) 4
4/23/2007 5 (16) 0 5 (16) 5 (15) 5 (6) 5 (15) 5 (7) 5 (4) 1
5/22/2007 5 (16) 0 5 (16) 5 (16) 5 (1) 5 (4) 5 (9) 5 (7) 0
Total 65 (205) 40 (124) 65 (199) 65 (191) 65 (108) 65 (157) 33 (95) 34 (71) 40 (14)
Of the 1164 isolates typed, matches were made for 1078 (92.6%) of the isolates; only 7.4% of the
isolates were not matched to any known source (fingerprint) in the IEH library, or were sourced to
multiple species (referred to as transient). The transients and unknowns were not distinguished from each
other in the database and are referred to as a source category called unknown in our study. Detrital wrack
samples had the lowest percent match to the source library at 78%, while marine sediments at station
DOH-108 had the highest percent match at 100%. The percent match for other stations and sample types
ranged between 91 and 96% (Table 3.2).

Microbial Source Tracking in the Dungeness Watershed September 2009
3.3
Table 3.2 Number of unidentified isolates and percent match from each station and matrix type.
Station
Matrix Total No. of Isolates No. of Unidentified
Isolates % Match
BD-7 water 124 6 95%
MAT 0.1 water 205 10 95%
MC 0.3 water 199 22 90%
GSS water 191 21 90%
DOH 113 water 157 10 94%
DOH 113 sediment 71 7 91%
DOH 108 water 108 5 96%
DOH 108 sediment 95 0 100%
DOH 113 wrack 14 4 78%
There were 37 source types that were identified overall during the study. The complete list is shown
in Table 3.3 with the number of isolates matched for each source from each station. While most source
types are self explanatory, several categories need further explanation. Each source type has a unique set
of genetic ribotypes or pattern identifiers (fingerprints) which are not shared between source types. For
example, the source type avian has a fingerprint that is inclusive, and shared by all avians (birds) in that
category, whereas a Canada goose source type, for example, contains a fingerprint that is exclusive only
to Canada geese. Canine refers to a composite group made up of dogs, coyotes, and wolves that share a
similar pattern, while dog refers to domestic dog. Feline is a composite of cats, cougars, bobcats, etc….
Bovine refers to a diverse set of medium to large-sized ungulates including domestic cattle, bison and
yak. Marine mammal includes sea lions, seals, and otters. Several source types were linked to human-
related sources including human, septage, and sewage. Human refers to a match with human fecal
material. Septage refers to isolates matched to septic tank waste, and sewage refers to isolates matched
from a wastewater treatment plant. For the purposes of our analysis, we have combined these three
source types into a category called ―human-derived‖.
Of the 1078 isolates that were matched to the overall source library at IEH, 5.1% (55 matches) were
matched directly to the local Dungeness source library listed in Table 2.1. The identified samples that
were matched to sources in our local database include waterfowl, bison, yak, llama, goat, deer, elk,
human, prairie dog, river otter, raccoon, canine, sheep, and bear. Some of these matches included exotic
species that were sampled at the Game Farm. All local source types were matched to samples collected at
freshwater stations with the following exceptions; waterfowl was found in marine water and sediment in
addition to freshwater, and bison was found only in marine sediment. Goat and river otter were found
only in marine water, and raccoon was found in marine and freshwater.
Figure 3.1 shows the total distribution of isolates that were matched to the IEH database including our
local contributions. Based on the proportion of total isolates typed, the predominant sources identified in
our study area were, in ranked decreasing order, avian (19.6%), gull (12.5%), waterfowl (9.7%), raccoon
(9.2%), unknown (7.3%), human-derived (7.1%), rodent (6.3%) and dog (4.3%).

Microbial Source Tracking in the Dungeness Watershed September 2009
3.4
Table 3.3 Number of isolates by source type, station and matrix (e.g. freshwater, marine water, sediment,
wrack)
Source
Types
Total No. of
Isolates
Freshwater Marine Water Marine Sediment
MAT0.1 MC0.3 GSS BD-7 St 113-
water
St 108-
water
St 113-
sed
St 108-
sed.
wrack
avian 228 34 26 39 24 48 21 12 22 2
bear 10 6 1 1 1 1
beaver 16 1 4 11
bison 7 1 1 5
bovine 34 13 6 3 5 5 1 1
burro 1 1
canine 18 3 2 3 6 3 1
chicken 3 3
crow 2 1 1
deer 33 7 2 8 3 3 2 3 3 2
deer/elk 15 3 2 10
dog 50 12 8 8 9 4 3 6
elk 32 3 12 2 5 2 3 5
equine 2 1 1
feline 18 3 8 2 5
goat 11 1 4 1 1 1 3
goose 1 1
gull 146 23 30 19 13 22 20 5 14
horse 20 5 2 3 6 1 3
human-
derived 83 16 15 5 19 8 9 11
llama 4 2 1 1
marine
mammal 16 2 7 6 1
otter 8 3 2 1 2
oyster 6 1 5
pig 1 1
porcine 3 1 1 1
prairie dog 2 1 1
rabbit 3 1 1 1
raccoon 107 19 21 14 21 8 5 9 10
rodent 73 22 13 7 8 7 8 6 2
sheep 2 2
swine 1 1
unknown 85 10 22 21 6 10 5 8 4
waterfowl 113 15 21 30 3 15 7 13 9
yak 9 4 2 3

Microbial Source Tracking in the Dungeness Watershed September 2009
3.5
Number of Isolates
0 50 100 150 200 250
Sourc
e
burro
goose
pig
swine
equine
crow
prairie dog
sheep
chicken
porcine
rabbit
llama
oyster
bison
river otter
yak
bear
goat
deer/elk
beaver
marine mammal
canine
feline
horse
elk
deer
bovine
dog
rodent
human-derived
unknown
raccoon
waterfowl
gull
avian
total no. of isolates = 11641
2
3
9
16
33
86
228
1
1
1
2
2
2
3
3
4
6
7
8
10
11
15
16
18
18
20
32
34
50
73
83
107
146
113
Figure 3.1 Distribution of total number of isolates from all stations based on source type.

Microbial Source Tracking in the Dungeness Watershed September 2009
3.6
3.1.2 Analysis by Functional Groups
To further analyze the data, we organized the source types into functional groups or guilds, in order to
more easily assess the overall contributions. Table 3.4 represents the functional groups that were
developed and the source types that make up those groups. These functional groups best represent the
issues being addressed in the Dungeness watershed, and to a certain extent reflect groupings of sources
that could be controlled (i.e. farm animals, domestic animals, game farm animals, and human) and those
that are more difficult to control (i.e. birds and wild mammals). In some instances one source type could
arguably fit into several functional groupings. For example the source type feline could fit into wild
mammal, domestic animal or game farm functional groups, and the source type deer could fit into the
wild mammal or game farm functional grouping. The grouping for the Game Farm includes source types
that were found that had a reasonably high likelihood of only occurring from the Olympic Game Farm,
located just upstream from MAT0.1.
Table 3.4 List of source types assigned to functional groups
Birds Wild Mammals Farm
Animals
Domestic
Animals
Game Farm Human Other Unknown
avian
crow
beaver
deer
bovine
chicken
canine
dog
bear
bison
human
septage
oyster unidentified
or transient
goose deer/elk equine feline burro sewage
gull
waterfowl
elk
marine mammal
river otter
rabbit
raccoon
rodent
horse
llama
pig
porcine
sheep
swine
goat
cat prairie dog
yak
When the data are analyzed by functional group, the highest occurring proportion of isolates was
birds (42%) present as 490 out of 1164 isolates (Figure 3.2), followed by wild mammals, present as 303
out of 1164 isolates (26%). Domestic animal, human-derived, farm animal, and unknown sources had
similar proportions, about 7% each. The game farm proportion of isolates was 2.5%.
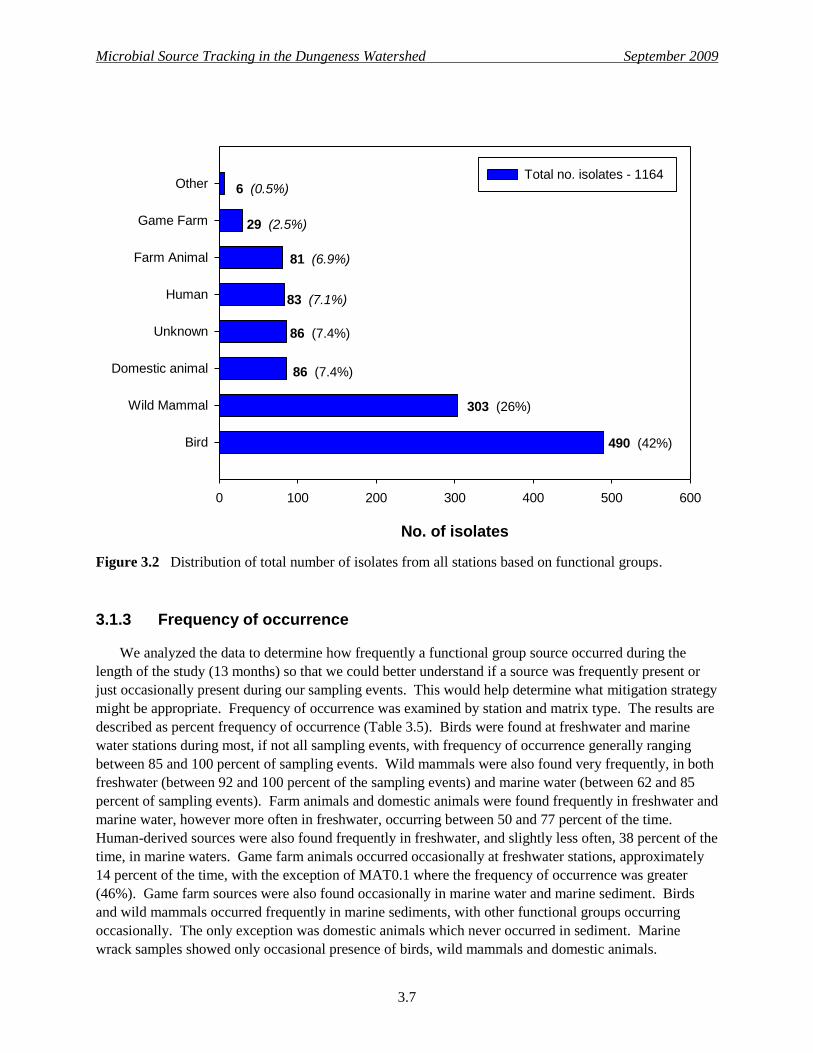
Microbial Source Tracking in the Dungeness Watershed September 2009
3.7
No. of isolates
0 100 200 300 400 500 600
Other
Game Farm
Farm Animal
Human
Unknown
Domestic animal
Wild Mammal
Bird
Total no. isolates - 1164 6 (0.5%)
86 (7.4%)
303 (26%)
490 (42%)
81 (6.9%)
83 (7.1%)
29 (2.5%)
86 (7.4%)
Figure 3.2 Distribution of total number of isolates from all stations based on functional groups.
3.1.3 Frequency of occurrence
We analyzed the data to determine how frequently a functional group source occurred during the
length of the study (13 months) so that we could better understand if a source was frequently present or
just occasionally present during our sampling events. This would help determine what mitigation strategy
might be appropriate. Frequency of occurrence was examined by station and matrix type. The results are
described as percent frequency of occurrence (Table 3.5). Birds were found at freshwater and marine
water stations during most, if not all sampling events, with frequency of occurrence generally ranging
between 85 and 100 percent of sampling events. Wild mammals were also found very frequently, in both
freshwater (between 92 and 100 percent of the sampling events) and marine water (between 62 and 85
percent of sampling events). Farm animals and domestic animals were found frequently in freshwater and
marine water, however more often in freshwater, occurring between 50 and 77 percent of the time.
Human-derived sources were also found frequently in freshwater, and slightly less often, 38 percent of the
time, in marine waters. Game farm animals occurred occasionally at freshwater stations, approximately
14 percent of the time, with the exception of MAT0.1 where the frequency of occurrence was greater
(46%). Game farm sources were also found occasionally in marine water and marine sediment. Birds
and wild mammals occurred frequently in marine sediments, with other functional groups occurring
occasionally. The only exception was domestic animals which never occurred in sediment. Marine
wrack samples showed only occasional presence of birds, wild mammals and domestic animals.
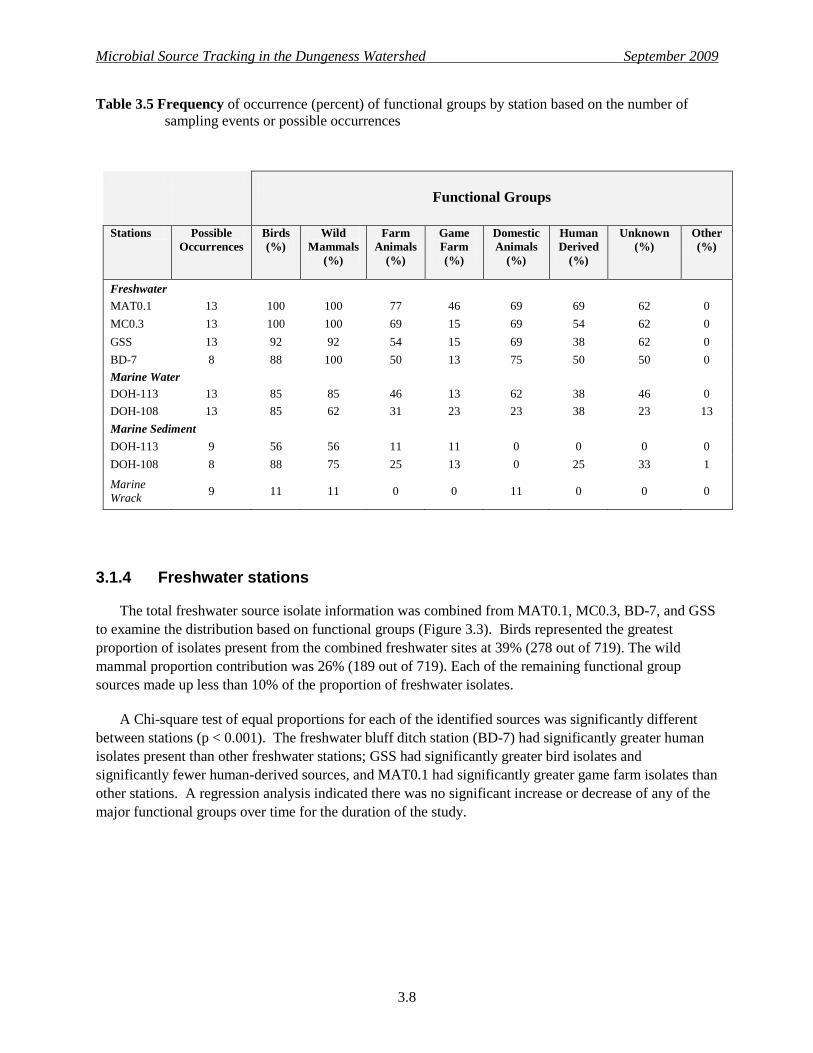
Microbial Source Tracking in the Dungeness Watershed September 2009
3.8
Table 3.5 Frequency of occurrence (percent) of functional groups by station based on the number of
sampling events or possible occurrences
Functional Groups
Stations Possible
Occurrences
Birds
(%)
Wild
Mammals
(%)
Farm
Animals
(%)
Game
Farm
(%)
Domestic
Animals
(%)
Human
Derived
(%)
Unknown
(%)
Other
(%)
Freshwater
MAT0.1 13 100 100 77 46 69 69 62 0
MC0.3 13 100 100 69 15 69 54 62 0
GSS 13 92 92 54 15 69 38 62 0
BD-7 8 88 100 50 13 75 50 50 0
Marine Water
DOH-113 13 85 85 46 13 62 38 46 0
DOH-108 13 85 62 31 23 23 38 23 13
Marine Sediment
DOH-113 9 56 56 11 11 0 0 0 0
DOH-108 8 88 75 25 13 0 25 33 1
Marine
Wrack 9 11 11 0 0 11 0 0 0
3.1.4 Freshwater stations
The total freshwater source isolate information was combined from MAT0.1, MC0.3, BD-7, and GSS
to examine the distribution based on functional groups (Figure 3.3). Birds represented the greatest
proportion of isolates present from the combined freshwater sites at 39% (278 out of 719). The wild
mammal proportion contribution was 26% (189 out of 719). Each of the remaining functional group
sources made up less than 10% of the proportion of freshwater isolates.
A Chi-square test of equal proportions for each of the identified sources was significantly different
between stations (p < 0.001). The freshwater bluff ditch station (BD-7) had significantly greater human
isolates present than other freshwater stations; GSS had significantly greater bird isolates and
significantly fewer human-derived sources, and MAT0.1 had significantly greater game farm isolates than
other stations. A regression analysis indicated there was no significant increase or decrease of any of the
major functional groups over time for the duration of the study.

Microbial Source Tracking in the Dungeness Watershed September 2009
3.9
No. of isolates
0 50 100 150 200 250 300 350
Fre
shw
ater
Other
Game Farm
Human
Farm Animal
Unknown
Domestic animal
Wild Mammal
Bird
0
17 (2.4%)
55 (7.6%)
Total freshwater isolates - 719
57 (7.9%)
59 (8.2%)
64 (8.9%)
189 (26%)
278 (39%)
Figure 3.3 Distribution of the total number of isolates from freshwater stations based on functional
groups.
3.1.5 Marine water stations
The marine water station isolate information was combined (DOH-113 and DOH-108) to examine the
distribution by functional groups (Figure 3.4). Again, the greatest proportion of isolates present from the
two marine water stations was bird, at 51% (135 out of 265). The wild mammal proportion was 23% (60
out of 265). All other functional group sources were each less than 10% of the proportion of marine
isolates.
The proportion of bird isolates was significantly greater than any other functional group at the marine
water sites. There was no significant increase or decrease of bird isolates over the duration of the study
(p>0.92). The proportion of wild mammal isolates increased the most over this timeframe (p=0.17) and
the proportion of farm animal isolates decreased the most over this timeframe (p=0.06), however both
were highly variable.

Microbial Source Tracking in the Dungeness Watershed September 2009
3.10
No. of isolates
0 50 100 150 200 250 300
Mari
ne W
ate
r
Other
Game Farm
Farm Animal
Unknown
Domestic animal
Human
Wild Mammal
Bird
1 (0.4%)
6 (2.3%)
15 (5.7%)
Total marine water isolates - 265
15 (5.7%)
16 (6.0%)
17 (6.4%)
60 (22.6%)
135 (51%)
Figure 3.4 Distribution of the total number of isolates from marine water stations based on functional
groups.
3.1.6 Marine sediment and wrack stations
The two marine sediment station isolates were combined (DOH-113 and DOH-108) to examine the
distribution by functional groups (Figure 3.5). The greatest proportion of isolates present was from birds
at 45% (75 out of 166). The proportion of isolates for wild mammals was 31%. All other groups were
less than 10%. Functional group sources did not significantly increase or decrease over time.
Detrital marine vegetation or wrack was collected when present on shore closest to station DOH-113.
It was found during 9 out of 13 sampling events (Table 3.2). However on only two of these events were
E.coli detected, isolated and typed. Of the 14 isolates, 4 were typed as unknown, two as deer/elk and six
as dog. Because so few E.coli were isolated, this data was not analyzed further.
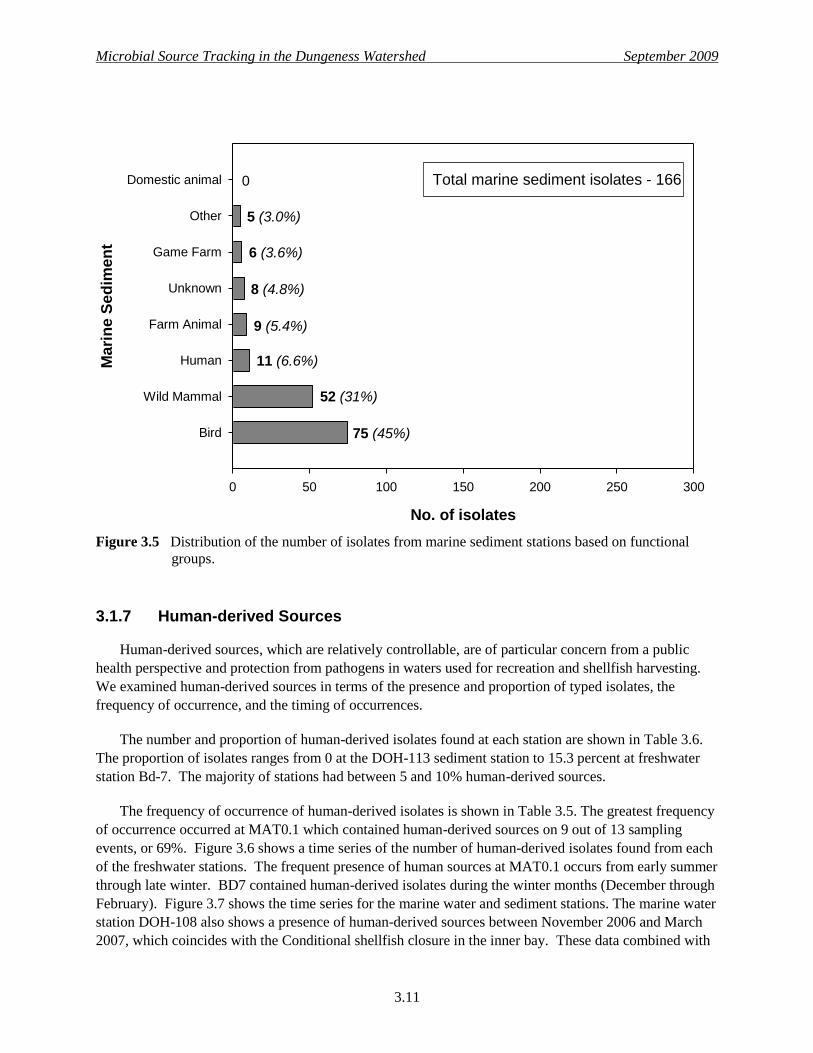
Microbial Source Tracking in the Dungeness Watershed September 2009
3.11
No. of isolates
0 50 100 150 200 250 300
Mari
ne S
ed
imen
t
Domestic animal
Other
Game Farm
Unknown
Farm Animal
Human
Wild Mammal
Bird
Total marine sediment isolates - 166 0
9 (5.4%)
8 (4.8%)
6 (3.6%)
52 (31%)
11 (6.6%)
5 (3.0%)
75 (45%)
Figure 3.5 Distribution of the number of isolates from marine sediment stations based on functional
groups.
3.1.7 Human-derived Sources
Human-derived sources, which are relatively controllable, are of particular concern from a public
health perspective and protection from pathogens in waters used for recreation and shellfish harvesting.
We examined human-derived sources in terms of the presence and proportion of typed isolates, the
frequency of occurrence, and the timing of occurrences.
The number and proportion of human-derived isolates found at each station are shown in Table 3.6.
The proportion of isolates ranges from 0 at the DOH-113 sediment station to 15.3 percent at freshwater
station Bd-7. The majority of stations had between 5 and 10% human-derived sources.
The frequency of occurrence of human-derived isolates is shown in Table 3.5. The greatest frequency
of occurrence occurred at MAT0.1 which contained human-derived sources on 9 out of 13 sampling
events, or 69%. Figure 3.6 shows a time series of the number of human-derived isolates found from each
of the freshwater stations. The frequent presence of human sources at MAT0.1 occurs from early summer
through late winter. BD7 contained human-derived isolates during the winter months (December through
February). Figure 3.7 shows the time series for the marine water and sediment stations. The marine water
station DOH-108 also shows a presence of human-derived sources between November 2006 and March
2007, which coincides with the Conditional shellfish closure in the inner bay. These data combined with

Microbial Source Tracking in the Dungeness Watershed September 2009
3.12
the target-specific PCR data for presence of a human bio-marker (Section 3.2) provide a clearer picture of
the influence of human sources in the Dungeness watershed, both from a temporal as well as spatial
perspective.
Table 3.6 Number and proportion of human-derived isolates found at each station over the duration of
the study.
Stations No. of Human-derived Isolates
Typed
Total No. of Isolates
Typed
Proportion of Human-derived
Isolates
Freshwater
MAT0.1 16 205 7.8%
MC0.3 15 199 7.5%
BD-7 19 124 15.3%
GSS 5 191 2.6%
Marine Water
DOH-113 8 157 5.1%
DOH-108 9 108 8.3%
Marine
Sediment
DOH-113 0 71 0
DOH-118 11 95 11.6%
Marine Wrack 0 14 0

Microbial Source Tracking in the Dungeness Watershed September 2009
3.13
MAT0.1
0
2
4
6
8
10
MC0.3
0
2
4
6
8
10
BD-7
0
2
4
6
8
10
* * * * *GSS
May Jun Jul Aug Sep Oct Nov Dec Jan Feb Mar Apr May
No. of is
ola
tes
0
2
4
6
8
10
* Not Sampled, ditch dry
Figure 3.6 Human-derived source isolates combined (human, septage, sewage) between May 2006 and
May 2007 for each freshwater station.

Microbial Source Tracking in the Dungeness Watershed September 2009
3.14
DOH 113Water
0
2
4
6
8
10
DOH 108Water
No. of is
ola
tes
0
2
4
6
8
10
DOH 113Sediment
0
2
4
6
8
10
* * * * *
May Jun Jul Aug Sep Oct Nov Dec Jan Feb Mar Apr May
0
2
4
6
8
10
* * * *
* Date Not Sampled
Date Not Sampled
*DOH 108Sediment
Figure 3.7 Human-derived source isolates between May 2006 and May 2007 for the two marine water
stations (upper graphs) and the two sediment stations (lower graphs).

Microbial Source Tracking in the Dungeness Watershed September 2009
3.15
3.2 Phase 2 – Bacteroides Target-specific PCR
The target-specific PCR method used in the Phase 2 study is based on amplifying known DNA probes
or markers from Bacteroides bacteria found in the gut of warm-blooded animals and matching those with
Bacteroides DNA markers found in water samples. The two markers available for this study targeted
human and ruminant. This approach did not require the development of a source library as in Phase 1 or
require the culture of the indicator bacteria, E. coli, except as a screening tool.
This phase was a follow-up to Phase 1 and involved fewer sampling events, however a total of 27
stations were sampled during the three sampling events. Samples were collected on December 2, 2008
(10 marine stations, 6 seep stations), Dec. 12, 2008 (10 freshwater stations), and January 6, 2009 (5
marine stations, 11 freshwater stations) (Table 2.2, Figure 2.2). Sampling occurred at 14 of the 27
stations on at least 2 of the 3 dates, including a majority of the marine sites and some Phase 1 freshwater
sampling stations.
3.2.1 Analysis of human and ruminant biomarkers
The species-specific primer sets that were used in this study were restricted to the identification of
human and ruminant sources. The presence of general Bacteroides in a sample, combined with the
absence of both human and ruminant target DNA in a sample indicated that the fecal contamination
present was neither human nor ruminant, but was associated with another species of animal. The
presence of general Bacteroides target DNA in a sample and the presence of the human target DNA
indicated that the fecal contamination was human. Similarly, the presence of general Bacteroides target
DNA in a sample and the presence of the ruminant target DNA indicated that the fecal contamination was
from ruminant sources.
Table 3.7 provides the summary results of the PCR analysis for the human and ruminant primer sets
presented by sampling date and sample station. The Bacteroides screening test or ―Bacteroides present‖
column in the table indicates whether the presence of general Bacteroides was found in the sample. The
columns for ―human‖ and ―ruminant‖ indicate whether the target DNA was present in the sample. The
―other‖ column is checked if general Bacteroides was present but no human or ruminant DNA was
present, meaning the presence of fecal contamination from a source other than human or ruminant.
A total of 42 samples were collected, not including blind or quality control samples, during three
sampling events. Overall there were relatively few samples that were identified as a ruminant or human
source. Twenty samples tested negative for the Bacteroides screening test (48%), and 17 samples (40%)
contained the general Bacteroides-only marker indicating a source other than human or ruminant were
present (Table 3.7 ―Other‖).
Two out of 42 samples (4.7%) were identified as ruminant-only from the study. One of these samples
was from a seep site (S-8) collected on Dec. 2, 1008, while the second sample was from Cooper Creek
(Station CC) collected during the last event, Jan. 6, 2009. One sample from Casselary Creek (Station
CAS) tested positive for human and ruminant sources and was collected during the last event. Two
additional samples tested positive for human-only. These samples were collected during the last event
from MS0.3 and MC0.2. The majority of samples with an identified human or ruminant source were
collected during the January 2009 sampling event.

Microbial Source Tracking in the Dungeness Watershed September 2009
3.16
Table 3.7 Summary of Phase 2 analysis of FC concentration, total suspended sediments, salinity and
target-specific PCR analysis for presence of Bacteroides human and ruminant biomarkers.
Sampling
Date
Sample
Station ID
Fecal
Coliform
(CFU/100
mL)
TSS
(mg/L)
Salinity
(psu)
Bacteroides PCR
Bacteroides
Present
Human Ruminant Other
12/2/2008 DOH-114 4 8.81 29 No --- --- ---
12/2/2008 DOH-113 12 5.53 31 No --- --- ---
12/2/2008 DOH-103 2 7.22 32 No --- --- ---
12/2/2008 DOH-104 20 7.18 31 No --- --- ---
12/2/2008 DOH-107 <2 6.82 32 No --- --- ---
12/2/2008 DOH-108 12 7.79 32 No --- --- ---
12/2/2008 DOH-109 8 6.37 31 No --- --- ---
12/2/2008 DOH-110 32 7.83 31 No --- --- ---
12/2/2008 DOH-111 10 9.04 31 Yes --- ---
12/2/2008 DOH-112 18 7.83 31 Yes --- ---
12/2/2008 S-3 <2 26.5 NM No --- --- ---
12/2/2008 S-4 8 38.9 NM No --- --- ---
12/2/2008 S-5 <2 NS NA Yes --- ---
12/2/2008 S-6 6 66.4 NM No --- --- ---
12/2/2008 S-7 <2 NS NA No --- --- ---
12/2/2008 S-8 <2 NS NA Yes --- P
12/11/2008 MC0.3 18 1.09 0 No --- --- ---
12/11/2008 GSS 48 12.3 15 Yes --- ---
12/11/2008 CC 290 2.16 0 Yes --- ---
12/11/2008 CC (rep) N/A N/A N/A Yes --- ---
12/11/2008 MS 0.3 82 1.69 0 No --- --- ---
12/11/2008 MC 2.0 66 1.53 0 No --- --- ---
12/11/2008 MC1.75t 38 3.47 0 No --- --- ---
12/11/2008 CAS 46 0.98 NM Yes --- ---
12/11/2008 MAT0.1 4 1.21 NM No --- --- ---
12/11/2008 DR0.2 <2 0.58 NM No --- --- ---
1/6/2009 DOH 108 47 7.93 30 Yes --- ---
1/6/2009 DOH 110 74 10.0 30 Yes --- ---
1/6/2009 DOH 111 53 < 1 30 Yes --- ---
1/6/2009 DOH 112 39 5.43 30 Yes --- ---
1/6/2009 DOH 113 32 14.9 25 Yes --- ---
1/6/2009 CAS TNTC 4.10 0 Yes P
1/6/2009 CC 10 4.54 0 Yes --- P
1/6/2009 MC0.3 19 13.0 24 Yes --- ---
1/6/2009 GSS 6 42.6 29 No --- --- ---
1/6/2009 MAT0.1 TNTC 4.45 0 No --- --- ---
1/6/2009 DR0.2 34 0.96 0 Yes --- ---
1/6/2009 DR0.05 48 33.4 25.0 Yes --- ---
1/6/2009 MS0.3 114 4.75 13 Yes --- P
1/6/2009 MC2.0 TNTC 5.24 NM Yes --- P
1/6/2009 MC1.75t 14 7.49 NM Yes --- ---
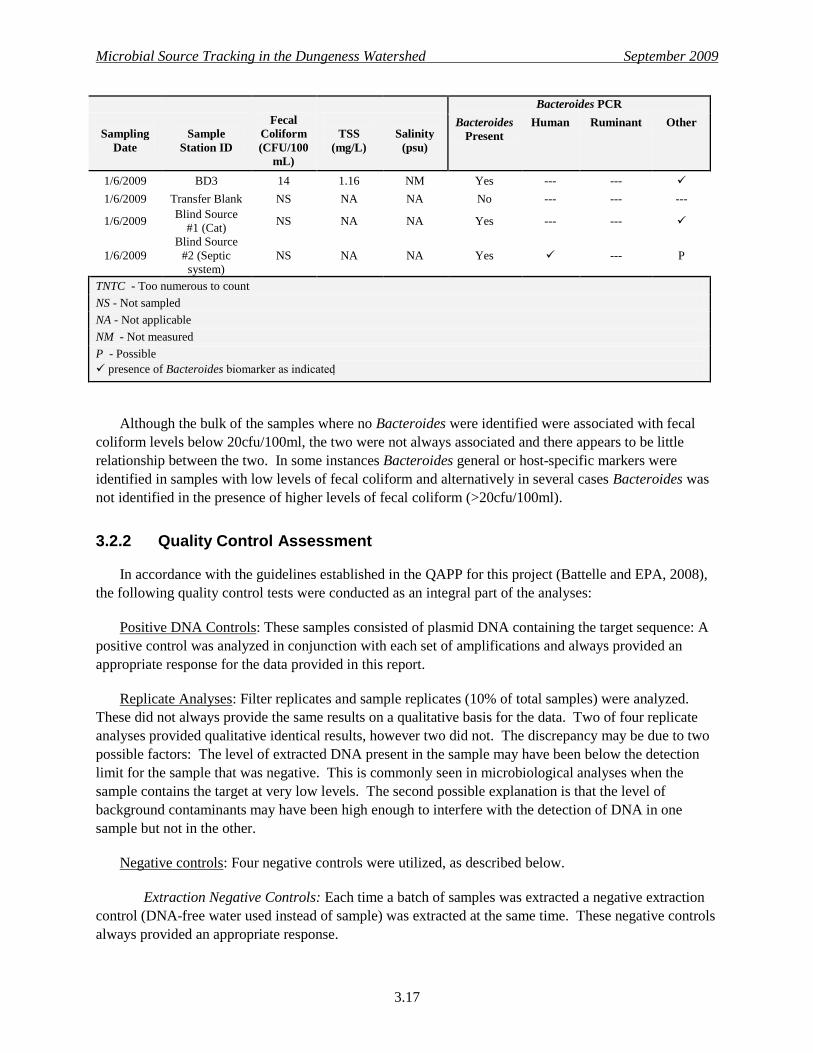
Microbial Source Tracking in the Dungeness Watershed September 2009
3.17
Sampling
Date
Sample
Station ID
Fecal
Coliform
(CFU/100
mL)
TSS
(mg/L)
Salinity
(psu)
Bacteroides PCR
Bacteroides
Present
Human Ruminant Other
1/6/2009 BD3 14 1.16 NM Yes --- ---
1/6/2009 Transfer Blank NS NA NA No --- --- ---
1/6/2009 Blind Source
#1 (Cat) NS NA NA Yes --- ---
1/6/2009
Blind Source
#2 (Septic
system)
NS NA NA Yes --- P
TNTC - Too numerous to count
NS - Not sampled
NA - Not applicable
NM - Not measured
P - Possible
presence of Bacteroides biomarker as indicated
Although the bulk of the samples where no Bacteroides were identified were associated with fecal
coliform levels below 20cfu/100ml, the two were not always associated and there appears to be little
relationship between the two. In some instances Bacteroides general or host-specific markers were
identified in samples with low levels of fecal coliform and alternatively in several cases Bacteroides was
not identified in the presence of higher levels of fecal coliform (>20cfu/100ml).
3.2.2 Quality Control Assessment
In accordance with the guidelines established in the QAPP for this project (Battelle and EPA, 2008),
the following quality control tests were conducted as an integral part of the analyses:
Positive DNA Controls: These samples consisted of plasmid DNA containing the target sequence: A
positive control was analyzed in conjunction with each set of amplifications and always provided an
appropriate response for the data provided in this report.
Replicate Analyses: Filter replicates and sample replicates (10% of total samples) were analyzed.
These did not always provide the same results on a qualitative basis for the data. Two of four replicate
analyses provided qualitative identical results, however two did not. The discrepancy may be due to two
possible factors: The level of extracted DNA present in the sample may have been below the detection
limit for the sample that was negative. This is commonly seen in microbiological analyses when the
sample contains the target at very low levels. The second possible explanation is that the level of
background contaminants may have been high enough to interfere with the detection of DNA in one
sample but not in the other.
Negative controls: Four negative controls were utilized, as described below.
Extraction Negative Controls: Each time a batch of samples was extracted a negative extraction
control (DNA-free water used instead of sample) was extracted at the same time. These negative controls
always provided an appropriate response.
Microbial Source Tracking in the Dungeness Watershed September 2009
3.18
PCR Negative Control (consisting of master mix and the appropriate primer set, but using water
instead of sample): A negative PCR control was analyzed with each set of amplifications and always
provided an appropriate response for the data.
Filtration Controls: This consisted of preparing an in-house filtration control and analyzing the
resulting filter. The filtration controls analyzed were negative providing an appropriate response for each
of the sample sets completed as part of this dataset.
Transfer Blank: A bottle of sterile water was provided by the Region 10 Laboratory and was
transferred to a sterile bottle in the field by the sample collector. This was shipped and processed as a
sample through the entire process. The transfer blank analyzed was negative for Bacteroides biomarkers.
Blind Samples: The sampling team provided the EPA Laboratory with two blind samples for the last
sampling event (Table 3.7). The samples were collected using an EPA recommended collection protocol.
The sample sources were known to the collectors, however unknown to the analyst. Both blind samples
provided an appropriate response. The first blind sample source was from a domestic cat and was
identified correctly as ―other‖ by the Laboratory. The second blind sample was taken from an on-site
septic system. This was identified correctly as Bacteroides positive and matched to a human biomarker
(HF134).
3.2.3 Water Quality (fecal coliform and total suspended sediments)
Samples for fecal coliform analysis were collected and analyzed from each station during each event
(42 samples). The results are presented in Table 3.7 and accompany the PCR results. Fecal coliform
values ranged between the detection limit (<2 CFU/ml) to TNTC (too numerous to count). Coliform
values during the first event (12/2/2008) were relatively low ranging between <2 to 32 CFU/100ml. All
seep samples (S-3 through S-8) were extremely low ranging between <2 to 8 CFU/100ml. Samples from
the second event which included only freshwater stations were somewhat higher ranging between <2 to
290 CFU/100ml. The last event included several stations with TNTC values including CAS, MAT0.1,
and MC2.0. Interestingly, all samples with human source identification were from the last sampling event
from stations with high FC values (114 CFU/100 ml to TNTC).
TSS samples were analyzed from each station and sampling event with the exception of several seep
sites which were logistically difficult to sample (Table 3.7). TSS ranged from a low of <1 mg/L at DOH-
111 on Jan. 6th, 2009 to a high of 66.4 mg/L TSS from a seep site (S-6) on December 2
nd, 2008. The bluff
seep stations had slightly higher turbidity values than most other stations. The turbidity data was
collected in order to determine if there was a correlation with FC. In general the TSS values were
relatively low and there was no apparent correlation with FC.

Microbial Source Tracking in the Dungeness Watershed September 2009
4.1
4.0 Discussion
The microbial source tracking study undertaken in the Dungeness watershed confirms that non-point
source bacterial pollution is present on the landscape and is highly reflective of the complexity of the
environment (i.e. multiple usages in a freshwater and estuarine/marine environment). Thirty-seven
species or types of animals and birds were identified as probable sources of fecal contamination in this
study. These sources represent classic inputs of non-point source pollution (e.g. birds, deer, raccoon,
domestic pets, human-derived sources) as well as representing inhabitants and a usage that are somewhat
unique but characteristic of this watershed and estuary (e.g. game farm animals, marine mammals).
The predominant source of fecal coliform pollution in the Dungeness watershed, both in the
freshwater and marine environment is birds. This is evident when looking at the individual source type
data (Section 3.1.1) from the overall Phase 1 study. Avian had the largest proportion of isolates (19.6%),
followed by gull (12.5%), and waterfowl (9.7%). When these source types are grouped into functional
guilds, birds as a functional group represented 42% of the distribution of isolates. The mean proportion of
bird sources from marine water sampling events (50.9%) was somewhat greater than the freshwater
station proportions of birds (38.6%). The predominant influence due to birds has been found at other
study sites in Puget Sound as well. An MST ribotyping study in Henderson Inlet in south Puget Sound
found that birds composed the highest proportion of isolates from the marine waters and a freshwater
tributary of Henderson Inlet, Swayne Creeks (Thurston County, 2002). A recent study in Drayton Harbor
and the adjacent California Creek watershed in Whatcom County, WA also found that avian fecal sources
were the most frequently detected in the marine waters (Hirsch Consulting Services, 2008). The presence
of waterfowl, in particular, is not unexpected in areas with larger bodies of water associated with the
watershed. The Dungeness National Wildlife Refuge encompasses Dungeness Bay, and is home to more
than 250 species of birds for some parts of the year. Migrating shorebirds are present in the spring and
fall, and flocks of waterfowl are present during the winter months. The widespread influence of birds,
particularly gulls, has been noted in other source tracking and fecal indicator studies as well, notably
along coastal and lake waters (Edge et. al. 2007; Lu et al. 2008; Nelson et al. 2008).
Other individual sources that encompassed lesser proportions of isolates (between 4 and 9 % each)
included raccoon, human-derived sources, rodent and dog. When these are grouped into functional guilds
the most prevalent source after birds was wild mammals (including raccoon, rodent, deer, elk, beaver,
otter, rabbit and marine mammals). Groups with somewhat less but similar proportions included
domestic animal, human, and farm animal. Game farm animals represented a smaller proportion of
isolates. This pattern was true for all station data that was grouped together, and was also true when the
freshwater stations and the marine water and sediment stations were examined independently. When
examining these trends spatially, there was a notable similarity between the proportion distribution of
freshwater source type groups and marine water source type groups (Figures 3.3, 3.4, 3.5) indicating that
at least a fair portion of freshwater sources, such as wild mammals, domestic and farm animals, are being
conveyed into the marine environment, presumably as runoff directly into Dungeness Bay or by transport
via the Dungeness River.
There was no statistically significant change in the partitioning of the proportion of isolates for the
duration of the study; however several temporal trends were noted. In marine waters the proportion of
wild mammals increased somewhat while the proportion of farm mammals decreased somewhat, however

Microbial Source Tracking in the Dungeness Watershed September 2009
4.2
both remained highly variable. In the marine waters, the proportion of combined wild mammals and
game farm sources increased during the wet season, indicating the possible influence of runoff during this
season.
The marine sediment isolate distribution was similar to freshwater and marine water stations;
however sediment was not regularly sampled so a direct comparison could not be made. Although this
study was not designed to determine whether sediment was acting as a reservoir of E. coli, the data do
suggest that E. coli bacterial sources in the overlying marine water are similar to the E. coli sources in the
upper few centimeters of sediment, and a number of those sources are land-based in origin (e.g. deer, elk,
raccoon, rodent, horse). The MST study in Henderson inlet also found similar distributions between
sediment samples collected and the overlying marine water (Thurston County, 2002).
Wrack samples (detrital algae) were collected when it was present along the shoreline near station
DOH-113 (9 out of 13 sampling events). Because algal mats routinely form along the shoreline and tidal
flats of Dungeness Bay, particularly in the summer, we were interested in understanding what sources
might be present in this matrix type. Wrack has been noted as a potentially important reservoir of
indicator bacteria in the nearshore areas of the Great Lakes and other areas (Whitman et al. 2003). Of the
nine sampling events, the presence of E. coli was found only twice. From those 2 sampling events, the
presence of dog, deer and avian were noted. These sources are not surprising, although the limited
number of occurrences from this study would indicate that wrack may not be a major reservoir of E. coli.
It should be noted however, that samples were not collected in areas of heavy algal accumulation, which
usually occurs along the tide flats of outer Dungeness Bay.
One of the goals of the study was to examine the primary sources of fecal contamination at specific
sites as well as determine any site specific differences. While the predominant source of bacterial
contamination at all stations was birds, there were several site specific differences noted. BD-7 had a
significantly higher proportion of human-derived isolates compared to other freshwater sites (Table 3.6)
while MAT0.1 had a significantly higher proportion of game farm source types (including bear, bison and
yak) compared to other freshwater stations. In addition, game farm animals occurred during 46% of
sampling events throughout the year at this site. The MAT0.1 station was located on the Olympic Game
Farm, close to the mouth of Matriotti Creek before it joins the Dungeness River. While a number of
BMPs have been implemented on the game farm in the past, this evidence suggests that further mitigation
efforts might be warranted. Although the game farm sources were not a predominant source at other
freshwater sites, their occurrence was found at other freshwater, marine water and marine sediment sites,
again pointing to the conveyance of land-based sources through the watershed and into the marine
environment.
Human-derived sources occurred at all stations except the DOH-113 sediment station and the marine
wrack station (Table 3.6), clearly indicating a source for concern. Although BD-7 had the highest
proportion of human-derived isolates (15.3%) compared to other freshwater sites, these occurred
primarily between December and February. This may be indicative of a septic drain field failure in
relatively close proximity to the sampling site. This station was also dry during 5 out of the 13 sampling
events, and was therefore not sampled every month. MAT0.1 and MC0.3 had the highest frequency of
occurrence of human-derived sources, 69% and 54% respectively (Table 3.5, Figures 3.6 and 3.7). As
tributaries to the Dungeness River, these two sources appear to represent a chronic and relatively constant
source of human-derived sources. This has been suggested in previous studies (Sargeant 2002,
Hempleman and Streeter, 2004; Rensel, 2003), and evidence from this MST study confirms those
Microbial Source Tracking in the Dungeness Watershed September 2009
4.3
findings. A number of failing septic systems have been documented in the lower Dungeness watershed of
concern and at least 8 septics of concern and 53 neighboring septic of concern repairs or upgrades were
completed since October 2004 under Task 2b - Homeowner Sewage Management BMP Education and
Training of the Targeted Watershed grant. This study confirms that additional sources of human-derived
input are still impacting the freshwater and marine waters. In the marine waters, another possible human-
derived source is recreational boaters, although there are public restrooms available for day-use boaters at
Cline Spit, and generally Dungeness Bay does not receive much usage from overnight boaters. While it is
possible that recreational boaters are contributing FC sources directly to the Bay, it is more likely that the
human-derived sources were transported from a freshwater source. These findings are consistent with the
results of the FC studies conducted by Rensel et al. (2003).
The Phase 1 Ribotyping and Phase 2 Bacteroides PCR studies were designed as independent but
sequential investigations in the same watershed. While the two studies cannot be compared directly, it
was an opportunity to evaluate and contrast the two MST methodologies qualitatively. Results from the
two studies led us to similar interpretations regarding fecal coliform sources in the Dungeness watershed.
We concluded from the ribotyping study that birds were the dominant source of contamination in the
freshwater and marine stations in the Dungeness watershed with numerous additional sources contributing
smaller, but cumulatively significant inputs. Those smaller sources included human-derived sources,
domestic, farm and game farm animal groups. In comparison, the Phase 2 study, initiated approximately
7 months after the Phase 1 sampling ended, focused on the presence of human and ruminant biomarkers
exclusively. Those results confirmed the presence of both human and ruminant sources at several
freshwater stations including additional stations that were not part of the Phase 1 study (i.e.
Meadowbrook Creek 2.0, Meadowbrook Slough, Cooper Creek, Cassalery Creek, bluff seep #8). Overall
the two methods provided complementary results. The Phase 1 study led to an understanding of the
predominant sources in the watershed (i.e. birds and wild mammals). The Phase 2 study confirmed the
Phase 1 study findings of the presence of human and ruminant sources, although it should be noted that
the Phase 2 study was conducted in the winter only and may not be reflective of all seasons. The Phase 2
study also provided information suggesting the spatial widespread influence and spatial extent of human-
derived sources in the Dungeness watershed.
Each of the methods employed here had strengths and weaknesses, and in general, MST methods are
still evolving and improving. Currently there is no standard method that is appropriate to answer all MST
questions. The Phase 1 ribotyping study was fairly comprehensive and answered questions about
dominant sources and the variety of sources of fecal coliform pollution in the Dungeness watershed.
However the collection of local source samples to add to the IEH library required additional time and
resources. In addition the turnaround time for receipt of final results was close to ten months after the last
samples were collected, which is impractical for most applications. The Phase 2 Bacteroides PCR study
was smaller in scope in terms of the number of sampling events and samples collected. Since this was a
library-independent approach, there was no need for source sample collection, and in general sample
collection was relatively straight forward. The ―blind‖ samples submitted to the EPA Manchester Lab for
the study produced accurate results and the turn-around time was approximately 2 months for the study
results. The analysis of samples submitted below the 14 CFU/100 ml cutoff value for sensitivity
produced positive results indicating the usefulness of including these samples in future analyses. Only 2
primers (human and ruminant) were available for use by the laboratory. The usefulness of this method to
resource managers could be greatly enhanced by the incorporation of additional primers.

Microbial Source Tracking in the Dungeness Watershed September 2009
4.4
Overall these methods were successful in providing credible scientific evidence of the predominant
sources of fecal contamination in the lower Dungeness watershed and Bay. While some of these sources
may be difficult to manage, such as birds and wild mammals, the study also provided evidence of sources
in the watershed that can be controlled or mitigated for, such as human-derived sources that are a public
health risk. This information will provide the basis for continued education and public outreach regarding
sources of bacterial contamination in the watershed. The scientific information gained from this study
will allow the opportunity for resource managers to re-evaluate and modify current on-site septic system
management programs to specifically target resources toward actions that will be most effective at
reducing bacteria levels in the watershed. In addition, it should also provide the basis for re-evaluation of
the progress made toward achieving the goals of the Clean Water Strategy and Water Cleanup Detailed
Implementation Plan (Hempleman and Streeter, 2004), and for making adjustments to monitoring plans
or cleanup strategies as necessary. While these results should not be extrapolated to other geographic
regions, information gained from the use of these tools, the overall approach and lessons learned can be
applied to other watersheds.
.
Microbial Source Tracking in the Dungeness Watershed September 2009
5.5
5.0 Conclusions and Recommendations
The following conclusions have been drawn from this study for the Dungeness watershed and
estuary:
The percentage of isolates matched to known sources during the ribotyping study was
relatively high indicating a majority of fecal bacteria sources in the watershed were
identified. Approximately 92% of the collective isolates from water, sediment, and wrack
were identified and matched to a source. Of those, 5% were matched directly to the local
database.
The predominant sources of fecal coliform contamination identified in the Dungeness study
area were, in ranked decreasing order of presence: avian (19.6%), gull (12.5%), waterfowl
(9.7%), raccoon (9.2%), unknown (7.3%), human-derived (7.1%), rodent (6.3%) and dog
(4.3%).
Birds, in total, represented the largest source group, accounting for approximately 42% of the
isolates collected and analyzed throughout the study. They also occurred most frequently
throughout the course of the study. They were the dominant presence in Dungeness Bay and
all freshwater stations in the lower watershed (i.e. Matriotti Creek, Meadowbrook Creek, and
Golden Sands Slough) with the exception of BD7 where wild mammals occurred more
frequently.
Wild mammal sources represented about 26% of the isolates sampled and included raccoons,
rodents, deer, elk, beaver, river otter, rabbit and marine mammals.
Domestic animals represented about 7% of the isolates sampled and included dogs and cats.
Farm animals also represented about 7% of the isolates sampled and included bovine,
chicken, horse, llama, pig, sheep and goat.
Human-derived sources, primarily from on-site septic systems, were present at all freshwater
and marine water stations and one sediment station (DOH-108). These sources represented
about 7% of isolates on average, and between 3 and 11% of the isolates at any given station.
They were present throughout the year, and for each station that contained human-derived
isolates, and occurred between 25 and 69% of the time of total sampling events. MAT0.1
(Matriotti Creek) had the highest frequency of occurrence, with human-derived sources
occurring on 9 out of 13 sampling events. MC0.3 (Meadowbrook creek), BD-7 (bluff ditch),
and Golden Sands Slough (GSS) also contained human-derived sources.
Source types representing probable game farm animals (bear, bison, burro, prairie dog and
yak) represented about 2.5% of the isolates sampled. Game farm animals were present at
46% of sampled events at MAT0.1, located on the Game Farm at the mouth of Matriotti
Creek. Their presence occurred regularly throughout the year. Game farm animal types were
also found at other freshwater sites as well as in the marine environment.
Microbial Source Tracking in the Dungeness Watershed September 2009
5.6
While there were no statistically significant temporal trends, when combined, the proportion
of wild mammals and game farm animal sources increased slightly during the wet season
(October through March), indicating the possible influence of surface runoff events.
The Phase 2 Bacteroides PCR study complemented the Phase 1 ribotyping approach.
Although the study was of short duration, limited to the winter months, the PCR study
identified human and ruminant sources over a larger geographic expanse in the lower
Dungeness watershed, emphasizing the importance of increasing mitigation efforts of these
sources.
Once of the most important findings of the study was the presence of land-based sources (e.g.
e.g. wild mammals, farm animals, domestic animals, game farm animals, human-derived
sources) found in marine waters, sediment and wrack. This provides direct scientific evidence
of the conveyance of these sources across the landscape into the marine environment.
Based on the proportion of isolates sampled, approximately 24% of fecal coliform bacteria
are from controllable sources (i.e. human-derived, domestic animals, farm animals, and game
farm animals). If raccoons are included (categorized as wild mammal in this study), then
approximately 33% or 1/3 of bacterial fecal contamination are from controllable sources.
Recommendations for the future include:
Secure resources/funding to implement necessary improvements in management programs and
enforcement mechanisms that will mitigate the public health risk by reducing human-derived
sources and other readily controllable sources of fecal contamination, including:
o On-Site Septic Systems
Ongoing homeowner education regarding septic system maintenance and
homeowner inspections of septic systems
Investigate, identify, and repair or replace problem septic systems in the lower
Dungeness watershed
Effective enforcement process
o Game Farm Animals - Implementing additional BMP measures for reducing access to
open waterways by game farm animals,
o Domestic Pet Waste - Education and outreach to homeowners regarding proper disposal
of domestic pet waste,
o Urban Wildlife Populations – Education and outreach to homeowners about practices that
discourage attraction of urban wildlife, particularly raccoons.
Improve storm water management programs, including the promotion and implementation of
Low Impact Development (LID) principles and practices such as the reduction of effective
Microbial Source Tracking in the Dungeness Watershed September 2009
5.7
impervious surfaces, dispersion of storm water runoff to vegetated areas, and Best Management
Practices that are appropriate to the site specific conditions.
Use the results from this study to evaluate current on-site septic system management programs
and water quality monitoring plans in the Dungeness watershed. Re-examine implementation
strategies and modify is necessary to achieve long-term water quality objectives.
Continue emphasis on improving MST methodologies, including efforts that will encourage
accessibility and use of these tools in a streamlined and cost-effective manner.
Continue outreach (including dissemination of related study results) to the public about nonpoint
source pollutant sources and steps that can be taken to mitigate those sources that are human-
derived and controllable through improved management programs and enforcement mechanisms
that will benefit ecosystem and public health.


Microbial Source Tracking in the Dungeness Watershed September 2009
6.1
6.0 References
American Public Health Association (APHA). 1998. Standard Methods for the Examination of Water
and Wastewater, 20th Edition., Washington, D.C.
Battelle Marine Sciences Laboratory. 2005. Quality Assurance Project Plan. EPA Targeted Watershed
Grants Program, Dungeness River and Estuary, Task 1 – Microbial Source Tracking. Prepared for the
Jamestown S’Klallam Tribe and EPA Region 10, Seattle Washington.
Battelle Marine Sciences Laboratory and EPA Region 10. 2008. Quality Assurance Project Plan for
Dungeness Watershed Microbial Source Tracking Pilot Study. Prepared for EPA Region 10, Technical
Support Unit, Seattle Washington.
Clallam County. 1993. Dungeness River Area Watershed Management Plan. Clallam County
Department of Community Development, Port Angeles, Washington.
Clean Water Workgroup. 2002. Clean Water Strategy for Addressing Bacterial Pollution in Dungeness
Bay and Watershed. Published by the Clallam County Health and Human Services Department, Port
Angeles, Washington.
Dick, LK, AE Bernhard, TJ Brodeur, JW Santo Domingo, JM Simpson, SP Walters, and KG Field. 2005.
―Host distributions of uncultivated fecal Bacteroidales reveal genetic markers for fecal source
identification.‖ Appl Environ Microbiol 71:3184-3191
Edge, T.A., S. Hill, G. Stinson, P.Seto and J. Marsalek. 2007. Experience with the antibiotic resistance
analysis and DNA fingerprinting in tracking faecal pollution at two lake beaches. Water Science and
Technology. Vol 56(11): 51-58.
Field, KG, EC Chern, LK Dick, JA Fuhrman, JF Griffith, PA Holden, MG LaMontagne, J Le, BH Olson,
and MT Simonich. 2003. A comparative study of culture-independent, library-independent genotypic
methods of fecal source tracking. J. Water Health 1:181-194.
Hempleman, C and V Streeter. 2004. Clean Water Strategy for addressing Bacteria Pollution in
Dungeness Bay and Watershed and Water Cleanup – Detailed Implementation Plan. Prepared by
Clallam County Division of Natural Resources and Washington State Department of Ecology, Publication
Number 03-10-059.
Hirsch Consulting Services (H.C.S.). 2008. California Creek and Drayton Harbor Microbial Source
Tracking Pilot Study. Prepared for the Puget Sound Restoration Fund, Bainbridge Island Washington by
H.C.S, Lummi Island, Washington, December 2008.
Lu, J., J.W. Santo Domingo, R. Lamendella, R. Edge and S. Hill. 2008. Phylogenetic Diversity and
Molecular Detection of Bacteria in Gull Feces. Appl Env. Microb. Vol 74 (13):3969-3976.
Melvin, D. 2003. Sanitary Survey of Dungeness Bay August 2003. Office of Food Safety and Shellfish
Programs, Washington State Department of Health, Tumwater, Washington.

Microbial Source Tracking in the Dungeness Watershed September 2009
6.2
Nelson, M., S.H. Jones, C. Edwards, J.C. Ellis. 2008. Characterization of Escherichia coli populations
from gulls, landfill trash, and wastewater using ribotyping. Dis. Aquat Org. Vol. 81:53-63.
Rensel, J. 2003. Dungeness Bay Bathymetry, Circulation and Fecal Coliform Studies. Phase 2. Prepared
by Rensel Associates Aquatic Science Consultants, Arlington,Washington for the Jamestown S’Klallam
Tribe and the U.S. Environmental Protection Agency, Seattle, Washington.
Santo Domingo, JW, DG Bambic, TA Edge, and S Wuertz. 2007. ―Quo vadis source tracking? Towards
a strategic framework for environmental monitoring of fecal pollution.‖ Water Res. 41:3539-3552.
Sargeant, D. 2002. Dungeness River and Matriotti Creek fecal coliform bacteria total maximum daily
load study. Environmental Assessment Program, Washington Department of Ecology, Publication
Number 02-03-014, Olympia, Washington.
Sargeant D. 2004. Dungeness Bay Fecal Coliform Bacteria Total Maximum Daily Load Study.
Environmental Assessment Program, Washington State Department of Ecology, Publication Number 04-
03-012 Olympia, Washington.
Stoeckel, DM and VJ Harwood. 2007. ―Performance, Design, and Analysis in Microbial Source Tracking
Studies.‖ App. Env. Microbiology. 73(8):2405-2415.
Streeter V. 2005. Quality Assurance Project Plan: Bacterial/Nutrient/Flow Effectiveness Monitoring in
the Clean Water District. Prepared for the U.S. Environmental Protection Agency and Washington State
Department of Ecology by Clallam County Health and Human Services Department, Port Angeles,
Washington.
Streeter, V. and C Hempleman. 2004. Clean Water Strategy for Addressing Bacteria Pollution in
Dungeness Bay and Watershed and Water Cleanup Detailed Implementation Plan. Prepared by Clallam
County, Division of Natural Resources, Port Angeles, WA and Washington State Department of Ecology,
Olympia WA, Publication Number 04-10-059.
Valderrama, JC 1981. ―The Simultaneous Analysis of Total Nitrogen and Total Phosphorus on Natural
Waters.‖ Mar Chem (10):109-122.
USEPA (U.S. Environmental Protection Agency). 2005. Microbial Source Tracking Guide Document.
Office of Research and Development, Washington, DC EPA-600/R-05/064. 131 pp.
USEPA (U.S. Environmental Protection Agency). 2009. Memorandum of Final Report for the Dungeness
Microbial Source Tracking (MST) Project. Office of Environmental Assessment, EPA Region 10
Laboratory, Port Orchard, Washington.
Washington State Department of Health (DOH). 1998. Annual Growing Area Review, Dungeness Bay-
Clallam County. DOH, Office of Food Safety and Shellfish Programs, Olympia, Washington.
Woodruff, DL and NR Evans. 2003. Potential Applications of Microbial Source Tracking Methods to the
Dungeness Watershed and Bay, Clallam County, WA. PNWD-3305, Prepared for Clallam County Dept.
of Community Development by Battelle Pacific Northwest Division, Sequim Washington.