micro and macro price dynamics over twenty years in japan
TRANSCRIPT

Micro and Macro Price Dynamics over Twenty Years in Japan ― A Large Scale Study Using Daily Scanner Data ―
Naohito AbeAnd
Akiyuki Tonogi
January 28, 2008
JSPS Grants-in-Aid for Creative Scientific ResearchUnderstanding Inflation Dynamics of the Japanese Economy
Working Paper Series No.18
Research Center for Price DynamicsInstitute of Economic Research, Hitotsubashi University
Naka 2-1, Kunitachi-city, Tokyo 186-8603, JAPANTel/Fax: +81-42-580-9138
E-mail: [email protected]://www.ier.hit-u.ac.jp/~ifd/
Micro and Macro Price Dynamics over Twenty Years in Japan
― A Large Scale Study Using Daily Scanner Data ― 1
Naohito Abe2 and Akiyuki Tonogi3
January 23, 2008
Abstract
Using large-scale daily scanner data, we investigate micro and macro price dynamics in Japan between 1988 and 2005. Drawing upon three billion observations of prices and the number of sold units, we find: (i) the frequency of price change is increasing, (ii) the frequency varies greatly between products and stores, and (iii) the choice of data frequency is crucial when estimating the degree of price stickiness. The estimates obtained with daily data are very different from those employing monthly data. Moreover, (iv) a Consumer Price Index (CPI) based on scanner data exhibits similar movements to the official CPI, except for the first half of the 1990s and in the 2000s, (v) the lower substitution bias does not comprise a serious problem, and (vi) the scanner-based CPI is more strongly correlated with the GDP gap than the official CPI. Our findings of the increasing frequency of price changes and very flexible prices are inconsistent with New Keynesian models of the Phillips Curve and recent Japanese experience with the flattening of the Phillips Curve. The second and third findings cast doubt on the use of monthly data to estimate the degree of price stickiness.
JEL Classification: E31. Key Words: Pricing, Scanner Data, CPI
1 The authors would like to thank David Weinstein, Anil K. Kashyap, Tsutomu Watanabe,
Makoto Saito, and Shigenori Shiratsuka for useful discussions on this paper. They also acknowledge the helpful comments of participants at the “Inflation Dynamics in Japan, US, and EU” conference, Japanese Economic Association Autumn Meeting, Nihon University 2007, Statistical Research Workshops in the Statistical Bureau, Osaka University, and the 9th Macro Conference at Keio University. This research is an outcome of the Creative Scientific Research Project, “Understanding Inflation Dynamics of Japanese Economy”, supported by the Japan Society for the Promotion of Sciences. The authors are grateful to Nikkei Digital Media Inc. for providing the requisite data. 2 Institute of Economic Research, Hitotsubashi University. E-mail: [email protected]. Phone: +81-425-80-8347. Fax: +81-425-80-8333.
1

1. Introduction
Investigation of the price dynamics of individual commodities and their
aggregates, such as the Consumer Price Index (CPI), has been a central theme
of modern macroeconomics. For a long time, researchers have been seeking
theories that can describe and predict the price dynamics, statistical indicators
that can capture the aggregate movement of prices, and policy tools that enable
policymakers to control inflation. Recently, an increasing number of
researchers and policymakers have made use of scanner data to analyze price
dynamics because of their rich information on prices and the amount of sales.
Compared with the monthly surveys of prices conducted by many
governments, including the Bureau of Labor Statistics (BLS), scanner data
contains much more information on the prices of a greater number of different
commodities at higher frequencies. Unfortunately, only a few food retail chain
stores in a particular city provide most of the scanner data available to
researchers. This is far from the nationwide representative sample included in
collections such as the BLS micro price data.4
In this paper, we employ a large-scale daily scanner data in Japan. The
data comprises 280 different food stores, including general merchandize stores
(GMS), food markets, and convenience stores, throughout Japan. With this
3 Graduate School of Economics, Hitotsubashi University. 4 The Chicago Graduate Business School provides store-level weekly scanner data from 86 stores in the Dominick’s Finer Foods retail chain in the Chicago area. See Chevalier, Kashyap
2

data, we investigate both the micro and macro price dynamics in Japan over a
period of 20 years. More specifically, we investigate the frequency of price
changes and the characteristics of aggregate prices based on the scanner data.
The degree to which prices are sticky is a key parameter when evaluating
the effects of monetary policy in the latest macroeconomic models. In both
time-dependent models, such as those by Taylor (1980) and Calvo (1983), and
state-dependent models including Caplin and Spulber (1987) and Golosov and
Lucas (2007), a crucial ingredient of price dynamics is the reluctance or
inability of price setters to change prices. Because these models assume that
individual prices are sticky, an increasing number of researchers in price
behavior have used micro data to investigate the frequency of price
adjustment.5
Until now, many empirical analyses of price dynamics have used monthly
data. For example, Bils and Klenow (2004) and Nakamura and Steinsson
(2007) used monthly data in the US, Dhyne, et al. (2005) used monthly data in
Europe, and Saita and Higo (2007) used Japanese monthly data. Although the
estimates of the frequency of price changes in these studies differ, the
estimated monthly frequencies are generally smaller than 0.3, implying that
prices do not change, on average, for three months. Recently, Kehoe and
and Rossi (2003) and Kehoe and Midrigan (2007) for examples of research based on this data. 5 The number of studies concerning micro price dynamics is increasing. See Dyhne et al. (2005), and Baharad and Eden (2004) for recent progress is this area.
3

Midrigan (2007) utilized weekly data from a single food retail chain in Chicago
and found that the weekly frequency of price changes was 0.33, suggesting that
the average duration for which prices remain unchanged is only 3 weeks.
Although the sample used by Kehoe and Midrigan (2007) is very different
from that employed by Bils and Klenow (2004) or Nakamura and Steinsson
(2007) in many respects, we suspect that a crucial factor that creates these
significant discrepancies are the differences in data frequency. Our estimates
of the price change frequency based on daily scanner data are much lower than
in Kehoe and Midrigan (2007), even after controlling for the effects of bargain
sales. The frequency of data becomes crucial in estimating the average length
of price change duration when there is strong heterogeneity among price
setters. In this paper, we investigate the role of data frequency and
heterogeneity among stores when estimating the price change frequency.
The second objective of this paper is to investigate macro price dynamics in
Japan. Japanese experience of aggregate price dynamics following the “bubble”
period is unique in several aspects. Figure 1 shows changes in the growth rate
of the official Japanese CPI.6 In this figure, we observe both inflation and
deflation in the 1990s. 7 Since the late 1990s, the Japanese economy is
characterized by (1) persistent deflation, (2) long-term recession, and (3) a
6 Sudden increases in prices in 1989 and 1995 were the result of changes in consumption taxes. 7 Shiratsuka (1998; 1999) provided excellent surveys on the possible bias in the Japanese CPI.
4

flattening Phillips Curve. 8 Note that the Japanese economy went into
recession in the early 1990s, while the CPI kept rising until the late 1990s.
Partly inspired by the Boskin reports (Advisory Commission to Study the
Consumer Price Index, 1996), academic and nonacademic researchers alike
have serious doubts about the precision of the official CPI in Japan particularly
during the early 1990s.9
In Section 4 in this paper, we construct a CPI based on the scanner data
and compare it with the official CPI. Scanner data has several advantages for
constructing CPI over official monthly surveys. First, because scanner data
contains information on the number of units sold, we can use a Paasche or
chain index that is free from the upward bias found in the Laspeyres Index.
Second, because the scanner data covers almost all items in the same category,
it is free from the lower substitution bias pointed out in the Boskin report
(1996). Finally, scanner data contains information on bargain sales, not
included in the official monthly survey.
Our basic findings on Japanese micro and macro price dynamics are as
follows:
1) Prices change very frequently. Most products change their prices within 1
week;
The Saison Research Institute (2001) report their own estimates of the CPI based on point-of-sale (POS) data provided by a supermarket chain in Tokyo. 8 See Miyao(2001) and Sakura, Sasaki and Higo(2005) for recent analyses of the Phillips Curve
5
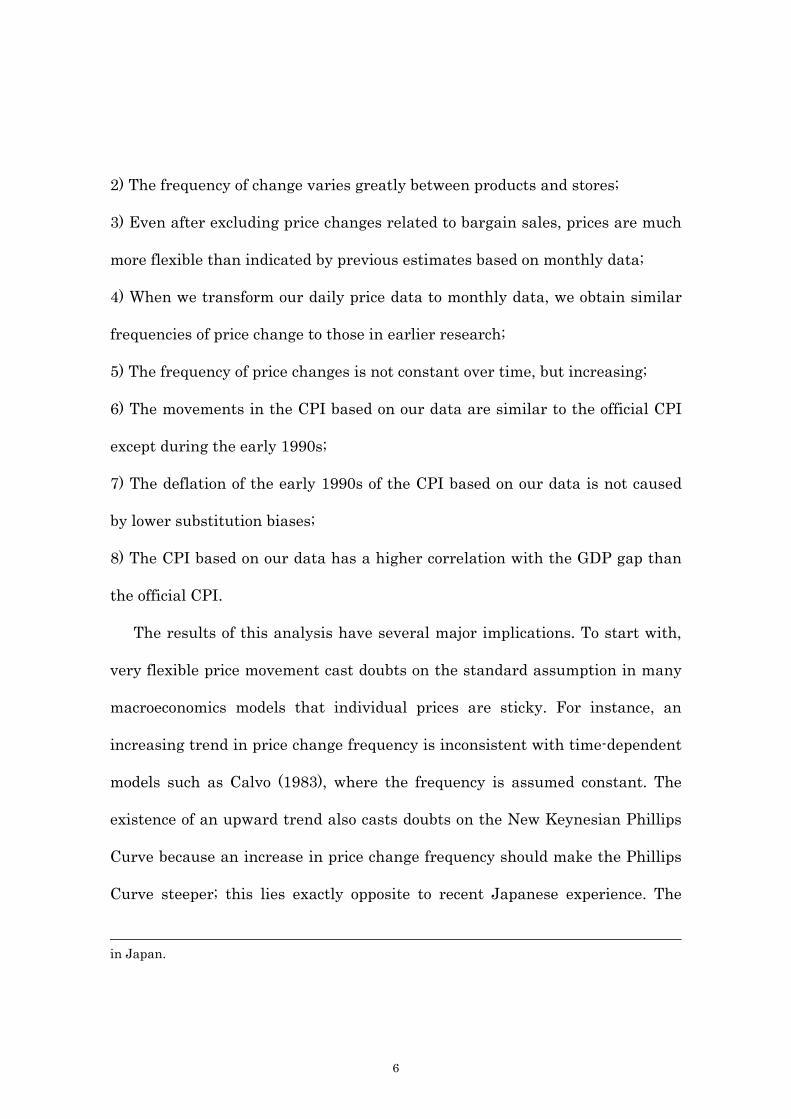
2) The frequency of change varies greatly between products and stores;
3) Even after excluding price changes related to bargain sales, prices are much
more flexible than indicated by previous estimates based on monthly data;
4) When we transform our daily price data to monthly data, we obtain similar
frequencies of price change to those in earlier research;
5) The frequency of price changes is not constant over time, but increasing;
6) The movements in the CPI based on our data are similar to the official CPI
except during the early 1990s;
7) The deflation of the early 1990s of the CPI based on our data is not caused
by lower substitution biases;
8) The CPI based on our data has a higher correlation with the GDP gap than
the official CPI.
The results of this analysis have several major implications. To start with,
very flexible price movement cast doubts on the standard assumption in many
macroeconomics models that individual prices are sticky. For instance, an
increasing trend in price change frequency is inconsistent with time-dependent
models such as Calvo (1983), where the frequency is assumed constant. The
existence of an upward trend also casts doubts on the New Keynesian Phillips
Curve because an increase in price change frequency should make the Phillips
Curve steeper; this lies exactly opposite to recent Japanese experience. The
in Japan.
6

discrepancies in the estimates of price change frequencies between daily and
monthly data suggest the existence of a serious upward bias when using
monthly data is used.
This paper is organized as follows. Section 2 provides a brief description of
the data. Section 3 discusses the frequency of price changes and bargain sales.
Section 4 explores the implication of our estimates of price dynamics for the
Japanese CPI. Section 5 concludes.
2. The Data
We use a POS dataset compiled by Nikkei Digital Media (Nikkei-POS).
Nikkei or Nihon Keizai Shinbun (Japan Economic Times) is one of the largest
providers of economic datasets in Japan including company information, stock
prices, and macroeconomic data. Nikkei-POS is a commercial product. The
Nikkei-POS includes 18 years of data covering the period from March 1, 1988
to December 31, 2005.10 The data provides daily transactions for a large
number of products by various retail shops, including GMS and supermarkets
throughout Japan.11 The number of products recorded exceeds one million, and
the total number of observations is about three billion. The Nikkei-POS
contains processed foods and domestic articles as item categories.
9 See International Labor Organization (2005) for details. 10 Unfortunately, the data does not contain observations for November and December 2003. 11 The data includes large chain stores such as Daiei and Mycal along with smaller
7

Unfortunately, information on fresh foods, services, and expensive durable
goods are not available.12
Table 1 shows the basic characteristics of the data. We observe that each
year, transactions for approximately 0.2 million different products are recorded
in the data. Because the average annual total sales per store is about 1.3 billion
yen (some 12 million US dollars), this implies the stores included in the survey
are not very small. Table 2 reports the location distribution of the sample
stores. We can confirm that the stores are located throughout Japan.
In Figures 2 (a), (b), and (c), we show some examples of the movements of
prices and the number of units sold as recorded in our data. The commodity
employed as an example is Nissin's Cup Noodle, which is well known in Japan
and is one of the components of the Japanese CPI compiled by the Statistics
Bureau. The figures illustrate the records for three typical stores in our
datasets from September 1, 2005 to December 31, 2005. As shown, the store
illustrated in Figure 2(a) frequently changed prices, although without following
a clear pattern, whereas the store in Figure 2(b) did not change prices at all.
The store in Figure 2(c) changed priced periodically. Occasionally we observe
very different pricing patterns, even for the retailers in the same chain.
The Nikkei-POS contains the JAN code as one of the identifiers for each
convenience stores. 12 Detailed categories of processed foods and domestic articles and their annual sales amounts are denoted in Appendix Table 1.
8

product. In principle, the JAN code is a unique product identifier; that is,
different products have different JAN codes. In reality, some companies use the
same JAN code for similar C products. To deal with this problem, Nikkei
creates an additional identifier, the generation code, for each JAN code. We use
a combined product code that is a mixture of the JAN code and the generation
code.
3. The Frequency of Price Changes and Bargain Sales
3.1. The Frequency of Price Changes
Figure 3 shows the daily frequencies of price changes in the Nikkei-POS
each year. The price change frequencies are calculated by: (i) rounding prices
off below the decimal point to remove the effects of time sales within each day,
(ii) taking the means of dummy variables that take a value of unity when the
price is different from the day before, (iii) calculating the item category level
frequencies using the weighted average of item level frequencies with sales
weights, and (iv) calculating the total level frequencies by weighted average of
item category level frequencies by sales weights. Note that we remove samples
that are not sold over 300 days per store when we calculate the frequencies.
In Figure 3, we can observe that the total daily frequency is about 14% in
1988, 20% in 2000, and 34.6% in 2005. That is, price changes occur once every
3 days in 2005. Table 3 reports more detailed frequencies at the categorical
9
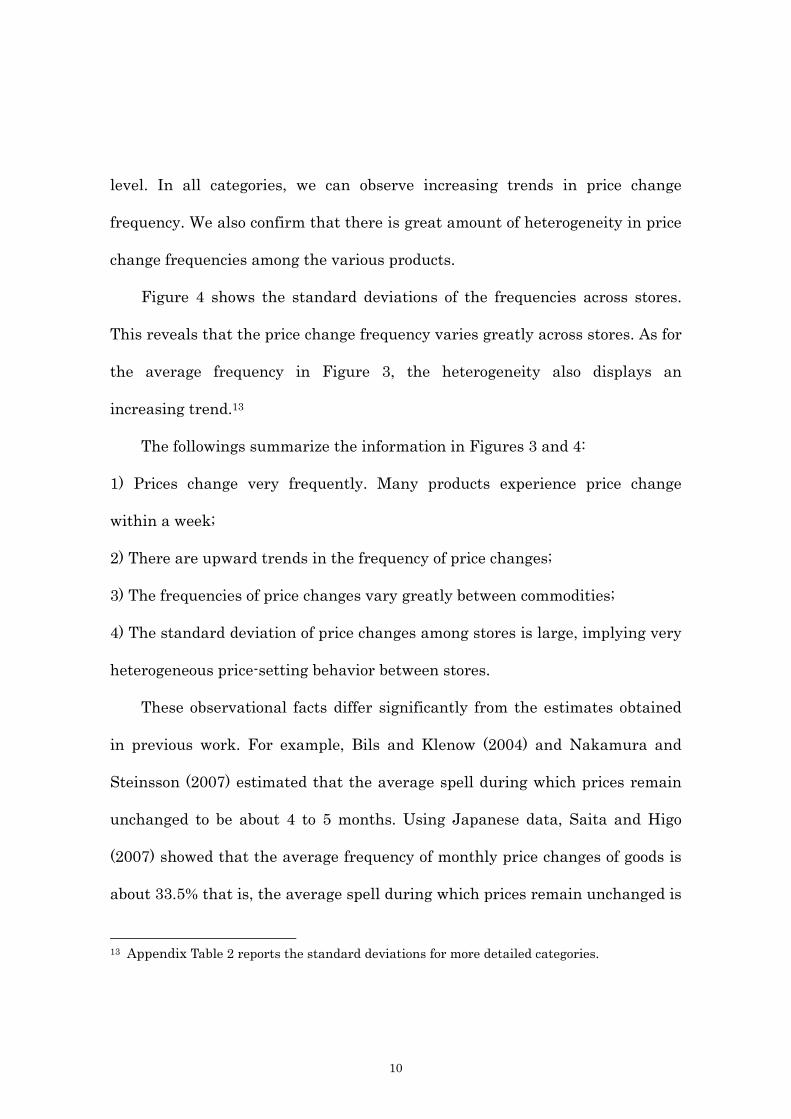
level. In all categories, we can observe increasing trends in price change
frequency. We also confirm that there is great amount of heterogeneity in price
change frequencies among the various products.
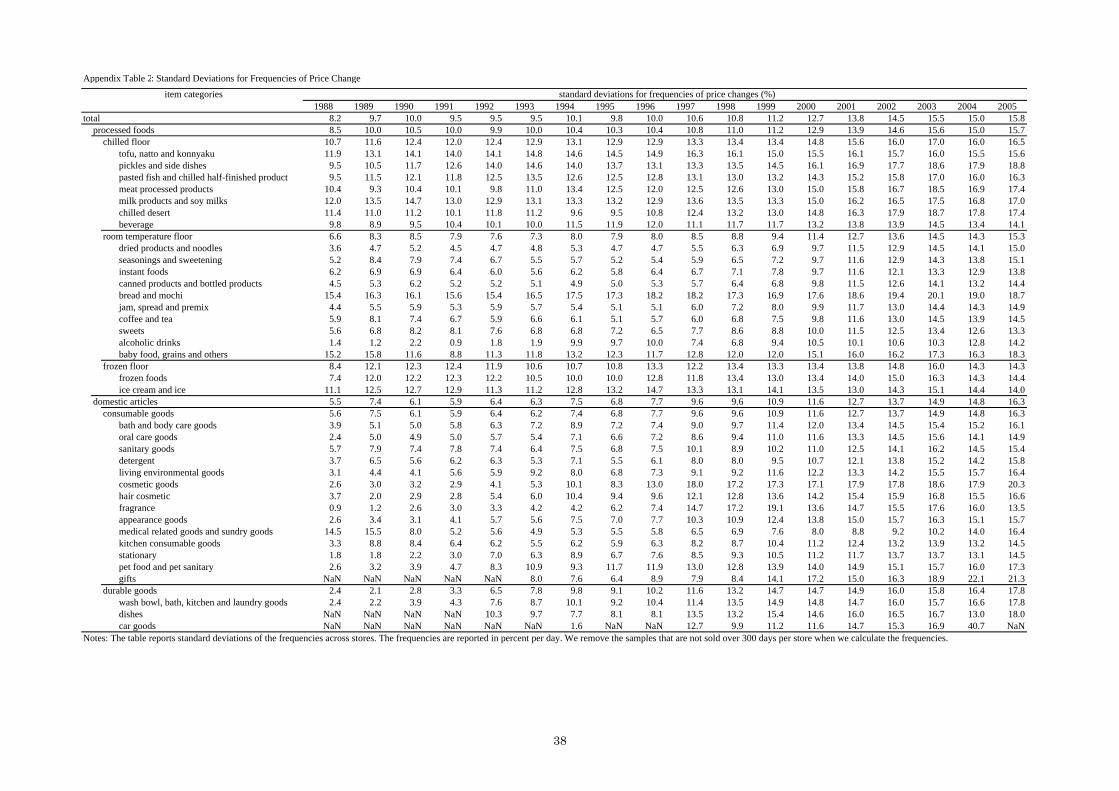
Figure 4 shows the standard deviations of the frequencies across stores.
This reveals that the price change frequency varies greatly across stores. As for
the average frequency in Figure 3, the heterogeneity also displays an
increasing trend.13
The followings summarize the information in Figures 3 and 4:
1) Prices change very frequently. Many products experience price change
within a week;
2) There are upward trends in the frequency of price changes;
3) The frequencies of price changes vary greatly between commodities;
4) The standard deviation of price changes among stores is large, implying very
heterogeneous price-setting behavior between stores.
These observational facts differ significantly from the estimates obtained
in previous work. For example, Bils and Klenow (2004) and Nakamura and
Steinsson (2007) estimated that the average spell during which prices remain
unchanged to be about 4 to 5 months. Using Japanese data, Saita and Higo
(2007) showed that the average frequency of monthly price changes of goods is
about 33.5% that is, the average spell during which prices remain unchanged is
13 Appendix Table 2 reports the standard deviations for more detailed categories.
10
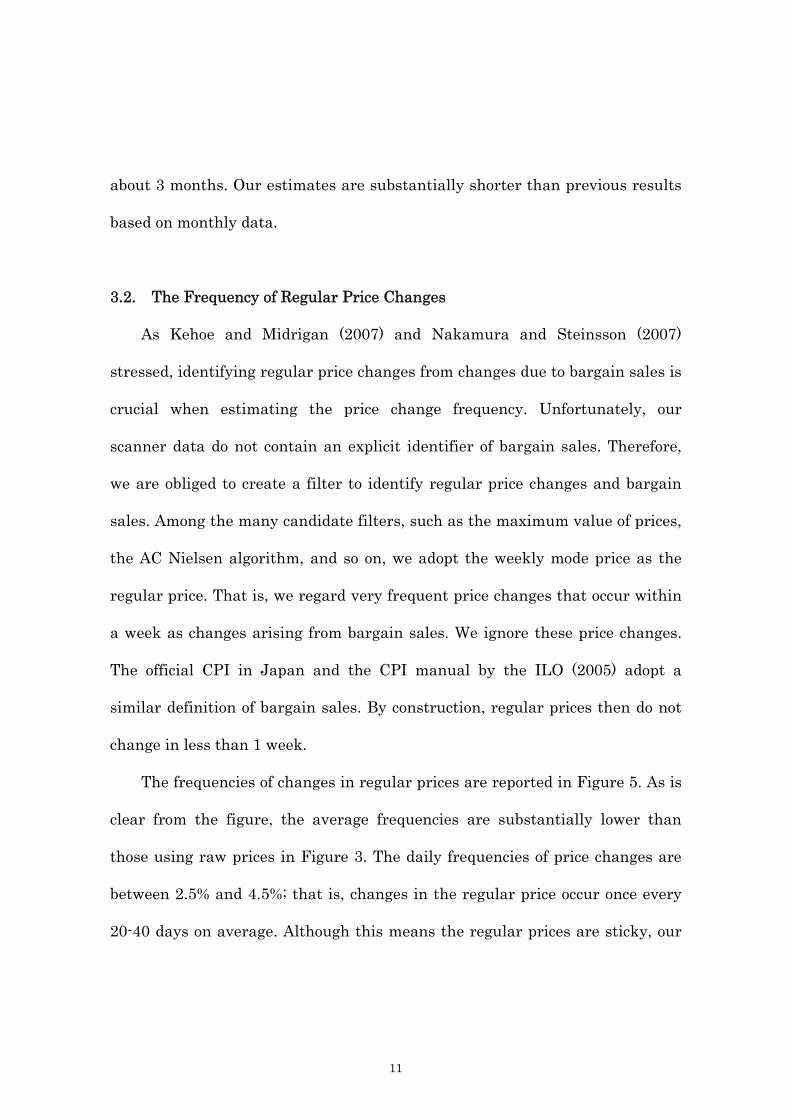
about 3 months. Our estimates are substantially shorter than previous results
based on monthly data.
3.2. The Frequency of Regular Price Changes
As Kehoe and Midrigan (2007) and Nakamura and Steinsson (2007)
stressed, identifying regular price changes from changes due to bargain sales is
crucial when estimating the price change frequency. Unfortunately, our
scanner data do not contain an explicit identifier of bargain sales. Therefore,
we are obliged to create a filter to identify regular price changes and bargain
sales. Among the many candidate filters, such as the maximum value of prices,
the AC Nielsen algorithm, and so on, we adopt the weekly mode price as the
regular price. That is, we regard very frequent price changes that occur within
a week as changes arising from bargain sales. We ignore these price changes.
The official CPI in Japan and the CPI manual by the ILO (2005) adopt a
similar definition of bargain sales. By construction, regular prices then do not
change in less than 1 week.
The frequencies of changes in regular prices are reported in Figure 5. As is
clear from the figure, the average frequencies are substantially lower than
those using raw prices in Figure 3. The daily frequencies of price changes are
between 2.5% and 4.5%; that is, changes in the regular price occur once every
20-40 days on average. Although this means the regular prices are sticky, our
11
regular prices are much more flexible than previous estimates by Nakamura
and Steinsson (2007). Secondly, and similar to Figure 3, we can observe a
positive trend in the frequency of regular price changes. Table 4 reports the
frequencies of regular price changes for each product category.
Figure 6 shows the standard deviations for frequencies of regular price
changes across stores. Similar to Figure 4, the figure reports a great degree of
heterogeneity in the regular price change frequencies. We can also observe an
upward trend in the heterogeneity.14
The followings summarize the information shown in Figures 5 and 6:
1) Regular prices do not change as rapidly as raw prices;
2) Similar to raw prices, we observe an upward trend in the frequency of
regular price changes;
3) The frequencies of regular price changes vary greatly between commodities;
4) We can observe very heterogeneous regular-price-setting behavior between
stores.
3.3. Data Frequency and the Frequency of Price Changes
So far, and based on scanner data, we have shown that prices change
considerably more rapidly than the previous estimates based on monthly
surveys by Saita and Higo (2007). In this subsection, we investigate the cause
14 Refer to Appendix Table 3 for the standard deviations of regular price change frequencies for
12

of this huge discrepancy.
Our estimates of the regular price change frequency are about 20-40 days.
This implies that if we use monthly data, the estimates of monthly price
change frequencies should lie close to unity. This is not the case. Based on our
daily scanner data, we can construct monthly data that is close to the price
data in the official CPI. More specifically, we can generate monthly data by
selecting the price of the sample on the Wednesday of the week including the
15th day of the month. Similarly to the official CPI, we select the prices of the
most popular goods only for each category over all of the stores. We can then
obtain monthly price data that is close to the official CPI.
Figure 7 reports the monthly price change frequencies based on the
monthly transformed data. According to this figure, the average spell during
which prices remain unchanged is about 3.8 months in 1988 and 2.5 months in
2005. Figure 8 reports the results of the same estimation using the regular
price data: these exhibit longer spells of 5.3 months in 1988 and 3.5 months in
2005. Refer to Table 5 for the monthly frequency of regular price for more
detailed categories.15 The estimated lengths of duration are too different from
the previous estimates based on monthly data. For example, Nakamura and
Steinsson (2007) estimate 4-5 months in the US and Saita and Higo (2007)
estimate 3 months in Japan.
each product category.
13

One possible reason for the inconsistency in the price change frequencies
between daily and monthly data is heterogeneity in price-setting behavior
between stores. Suppose that 50% of the firms change their prices every other
day, while the remaining 50% of firms never change their prices. If we use
monthly data, after 1 month has passed, 50% of firms have changed their
prices while the other 50% of firms have not. Therefore, the estimated average
spell during which prices remain unchanged is 2 months; that is to say, the
monthly frequency of price changes in this case is 50%. If we use weekly data,
after 1 week has passed, 50% of firms have changed their prices while the
remaining 50% have not. Consequently, the estimated average spell is 2 weeks;
that is, the weekly frequency of price changes is again 50%. Finally, if we use
daily data the estimated average spell becomes 4 days. As shown in Figures 4
and 6, strong heterogeneity in price setting behavior between stores exists in
our sample. This implies that the data frequency is crucial when estimating the
frequency of price changes.
3.4. Bargain Sales
In this subsection, we investigate the characteristics of the price changes
resulting from bargain sales. We consider that the product is on sale when the
price is below the regular price; that is, it is below the store weekly mode price
15 See Appendix Table 4 for the monthly frequencies of raw prices for each product category.
14
constructed in the previous section.16
Figure 9 shows the frequencies of bargain sales. The bargain frequency of
processed foods in 2005 is 17.0%, implying that the products are on bargain
sale once every 6 days. For domestic articles, the frequency is 12.6%; products
are on bargain sale once every 8 days. Again, we can observe an upward trend
in the sales frequencies. Table 6 reports the frequencies of bargain sales for
more detailed categories. Apparently, the bargain frequency varies among the
various product categories.
Figure 10 reports the ratio of the amount of selling during bargain sales to
the amount of total selling. This illustrates the relative importance of bargain
sales. The bargain sales ratio is gradually rising and reached to 23.3% in 2005.
That is, significant amounts of transactions occur during bargain sales.17 Note
that because the official CPI excludes information on sales, it implies that the
CPI excludes information on about 25% of the total expenditure on products. In
addition, it is worth noting that both bargain sales frequency and the bargain
sales ratio have been rising.
4. Construction of CPI Based on Scanner Data
The official CPI in Japan has been criticized for its lack of precision since
16 Sometimes, we encounter prices that are not integers, such as 112.54 yen. This may arise from typing errors, price variations within a day, buy one-get-one-for-free sales, etc. Because we cannot be sure of the exact cause, we round all prices to the nearest integer.
15
the mid-1990s severely. Shiratsuka (1995; 1998) have pointed out several
shortcomings of the Japanese CPI.18 The many possible sources of bias include:
(1) a lack of information about bargain sales, (2) lower substitution bias, (3) a
downward bias caused by use of the Laspeyres Index, and (4) the selection of
surveyed stores.
When constructing the CPI by using scanner data, we can avoid some of
the criticisms raised by Shiratsuka (1995; 1998). To start with, we can include
information on bargain sales. Because our data contains the information on the
quantity of units sold, we can also construct the Paasche or chain index so that
we do not have to fix the weight. We can also avoid the lower substitution bias
because we can potentially use all of the commodities sold in each category.
4.1. The Quantity Weighted Average Price and the Mode Price
In this subsection, we introduce two price index concepts. The first is the
quantity-weighted average price index where bargain sales are considered. The
second is the mode price index where only the regular price is included. The
quantity-weighted average price is calculated by taking the average sales price
17 Appendix Table 5 shows the bargain sales ratios for more detailed product categories. 18 The official CPI in Japan is constructed by the Statistical Bureau following the CPI manual by ILO (2005). The price survey is administrated every month on the Wednesday, Thursday, or Friday of the week that includes the 12th day of the month. In the survey, prices with durations shorter than 7 days are excluded as bargain sales. The number of items surveyed is limited to 584. The representative commodity in each category is selected from the viewpoint of continuance and the representative character. As the CPI is a Laspeyres Index, the weight is only altered every 5 years.
16

every day in each store using the quantity sold as the weight. The mode price
index is constructed by taking the weekly mode price of each store.19
Two time-series of aggregate inflation rates are calculated by the chain
index method using the quantity-weighted average and mode prices. More
specifically, we first obtain two time-series of monthly data for the
quantity-weighted average and mode prices. Next, if the item exists in both the
current month and the same month 1 year before, we calculate the rate of
annual price change. Finally, we take the average rate of price change across
all items and categories using the total sales amount 12 months before as the
weight.
Figure 11 reports the aggregate inflation rates of the official CPI and the
two CPI constructed in this study- the weighted means and mode indexes
based on scanner data.20 The figure shows that the three CPI are quite similar
to each other except for just a few periods.21 One difference can be observed
during the early 1990s when our POS-based CPI indicated deflation while the
official CPI showed inflation. We can also observe a departure between the
official CPI and our indexes during the early 2000s. In the early 1990s, the
degree of deflation in the quantity-weighted average prices including the
19 See the Appendix for details. 20 Our scanner data does not contain the prices of services, utilities, fresh foods, expensive durable goods, and rents. The Nikkei POS data covers 37.8% of all household expenses on goods that can be purchased in retail stores. This corresponds to 16.8% of total household expenses. 21 The ups and downs in the official CPI in 1993 and 1994 were caused by the sharp rise and
17

effects of bargain sales is larger than in regular prices. The difference between
the official CPI and our index in the early 1990s is greater for domestic articles
than processed foods.22
The followings summarize the comparison of the official and scanner-based
CPI:
1) Our scanner-based CPI can generally reproduce the rate of price change in
the official CPI;
2) The rate of change in the CPI based on the regular (mode) price moves more
closely to the rate of change in the CPI based on the quantity-weighted average
price than the rate of change in the official CPI;
3) Our CPI based on the POS indicated deflation in the first half of the 1990s
while the official CPI continued to exhibit inflationary tendencies;
4) Conversely, during the 2000s, the official CPI tended to exhibit deflation
more severely than the CPI based on the scanner data.
4.2. Lower Substitution and Bargain Sale Bias
The rate of change in our CPI based on the scanner data consists of not
only the rates of price change of one representative commodity in each category,
fall in rice prices. 22 If the rate of price change in the CPI based on the scanner data captures the true inflation rate, the real rate of interest wages at this time are considerably higher than the current estimates based on the official CPI. There is the possibility that the high levels of real interest and wage rates were one of the causes of the low growth period during the 1990s, known in Japan as the “lost decade”.
18

but also those of many alternative items in each category. Since the Boskin
report (1996), the reliance of the CPI on the representative item has been
criticized as a source of the lower substitution bias. The lower substitution bias
occurs when consumers shift their demand from the representative items
adopted by the CPI to other items with lower prices. Because the official CPI
considers only the representative commodity in each category, the decline in
the average prices consumers experience is not recorded in the official CPI.23
In this subsection, we examine the degree of lower substitution bias based on
scanner data in Japan.
Another possible important source of bias in the official CPI raised by
previous studies is the exclusion of items sold during bargain sales. If more and
more goods are sold during bargain sales, the average price level consumers
face will decrease. The official CPI, however, fails to capture the decline
because the CPI ignores the effects of bargain sales.
Figure 12(a) reports the comparison of the rate of price change for “instant
noodle” in the official CPI with the rate of price change for “Nissin Cup Noodle”.
“Nissin Cup Noodle” is the item adopted in the official CPI. It is also the most
sold item in this category in our scanner data. While instant noodle in the
official CPI exhibits neither inflation nor deflation, “Nissin Cup Noodle” in the
Nikkei-POS experiences deflation during the first half of the 1990s. In the
23 It provides an upward bias from the true price in the official CPI. The Boskin report (1996)
19

early 2000s, while instant noodle in the official CPI fell into severe deflation,
the deflation of “Nissin Cup Noodle” in the Nikkei-POS remained mild. We
suspect that these discrepancies occur because the official CPI does not capture
the prices sold at bargain sales.
In order to investigate the effects of lower substitution bias and the effects
of bargain sales, we compare the rate of price change for “Nissin Cup Noodle”, a
product bundle that consists of the upper 5% of items in terms of the total sales
and the entire items in the category of instant noodle.
From Figure 12(a), we can observe that the movement of the bundle of the
upper 5% of items is extremely similar to that for all items in this category. In
addition, though “Nissin Cup Noodle” experienced deflation more frequently
than all other items, the total rate of price change is lower than for the official
CPI. Therefore, the difference between the rate of price change for instant
noodle in the official CPI and the rates of price changes for all products is
brought about not by the lower substitution bias, but rather by the exclusion of
bargain sales in the official CPI.
In Figure 12 (b), movements in the rate of change for the mode price of
“Nissin Cup Noodle” trace those for instant noodle in the Official CPI very well
until the end of the 1990s. The movements of regular prices of the upper 5% of
items and all items also trace the official CPI well. Therefore, we can surmise
emphasizes the significance of this bias.
20

that the lower substitution bias is not important in terms of the regular price
during this period. We can also observe that in the early 1990s, the departure
between the official CPI and scanner-based CPI arises from the exclusion of
bargain sales in the official CPI because our mode price traces the movement of
the official CPI. In the 2000s, however, the aggregated mode price traces the
official CPI very poorly.24
Figure 13 shows the lower substitution effect in all categories. This figure
indicates that it was bargain sales effects, not the substitution effect, which
played an important role in the deflation of the 1990s. Figure 14 shows the
average inflation rates during the post bubble period (after March 1991) in the
official CPI and our CPI for processed foods and domestic articles. The
average price down rate of the most sold item is larger. This indicates that the
lower substitution bias was not a serious problem in the official Japanese CPI
during the post bubble period.
4.3. The Correlation with GDP Gaps
In this subsection, we examine the relationship between scanner-based
CPI and the GDP gap. Figure 15 plots our CPI, the official CPI, and the GDP
gap in Japan.25 Because our CPI includes information on changes in the
24 The cause of the departure is not clear. Further investigation is required . 25 We estimate the GDP gap from the log of real GDP data using the Hodrick-Prescott filter ( 1600=λ ).
21
frequency of bargain sales and changes in sales quantities, it is expected that
our CPI is more sensitive to economic fluctuations than the official CPI.
Figure 16 shows the cross-correlations between the inflation rates of these
price indexes and the GDP gap. In both (a) processed foods and domestic
articles and (b) processed foods excluding cereals, our CPI has a higher
correlation with the GDP gap and smaller lags than the official CPI. Table 7
reports the cross-correlations table between the inflation rates and the GDP
gap with significance test statistics. In lag terms, we can observe significant
correlations for both our CPI (denoted as POS) and the official CPI with the
GDP gap, though in lead terms the level of significance is low. The correlation
between the CPI based on POS and the GDP gap is 0.58 for a one-quarter lag,
while the highest correlation value for the official CPI is 0.52 for a two-quarter
lag. Therefore, we can generally observe that our CPI based on scanner data
has a higher correlation with the GDP gap than the official CPI. This is
probably because our CPI contains more information on bargain sales and the
quantity sold on sale.
5. Concluding Remarks
In this paper, we investigated both micro and macro price dynamics using
large-scale daily scanner data in Japan. We found:
1) Prices change very frequently. Most products change their prices within 1
22

week;
2) The frequency varies greatly between products and stores;
3) Even excluding price changes related to bargain sales, prices are much more
flexible than indicated by previous estimates based on monthly data;
4) Monthly data constructed using our data for only a particular day in a
month shows almost the same frequency of price change as previous research;
5) The frequency of price changes is increasing, not constant over time;
6) Movements in the CPI based on our data are similar to the official CPI
except during the early 1990s;
7) Our analysis indicates that the deflation of the early 1990s was not caused
by lower substitution bias. Rather, it is mainly the result of by bargain sales;
8) The CPI based on our data has a higher correlation with the GDP gap than
the official CPI.
Our results cast doubts on the standard assumption adopted by many New
Keynesian models that the aggregate price is sticky because individual prices
are sticky. Importantly, our research raises the question of why the aggregate
price is sticky although individual prices are not.
We have also shown the possibility that the official CPI fails to capture the
true inflation rates in the early 1990s. Our scanner-based CPI suggests that
the true inflation rate fell into deflation during this period. This implies that
real interest rates and real wage rates were higher than previous estimates
23
based on the official CPI. Because the official CPI is an important indicator for
policymakers such as the central bank, the failure of the official CPI to capture
deflation may have lead the central bank make errors in their timing of
monetary policy. Quantitative evaluation of these causalities is to be
investigated by the authors in the near future.
24

APPENDIX: Definitions and Procedures
A.1. The Quantity-Weighted Average Price (Daily)
The price of the weighted average by sales quantity for an item Ii∈ in a
day td is defined by:
,,,
,,
stdis
tdiSs
stdi
Ss
Weighttdi P
P∑
=∈∈
∑
where stdiP , is the price for the item Ii∈ sold at the store Ss∈ in the day td .
stdiQ , is the quantity for the item Ii∈ sold at the store Ss∈ in the day td .
A.2. The Mode Price (Daily)
The mode price for an item Ii∈ sold in a day td is defined by:
),(mode ,,,
ModestdiSs
Modetdi PP ∈=
where ModestdiP ,
, is the mode price for an item Ii∈ sold at a store Ss∈ in the
day td . That is:
),(mode ,,
,,
Rstditwtd
Modestdi PP ∈=
where tw is the week that includes the day td and RstdiP ,
, is the value of stdiP , ,
which is rounded off to become an integer. If multiple modes exist, we select
the highest value as the mode price.
A.3. The Bargain Sales
25

If 2,,
,, >− Rs
tdiModes
tdi PP , then we regard the commodity as being on sale. Note that
we use the two-yen criterion to avoid identifying sales caused by rounding
errors.
A.4. The Quantity-Weighted Average Price (Monthly)
The price of the weighted average by sales quantity for an item Ii∈ in a
month tm is defined by:
.,,
,,
Weighttdis
tdiSstmtd
stdiSs
tmtd
Weighttmi P
P∑∑
∑=
∈∈
∈
∈∑
It is the value of the monthly weighted average of WeighttdiP , by sales quantity.
A.5. The Mode Price (Monthly)
The mode price for item Ii∈ in a month tm is defined by
.,,
,,
Modetdis
tdiSstmtd
stdiSs
tmtd
Modetmi P
P∑∑
∑=
∈∈
∈
∈∑
It is the value of the monthly weighted average of ModetdiP , by sales quantity.
A.6. The Aggregate Price Change Rates by Chain Index Method
Suppose that stmiS , is the sales amount of item Ii∈ in store Ss∈ .The
aggregate price change rate of item classification of jC is defined by
26

,112,
,12,,
⎥⎥⎦
⎤
⎢⎢⎣
⎡⎟⎟⎠
⎞⎜⎜⎝
⎛−×=Π
−−
∈∑ N
tmi
Ntmi
tmiCi
NtmC P
PW
j
j
where,
stmiSsCi
stmiSs
tmi SS
Wj ,
,,
∑∑
∑=
∈∈
∈ , N = weight or mode.
WeighttmC j ,
Π denotes the aggregate price change rate for the quantity weighted
average, while ModetmC j ,Π denotes the aggregate price change rate for the mode
prices.
27
References
1) Advisory Commission to Study the Consumer Price Index, (1996): Toward a
More Accurate Measure of the Cost of Living: Final Report.
2) Baharad, E. and B. Eden (2004): “Price Rigidity and Price Dispersion:
Evidence Based on the Micro Data,” Review of Economic Dynamics, 7, pp.
613-641.
3) Bils, M., and P. J. Klenow (2004): Some Evidence on the Importance of
Sticky Prices," Journal of Political Economy, 112(5), 947-985.
4) Calvo, G. A. (1983): Staggered Prices in a Utility-Maximizing Framework,"
Journal of Monetary Economics, 12, 383-398.
5) Caplin, A., and D. Spulber (1987): Menu Costs and the Neutrality of
Money," Quarterly Journal of Economics, 102(4), 703-725.
6) Chevalier J. A., A. K. Kashyap, and P. E. Rossi (2003): Why Don't Prices
Rise during Periods of Peak Demand? Evidence from Scanner Date The
American Economic Review Vol. 93, No.1, 15-37
7) Dhyne, E., L. J. Álvarez, H. L. Bihan, G. Veronese, D. Dias, J. Hoffmann, N.
Jonker,P. Lunnemann, F. Rumler, and J. Vilmunen (2005): Price Setting in
the Euro Area : Some Stylized Facts From Individual Consumer Price
Data," Working Paper Series No. 524
8) Golosov, M., and R. E. Lucas (2007): Menu Costs and Phillips Curves
Journal of Political Economy, Vol.115, 171-199
28

9) International Labor Organization (ILO) (2005): Consumer Price Index
Manual: Theory And Practice.
10) Kashyap, A. K. (1995): Sticky Prices: New Evidence from Retail Catalogs,"
Quarterly Journal of Economics, 110, 245-274.
11) Kehoe, P., and V. Midrigan (2007): Sales, Clustering of Price Changes, and
the Real Effects of Monetary Policy," Working Paper, University of
Minnesota.
12) Miyao, R., (2001) “Changes in GDP Gap and Structural Changes in Supply
Side,” (in Japanese), Bank of Japan Working Paper Series, Working Paper
01-18.
13) Nakamura, E., and J. Steinsson (2007): Five Facts about Prices: A
Reevaluation of Menu Cost Model," Working Paper, Harvard University.
14) Saita, Y., and M. Higo, (2006): Price Setting in Japan: Evidence from CPI
Micro Data, Bank of Japan Working Paper Series, No. 07-E-20.
15) Sakura, K., Sasaki, H. and Higo, M., (2005) “Economic Fluctuation of Japan
after 1990's: Fact Findings,” (in Japanese), Bank of Japan Working Paper
Series, No.05-J-10.
16) Shiratsuka, S., (1999): Measurement Errors in the Japanese: Consumer
Price Index, Monetary and Economic Studies.
17) Taylor, J. B. (1980): Aggregate Dynamics and Staggered Contracts,"
Journal of Political Economy, 88, 1-23.
29

18) Weinstein, David E. and Christian Broda (2007): Product Creation and
Destruction: Evidence and Price Implications, "NBER Working Paper No.
13041.
19) Shiratsuka, S., (1995): “Measurement Errors in the Japanese: Consumer
Price Index," (in Japanese), Kinyu Kenkyu No.14-2, pp. 1-45.
20) Shiratsuka, S., (1998): An Economic Analysis of Pricing, (in Japanese),
University of Tokyo Press.
21) Saison Research Institute (2001): “A Study on the Price Index based on a
POS data of Major Supermarket Chain (2001 version),” (in Japanese).
30

Table 1Summary of Basic Information on Nikkei-POS
CY Stores Items Sales(mil.;yen) Sales/store(mil.;yen) Observations1988 29 88,248 24,969 861 25,399,3071989 45 118,608 38,858 864 39,974,9301990 50 131,412 47,951 959 46,470,0611991 53 133,445 56,613 1,068 50,793,2161992 62 136,179 67,407 1,087 56,118,6951993 65 140,278 75,491 1,161 61,427,1161994 103 157,457 115,864 1,125 91,735,6081995 124 169,621 149,349 1,204 119,979,6241996 132 177,344 180,689 1,369 150,404,9051997 150 194,804 206,076 1,374 172,085,4351998 172 219,063 262,931 1,529 218,527,5241999 172 226,004 265,886 1,546 226,289,8602000 189 251,052 276,477 1,463 242,357,3542001 187 265,622 301,497 1,612 274,319,0882002 198 276,496 314,058 1,586 283,433,2702003 188 259,692 264,395 1,406 242,425,0882004 202 279,751 306,378 1,517 282,074,7252005 187 288,634 329,340 1,761 309,888,227Sum 3,284,230 23,493 2,893,704,033
Table 2Locational Distribution of Nikkei POS
Area Retail ShopsHokkaido 11Tohoku 19Kanto 90Chubu 43Kinki 57Chugoku-Shikoku 24Kyushu 36Total 280
Note: The data does not cover November and December, 2003.
31

Table 3: Frequencies of Price Changes
1988 1989 1990 1991 1992 1993 1994 1995 1996 1997 1998 1999 2000 2001 2002 2003 2004 2005total 14.1 14.4 14.9 15.3 16.3 17.2 17.3 17.0 16.3 17.7 18.4 19.3 21.4 24.4 26.7 28.3 32.2 34.6
processed foods 15.1 15.3 15.9 16.4 17.5 18.4 18.4 18.1 17.2 18.3 19.1 20.1 22.3 25.2 27.4 28.9 32.5 35.0chilled floor 20.1 20.1 20.9 22.0 23.5 25.6 25.0 24.7 23.1 24.2 25.6 26.4 28.4 31.1 32.7 34.5 37.5 39.7
tofu, natto and konnyaku 20.4 20.0 21.7 23.7 27.0 31.8 31.5 30.7 29.4 31.3 34.7 34.1 34.7 35.9 37.3 38.7 41.6 42.6pickles and side dishes 17.0 18.7 20.4 23.7 26.5 28.8 27.6 27.1 23.9 24.0 25.5 27.4 29.7 33.1 35.4 37.8 41.2 44.2pasted fish and chilled half-finished product 21.7 22.6 23.0 23.9 26.4 28.6 27.9 26.8 25.6 27.2 29.4 30.6 32.9 35.5 37.6 39.8 42.8 44.3meat processed products 9.5 9.5 10.3 10.4 11.6 12.6 13.7 14.8 14.4 14.5 15.3 17.1 21.0 26.0 28.8 32.2 36.3 38.8milk products and soy milks 28.5 27.5 28.2 29.0 29.3 31.1 30.4 30.4 27.1 28.7 30.3 31.0 32.4 34.1 34.3 35.8 38.6 40.9chilled desert 18.3 18.2 17.7 20.7 23.5 24.7 21.0 19.9 20.9 24.1 28.0 29.8 35.1 39.9 41.8 42.9 45.2 46.1beverage 9.9 10.1 11.1 12.0 12.2 12.4 12.5 12.5 13.1 13.6 12.7 13.5 16.4 19.7 21.8 22.8 26.0 28.4
room temperature floor 10.6 10.8 11.3 11.3 12.1 12.4 12.6 12.3 12.0 13.2 13.6 14.7 17.1 20.4 22.8 24.1 28.3 31.0dried products and noodles 5.3 5.9 6.8 7.1 7.7 7.9 8.0 6.7 6.6 7.3 7.4 8.3 10.4 14.0 16.5 18.3 23.3 25.8seasonings and sweetening 8.7 9.3 9.6 9.3 9.5 9.1 9.1 8.4 8.2 8.9 8.9 9.9 11.8 15.2 17.6 19.2 24.4 26.7instant foods 7.9 8.0 8.9 8.7 9.1 8.8 9.1 8.5 8.6 9.3 9.7 10.9 12.9 16.1 18.4 19.5 23.8 26.3canned products and bottled products 5.8 6.2 7.1 7.2 8.0 8.0 7.9 7.8 7.4 7.7 8.0 9.0 11.8 14.9 17.1 18.6 24.3 27.5bread and mochi 30.1 27.0 27.1 27.2 30.7 33.5 33.3 33.7 31.8 33.8 36.0 38.5 41.7 44.2 45.6 47.7 49.8 52.4jam, spread and premix 5.0 5.5 6.6 6.5 6.8 6.8 6.7 6.2 6.2 7.2 7.4 8.4 10.4 14.0 16.4 18.1 23.0 25.2coffee and tea 11.0 10.3 9.8 9.4 9.8 9.9 9.9 8.5 8.6 9.2 9.5 10.5 12.6 16.5 19.5 20.5 26.1 29.2sweets 7.8 8.6 10.0 10.5 11.1 10.6 10.5 9.8 9.7 11.0 11.4 12.3 14.3 17.5 19.8 21.2 25.8 27.7alcoholic drinks 1.8 1.5 1.7 0.9 1.8 1.5 4.8 5.4 6.8 6.9 6.5 7.7 10.2 13.1 14.1 13.9 17.7 19.9baby food, grains and others 21.0 18.3 13.9 13.7 16.5 19.3 19.3 20.7 19.7 22.2 22.4 22.9 26.3 30.7 33.6 34.9 38.2 41.9
frozen floor 15.7 15.7 16.0 17.1 16.9 15.9 16.4 17.3 20.2 21.3 22.7 24.6 26.9 29.5 32.8 35.1 37.6 39.2frozen foods 15.2 15.5 15.8 17.0 17.4 16.5 16.9 17.4 20.5 21.9 23.4 25.7 27.9 30.5 34.0 36.3 39.1 40.5ice cream and ice 16.9 16.1 16.5 17.5 15.6 14.2 15.0 17.2 19.4 19.7 20.3 21.3 23.8 26.1 29.3 32.0 33.8 35.6
domestic articles 5.4 7.2 7.5 7.8 9.0 9.4 9.6 9.7 10.4 13.2 13.0 14.1 15.5 18.4 22.3 24.1 29.2 31.3consumable goods 5.4 7.3 7.5 7.9 9.0 9.4 9.6 9.7 10.4 13.2 13.0 14.1 15.5 18.4 22.3 24.1 29.2 31.3
bath and body care goods 5.8 6.3 7.3 7.7 9.5 10.8 11.2 11.7 11.2 13.3 13.3 14.6 15.3 18.6 23.6 25.8 30.3 32.1oral care goods 4.1 5.1 5.8 6.1 7.6 8.3 8.7 9.1 8.9 10.8 10.9 12.4 13.7 17.0 21.6 23.4 27.6 28.7sanitary goods 9.6 12.3 12.1 12.9 12.9 12.6 13.2 13.0 13.0 15.9 15.8 17.1 18.6 22.2 26.4 29.9 33.5 35.6detergent 8.7 10.2 9.6 10.3 11.2 11.1 11.2 10.5 10.7 12.9 12.9 13.8 15.3 18.7 23.0 24.8 29.7 31.6living environmental goods 5.1 5.4 5.7 6.7 8.5 9.3 9.9 9.2 9.5 12.1 11.6 13.5 14.7 19.4 23.7 26.2 30.7 31.9cosmetic goods 2.2 4.7 4.1 4.2 6.7 6.8 8.3 10.7 20.0 30.9 29.9 30.1 30.5 33.5 36.3 36.9 39.9 44.4hair cosmetic 1.4 3.1 3.4 3.5 6.7 9.0 10.3 11.7 11.6 15.7 16.7 17.3 18.9 22.6 27.5 30.2 34.8 36.4fragrance 0.5 0.9 3.4 3.5 5.0 6.9 7.6 9.8 16.3 26.5 34.2 33.2 34.1 36.2 40.1 45.7 37.0 32.6appearance goods 1.5 2.7 3.5 4.3 6.5 8.1 8.6 8.9 9.7 12.8 13.1 14.7 16.8 20.5 24.5 27.8 30.0 31.7medical related goods and sundry goods 1.6 2.6 3.0 2.4 3.1 3.7 4.3 4.6 4.6 5.6 5.6 5.7 6.1 7.2 9.0 9.0 18.5 22.8kitchen consumable goods 3.2 5.5 5.8 6.0 8.2 9.2 9.4 8.9 8.8 10.4 10.6 12.1 13.7 16.5 19.9 21.4 25.8 26.5stationary 0.6 1.3 1.6 3.3 4.8 6.9 7.3 7.1 7.2 9.3 9.1 11.0 13.3 15.2 19.7 20.7 23.5 25.9pet food and pet sanitary 3.2 4.5 5.6 6.3 8.2 9.5 9.6 12.0 11.1 12.7 13.5 15.0 16.8 19.5 23.5 24.8 32.0 35.2gifts NaN 0.0 0.0 0.0 0.0 14.6 14.7 6.6 9.7 9.2 8.4 14.8 17.2 22.4 31.0 30.0 32.2 33.8
durable goods 0.8 2.6 3.0 4.1 5.6 8.5 9.6 9.3 10.2 13.4 12.4 15.5 16.5 18.5 23.8 25.2 29.6 32.9wash bowl, bath, kitchen and laundry goods 0.8 2.7 3.8 4.9 6.3 9.3 9.6 9.2 10.0 12.9 12.0 14.8 15.7 17.8 22.6 24.3 29.1 32.6dishes 0.0 0.0 0.0 0.0 14.6 13.5 11.8 10.7 13.1 18.2 17.0 21.6 22.5 23.9 31.8 33.1 36.1 40.2car goods NaN 2.6 0.9 1.2 1.1 0.6 0.5 3.0 2.0 14.3 11.5 12.7 11.5 18.6 25.4 22.3 23.8 62.7
item categories frequencies of price changes (%)
Notes: All frequencies are reported in percent per day. The frequencies are calculated by: (i) rounding prices off below the decimal point to remove the effects of time sales within each day, (ii) taking the means of dummy variables that take a value ofunity when the price is different from the day before, (iii) calculating the item category level frequencies using the weighted average of item level frequencies with sales weights, and (iv) calculating the total level frequencies by weighted average ofitem category level frequencies by sales weights. Note that we remove samples that are not sold over 300 days per store when we calculate the frequencies.
32
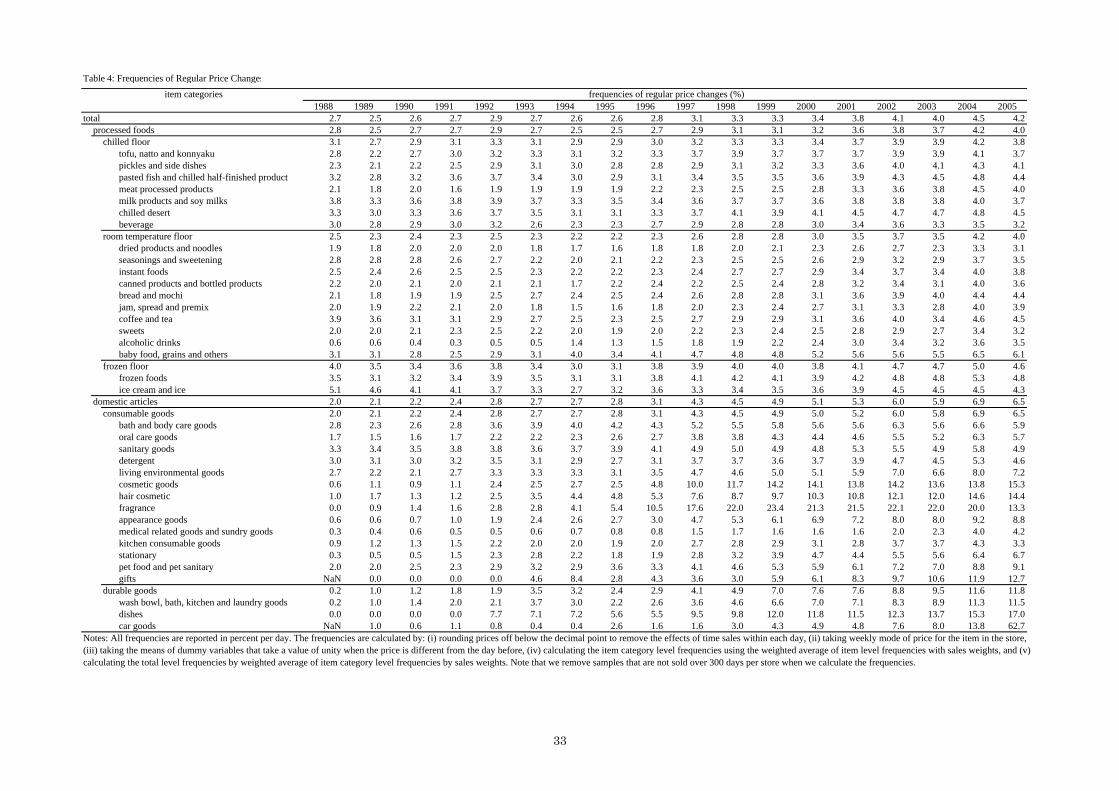
Table 4: Frequencies of Regular Price Changes
1988 1989 1990 1991 1992 1993 1994 1995 1996 1997 1998 1999 2000 2001 2002 2003 2004 2005total 2.7 2.5 2.6 2.7 2.9 2.7 2.6 2.6 2.8 3.1 3.3 3.3 3.4 3.8 4.1 4.0 4.5 4.2
processed foods 2.8 2.5 2.7 2.7 2.9 2.7 2.5 2.5 2.7 2.9 3.1 3.1 3.2 3.6 3.8 3.7 4.2 4.0chilled floor 3.1 2.7 2.9 3.1 3.3 3.1 2.9 2.9 3.0 3.2 3.3 3.3 3.4 3.7 3.9 3.9 4.2 3.8
tofu, natto and konnyaku 2.8 2.2 2.7 3.0 3.2 3.3 3.1 3.2 3.3 3.7 3.9 3.7 3.7 3.7 3.9 3.9 4.1 3.7pickles and side dishes 2.3 2.1 2.2 2.5 2.9 3.1 3.0 2.8 2.8 2.9 3.1 3.2 3.3 3.6 4.0 4.1 4.3 4.1pasted fish and chilled half-finished product 3.2 2.8 3.2 3.6 3.7 3.4 3.0 2.9 3.1 3.4 3.5 3.5 3.6 3.9 4.3 4.5 4.8 4.4meat processed products 2.1 1.8 2.0 1.6 1.9 1.9 1.9 1.9 2.2 2.3 2.5 2.5 2.8 3.3 3.6 3.8 4.5 4.0milk products and soy milks 3.8 3.3 3.6 3.8 3.9 3.7 3.3 3.5 3.4 3.6 3.7 3.7 3.6 3.8 3.8 3.8 4.0 3.7chilled desert 3.3 3.0 3.3 3.6 3.7 3.5 3.1 3.1 3.3 3.7 4.1 3.9 4.1 4.5 4.7 4.7 4.8 4.5beverage 3.0 2.8 2.9 3.0 3.2 2.6 2.3 2.3 2.7 2.9 2.8 2.8 3.0 3.4 3.6 3.3 3.5 3.2
room temperature floor 2.5 2.3 2.4 2.3 2.5 2.3 2.2 2.2 2.3 2.6 2.8 2.8 3.0 3.5 3.7 3.5 4.2 4.0dried products and noodles 1.9 1.8 2.0 2.0 2.0 1.8 1.7 1.6 1.8 1.8 2.0 2.1 2.3 2.6 2.7 2.3 3.3 3.1seasonings and sweetening 2.8 2.8 2.8 2.6 2.7 2.2 2.0 2.1 2.2 2.3 2.5 2.5 2.6 2.9 3.2 2.9 3.7 3.5instant foods 2.5 2.4 2.6 2.5 2.5 2.3 2.2 2.2 2.3 2.4 2.7 2.7 2.9 3.4 3.7 3.4 4.0 3.8canned products and bottled products 2.2 2.0 2.1 2.0 2.1 2.1 1.7 2.2 2.4 2.2 2.5 2.4 2.8 3.2 3.4 3.1 4.0 3.6bread and mochi 2.1 1.8 1.9 1.9 2.5 2.7 2.4 2.5 2.4 2.6 2.8 2.8 3.1 3.6 3.9 4.0 4.4 4.4jam, spread and premix 2.0 1.9 2.2 2.1 2.0 1.8 1.5 1.6 1.8 2.0 2.3 2.4 2.7 3.1 3.3 2.8 4.0 3.9coffee and tea 3.9 3.6 3.1 3.1 2.9 2.7 2.5 2.3 2.5 2.7 2.9 2.9 3.1 3.6 4.0 3.4 4.6 4.5sweets 2.0 2.0 2.1 2.3 2.5 2.2 2.0 1.9 2.0 2.2 2.3 2.4 2.5 2.8 2.9 2.7 3.4 3.2alcoholic drinks 0.6 0.6 0.4 0.3 0.5 0.5 1.4 1.3 1.5 1.8 1.9 2.2 2.4 3.0 3.4 3.2 3.6 3.5baby food, grains and others 3.1 3.1 2.8 2.5 2.9 3.1 4.0 3.4 4.1 4.7 4.8 4.8 5.2 5.6 5.6 5.5 6.5 6.1
frozen floor 4.0 3.5 3.4 3.6 3.8 3.4 3.0 3.1 3.8 3.9 4.0 4.0 3.8 4.1 4.7 4.7 5.0 4.6frozen foods 3.5 3.1 3.2 3.4 3.9 3.5 3.1 3.1 3.8 4.1 4.2 4.1 3.9 4.2 4.8 4.8 5.3 4.8ice cream and ice 5.1 4.6 4.1 4.1 3.7 3.3 2.7 3.2 3.6 3.3 3.4 3.5 3.6 3.9 4.5 4.5 4.5 4.3
domestic articles 2.0 2.1 2.2 2.4 2.8 2.7 2.7 2.8 3.1 4.3 4.5 4.9 5.1 5.3 6.0 5.9 6.9 6.5consumable goods 2.0 2.1 2.2 2.4 2.8 2.7 2.7 2.8 3.1 4.3 4.5 4.9 5.0 5.2 6.0 5.8 6.9 6.5
bath and body care goods 2.8 2.3 2.6 2.8 3.6 3.9 4.0 4.2 4.3 5.2 5.5 5.8 5.6 5.6 6.3 5.6 6.6 5.9oral care goods 1.7 1.5 1.6 1.7 2.2 2.2 2.3 2.6 2.7 3.8 3.8 4.3 4.4 4.6 5.5 5.2 6.3 5.7sanitary goods 3.3 3.4 3.5 3.8 3.8 3.6 3.7 3.9 4.1 4.9 5.0 4.9 4.8 5.3 5.5 4.9 5.8 4.9detergent 3.0 3.1 3.0 3.2 3.5 3.1 2.9 2.7 3.1 3.7 3.7 3.6 3.7 3.9 4.7 4.5 5.3 4.6living environmental goods 2.7 2.2 2.1 2.7 3.3 3.3 3.3 3.1 3.5 4.7 4.6 5.0 5.1 5.9 7.0 6.6 8.0 7.2cosmetic goods 0.6 1.1 0.9 1.1 2.4 2.5 2.7 2.5 4.8 10.0 11.7 14.2 14.1 13.8 14.2 13.6 13.8 15.3hair cosmetic 1.0 1.7 1.3 1.2 2.5 3.5 4.4 4.8 5.3 7.6 8.7 9.7 10.3 10.8 12.1 12.0 14.6 14.4fragrance 0.0 0.9 1.4 1.6 2.8 2.8 4.1 5.4 10.5 17.6 22.0 23.4 21.3 21.5 22.1 22.0 20.0 13.3appearance goods 0.6 0.6 0.7 1.0 1.9 2.4 2.6 2.7 3.0 4.7 5.3 6.1 6.9 7.2 8.0 8.0 9.2 8.8medical related goods and sundry goods 0.3 0.4 0.6 0.5 0.5 0.6 0.7 0.8 0.8 1.5 1.7 1.6 1.6 1.6 2.0 2.3 4.0 4.2kitchen consumable goods 0.9 1.2 1.3 1.5 2.2 2.0 2.0 1.9 2.0 2.7 2.8 2.9 3.1 2.8 3.7 3.7 4.3 3.3stationary 0.3 0.5 0.5 1.5 2.3 2.8 2.2 1.8 1.9 2.8 3.2 3.9 4.7 4.4 5.5 5.6 6.4 6.7pet food and pet sanitary 2.0 2.0 2.5 2.3 2.9 3.2 2.9 3.6 3.3 4.1 4.6 5.3 5.9 6.1 7.2 7.0 8.8 9.1gifts NaN 0.0 0.0 0.0 0.0 4.6 8.4 2.8 4.3 3.6 3.0 5.9 6.1 8.3 9.7 10.6 11.9 12.7
durable goods 0.2 1.0 1.2 1.8 1.9 3.5 3.2 2.4 2.9 4.1 4.9 7.0 7.6 7.6 8.8 9.5 11.6 11.8wash bowl, bath, kitchen and laundry goods 0.2 1.0 1.4 2.0 2.1 3.7 3.0 2.2 2.6 3.6 4.6 6.6 7.0 7.1 8.3 8.9 11.3 11.5dishes 0.0 0.0 0.0 0.0 7.7 7.1 7.2 5.6 5.5 9.5 9.8 12.0 11.8 11.5 12.3 13.7 15.3 17.0car goods NaN 1.0 0.6 1.1 0.8 0.4 0.4 2.6 1.6 1.6 3.0 4.3 4.9 4.8 7.6 8.0 13.8 62.7
item categories frequencies of regular price changes (%)
Notes: All frequencies are reported in percent per day. The frequencies are calculated by: (i) rounding prices off below the decimal point to remove the effects of time sales within each day, (ii) taking weekly mode of price for the item in the store,(iii) taking the means of dummy variables that take a value of unity when the price is different from the day before, (iv) calculating the item category level frequencies using the weighted average of item level frequencies with sales weights, and (v)calculating the total level frequencies by weighted average of item category level frequencies by sales weights. Note that we remove samples that are not sold over 300 days per store when we calculate the frequencies.
33
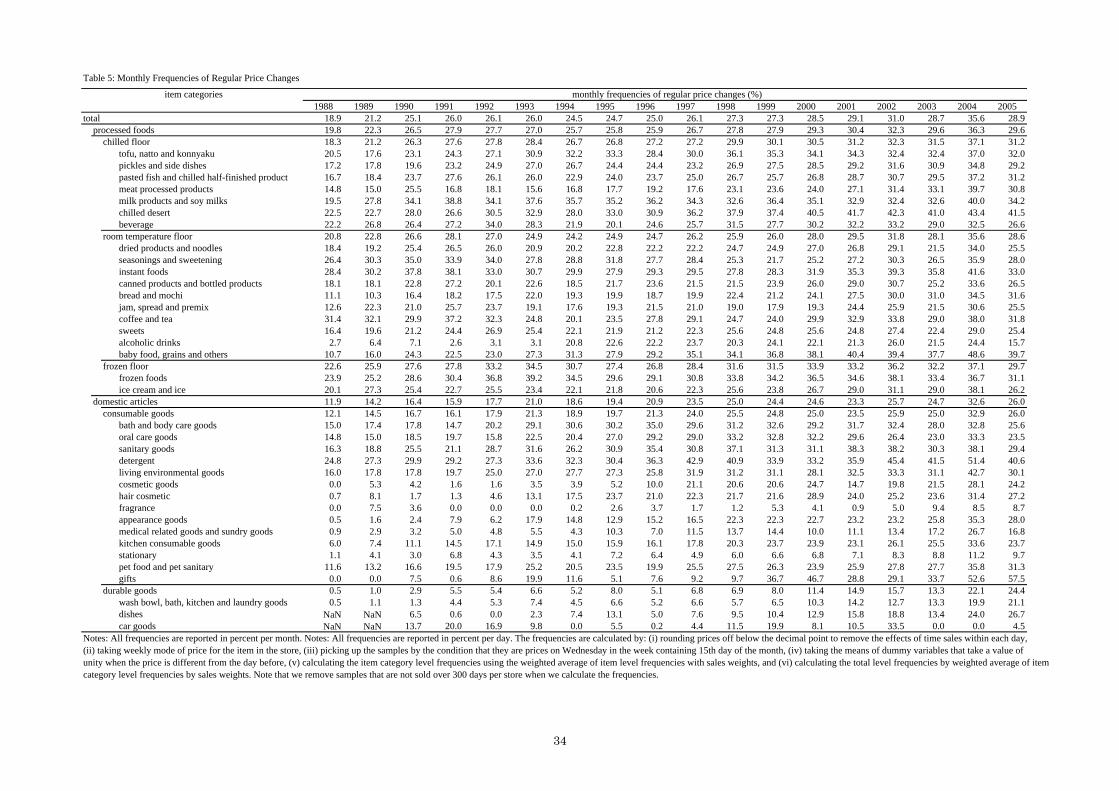
Table 5: Monthly Frequencies of Regular Price Changes
1988 1989 1990 1991 1992 1993 1994 1995 1996 1997 1998 1999 2000 2001 2002 2003 2004 2005total 18.9 21.2 25.1 26.0 26.1 26.0 24.5 24.7 25.0 26.1 27.3 27.3 28.5 29.1 31.0 28.7 35.6 28.9
processed foods 19.8 22.3 26.5 27.9 27.7 27.0 25.7 25.8 25.9 26.7 27.8 27.9 29.3 30.4 32.3 29.6 36.3 29.6chilled floor 18.3 21.2 26.3 27.6 27.8 28.4 26.7 26.8 27.2 27.2 29.9 30.1 30.5 31.2 32.3 31.5 37.1 31.2
tofu, natto and konnyaku 20.5 17.6 23.1 24.3 27.1 30.9 32.2 33.3 28.4 30.0 36.1 35.3 34.1 34.3 32.4 32.4 37.0 32.0pickles and side dishes 17.2 17.8 19.6 23.2 24.9 27.0 26.7 24.4 24.4 23.2 26.9 27.5 28.5 29.2 31.6 30.9 34.8 29.2pasted fish and chilled half-finished product 16.7 18.4 23.7 27.6 26.1 26.0 22.9 24.0 23.7 25.0 26.7 25.7 26.8 28.7 30.7 29.5 37.2 31.2meat processed products 14.8 15.0 25.5 16.8 18.1 15.6 16.8 17.7 19.2 17.6 23.1 23.6 24.0 27.1 31.4 33.1 39.7 30.8milk products and soy milks 19.5 27.8 34.1 38.8 34.1 37.6 35.7 35.2 36.2 34.3 32.6 36.4 35.1 32.9 32.4 32.6 40.0 34.2chilled desert 22.5 22.7 28.0 26.6 30.5 32.9 28.0 33.0 30.9 36.2 37.9 37.4 40.5 41.7 42.3 41.0 43.4 41.5beverage 22.2 26.8 26.4 27.2 34.0 28.3 21.9 20.1 24.6 25.7 31.5 27.7 30.2 32.2 33.2 29.0 32.5 26.6
room temperature floor 20.8 22.8 26.6 28.1 27.0 24.9 24.2 24.9 24.7 26.2 25.9 26.0 28.0 29.5 31.8 28.1 35.6 28.6dried products and noodles 18.4 19.2 25.4 26.5 26.0 20.9 20.2 22.8 22.2 22.2 24.7 24.9 27.0 26.8 29.1 21.5 34.0 25.5seasonings and sweetening 26.4 30.3 35.0 33.9 34.0 27.8 28.8 31.8 27.7 28.4 25.3 21.7 25.2 27.2 30.3 26.5 35.9 28.0instant foods 28.4 30.2 37.8 38.1 33.0 30.7 29.9 27.9 29.3 29.5 27.8 28.3 31.9 35.3 39.3 35.8 41.6 33.0canned products and bottled products 18.1 18.1 22.8 27.2 20.1 22.6 18.5 21.7 23.6 21.5 21.5 23.9 26.0 29.0 30.7 25.2 33.6 26.5bread and mochi 11.1 10.3 16.4 18.2 17.5 22.0 19.3 19.9 18.7 19.9 22.4 21.2 24.1 27.5 30.0 31.0 34.5 31.6jam, spread and premix 12.6 22.3 21.0 25.7 23.7 19.1 17.6 19.3 21.5 21.0 19.0 17.9 19.3 24.4 25.9 21.5 30.6 25.5coffee and tea 31.4 32.1 29.9 37.2 32.3 24.8 20.1 23.5 27.8 29.1 24.7 24.0 29.9 32.9 33.8 29.0 38.0 31.8sweets 16.4 19.6 21.2 24.4 26.9 25.4 22.1 21.9 21.2 22.3 25.6 24.8 25.6 24.8 27.4 22.4 29.0 25.4alcoholic drinks 2.7 6.4 7.1 2.6 3.1 3.1 20.8 22.6 22.2 23.7 20.3 24.1 22.1 21.3 26.0 21.5 24.4 15.7baby food, grains and others 10.7 16.0 24.3 22.5 23.0 27.3 31.3 27.9 29.2 35.1 34.1 36.8 38.1 40.4 39.4 37.7 48.6 39.7
frozen floor 22.6 25.9 27.6 27.8 33.2 34.5 30.7 27.4 26.8 28.4 31.6 31.5 33.9 33.2 36.2 32.2 37.1 29.7frozen foods 23.9 25.2 28.6 30.4 36.8 39.2 34.5 29.6 29.1 30.8 33.8 34.2 36.5 34.6 38.1 33.4 36.7 31.1ice cream and ice 20.1 27.3 25.4 22.7 25.5 23.4 22.1 21.8 20.6 22.3 25.6 23.8 26.7 29.0 31.1 29.0 38.1 26.2
domestic articles 11.9 14.2 16.4 15.9 17.7 21.0 18.6 19.4 20.9 23.5 25.0 24.4 24.6 23.3 25.7 24.7 32.6 26.0consumable goods 12.1 14.5 16.7 16.1 17.9 21.3 18.9 19.7 21.3 24.0 25.5 24.8 25.0 23.5 25.9 25.0 32.9 26.0
bath and body care goods 15.0 17.4 17.8 14.7 20.2 29.1 30.6 30.2 35.0 29.6 31.2 32.6 29.2 31.7 32.4 28.0 32.8 25.6oral care goods 14.8 15.0 18.5 19.7 15.8 22.5 20.4 27.0 29.2 29.0 33.2 32.8 32.2 29.6 26.4 23.0 33.3 23.5sanitary goods 16.3 18.8 25.5 21.1 28.7 31.6 26.2 30.9 35.4 30.8 37.1 31.3 31.1 38.3 38.2 30.3 38.1 29.4detergent 24.8 27.3 29.9 29.2 27.3 33.6 32.3 30.4 36.3 42.9 40.9 33.9 33.2 35.9 45.4 41.5 51.4 40.6living environmental goods 16.0 17.8 17.8 19.7 25.0 27.0 27.7 27.3 25.8 31.9 31.2 31.1 28.1 32.5 33.3 31.1 42.7 30.1cosmetic goods 0.0 5.3 4.2 1.6 1.6 3.5 3.9 5.2 10.0 21.1 20.6 20.6 24.7 14.7 19.8 21.5 28.1 24.2hair cosmetic 0.7 8.1 1.7 1.3 4.6 13.1 17.5 23.7 21.0 22.3 21.7 21.6 28.9 24.0 25.2 23.6 31.4 27.2fragrance 0.0 7.5 3.6 0.0 0.0 0.0 0.2 2.6 3.7 1.7 1.2 5.3 4.1 0.9 5.0 9.4 8.5 8.7appearance goods 0.5 1.6 2.4 7.9 6.2 17.9 14.8 12.9 15.2 16.5 22.3 22.3 22.7 23.2 23.2 25.8 35.3 28.0medical related goods and sundry goods 0.9 2.9 3.2 5.0 4.8 5.5 4.3 10.3 7.0 11.5 13.7 14.4 10.0 11.1 13.4 17.2 26.7 16.8kitchen consumable goods 6.0 7.4 11.1 14.5 17.1 14.9 15.0 15.9 16.1 17.8 20.3 23.7 23.9 23.1 26.1 25.5 33.6 23.7stationary 1.1 4.1 3.0 6.8 4.3 3.5 4.1 7.2 6.4 4.9 6.0 6.6 6.8 7.1 8.3 8.8 11.2 9.7pet food and pet sanitary 11.6 13.2 16.6 19.5 17.9 25.2 20.5 23.5 19.9 25.5 27.5 26.3 23.9 25.9 27.8 27.7 35.8 31.3gifts 0.0 0.0 7.5 0.6 8.6 19.9 11.6 5.1 7.6 9.2 9.7 36.7 46.7 28.8 29.1 33.7 52.6 57.5
durable goods 0.5 1.0 2.9 5.5 5.4 6.6 5.2 8.0 5.1 6.8 6.9 8.0 11.4 14.9 15.7 13.3 22.1 24.4wash bowl, bath, kitchen and laundry goods 0.5 1.1 1.3 4.4 5.3 7.4 4.5 6.6 5.2 6.6 5.7 6.5 10.3 14.2 12.7 13.3 19.9 21.1dishes NaN NaN 6.5 0.6 0.0 2.3 7.4 13.1 5.0 7.6 9.5 10.4 12.9 15.8 18.8 13.4 24.0 26.7car goods NaN NaN 13.7 20.0 16.9 9.8 0.0 5.5 0.2 4.4 11.5 19.9 8.1 10.5 33.5 0.0 0.0 4.5
item categories monthly frequencies of regular price changes (%)
Notes: All frequencies are reported in percent per month. Notes: All frequencies are reported in percent per day. The frequencies are calculated by: (i) rounding prices off below the decimal point to remove the effects of time sales within each day,(ii) taking weekly mode of price for the item in the store, (iii) picking up the samples by the condition that they are prices on Wednesday in the week containing 15th day of the month, (iv) taking the means of dummy variables that take a value ofunity when the price is different from the day before, (v) calculating the item category level frequencies using the weighted average of item level frequencies with sales weights, and (vi) calculating the total level frequencies by weighted average of itemcategory level frequencies by sales weights. Note that we remove samples that are not sold over 300 days per store when we calculate the frequencies.
34

Table 6: Frequencies of Bargain Sales
1988 1989 1990 1991 1992 1993 1994 1995 1996 1997 1998 1999 2000 2001 2002 2003 2004 2005total 7.6 8.1 8.0 7.9 8.5 9.8 10.0 9.8 9.0 9.6 10.3 11.2 12.2 12.9 13.5 14.1 15.0 16.5
processed foods 8.1 8.6 8.6 8.6 9.2 10.5 10.7 10.5 9.6 10.1 10.9 11.9 12.8 13.5 14.0 14.6 15.4 17.0chilled floor 10.9 11.6 11.6 11.7 12.6 14.8 14.7 14.3 12.9 13.4 14.5 15.6 16.3 16.6 16.7 17.3 18.3 20.0
tofu, natto and konnyaku 10.8 11.3 11.6 11.7 13.4 17.2 17.9 17.1 15.9 17.1 19.4 19.5 19.2 18.7 18.7 18.9 20.2 21.2pickles and side dishes 9.6 11.4 12.0 13.9 15.7 17.7 17.2 16.8 14.4 14.1 15.3 17.1 18.2 19.3 19.7 20.9 22.2 24.5pasted fish and chilled half-finished product 11.7 13.4 13.2 12.8 14.4 16.8 17.0 16.2 14.9 15.5 17.1 18.4 19.5 20.0 20.2 21.0 22.3 23.7meat processed products 4.7 4.9 5.3 5.0 5.8 7.4 8.2 8.6 8.1 8.1 8.7 10.6 12.3 13.8 14.7 16.5 17.7 20.1milk products and soy milks 15.8 15.7 15.5 15.7 15.7 18.0 17.6 17.5 15.1 15.6 16.7 17.8 18.2 18.1 17.2 17.4 18.6 20.5chilled desert 9.8 10.6 9.7 11.0 12.9 14.3 12.6 11.7 11.9 13.6 16.6 18.1 21.2 23.0 23.4 23.6 24.1 25.2beverage 4.9 5.4 5.4 5.6 5.8 6.5 6.5 6.3 6.2 6.3 6.3 7.4 8.4 8.9 9.4 9.6 10.1 11.6
room temperature floor 5.6 5.8 5.9 5.8 6.2 6.9 7.1 7.1 6.6 7.3 7.7 8.6 9.7 10.9 11.7 12.3 13.0 14.4dried products and noodles 2.6 2.9 3.4 3.3 3.8 4.5 4.4 3.7 3.4 4.0 4.2 5.0 5.6 6.9 7.7 8.5 9.7 10.8seasonings and sweetening 4.6 5.0 5.1 4.7 4.7 5.2 5.2 4.9 4.4 4.9 5.1 6.0 6.6 7.7 8.6 9.3 10.6 11.9instant foods 4.1 4.3 4.5 4.3 4.5 4.8 5.0 4.6 4.4 4.8 5.4 6.4 7.2 8.0 8.7 9.0 10.0 11.3canned products and bottled products 2.8 3.3 3.5 3.4 3.9 4.5 4.6 4.3 3.5 3.9 4.3 5.5 6.6 7.1 7.9 8.6 9.8 11.5bread and mochi 16.2 14.9 14.9 14.7 16.4 18.6 19.2 19.7 18.4 19.6 21.1 22.8 24.6 25.5 25.8 26.6 27.0 29.3jam, spread and premix 2.3 2.7 3.0 3.0 3.2 3.6 3.5 3.2 3.0 3.7 3.9 4.6 5.4 6.6 7.5 8.6 9.6 10.3coffee and tea 5.8 5.4 4.9 4.4 4.8 5.4 5.5 4.8 4.5 4.9 5.2 6.0 7.0 8.5 9.8 10.5 11.4 12.5sweets 4.0 4.5 5.0 5.1 5.5 5.8 5.7 5.2 4.9 5.7 6.2 6.8 7.6 8.6 9.4 9.8 10.7 11.5alcoholic drinks 0.6 0.7 0.6 0.3 0.6 0.6 2.0 2.7 3.1 3.5 3.4 4.5 6.0 6.8 6.9 6.6 7.0 7.6baby food, grains and others 15.2 11.2 6.9 8.0 9.2 11.5 11.7 13.4 12.0 12.8 13.3 13.7 15.6 17.6 18.8 19.8 19.4 21.1
frozen floor 8.1 9.3 9.1 8.9 8.5 9.5 10.7 10.8 11.7 12.0 13.3 15.2 16.5 16.6 17.0 17.8 18.2 19.4frozen foods 8.1 9.5 9.3 8.9 8.6 10.1 11.5 11.3 12.3 12.7 14.3 16.4 17.8 17.7 18.2 19.0 19.4 20.6ice cream and ice 8.1 8.6 8.6 8.9 8.1 7.8 8.4 9.3 9.9 9.9 10.4 11.4 12.4 13.0 13.6 14.6 15.1 16.3
domestic articles 2.6 3.7 3.5 3.5 4.0 4.8 5.1 5.3 5.2 5.8 5.8 6.7 7.7 8.6 9.8 10.8 11.8 12.6consumable goods 2.6 3.7 3.5 3.5 4.0 4.8 5.1 5.3 5.2 5.9 5.9 6.7 7.7 8.7 9.8 10.8 11.8 12.6
bath and body care goods 2.4 3.1 3.3 3.2 4.0 5.2 5.7 6.0 5.3 5.7 5.7 6.8 7.5 9.0 11.0 12.5 13.6 14.7oral care goods 1.8 2.5 2.6 2.5 3.3 4.4 4.5 4.9 4.6 4.8 5.1 6.1 7.1 8.2 9.6 10.6 11.7 12.3sanitary goods 4.8 6.4 5.8 6.0 5.9 6.8 7.6 7.6 7.0 7.9 8.0 9.5 10.8 11.8 13.3 15.5 15.8 16.9detergent 4.3 5.7 4.9 5.0 5.3 6.1 6.6 6.5 6.0 6.6 7.0 8.2 9.2 10.0 11.3 12.1 13.3 14.4living environmental goods 2.3 2.6 2.4 2.6 3.5 4.6 5.0 4.9 4.4 5.0 5.0 6.5 7.7 9.4 10.5 12.1 12.7 13.6cosmetic goods 1.0 2.1 1.7 1.7 2.5 2.7 3.4 5.0 8.8 11.5 10.2 9.7 10.9 12.3 12.7 13.2 15.1 17.7hair cosmetic 0.4 1.0 1.3 1.3 2.5 3.5 4.0 4.9 4.4 5.2 5.4 5.4 6.5 8.1 9.9 11.7 11.8 12.7fragrance 0.2 0.0 1.0 1.0 1.2 2.0 2.2 2.5 3.4 6.2 7.9 6.8 8.3 10.0 12.0 16.0 11.1 12.0appearance goods 0.6 1.2 1.5 1.7 2.6 3.6 3.7 4.3 4.4 5.0 5.0 5.6 6.8 8.5 9.8 11.8 11.5 12.4medical related goods and sundry goods 0.6 1.3 1.4 1.0 1.4 1.8 2.1 2.5 2.4 2.6 2.5 2.7 2.9 3.3 3.9 3.7 4.4 4.6kitchen consumable goods 1.5 2.5 2.5 2.8 3.8 5.3 5.1 5.2 4.8 4.9 5.4 6.7 7.6 8.3 9.1 9.5 10.7 11.2stationary 0.3 0.5 0.6 1.2 1.6 2.8 3.0 3.2 3.1 3.7 3.6 4.5 5.6 6.3 8.0 8.6 8.9 9.7pet food and pet sanitary 1.2 1.8 2.2 2.5 3.4 4.4 4.6 6.3 5.4 5.9 6.3 7.0 8.1 9.0 10.2 11.0 13.0 14.4gifts NaN 0.0 0.0 0.0 0.0 6.5 5.3 2.5 3.1 3.4 3.4 6.0 7.6 8.5 11.7 11.4 11.0 11.6
durable goods 0.3 1.1 1.1 1.4 2.2 3.2 4.2 4.3 4.6 5.6 4.9 5.6 6.4 7.2 9.2 9.9 10.6 12.4wash bowl, bath, kitchen and laundry goods 0.3 1.1 1.4 1.7 2.4 3.6 4.3 4.3 4.5 5.5 4.8 5.4 6.1 7.0 8.7 9.6 10.4 12.4dishes 0.0 0.0 0.0 0.0 3.7 4.2 2.9 4.0 5.0 5.6 4.5 6.4 8.4 8.7 12.2 12.2 13.4 14.1car goods NaN 2.1 0.3 0.5 0.7 0.4 0.1 0.3 0.4 8.6 6.2 5.8 4.7 8.4 10.5 7.8 5.0 0.0
item categories frequencies of bargain sales (%)
Notes: All frequencies are reported in percent per day. Notes: All frequencies are reported in percent per day. The frequencies are calculated by: (i) taking the means of dummy variables that take a value of unity when the value of the regular priceminus the raw price is lager than 2 , (ii) calculating the item category level frequencies using the weighted average of item level frequencies with sales weights, and (iii) calculating the total level frequencies by weighted average of item category levelfrequencies by sales weights. Note that we remove samples that are not sold over 300 days per store when we calculate the frequencies.
35
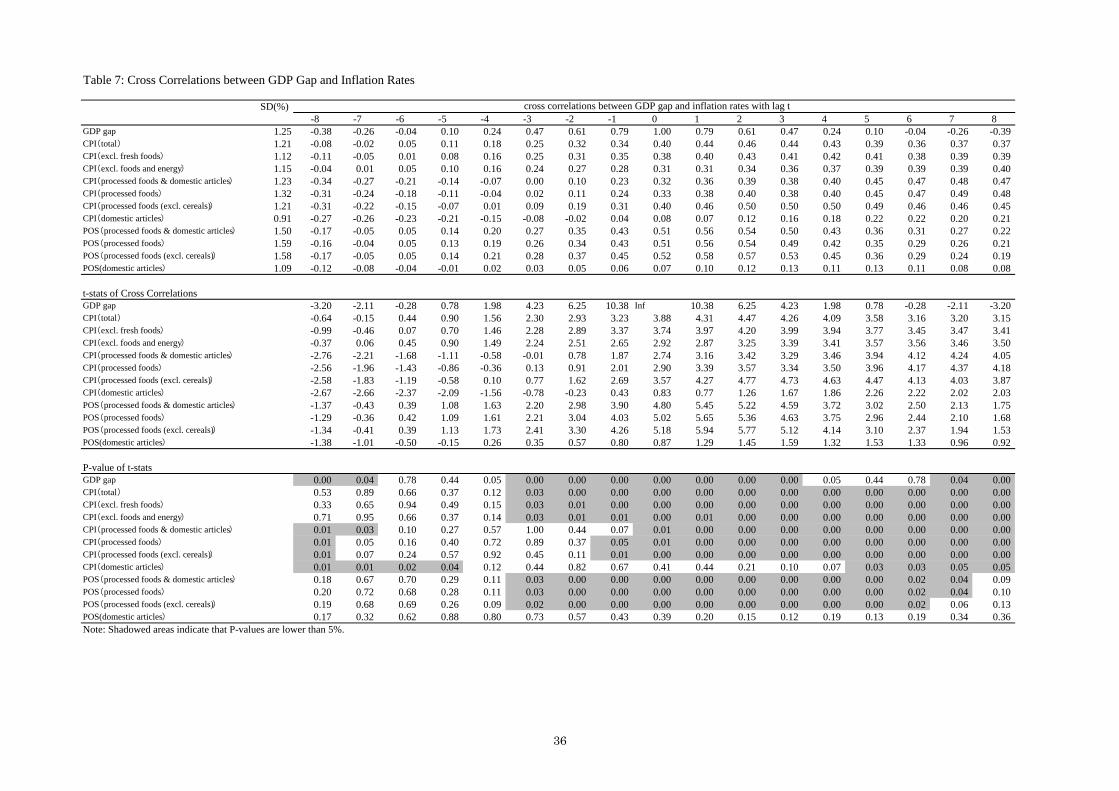
Table 7: Cross Correlations between GDP Gap and Inflation Rates
SD(%)-8 -7 -6 -5 -4 -3 -2 -1 0 1 2 3 4 5 6 7 8
GDP gap 1.25 -0.38 -0.26 -0.04 0.10 0.24 0.47 0.61 0.79 1.00 0.79 0.61 0.47 0.24 0.10 -0.04 -0.26 -0.39CPI(total) 1.21 -0.08 -0.02 0.05 0.11 0.18 0.25 0.32 0.34 0.40 0.44 0.46 0.44 0.43 0.39 0.36 0.37 0.37CPI(excl. fresh foods) 1.12 -0.11 -0.05 0.01 0.08 0.16 0.25 0.31 0.35 0.38 0.40 0.43 0.41 0.42 0.41 0.38 0.39 0.39CPI(excl. foods and energy) 1.15 -0.04 0.01 0.05 0.10 0.16 0.24 0.27 0.28 0.31 0.31 0.34 0.36 0.37 0.39 0.39 0.39 0.40CPI(processed foods & domestic articles) 1.23 -0.34 -0.27 -0.21 -0.14 -0.07 0.00 0.10 0.23 0.32 0.36 0.39 0.38 0.40 0.45 0.47 0.48 0.47CPI(processed foods) 1.32 -0.31 -0.24 -0.18 -0.11 -0.04 0.02 0.11 0.24 0.33 0.38 0.40 0.38 0.40 0.45 0.47 0.49 0.48CPI(processed foods (excl. cereals)) 1.21 -0.31 -0.22 -0.15 -0.07 0.01 0.09 0.19 0.31 0.40 0.46 0.50 0.50 0.50 0.49 0.46 0.46 0.45CPI(domestic articles) 0.91 -0.27 -0.26 -0.23 -0.21 -0.15 -0.08 -0.02 0.04 0.08 0.07 0.12 0.16 0.18 0.22 0.22 0.20 0.21POS(processed foods & domestic articles) 1.50 -0.17 -0.05 0.05 0.14 0.20 0.27 0.35 0.43 0.51 0.56 0.54 0.50 0.43 0.36 0.31 0.27 0.22POS(processed foods) 1.59 -0.16 -0.04 0.05 0.13 0.19 0.26 0.34 0.43 0.51 0.56 0.54 0.49 0.42 0.35 0.29 0.26 0.21POS(processed foods (excl. cereals)) 1.58 -0.17 -0.05 0.05 0.14 0.21 0.28 0.37 0.45 0.52 0.58 0.57 0.53 0.45 0.36 0.29 0.24 0.19POS(domestic articles) 1.09 -0.12 -0.08 -0.04 -0.01 0.02 0.03 0.05 0.06 0.07 0.10 0.12 0.13 0.11 0.13 0.11 0.08 0.08
t-stats of Cross Correlations GDP gap -3.20 -2.11 -0.28 0.78 1.98 4.23 6.25 10.38 Inf 10.38 6.25 4.23 1.98 0.78 -0.28 -2.11 -3.20CPI(total) -0.64 -0.15 0.44 0.90 1.56 2.30 2.93 3.23 3.88 4.31 4.47 4.26 4.09 3.58 3.16 3.20 3.15CPI(excl. fresh foods) -0.99 -0.46 0.07 0.70 1.46 2.28 2.89 3.37 3.74 3.97 4.20 3.99 3.94 3.77 3.45 3.47 3.41CPI(excl. foods and energy) -0.37 0.06 0.45 0.90 1.49 2.24 2.51 2.65 2.92 2.87 3.25 3.39 3.41 3.57 3.56 3.46 3.50CPI(processed foods & domestic articles) -2.76 -2.21 -1.68 -1.11 -0.58 -0.01 0.78 1.87 2.74 3.16 3.42 3.29 3.46 3.94 4.12 4.24 4.05CPI(processed foods) -2.56 -1.96 -1.43 -0.86 -0.36 0.13 0.91 2.01 2.90 3.39 3.57 3.34 3.50 3.96 4.17 4.37 4.18CPI(processed foods (excl. cereals)) -2.58 -1.83 -1.19 -0.58 0.10 0.77 1.62 2.69 3.57 4.27 4.77 4.73 4.63 4.47 4.13 4.03 3.87CPI(domestic articles) -2.67 -2.66 -2.37 -2.09 -1.56 -0.78 -0.23 0.43 0.83 0.77 1.26 1.67 1.86 2.26 2.22 2.02 2.03POS(processed foods & domestic articles) -1.37 -0.43 0.39 1.08 1.63 2.20 2.98 3.90 4.80 5.45 5.22 4.59 3.72 3.02 2.50 2.13 1.75POS(processed foods) -1.29 -0.36 0.42 1.09 1.61 2.21 3.04 4.03 5.02 5.65 5.36 4.63 3.75 2.96 2.44 2.10 1.68POS(processed foods (excl. cereals)) -1.34 -0.41 0.39 1.13 1.73 2.41 3.30 4.26 5.18 5.94 5.77 5.12 4.14 3.10 2.37 1.94 1.53POS(domestic articles) -1.38 -1.01 -0.50 -0.15 0.26 0.35 0.57 0.80 0.87 1.29 1.45 1.59 1.32 1.53 1.33 0.96 0.92
P-value of t-statsGDP gap 0.00 0.04 0.78 0.44 0.05 0.00 0.00 0.00 0.00 0.00 0.00 0.00 0.05 0.44 0.78 0.04 0.00CPI(total) 0.53 0.89 0.66 0.37 0.12 0.03 0.00 0.00 0.00 0.00 0.00 0.00 0.00 0.00 0.00 0.00 0.00CPI(excl. fresh foods) 0.33 0.65 0.94 0.49 0.15 0.03 0.01 0.00 0.00 0.00 0.00 0.00 0.00 0.00 0.00 0.00 0.00CPI(excl. foods and energy) 0.71 0.95 0.66 0.37 0.14 0.03 0.01 0.01 0.00 0.01 0.00 0.00 0.00 0.00 0.00 0.00 0.00CPI(processed foods & domestic articles) 0.01 0.03 0.10 0.27 0.57 1.00 0.44 0.07 0.01 0.00 0.00 0.00 0.00 0.00 0.00 0.00 0.00CPI(processed foods) 0.01 0.05 0.16 0.40 0.72 0.89 0.37 0.05 0.01 0.00 0.00 0.00 0.00 0.00 0.00 0.00 0.00CPI(processed foods (excl. cereals)) 0.01 0.07 0.24 0.57 0.92 0.45 0.11 0.01 0.00 0.00 0.00 0.00 0.00 0.00 0.00 0.00 0.00CPI(domestic articles) 0.01 0.01 0.02 0.04 0.12 0.44 0.82 0.67 0.41 0.44 0.21 0.10 0.07 0.03 0.03 0.05 0.05POS(processed foods & domestic articles) 0.18 0.67 0.70 0.29 0.11 0.03 0.00 0.00 0.00 0.00 0.00 0.00 0.00 0.00 0.02 0.04 0.09POS(processed foods) 0.20 0.72 0.68 0.28 0.11 0.03 0.00 0.00 0.00 0.00 0.00 0.00 0.00 0.00 0.02 0.04 0.10POS(processed foods (excl. cereals)) 0.19 0.68 0.69 0.26 0.09 0.02 0.00 0.00 0.00 0.00 0.00 0.00 0.00 0.00 0.02 0.06 0.13POS(domestic articles) 0.17 0.32 0.62 0.88 0.80 0.73 0.57 0.43 0.39 0.20 0.15 0.12 0.19 0.13 0.19 0.34 0.36Note: Shadowed areas indicate that P-values are lower than 5%.
cross correlations between GDP gap and inflation rates with lag t
36

Appendix Table 1: Sales by Item Categories
1988 1989 1990 1991 1992 1993 1994 1995 1996 1997 1998 1999 2000 2001 2002 2003 2004 2005total 24,969 38,858 47,951 56,613 67,407 75,491 115,864 149,349 180,689 206,076 262,931 265,886 276,477 301,497 314,058 264,395 306,378 329,340
processed foods 21,873 33,761 41,075 47,990 56,622 63,242 96,884 122,686 147,884 167,924 216,234 219,361 227,069 246,464 255,516 213,968 250,147 267,554chilled floor 9,364 14,539 17,958 20,877 24,753 27,298 41,637 51,735 60,314 67,812 86,381 86,556 87,969 93,983 97,538 81,702 94,391 100,422
tofu, natto and konnyaku 961 1,520 1,932 2,290 2,766 3,061 4,501 5,714 6,813 7,913 9,923 9,838 9,887 10,566 10,827 8,798 9,794 10,078pickles and side dishes 1,138 1,781 2,332 2,917 3,465 3,896 5,718 7,291 7,943 8,807 11,293 11,376 11,441 12,079 12,284 10,154 11,874 12,121pasted fish and chilled half-finished product 2,347 3,548 4,256 4,976 5,819 6,312 9,131 10,945 12,705 13,999 17,148 16,541 16,901 17,959 18,223 14,591 17,265 18,466meat processed products 1,333 1,934 2,417 2,896 3,455 3,711 5,425 6,615 7,572 8,607 11,056 10,853 11,166 11,710 12,056 10,101 11,328 12,331milk products and soy milks 2,277 3,647 4,321 4,733 5,497 6,100 9,734 12,200 14,576 16,447 21,046 21,172 20,800 21,638 23,381 19,876 22,092 23,239chilled desert 308 481 614 738 891 1,089 1,695 2,100 2,381 2,585 3,006 2,882 2,881 3,069 3,092 2,668 3,361 3,955beverage 1,001 1,629 2,087 2,327 2,860 3,129 5,434 6,870 8,322 9,453 12,908 13,895 14,894 16,962 17,675 15,514 18,677 20,231
room temperature floor 11,307 17,324 20,836 24,350 28,444 32,029 48,703 62,983 77,871 89,438 116,412 119,469 125,228 137,539 143,388 119,776 141,780 152,195dried products and noodles 982 1,476 1,758 2,031 2,427 2,617 3,967 4,886 5,785 6,380 7,860 7,626 7,540 7,947 7,898 6,280 7,075 7,410seasonings and sweetening 2,013 3,049 3,556 4,175 4,911 5,283 7,936 9,921 12,134 13,577 16,862 16,788 17,020 17,812 18,130 14,873 17,088 18,034instant foods 1,715 2,602 3,196 3,673 4,287 4,884 6,976 8,996 11,105 12,151 14,837 15,315 15,375 16,263 16,406 14,052 15,883 16,961canned products and bottled products 636 931 1,077 1,206 1,395 1,530 2,189 2,597 2,938 3,119 3,705 3,802 3,558 3,576 3,452 2,836 3,106 3,234bread and mochi 1,266 2,007 2,482 2,916 3,412 3,861 5,772 7,002 8,459 9,266 11,782 12,231 12,762 13,535 14,145 12,153 14,927 16,303jam, spread and premix 207 322 363 423 501 577 879 1,120 1,368 1,625 2,060 2,040 2,115 2,276 2,373 1,985 2,195 2,475coffee and tea 1,069 1,518 1,708 1,888 2,163 2,384 3,484 4,489 5,353 5,768 7,533 7,627 7,712 8,217 8,144 6,612 7,078 7,444sweets 3,093 4,659 5,530 6,351 7,111 7,845 11,129 13,957 16,850 18,382 22,774 23,062 23,991 26,096 26,521 22,787 25,712 27,919alcoholic drinks 99 185 300 544 790 1,073 2,199 3,463 4,924 6,805 11,636 12,852 15,007 18,598 20,547 18,091 21,953 24,719baby food, grains and others 228 575 865 1,144 1,448 1,976 4,174 6,553 8,954 12,364 17,363 18,127 20,148 23,217 25,771 20,107 26,764 27,697
frozen floor 1,201 1,898 2,281 2,763 3,425 3,915 6,543 7,967 9,700 10,675 13,442 13,337 13,871 14,941 14,591 12,490 13,976 14,937frozen foods 777 1,253 1,529 1,827 2,323 2,746 4,532 5,703 7,013 7,629 9,843 9,834 10,231 11,099 10,558 8,853 9,857 10,538ice cream and ice 424 645 751 936 1,102 1,169 2,011 2,264 2,687 3,046 3,599 3,503 3,640 3,842 4,033 3,637 4,119 4,399
domestic articles 3,097 5,097 6,876 8,623 10,785 12,249 18,980 26,663 32,805 38,152 46,697 46,525 49,408 55,033 58,542 50,427 56,231 61,786consumable goods 3,049 5,006 6,744 8,463 10,604 12,053 18,559 25,853 31,963 37,101 45,505 45,372 48,011 53,565 57,022 49,079 54,766 59,998
bath and body care goods 401 660 881 1,076 1,332 1,510 2,193 2,664 3,128 3,471 4,222 4,134 4,181 4,335 4,519 3,988 4,710 5,060oral care goods 203 302 378 463 573 637 905 1,181 1,547 1,709 2,051 1,939 1,938 2,058 2,192 1,815 2,036 2,199sanitary goods 648 1,092 1,470 1,829 2,162 2,224 2,809 3,511 4,185 4,849 5,944 5,872 6,206 6,718 6,700 5,988 6,499 6,682detergent 414 682 928 1,187 1,409 1,535 2,249 2,700 3,175 3,574 4,410 4,336 4,391 4,800 4,933 3,982 4,513 4,812living environmental goods 207 292 391 488 608 649 913 1,180 1,451 1,722 2,144 2,063 2,133 2,308 2,249 1,986 2,024 2,213cosmetic goods 183 279 352 437 741 1,210 2,285 4,286 5,708 7,270 8,943 9,394 10,892 13,084 15,648 14,376 16,317 18,207hair cosmetic 131 231 304 384 552 674 1,114 1,643 1,955 2,009 2,179 2,018 2,125 2,294 2,366 2,090 2,294 2,598fragrance 6 9 11 10 12 16 36 73 79 93 103 100 119 154 170 158 179 232appearance goods 119 183 229 268 345 382 639 956 1,145 1,251 1,500 1,519 1,556 1,912 2,080 1,747 1,963 2,207medical related goods and sundry goods 334 539 776 1,017 1,234 1,393 2,191 2,936 3,720 4,320 5,432 5,606 5,850 6,615 6,649 5,377 5,517 6,114kitchen consumable goods 240 434 571 693 876 970 1,658 2,215 2,577 3,017 3,617 3,421 3,496 3,695 3,702 2,924 3,230 3,468stationary 13 41 77 102 135 203 531 1,080 1,395 1,620 2,099 2,057 2,013 2,292 2,458 2,007 2,232 2,659pet food and pet sanitary 149 256 367 488 607 623 898 1,136 1,497 1,786 2,090 2,101 2,164 2,315 2,309 2,032 2,300 2,575gifts 0 5 11 20 18 26 136 291 400 410 770 812 948 985 1,049 610 951 973
durable goods 48 90 132 160 181 196 421 810 842 1,051 1,193 1,153 1,397 1,468 1,520 1,348 1,465 1,788wash bowl, bath, kitchen and laundry goods 45 84 110 131 140 144 312 624 630 712 839 760 751 733 802 639 653 721dishes 2 6 9 15 27 38 102 181 209 295 321 372 633 719 709 705 811 1,065car goods 0 1 13 14 14 13 7 4 3 44 33 21 13 16 10 4 1 2
item categories sales (1 million yen)
Notes: All sales amounts are reported in million yen. The sales amounts of 2003 do not cover sales in November and December.
37
Appendix Table 2: Standard Deviations for Frequencies of Price Changes
1988 1989 1990 1991 1992 1993 1994 1995 1996 1997 1998 1999 2000 2001 2002 2003 2004 2005total 8.2 9.7 10.0 9.5 9.5 9.5 10.1 9.8 10.0 10.6 10.8 11.2 12.7 13.8 14.5 15.5 15.0 15.8
processed foods 8.5 10.0 10.5 10.0 9.9 10.0 10.4 10.3 10.4 10.8 11.0 11.2 12.9 13.9 14.6 15.6 15.0 15.7chilled floor 10.7 11.6 12.4 12.0 12.4 12.9 13.1 12.9 12.9 13.3 13.4 13.4 14.8 15.6 16.0 17.0 16.0 16.5
tofu, natto and konnyaku 11.9 13.1 14.1 14.0 14.1 14.8 14.6 14.5 14.9 16.3 16.1 15.0 15.5 16.1 15.7 16.0 15.5 15.6pickles and side dishes 9.5 10.5 11.7 12.6 14.0 14.6 14.0 13.7 13.1 13.3 13.5 14.5 16.1 16.9 17.7 18.6 17.9 18.8pasted fish and chilled half-finished product 9.5 11.5 12.1 11.8 12.5 13.5 12.6 12.5 12.8 13.1 13.0 13.2 14.3 15.2 15.8 17.0 16.0 16.3meat processed products 10.4 9.3 10.4 10.1 9.8 11.0 13.4 12.5 12.0 12.5 12.6 13.0 15.0 15.8 16.7 18.5 16.9 17.4milk products and soy milks 12.0 13.5 14.7 13.0 12.9 13.1 13.3 13.2 12.9 13.6 13.5 13.3 15.0 16.2 16.5 17.5 16.8 17.0chilled desert 11.4 11.0 11.2 10.1 11.8 11.2 9.6 9.5 10.8 12.4 13.2 13.0 14.8 16.3 17.9 18.7 17.8 17.4beverage 9.8 8.9 9.5 10.4 10.1 10.0 11.5 11.9 12.0 11.1 11.7 11.7 13.2 13.8 13.9 14.5 13.4 14.1
room temperature floor 6.6 8.3 8.5 7.9 7.6 7.3 8.0 7.9 8.0 8.5 8.8 9.4 11.4 12.7 13.6 14.5 14.3 15.3dried products and noodles 3.6 4.7 5.2 4.5 4.7 4.8 5.3 4.7 4.7 5.5 6.3 6.9 9.7 11.5 12.9 14.5 14.1 15.0seasonings and sweetening 5.2 8.4 7.9 7.4 6.7 5.5 5.7 5.2 5.4 5.9 6.5 7.2 9.7 11.6 12.9 14.3 13.8 15.1instant foods 6.2 6.9 6.9 6.4 6.0 5.6 6.2 5.8 6.4 6.7 7.1 7.8 9.7 11.6 12.1 13.3 12.9 13.8canned products and bottled products 4.5 5.3 6.2 5.2 5.2 5.1 4.9 5.0 5.3 5.7 6.4 6.8 9.8 11.5 12.6 14.1 13.2 14.4bread and mochi 15.4 16.3 16.1 15.6 15.4 16.5 17.5 17.3 18.2 18.2 17.3 16.9 17.6 18.6 19.4 20.1 19.0 18.7jam, spread and premix 4.4 5.5 5.9 5.3 5.9 5.7 5.4 5.1 5.1 6.0 7.2 8.0 9.9 11.7 13.0 14.4 14.3 14.9coffee and tea 5.9 8.1 7.4 6.7 5.9 6.6 6.1 5.1 5.7 6.0 6.8 7.5 9.8 11.6 13.0 14.5 13.9 14.5sweets 5.6 6.8 8.2 8.1 7.6 6.8 6.8 7.2 6.5 7.7 8.6 8.8 10.0 11.5 12.5 13.4 12.6 13.3alcoholic drinks 1.4 1.2 2.2 0.9 1.8 1.9 9.9 9.7 10.0 7.4 6.8 9.4 10.5 10.1 10.6 10.3 12.8 14.2baby food, grains and others 15.2 15.8 11.6 8.8 11.3 11.8 13.2 12.3 11.7 12.8 12.0 12.0 15.1 16.0 16.2 17.3 16.3 18.3
frozen floor 8.4 12.1 12.3 12.4 11.9 10.6 10.7 10.8 13.3 12.2 13.4 13.3 13.4 13.8 14.8 16.0 14.3 14.3frozen foods 7.4 12.0 12.2 12.3 12.2 10.5 10.0 10.0 12.8 11.8 13.4 13.0 13.4 14.0 15.0 16.3 14.3 14.4ice cream and ice 11.1 12.5 12.7 12.9 11.3 11.2 12.8 13.2 14.7 13.3 13.1 14.1 13.5 13.0 14.3 15.1 14.4 14.0
domestic articles 5.5 7.4 6.1 5.9 6.4 6.3 7.5 6.8 7.7 9.6 9.6 10.9 11.6 12.7 13.7 14.9 14.8 16.3consumable goods 5.6 7.5 6.1 5.9 6.4 6.2 7.4 6.8 7.7 9.6 9.6 10.9 11.6 12.7 13.7 14.9 14.8 16.3
bath and body care goods 3.9 5.1 5.0 5.8 6.3 7.2 8.9 7.2 7.4 9.0 9.7 11.4 12.0 13.4 14.5 15.4 15.2 16.1oral care goods 2.4 5.0 4.9 5.0 5.7 5.4 7.1 6.6 7.2 8.6 9.4 11.0 11.6 13.3 14.5 15.6 14.1 14.9sanitary goods 5.7 7.9 7.4 7.8 7.4 6.4 7.5 6.8 7.5 10.1 8.9 10.2 11.0 12.5 14.1 16.2 14.5 15.4detergent 3.7 6.5 5.6 6.2 6.3 5.3 7.1 5.5 6.1 8.0 8.0 9.5 10.7 12.1 13.8 15.2 14.2 15.8living environmental goods 3.1 4.4 4.1 5.6 5.9 9.2 8.0 6.8 7.3 9.1 9.2 11.6 12.2 13.3 14.2 15.5 15.7 16.4cosmetic goods 2.6 3.0 3.2 2.9 4.1 5.3 10.1 8.3 13.0 18.0 17.2 17.3 17.1 17.9 17.8 18.6 17.9 20.3hair cosmetic 3.7 2.0 2.9 2.8 5.4 6.0 10.4 9.4 9.6 12.1 12.8 13.6 14.2 15.4 15.9 16.8 15.5 16.6fragrance 0.9 1.2 2.6 3.0 3.3 4.2 4.2 6.2 7.4 14.7 17.2 19.1 13.6 14.7 15.5 17.6 16.0 13.5appearance goods 2.6 3.4 3.1 4.1 5.7 5.6 7.5 7.0 7.7 10.3 10.9 12.4 13.8 15.0 15.7 16.3 15.1 15.7medical related goods and sundry goods 14.5 15.5 8.0 5.2 5.6 4.9 5.3 5.5 5.8 6.5 6.9 7.6 8.0 8.8 9.2 10.2 14.0 16.4kitchen consumable goods 3.3 8.8 8.4 6.4 6.2 5.5 6.2 5.9 6.3 8.2 8.7 10.4 11.2 12.4 13.2 13.9 13.2 14.5stationary 1.8 1.8 2.2 3.0 7.0 6.3 8.9 6.7 7.6 8.5 9.3 10.5 11.2 11.7 13.7 13.7 13.1 14.5pet food and pet sanitary 2.6 3.2 3.9 4.7 8.3 10.9 9.3 11.7 11.9 13.0 12.8 13.9 14.0 14.9 15.1 15.7 16.0 17.3gifts NaN NaN NaN NaN NaN 8.0 7.6 6.4 8.9 7.9 8.4 14.1 17.2 15.0 16.3 18.9 22.1 21.3
durable goods 2.4 2.1 2.8 3.3 6.5 7.8 9.8 9.1 10.2 11.6 13.2 14.7 14.7 14.9 16.0 15.8 16.4 17.8wash bowl, bath, kitchen and laundry goods 2.4 2.2 3.9 4.3 7.6 8.7 10.1 9.2 10.4 11.4 13.5 14.9 14.8 14.7 16.0 15.7 16.6 17.8dishes NaN NaN NaN NaN 10.3 9.7 7.7 8.1 8.1 13.5 13.2 15.4 14.6 16.0 16.5 16.7 13.0 18.0car goods NaN NaN NaN NaN NaN NaN 1.6 NaN NaN 12.7 9.9 11.2 11.6 14.7 15.3 16.9 40.7 NaN
item categories standard deviations for frequencies of price changes (%)
Notes: The table reports standard deviations of the frequencies across stores. The frequencies are reported in percent per day. We remove the samples that are not sold over 300 days per store when we calculate the frequencies.
38

Appendix Table 3: Standard Deviations for Frequencies of Regular Price Change
1988 1989 1990 1991 1992 1993 1994 1995 1996 1997 1998 1999 2000 2001 2002 2003 2004 2005total 1.5 1.9 1.9 1.9 1.9 1.8 1.8 1.9 1.9 2.1 2.1 2.3 2.1 2.3 2.4 2.3 3.0 2.4
processed foods 1.6 1.8 1.8 1.9 1.8 1.7 1.7 1.8 1.8 1.9 1.9 2.1 1.9 2.1 2.1 2.0 2.6 2.1chilled floor 1.7 1.9 1.8 1.9 1.9 1.8 1.8 1.9 1.8 1.9 1.9 1.9 1.9 2.0 2.1 2.0 2.2 1.8
tofu, natto and konnyaku 1.6 1.9 2.0 2.1 2.1 1.9 1.9 2.1 2.1 2.2 2.3 2.1 2.1 2.2 2.1 2.1 2.2 1.9pickles and side dishes 1.3 1.3 1.4 1.5 1.7 1.7 1.6 1.6 1.6 1.6 1.6 1.8 1.7 1.8 2.0 1.9 1.9 1.8pasted fish and chilled half-finished product 1.6 1.7 1.6 1.9 1.8 1.7 1.7 1.6 1.6 1.6 1.7 1.6 1.6 1.8 1.9 1.9 2.0 1.7meat processed products 1.7 1.4 1.3 1.2 1.4 1.3 1.1 1.2 1.3 1.4 1.4 1.4 1.6 1.8 1.9 1.9 1.9 1.5milk products and soy milks 1.8 2.4 2.3 2.1 2.0 2.0 2.1 2.1 2.0 2.2 2.2 2.1 2.0 2.1 2.2 2.2 2.2 2.0chilled desert 2.2 2.2 2.2 2.1 2.1 2.0 2.0 2.9 2.3 2.1 2.6 2.6 2.5 3.5 3.2 2.8 3.0 2.4beverage 1.9 1.9 1.9 1.9 2.0 1.8 1.9 2.1 2.1 2.0 2.0 2.3 2.0 2.0 2.1 2.0 2.6 1.9
room temperature floor 1.4 1.8 1.6 1.7 1.6 1.5 1.6 1.7 1.6 1.7 1.8 2.2 1.9 2.1 2.0 1.9 2.9 2.3dried products and noodles 1.0 1.4 1.3 1.2 1.1 1.2 1.1 1.2 1.1 1.1 1.1 1.3 1.5 1.5 1.5 1.3 2.6 1.6seasonings and sweetening 1.5 2.1 1.7 1.8 1.8 1.6 1.5 1.7 1.6 1.6 1.6 1.6 1.5 1.6 1.6 1.6 2.8 1.8instant foods 1.3 1.6 1.6 1.6 1.6 1.4 1.4 1.5 1.6 1.6 1.6 1.6 1.8 3.2 1.8 1.7 2.9 1.9canned products and bottled products 1.3 1.4 1.5 1.4 1.5 1.4 1.4 1.6 1.8 1.8 1.8 1.5 1.9 2.1 2.0 1.9 2.9 2.0bread and mochi 1.6 1.7 1.9 2.2 1.9 1.7 1.9 1.9 1.9 1.9 1.9 2.1 2.2 2.4 2.5 2.8 2.8 2.6jam, spread and premix 1.3 1.6 1.5 1.7 1.6 1.4 1.3 1.4 1.5 1.6 1.7 1.8 1.9 2.1 2.1 1.9 3.4 2.5coffee and tea 1.8 2.4 2.0 1.8 1.8 1.8 1.8 1.6 1.7 1.8 1.9 1.9 1.9 1.9 2.0 1.9 3.0 2.6sweets 1.1 1.5 1.5 1.9 1.6 1.3 1.2 1.4 1.2 1.3 1.2 1.3 1.4 1.5 1.5 1.4 2.5 1.5alcoholic drinks 0.4 0.5 0.4 0.3 0.6 0.5 2.1 2.2 1.9 1.5 2.4 5.6 1.9 1.9 1.9 1.8 2.3 2.5baby food, grains and others 2.9 2.7 2.1 2.2 2.1 2.4 2.5 2.9 2.6 2.6 2.7 2.6 2.9 2.7 2.8 2.8 3.9 3.7
frozen floor 2.2 2.3 2.7 2.9 2.9 2.1 1.8 2.2 3.5 3.3 3.0 2.6 2.5 2.7 2.6 2.5 3.9 2.6frozen foods 1.9 2.1 2.7 2.9 3.0 2.1 1.7 2.0 2.7 2.5 2.8 2.3 2.2 2.3 2.4 2.5 4.0 2.6ice cream and ice 3.0 3.0 2.7 2.8 2.4 2.4 2.2 2.8 5.8 5.5 3.5 3.4 3.5 3.7 3.2 2.7 3.6 2.8
domestic articles 1.4 2.4 2.3 2.2 2.4 2.4 2.7 2.3 2.4 3.5 3.3 3.9 3.9 4.2 4.7 4.7 5.9 4.8consumable goods 1.4 2.4 2.3 2.3 2.4 2.4 2.7 2.3 2.4 3.5 3.3 3.8 3.8 4.1 4.7 4.7 5.8 4.8
bath and body care goods 1.8 2.2 2.0 2.0 2.8 3.3 3.4 3.1 2.9 3.8 3.5 4.2 4.1 4.4 4.6 4.7 6.6 4.1oral care goods 0.8 1.8 1.6 1.7 1.9 1.5 1.6 1.7 1.6 2.9 2.7 3.3 3.3 3.8 4.3 5.3 5.8 4.7sanitary goods 1.6 3.4 3.7 3.4 2.6 2.4 2.7 2.5 2.9 3.3 3.1 3.3 3.2 3.3 4.0 3.8 4.2 4.0detergent 1.0 2.2 2.0 1.9 2.1 1.5 3.1 1.4 1.5 2.4 2.2 2.3 2.4 2.3 2.9 2.6 3.9 2.8living environmental goods 1.6 2.0 2.1 2.3 2.6 2.8 2.4 2.7 2.8 4.3 3.7 4.7 4.7 4.6 4.8 5.0 8.3 5.1cosmetic goods 0.8 0.7 1.0 1.2 1.9 1.8 5.7 3.4 4.8 6.1 7.0 8.8 8.8 9.4 10.3 11.4 11.0 10.6hair cosmetic 2.4 1.1 0.9 1.1 3.1 2.9 5.7 5.1 4.9 7.3 6.8 7.9 8.0 8.8 8.8 9.4 10.9 9.8fragrance 0.0 1.2 1.7 1.5 2.3 3.0 3.6 4.5 5.8 12.1 14.4 16.3 11.6 13.2 10.5 10.1 14.9 8.4appearance goods 1.2 1.3 1.2 1.3 2.5 1.8 2.6 2.3 2.1 4.4 4.4 5.1 6.3 6.2 7.1 7.0 7.6 5.7medical related goods and sundry goods 1.9 2.9 2.2 2.6 1.8 2.0 1.6 1.8 1.1 2.5 2.1 2.2 2.1 2.8 2.8 2.1 4.5 4.0kitchen consumable goods 1.0 1.8 2.0 1.6 2.0 1.6 1.3 1.3 1.3 2.3 2.0 2.3 2.3 2.2 3.2 2.3 3.1 2.1stationary 1.2 0.7 1.0 1.2 4.6 2.3 3.0 2.0 2.1 3.1 3.1 3.8 4.6 4.4 6.2 5.9 5.4 5.3pet food and pet sanitary 1.8 1.9 1.6 2.0 4.1 7.5 3.1 3.8 3.6 4.7 4.5 5.2 5.3 5.9 5.5 6.1 7.4 7.1gifts NaN NaN NaN NaN NaN 4.7 5.5 3.4 4.5 3.4 5.2 12.0 5.3 6.7 7.8 6.8 12.0 7.5
durable goods 1.0 1.1 1.7 1.5 2.9 3.9 4.0 3.9 4.3 6.1 6.4 8.0 8.8 8.9 8.9 9.6 10.7 11.3wash bowl, bath, kitchen and laundry goods 1.0 1.1 2.3 1.9 3.4 4.2 4.0 3.8 4.2 5.8 6.5 8.1 8.8 8.7 8.7 9.2 10.7 11.3dishes NaN NaN NaN NaN 8.1 9.4 5.7 5.3 5.5 10.1 7.9 9.0 9.7 9.8 10.1 12.5 10.6 11.5car goods NaN NaN NaN NaN NaN NaN 1.4 0.0 0.0 2.4 2.8 3.3 5.8 9.9 9.2 12.4 45.9 NaN
item categories standard deviations for frequencies of regular price changes (%)
Notes: The table reports standard deviations of the frequencies across stores. The frequencies are reported in percent per day. The regular prices denote weekly mode prices by each store. We remove the samples that are not sold over 300 days perstore when we calculate the frequencies
39
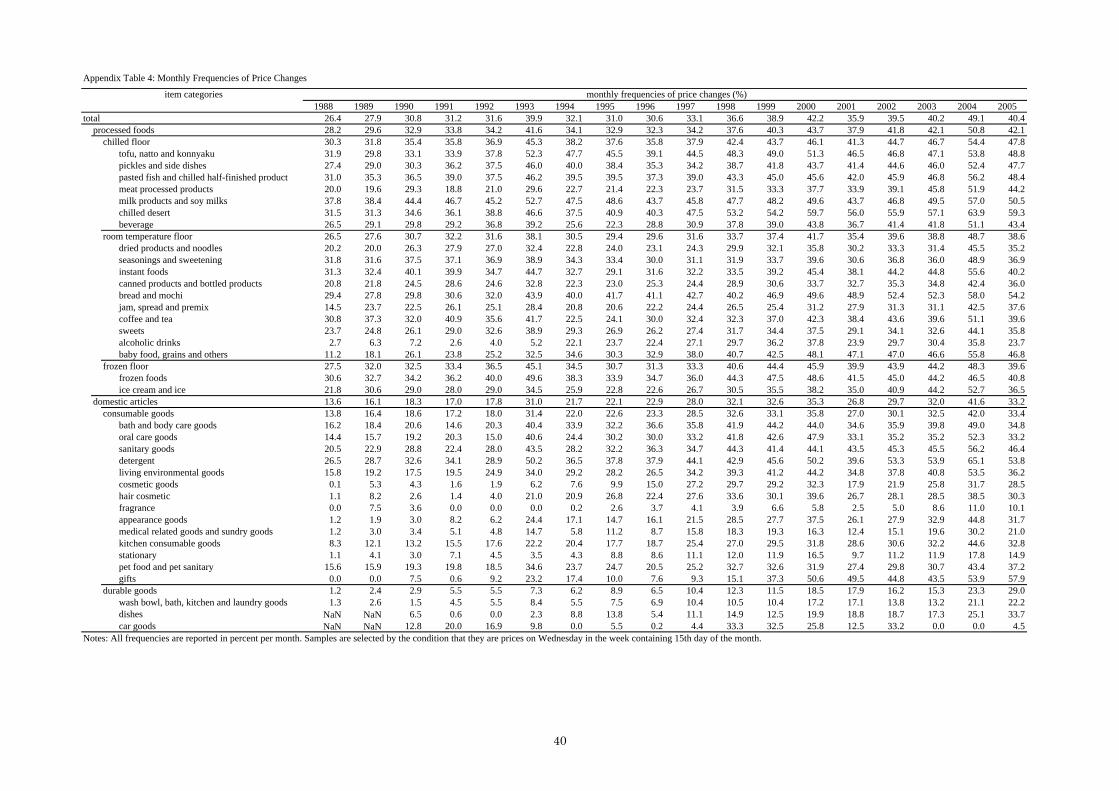
Appendix Table 4: Monthly Frequencies of Price Changes
1988 1989 1990 1991 1992 1993 1994 1995 1996 1997 1998 1999 2000 2001 2002 2003 2004 2005total 26.4 27.9 30.8 31.2 31.6 39.9 32.1 31.0 30.6 33.1 36.6 38.9 42.2 35.9 39.5 40.2 49.1 40.4
processed foods 28.2 29.6 32.9 33.8 34.2 41.6 34.1 32.9 32.3 34.2 37.6 40.3 43.7 37.9 41.8 42.1 50.8 42.1chilled floor 30.3 31.8 35.4 35.8 36.9 45.3 38.2 37.6 35.8 37.9 42.4 43.7 46.1 41.3 44.7 46.7 54.4 47.8
tofu, natto and konnyaku 31.9 29.8 33.1 33.9 37.8 52.3 47.7 45.5 39.1 44.5 48.3 49.0 51.3 46.5 46.8 47.1 53.8 48.8pickles and side dishes 27.4 29.0 30.3 36.2 37.5 46.0 40.0 38.4 35.3 34.2 38.7 41.8 43.7 41.4 44.6 46.0 52.4 47.7pasted fish and chilled half-finished product 31.0 35.3 36.5 39.0 37.5 46.2 39.5 39.5 37.3 39.0 43.3 45.0 45.6 42.0 45.9 46.8 56.2 48.4meat processed products 20.0 19.6 29.3 18.8 21.0 29.6 22.7 21.4 22.3 23.7 31.5 33.3 37.7 33.9 39.1 45.8 51.9 44.2milk products and soy milks 37.8 38.4 44.4 46.7 45.2 52.7 47.5 48.6 43.7 45.8 47.7 48.2 49.6 43.7 46.8 49.5 57.0 50.5chilled desert 31.5 31.3 34.6 36.1 38.8 46.6 37.5 40.9 40.3 47.5 53.2 54.2 59.7 56.0 55.9 57.1 63.9 59.3beverage 26.5 29.1 29.8 29.2 36.8 39.2 25.6 22.3 28.8 30.9 37.8 39.0 43.8 36.7 41.4 41.8 51.1 43.4
room temperature floor 26.5 27.6 30.7 32.2 31.6 38.1 30.5 29.4 29.6 31.6 33.7 37.4 41.7 35.4 39.6 38.8 48.7 38.6dried products and noodles 20.2 20.0 26.3 27.9 27.0 32.4 22.8 24.0 23.1 24.3 29.9 32.1 35.8 30.2 33.3 31.4 45.5 35.2seasonings and sweetening 31.8 31.6 37.5 37.1 36.9 38.9 34.3 33.4 30.0 31.1 31.9 33.7 39.6 30.6 36.8 36.0 48.9 36.9instant foods 31.3 32.4 40.1 39.9 34.7 44.7 32.7 29.1 31.6 32.2 33.5 39.2 45.4 38.1 44.2 44.8 55.6 40.2canned products and bottled products 20.8 21.8 24.5 28.6 24.6 32.8 22.3 23.0 25.3 24.4 28.9 30.6 33.7 32.7 35.3 34.8 42.4 36.0bread and mochi 29.4 27.8 29.8 30.6 32.0 43.9 40.0 41.7 41.1 42.7 40.2 46.9 49.6 48.9 52.4 52.3 58.0 54.2jam, spread and premix 14.5 23.7 22.5 26.1 25.1 28.4 20.8 20.6 22.2 24.4 26.5 25.4 31.2 27.9 31.3 31.1 42.5 37.6coffee and tea 30.8 37.3 32.0 40.9 35.6 41.7 22.5 24.1 30.0 32.4 32.3 37.0 42.3 38.4 43.6 39.6 51.1 39.6sweets 23.7 24.8 26.1 29.0 32.6 38.9 29.3 26.9 26.2 27.4 31.7 34.4 37.5 29.1 34.1 32.6 44.1 35.8alcoholic drinks 2.7 6.3 7.2 2.6 4.0 5.2 22.1 23.7 22.4 27.1 29.7 36.2 37.8 23.9 29.7 30.4 35.8 23.7baby food, grains and others 11.2 18.1 26.1 23.8 25.2 32.5 34.6 30.3 32.9 38.0 40.7 42.5 48.1 47.1 47.0 46.6 55.8 46.8
frozen floor 27.5 32.0 32.5 33.4 36.5 45.1 34.5 30.7 31.3 33.3 40.6 44.4 45.9 39.9 43.9 44.2 48.3 39.6frozen foods 30.6 32.7 34.2 36.2 40.0 49.6 38.3 33.9 34.7 36.0 44.3 47.5 48.6 41.5 45.0 44.2 46.5 40.8ice cream and ice 21.8 30.6 29.0 28.0 29.0 34.5 25.9 22.8 22.6 26.7 30.5 35.5 38.2 35.0 40.9 44.2 52.7 36.5
domestic articles 13.6 16.1 18.3 17.0 17.8 31.0 21.7 22.1 22.9 28.0 32.1 32.6 35.3 26.8 29.7 32.0 41.6 33.2consumable goods 13.8 16.4 18.6 17.2 18.0 31.4 22.0 22.6 23.3 28.5 32.6 33.1 35.8 27.0 30.1 32.5 42.0 33.4
bath and body care goods 16.2 18.4 20.6 14.6 20.3 40.4 33.9 32.2 36.6 35.8 41.9 44.2 44.0 34.6 35.9 39.8 49.0 34.8oral care goods 14.4 15.7 19.2 20.3 15.0 40.6 24.4 30.2 30.0 33.2 41.8 42.6 47.9 33.1 35.2 35.2 52.3 33.2sanitary goods 20.5 22.9 28.8 22.4 28.0 43.5 28.2 32.2 36.3 34.7 44.3 41.4 44.1 43.5 45.3 45.5 56.2 46.4detergent 26.5 28.7 32.6 34.1 28.9 50.2 36.5 37.8 37.9 44.1 42.9 45.6 50.2 39.6 53.3 53.9 65.1 53.8living environmental goods 15.8 19.2 17.5 19.5 24.9 34.0 29.2 28.2 26.5 34.2 39.3 41.2 44.2 34.8 37.8 40.8 53.5 36.2cosmetic goods 0.1 5.3 4.3 1.6 1.9 6.2 7.6 9.9 15.0 27.2 29.7 29.2 32.3 17.9 21.9 25.8 31.7 28.5hair cosmetic 1.1 8.2 2.6 1.4 4.0 21.0 20.9 26.8 22.4 27.6 33.6 30.1 39.6 26.7 28.1 28.5 38.5 30.3fragrance 0.0 7.5 3.6 0.0 0.0 0.0 0.2 2.6 3.7 4.1 3.9 6.6 5.8 2.5 5.0 8.6 11.0 10.1appearance goods 1.2 1.9 3.0 8.2 6.2 24.4 17.1 14.7 16.1 21.5 28.5 27.7 37.5 26.1 27.9 32.9 44.8 31.7medical related goods and sundry goods 1.2 3.0 3.4 5.1 4.8 14.7 5.8 11.2 8.7 15.8 18.3 19.3 16.3 12.4 15.1 19.6 30.2 21.0kitchen consumable goods 8.3 12.1 13.2 15.5 17.6 22.2 20.4 17.7 18.7 25.4 27.0 29.5 31.8 28.6 30.6 32.2 44.6 32.8stationary 1.1 4.1 3.0 7.1 4.5 3.5 4.3 8.8 8.6 11.1 12.0 11.9 16.5 9.7 11.2 11.9 17.8 14.9pet food and pet sanitary 15.6 15.9 19.3 19.8 18.5 34.6 23.7 24.7 20.5 25.2 32.7 32.6 31.9 27.4 29.8 30.7 43.4 37.2gifts 0.0 0.0 7.5 0.6 9.2 23.2 17.4 10.0 7.6 9.3 15.1 37.3 50.6 49.5 44.8 43.5 53.9 57.9
durable goods 1.2 2.4 2.9 5.5 5.5 7.3 6.2 8.9 6.5 10.4 12.3 11.5 18.5 17.9 16.2 15.3 23.3 29.0wash bowl, bath, kitchen and laundry goods 1.3 2.6 1.5 4.5 5.5 8.4 5.5 7.5 6.9 10.4 10.5 10.4 17.2 17.1 13.8 13.2 21.1 22.2dishes NaN NaN 6.5 0.6 0.0 2.3 8.8 13.8 5.4 11.1 14.9 12.5 19.9 18.8 18.7 17.3 25.1 33.7car goods NaN NaN 12.8 20.0 16.9 9.8 0.0 5.5 0.2 4.4 33.3 32.5 25.8 12.5 33.2 0.0 0.0 4.5
item categories monthly frequencies of price changes (%)
Notes: All frequencies are reported in percent per month. Samples are selected by the condition that they are prices on Wednesday in the week containing 15th day of the month.
40
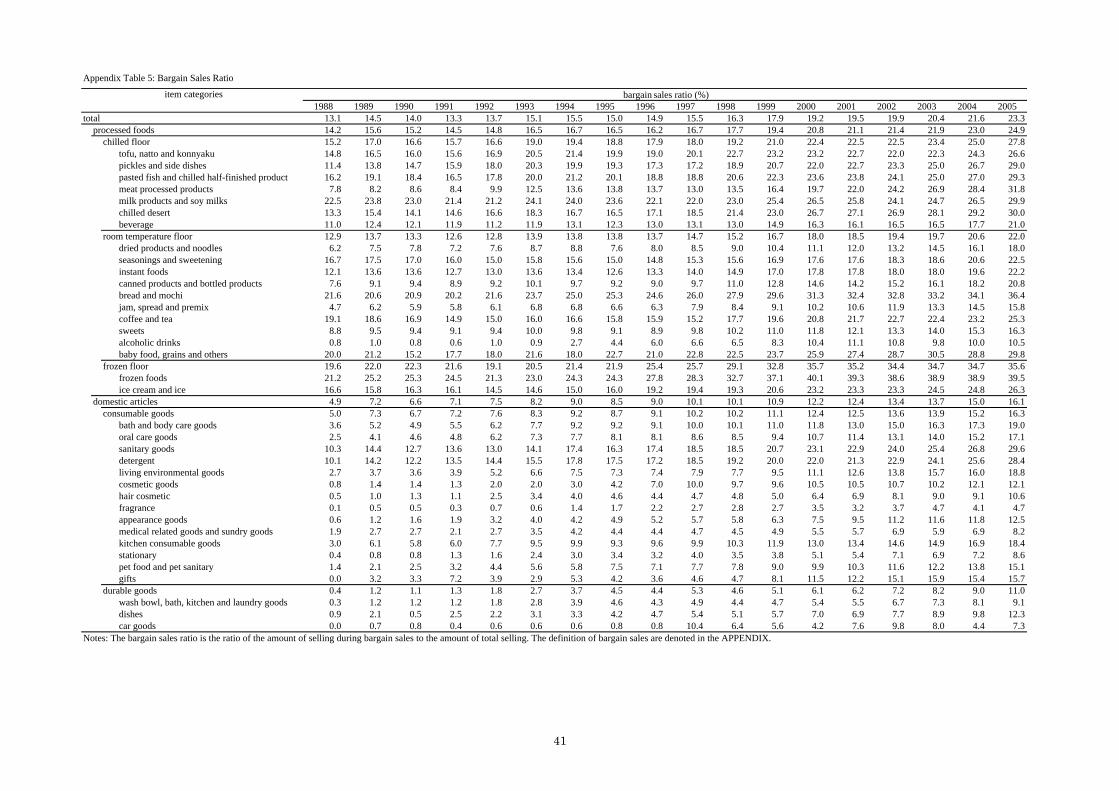
Appendix Table 5: Bargain Sales Ratio
1988 1989 1990 1991 1992 1993 1994 1995 1996 1997 1998 1999 2000 2001 2002 2003 2004 2005total 13.1 14.5 14.0 13.3 13.7 15.1 15.5 15.0 14.9 15.5 16.3 17.9 19.2 19.5 19.9 20.4 21.6 23.3
processed foods 14.2 15.6 15.2 14.5 14.8 16.5 16.7 16.5 16.2 16.7 17.7 19.4 20.8 21.1 21.4 21.9 23.0 24.9chilled floor 15.2 17.0 16.6 15.7 16.6 19.0 19.4 18.8 17.9 18.0 19.2 21.0 22.4 22.5 22.5 23.4 25.0 27.8
tofu, natto and konnyaku 14.8 16.5 16.0 15.6 16.9 20.5 21.4 19.9 19.0 20.1 22.7 23.2 23.2 22.7 22.0 22.3 24.3 26.6pickles and side dishes 11.4 13.8 14.7 15.9 18.0 20.3 19.9 19.3 17.3 17.2 18.9 20.7 22.0 22.7 23.3 25.0 26.7 29.0pasted fish and chilled half-finished product 16.2 19.1 18.4 16.5 17.8 20.0 21.2 20.1 18.8 18.8 20.6 22.3 23.6 23.8 24.1 25.0 27.0 29.3meat processed products 7.8 8.2 8.6 8.4 9.9 12.5 13.6 13.8 13.7 13.0 13.5 16.4 19.7 22.0 24.2 26.9 28.4 31.8milk products and soy milks 22.5 23.8 23.0 21.4 21.2 24.1 24.0 23.6 22.1 22.0 23.0 25.4 26.5 25.8 24.1 24.7 26.5 29.9chilled desert 13.3 15.4 14.1 14.6 16.6 18.3 16.7 16.5 17.1 18.5 21.4 23.0 26.7 27.1 26.9 28.1 29.2 30.0beverage 11.0 12.4 12.1 11.9 11.2 11.9 13.1 12.3 13.0 13.1 13.0 14.9 16.3 16.1 16.5 16.5 17.7 21.0
room temperature floor 12.9 13.7 13.3 12.6 12.8 13.9 13.8 13.8 13.7 14.7 15.2 16.7 18.0 18.5 19.4 19.7 20.6 22.0dried products and noodles 6.2 7.5 7.8 7.2 7.6 8.7 8.8 7.6 8.0 8.5 9.0 10.4 11.1 12.0 13.2 14.5 16.1 18.0seasonings and sweetening 16.7 17.5 17.0 16.0 15.0 15.8 15.6 15.0 14.8 15.3 15.6 16.9 17.6 17.6 18.3 18.6 20.6 22.5instant foods 12.1 13.6 13.6 12.7 13.0 13.6 13.4 12.6 13.3 14.0 14.9 17.0 17.8 17.8 18.0 18.0 19.6 22.2canned products and bottled products 7.6 9.1 9.4 8.9 9.2 10.1 9.7 9.2 9.0 9.7 11.0 12.8 14.6 14.2 15.2 16.1 18.2 20.8bread and mochi 21.6 20.6 20.9 20.2 21.6 23.7 25.0 25.3 24.6 26.0 27.9 29.6 31.3 32.4 32.8 33.2 34.1 36.4jam, spread and premix 4.7 6.2 5.9 5.8 6.1 6.8 6.8 6.6 6.3 7.9 8.4 9.1 10.2 10.6 11.9 13.3 14.5 15.8coffee and tea 19.1 18.6 16.9 14.9 15.0 16.0 16.6 15.8 15.9 15.2 17.7 19.6 20.8 21.7 22.7 22.4 23.2 25.3sweets 8.8 9.5 9.4 9.1 9.4 10.0 9.8 9.1 8.9 9.8 10.2 11.0 11.8 12.1 13.3 14.0 15.3 16.3alcoholic drinks 0.8 1.0 0.8 0.6 1.0 0.9 2.7 4.4 6.0 6.6 6.5 8.3 10.4 11.1 10.8 9.8 10.0 10.5baby food, grains and others 20.0 21.2 15.2 17.7 18.0 21.6 18.0 22.7 21.0 22.8 22.5 23.7 25.9 27.4 28.7 30.5 28.8 29.8
frozen floor 19.6 22.0 22.3 21.6 19.1 20.5 21.4 21.9 25.4 25.7 29.1 32.8 35.7 35.2 34.4 34.7 34.7 35.6frozen foods 21.2 25.2 25.3 24.5 21.3 23.0 24.3 24.3 27.8 28.3 32.7 37.1 40.1 39.3 38.6 38.9 38.9 39.5ice cream and ice 16.6 15.8 16.3 16.1 14.5 14.6 15.0 16.0 19.2 19.4 19.3 20.6 23.2 23.3 23.3 24.5 24.8 26.3
domestic articles 4.9 7.2 6.6 7.1 7.5 8.2 9.0 8.5 9.0 10.1 10.1 10.9 12.2 12.4 13.4 13.7 15.0 16.1consumable goods 5.0 7.3 6.7 7.2 7.6 8.3 9.2 8.7 9.1 10.2 10.2 11.1 12.4 12.5 13.6 13.9 15.2 16.3
bath and body care goods 3.6 5.2 4.9 5.5 6.2 7.7 9.2 9.2 9.1 10.0 10.1 11.0 11.8 13.0 15.0 16.3 17.3 19.0oral care goods 2.5 4.1 4.6 4.8 6.2 7.3 7.7 8.1 8.1 8.6 8.5 9.4 10.7 11.4 13.1 14.0 15.2 17.1sanitary goods 10.3 14.4 12.7 13.6 13.0 14.1 17.4 16.3 17.4 18.5 18.5 20.7 23.1 22.9 24.0 25.4 26.8 29.6detergent 10.1 14.2 12.2 13.5 14.4 15.5 17.8 17.5 17.2 18.5 19.2 20.0 22.0 21.3 22.9 24.1 25.6 28.4living environmental goods 2.7 3.7 3.6 3.9 5.2 6.6 7.5 7.3 7.4 7.9 7.7 9.5 11.1 12.6 13.8 15.7 16.0 18.8cosmetic goods 0.8 1.4 1.4 1.3 2.0 2.0 3.0 4.2 7.0 10.0 9.7 9.6 10.5 10.5 10.7 10.2 12.1 12.1hair cosmetic 0.5 1.0 1.3 1.1 2.5 3.4 4.0 4.6 4.4 4.7 4.8 5.0 6.4 6.9 8.1 9.0 9.1 10.6fragrance 0.1 0.5 0.5 0.3 0.7 0.6 1.4 1.7 2.2 2.7 2.8 2.7 3.5 3.2 3.7 4.7 4.1 4.7appearance goods 0.6 1.2 1.6 1.9 3.2 4.0 4.2 4.9 5.2 5.7 5.8 6.3 7.5 9.5 11.2 11.6 11.8 12.5medical related goods and sundry goods 1.9 2.7 2.7 2.1 2.7 3.5 4.2 4.4 4.4 4.7 4.5 4.9 5.5 5.7 6.9 5.9 6.9 8.2kitchen consumable goods 3.0 6.1 5.8 6.0 7.7 9.5 9.9 9.3 9.6 9.9 10.3 11.9 13.0 13.4 14.6 14.9 16.9 18.4stationary 0.4 0.8 0.8 1.3 1.6 2.4 3.0 3.4 3.2 4.0 3.5 3.8 5.1 5.4 7.1 6.9 7.2 8.6pet food and pet sanitary 1.4 2.1 2.5 3.2 4.4 5.6 5.8 7.5 7.1 7.7 7.8 9.0 9.9 10.3 11.6 12.2 13.8 15.1gifts 0.0 3.2 3.3 7.2 3.9 2.9 5.3 4.2 3.6 4.6 4.7 8.1 11.5 12.2 15.1 15.9 15.4 15.7
durable goods 0.4 1.2 1.1 1.3 1.8 2.7 3.7 4.5 4.4 5.3 4.6 5.1 6.1 6.2 7.2 8.2 9.0 11.0wash bowl, bath, kitchen and laundry goods 0.3 1.2 1.2 1.2 1.8 2.8 3.9 4.6 4.3 4.9 4.4 4.7 5.4 5.5 6.7 7.3 8.1 9.1dishes 0.9 2.1 0.5 2.5 2.2 3.1 3.3 4.2 4.7 5.4 5.1 5.7 7.0 6.9 7.7 8.9 9.8 12.3car goods 0.0 0.7 0.8 0.4 0.6 0.6 0.6 0.8 0.8 10.4 6.4 5.6 4.2 7.6 9.8 8.0 4.4 7.3
item categories bargain sales ratio (%)
Notes: The bargain sales ratio is the ratio of the amount of selling during bargain sales to the amount of total selling. The definition of bargain sales are denoted in the APPENDIX.
41

Figure 1
‐2
‐1
0
1
2
3
4
5
6
7
8
9
80 81 82 83 84 85 86 87 88 89 90 91 92 93 94 95 96 97 98 99 00 01 02 03 04 05 06 07 08
y/y;% Consumer Price IndexGeneral
General, excluding fresh foods
General, excluding food (excluding alcholic beverage) and energy
Source: Ministry of Internal Affairs and Communictions, "Consumer Price Index."Note: The inflation rates include positive effects of raising cosumer tax rate.
42

Figure 2(a)
(b) (c)
0
200
400
600
800
1000
1200
1400
1600
1800
0
20
40
60
80
100
120
140
160
2005/9/1 2005/10/1 2005/11/1 2005/12/1
Nisshin Cup Noodle (Store A)
quantity (right scale)weekly mode priceprice
(yen)
0
2
4
6
8
10
12
14
16
18
20
0
20
40
60
80
100
120
140
160
2005/9/1 2005/10/1 2005/11/1 2005/12/1
Nisshin Cup Noodle (Store B)(yen)
0
200
400
600
800
1000
1200
1400
1600
1800
2000
0
20
40
60
80
100
120
140
160
2005/9/1 2005/10/1 2005/11/1 2005/12/1
Nisshin Cup Noodle (Store C)(yen)
43

Figure 3
Figure 4
Figure 5
0
5
10
15
20
25
30
35
40
processed foods
domestic articles
total
Daily Frequencies of Price Changes(%)
Note: We remove the samples that are not sold over 300 days per store when we calculate the frequencies.
0
1
2
3
4
5
6
7
8processed foods
domestic articles
total
Daily Frequencies of Regular Price (%)
Note: We remove the samples that are not sold over 300 days per store when we calculate the frequencies.
0
2
4
6
8
10
12
14
16
18
processed foods
domestic articles
total
Standard Deviations for Daily Frequencies of Price changes(%)
Note: We remove the samples that are not sold over 300 days per store when we calculate the frequencies. The standard deviations of the frequencies are across stores.
44
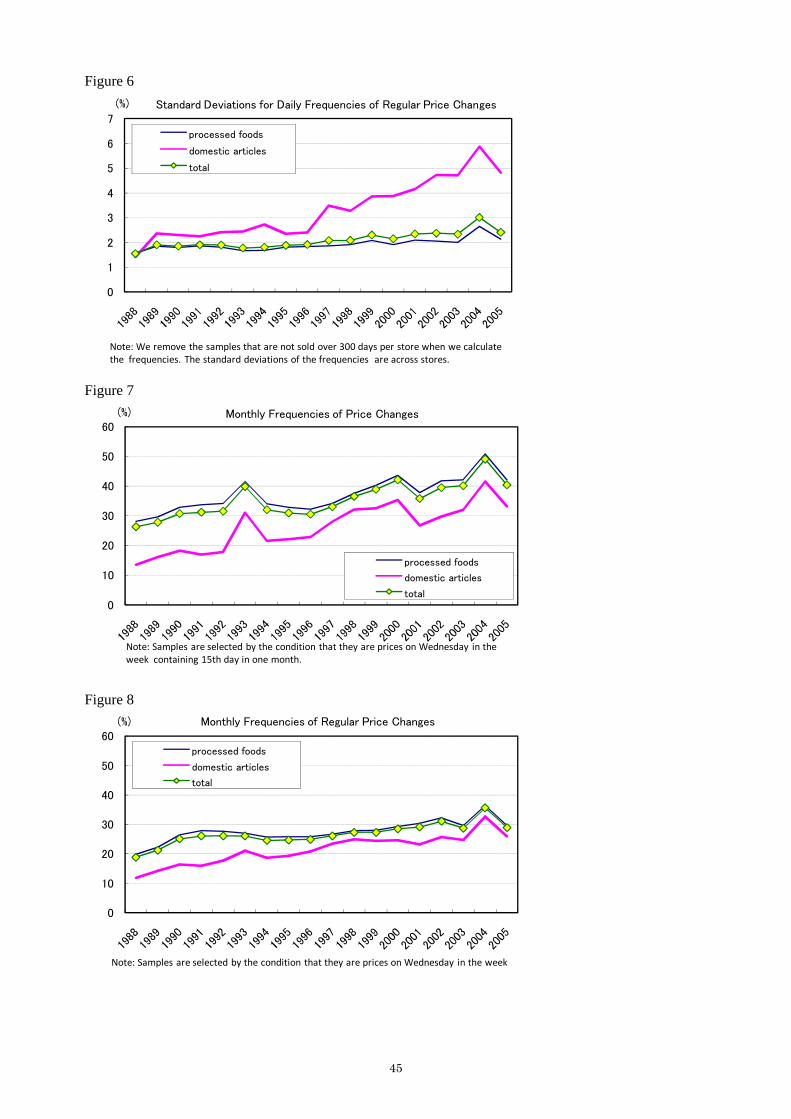
Figure 6
Figure 7
Figure 8
0
10
20
30
40
50
60
processed foods
domestic articles
total
Monthly Frequencies of Price Changes(%)
Note: Samples are selected by the condition that they are prices on Wednesday in the week containing 15th day in one month.
0
10
20
30
40
50
60processed foods
domestic articles
total
Monthly Frequencies of Regular Price Changes(%)
Note: Samples are selected by the condition that they are prices on Wednesday in the week
0
1
2
3
4
5
6
7processed foods
domestic articles
total
Standard Deviations for Daily Frequencies of Regular Price Changes(%)
Note: We remove the samples that are not sold over 300 days per store when we calculate the frequencies. The standard deviations of the frequencies are across stores.
45

Figure 9
Figure 10
0
2
4
6
8
10
12
14
16
18processed foods
domestic articles
total
Daily Frequencies of Bargain Sales(%)
Note: We remove the samples that are not sold over 300 days per store when we calculate the frequencies.
0
5
10
15
20
25
30
processed foods
domestic articles
total
Bargain Sales Ratios(%)
Notes: The bargain sales ratio is the ratio of the amount of selling during bargain sales tothe amount of total selling.
46
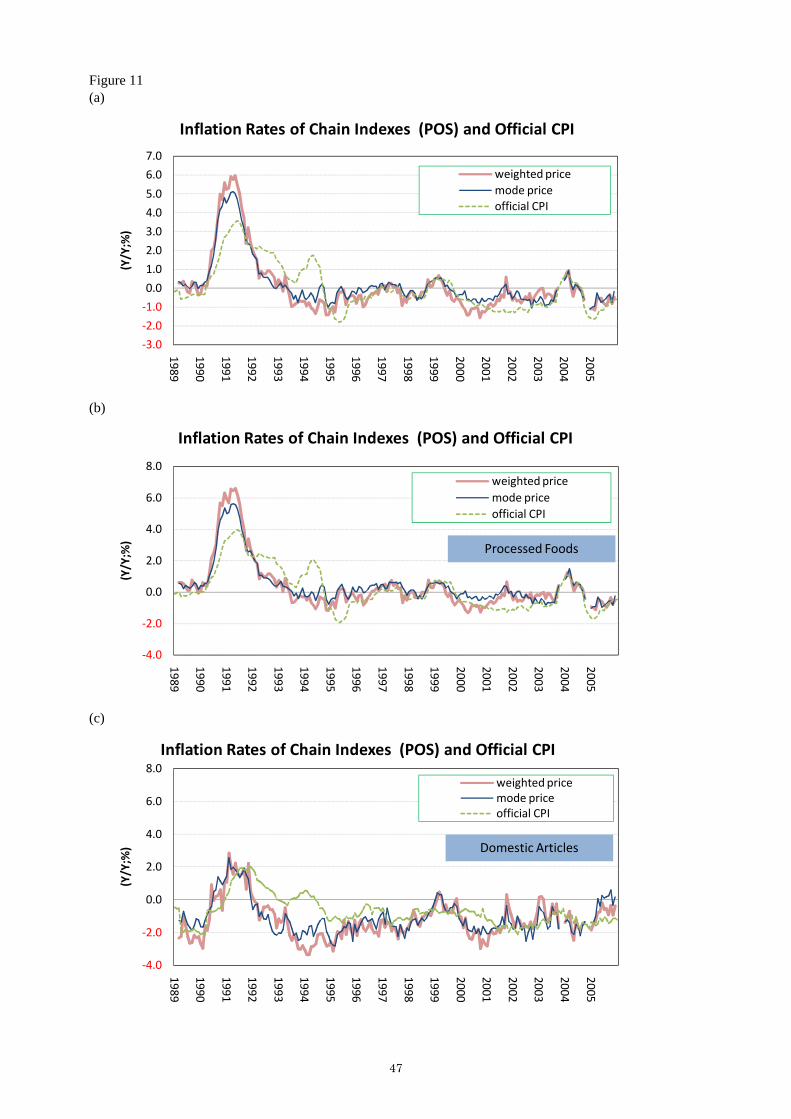
Figure 11(a)
(b)
(c)
‐3.0
‐2.0
‐1.0
0.0
1.0
2.0
3.0
4.0
5.0
6.0
7.0
1989
1990
1991
1992
1993
1994
1995
1996
1997
1998
1999
2000
2001
2002
2003
2004
2005
(Y/Y;%)
Inflation Rates of Chain Indexes (POS) and Official CPI
weighted pricemode priceofficial CPI
‐4.0
‐2.0
0.0
2.0
4.0
6.0
8.0
1989
1990
1991
1992
1993
1994
1995
1996
1997
1998
1999
2000
2001
2002
2003
2004
2005
(Y/Y;%)
Inflation Rates of Chain Indexes (POS) and Official CPI
weighted pricemode priceofficial CPI
Processed Foods
‐4.0
‐2.0
0.0
2.0
4.0
6.0
8.0
1989
1990
1991
1992
1993
1994
1995
1996
1997
1998
1999
2000
2001
2002
2003
2004
2005
(Y/Y;%)
Inflation Rates of Chain Indexes (POS) and Official CPI
weighted pricemode priceofficial CPI
Domestic Articles
47

Figure 12(a)
(b)
‐40
‐30
‐20
‐10
0
10
20
30
40
1989
1990
1991
1992
1993
1994
1995
1996
1997
1998
1999
2000
2001
2002
2003
2004
2005
(y/y;%
)Instant Cup Noodle (Weighted Price)
CPI instant noodleNisshin cup noodle(POS)instant cup noodle upper 5% (POS)instant cup noodle total (POS)
Note: "MSI" denotes the most sold item in the item category. "upper 5%" denotes the upper 5% of items for the number of sold months in the item category.
‐40
‐30
‐20
‐10
0
10
20
30
40
1989
1990
1991
1992
1993
1994
1995
1996
1997
1998
1999
2000
2001
2002
2003
2004
2005
(y/y;%
)
Instant Cup Noodle (Regular Price)
CPI instant noodleNisshin cup noodle(POS)instant cup noodle upper 5% (POS)instant cup noodle total (POS)
Note: "MSI" denotes the most sold item in the item category. "upper 5%" denotes the upper 5% of items for the number of sold months in the item category.
48
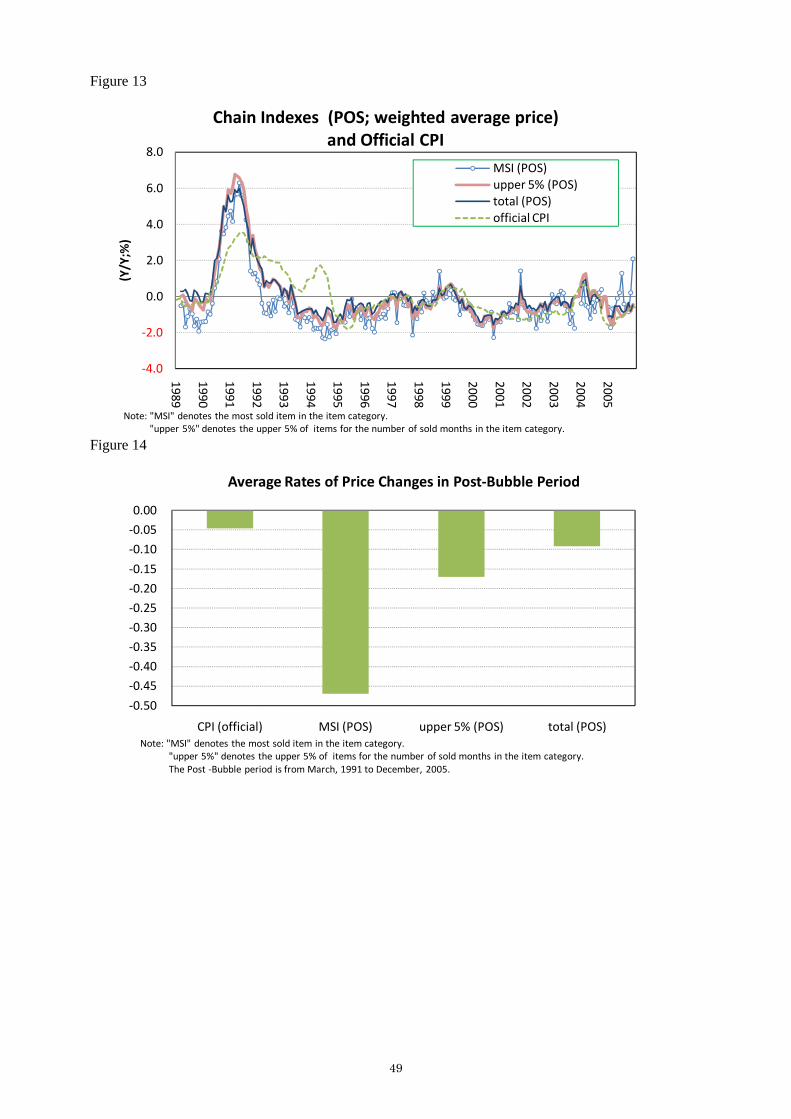
Figure 13
Figure 14
‐4.0
‐2.0
0.0
2.0
4.0
6.0
8.0
1989
1990
1991
1992
1993
1994
1995
1996
1997
1998
1999
2000
2001
2002
2003
2004
2005
(Y/Y;%
)Chain Indexes (POS; weighted average price)
and Official CPIMSI (POS)upper 5% (POS)total (POS)official CPI
Note: "MSI" denotes the most sold item in the item category. "upper 5%" denotes the upper 5% of items for the number of sold months in the item category.
‐0.50
‐0.45
‐0.40
‐0.35
‐0.30
‐0.25
‐0.20
‐0.15
‐0.10
‐0.05
0.00
CPI (official) MSI (POS) upper 5% (POS) total (POS)
Average Rates of Price Changes in Post‐Bubble Period
Note: "MSI" denotes the most sold item in the item category. "upper 5%" denotes the upper 5% of items for the number of sold months in the item category.The Post ‐Bubble period is from March, 1991 to December, 2005.
49

Figure 15
Figure 16(a)
(b)
‐3.0
‐2.0
‐1.0
0.0
1.0
2.0
3.0
4.0
5.0
6.0
7.0
89 90 91 92 93 94 95 96 97 98 99 00 01 02 03 04 05
GDP gap
CPI(processed foods (excl. cereals))
POS(processed foods (excl. cereals))
Inflation Rates and GDP Gap(%)
Note: Inflation rates are year on year rates. GDP gap is H‐P filtered log of real GDP (λ=1600). CPI excludes the positive effects of raising consumer tax rate.
‐0.4‐0.3‐0.2‐0.10.00.10.20.30.40.50.60.7
‐8 ‐7 ‐6 ‐5 ‐4 ‐3 ‐2 ‐1 0 1 2 3 4 5 6 7 8
(correlation
)
CPI(processed foods & domestic articles)
POS(processed foods & domestic articles)
lag (Quartery)
Cross Correlations between GDP Gap and Inflation Rates
‐0.4‐0.3‐0.2‐0.10.00.10.20.30.40.50.60.7
‐8 ‐7 ‐6 ‐5 ‐4 ‐3 ‐2 ‐1 0 1 2 3 4 5 6 7 8
(correlation
)
CPI(processed foods (excl. cereals))
POS(processed foods (excl. cereals))
lag (Quartery)
Cross Correlations between GDP Gap and Inflation Rates
50