miami-dade county public schoolsoer.dadeschools.net/evaluations/m565 - third grade...
TRANSCRIPT


Miami-Dade County Public Schools
Third Grade Summer Reading Camps, 2015 Evaluation
December 2015
Principal Evaluator/Author: Steven M. Urdegar, M.B.A., Ph.D.
ASSESSMENT, RESEARCH AND DATA ANALYSIS 1450 Northeast Second Avenue
Miami, Florida 33132
Sally A. Shay, District Director

THE SCHOOL BOARD OF MIAMI-DADE COUNTY, FLORIDA
Ms. Perla Tabares Hantman, Chair Dr. Dorothy Bendross-Mindingall, Vice Chair
Ms. Susie V. Castillo Dr. Lawrence S. Feldman Dr. Wilbert “Tee” Holloway
Dr. Martin Karp Ms. Lubby Navarro
Ms. Raquel A. Regalado Dr. Marta Pérez Wurtz
Mr. Logan Schroeder-Stephens, Student Advisor
Mr. Alberto M. Carvalho Superintendent of Schools
Gisela F. Feild Administrative Director
Assessment, Research and Data Analysis

i
TABLE OF CONTENTS EXECUTIVE SUMMARY ........................................................................................................... iii INTRODUCTION ...........................................................................................................................1 Background ................................................................................................................................1 Description of the Program ........................................................................................................2 METHODOLOGY ..........................................................................................................................4 Research Questions ....................................................................................................................4 Data Sources ..............................................................................................................................4 Implementation ..........................................................................................................................4 Program Impact ..........................................................................................................................5 Design and Samples .............................................................................................................5 Instrumentation ....................................................................................................................7 Data Analyses ......................................................................................................................8 Improvement ..................................................................................................................8 Promotion .......................................................................................................................8 RESULTS ........................................................................................................................................9 Return Rate ................................................................................................................................9 Implementation ..........................................................................................................................9 Program Impact ........................................................................................................................15 Improvement ......................................................................................................................15 Promotion ...........................................................................................................................15 DISCUSSION ................................................................................................................................17 Summary ..................................................................................................................................17 Conclusions ..............................................................................................................................18 REFERENCES ..............................................................................................................................19 APPENDIX A: SUMMER IMPLEMENTATION SURVEY ......................................................20

ii
LIST OF TABLES
Table 1: Features of the Third Grade Summer Reading Camps ..................................................3 Table 2: List of the Reading Camps, 2015 ...................................................................................3 Table 3: Good Cause Exemptions to Mandatory Retention Granted to M-DCPS Third Graders, 2014-15............................................................................................................6 Table 4: The Groups’ Demographic Characteristics as a Percentage of the Sample ...................7 Table 5: Programs that Operate in Conjunction with the Reading Camps ..................................9 Table 6: Response Option Categories Assigned to Each Implementation Dimension ..............10 Table 7: Principals’ Responses to Selected Items Addressing Implementation ........................11 Table 8: Crosstab of Daily Flex Literacy Dosage x SAT-10 Prep Dosage ................................12 Table 9: Administrators’ Attitudes Toward the Program ..........................................................13 Table 10: Number and Percent of Positive and Negative Comments by Program Dimension ....13 Table 11: Regression Analysis of the Posttest Scores .................................................................15 Table 12: Logistic Regression Analysis of the Posttest Scores ...................................................16
iii
EXECUTIVE SUMMARY The fundamental goal of the Third Grade Summer Reading Camp program is to bolster the reading skills of third grade students scheduled for retention and to prepare them to demonstrate mastery of state standards in order to be promoted to the fourth grade. The Office of Program Evaluation undertook an evaluation to gauge whether students who completed the program in summer 2015 exhibited improved performance on the summer alternative assessment when compared to a comparison group of non-participants. The summer alternative assessment, the Stanford Achievement Test, Tenth Edition (SAT-10), was offered to students at the end of the Reading Camps and served as the posttest. The Florida Standards Assessment, English Language Arts subtest administered during spring 2015, served as the pretest. Nearly all administrators gave positive reports of each of the core aspects of implementation (i.e., planning, resources, transportation, instructional materials/supplies and curriculum). However, open-ended comments, which offered universal acclaim for the support received, also uncovered some weaknesses regarding the ability of the curriculum to provide for the needs of the most struggling students. The Reading Camps curricula were also rated effective, with most respondents agreeing that they should continue in their present form, and separate analyses of program dosage for the reading instruction and test preparation portions of the program found four-fifths of the schools to have conformed to program guidelines. Therefore, the program was judged to have been properly implemented.
Although the mean scores of students who participated were significantly higher than non-participants’, the accrued gains were not enough to avoid retention. Therefore, students who participated in the Reading Camps were not significantly more likely to meet the cutoff for promotion than students who did not attend the Camps, but only registered to take the test.

Miami-Dade County Public Schools Third Grade Summer Reading Camps
Office of Program Evaluation Page 1
INTRODUCTION
The Third Grade Summer Reading Camps (Reading Camps) is an intensive reading remediation program designed to prepare the students to demonstrate grade level proficiency by earning a passing score on an alternative assessment given at the end of summer school. Students targeted for enrollment are retained third graders. The following report details the evaluation of the twelfth implementation of the camps (summer 2015) and focuses on their impact on the students’ subsequent performance on the alternative assessment test.
Background Florida Statutes currently prohibit social promotion and mandate that students with academic deficiencies be provided with intensive remediation with particular emphasis on the reading proficiency of students in the grades K through 3. Districts are required to develop an academic improvement plan for each student who exhibited a deficiency in reading that would “identify the student’s specific areas of deficiency, . . . , the desired levels of performance in these areas, and the instructional and support services to be provided to meet the desired levels of performance” (Public School Student Progression, 2015). If the student’s reading deficiency is not remedied by the end of the third grade, the student is retained unless s/he meets one of the following six types of "good cause" exemptions: an acceptable level of performance on an alternative assessment; demonstration, through a portfolio, of the ability to read on grade level; status as an English Language Learner, with less than two years in English for Speakers
of Other Languages programs; eligibility for special education (SPED) with an individual education plan (IEP) that
indicates that it is not appropriate to participate in statewide testing; eligibility for SPED without testing exemption with an IEP or 504 plan demonstrating
receipt of two years of intensive remediation in reading, a continuing deficiency in reading, and a previous retention in grades K through 3; or,
receipt of two years of intensive remediation in reading, a continuing deficiency in reading, and two previous retentions in grades K through 3.
Because large numbers of the state’s third graders have historically been in danger of retention due to achieving a score of level 1 on the previously administered Florida Comprehensive Assessment Test, the State called for districts to provide “intensive reading camps” during the summer, designed to prepare such students for the next opportunity to pass the test (Florida Department of Education, n.d.). The program has undergone numerous changes in format and length of delivery since its inception (i.e., 2003) and has produced mixed results. The adoption of the Florida Standards Assessments (2015) created additional challenges as achievement levels were not available in time to make objective promotion decisions. Therefore, best available data, including iReady diagnostic scores (spring 2015) and SAT-10 scores (spring 2014), were used as local alternative promotion criteria. Those criteria may have been more generous than those used in previous years, resulting in fewer, but lower performing, students being recommended for retention.
Miami-Dade County Public Schools Third Grade Summer Reading Camps
Office of Program Evaluation Page 2
Description of the Program The Reading Camps' curriculum that operated in summer 2015 represented a change from the curriculum that operated for the past two summers (i.e., 2013 and 2014). It featured the rotation of small groups through various traditional and computer based activities and one hour of whole- class test preparation. The program in place provided students with four hours of reading and one hour of test preparation activities per day, five days per week, for four weeks. The curriculum that operated within the school day was Flex Literacy developed by McGraw-Hill. The program vendor provided the teachers and assistant principals with a full day of training on all of the components of the program and instructional framework. District staff were also available to answer questions regarding M-DCPS instructional procedures. Teachers received specific training on the print and digital components of the program and on the delivery of test preparation activities for the retained students. The teachers also received Teacher's Edition manuals, test preparation materials, copies of student materials, and student schedules. The following day the teachers reported to their building to set up their classes, assisted by floating curriculum support specialists who were also available to answer implementation questions (Department of Language Arts/Reading, personal communication). The research-based intervention program was principally organized around small-group instruction during which students interacted with comprehensive teacher-led print materials, digital instruction, and collaborative project activities. The following activities were included in the program:
Teacher Guided Critical Thinking Text Connections Project Experiences Literacy Connections Writing Connections Adaptive Technology Interactive Readers
The Department of Language Arts/Reading periodically monitored the delivery of the curriculum during on-site visits to selected Reading Camps. The program vendor also visited every summer service site at least once. Reports of the findings from the vendor's visits were provided to district administrators (Department of Language Arts/Reading). The program that was implemented in 2015 provided students with 20 full days of instruction prior to the alternative assessment. The District's 2015 Summer Implementation Document (Department of Summer Services, 2015) limited participation in the Reading Camps to “retained third grade students” (p. 8). Consequently, the students targeted by the program remained primarily the third graders who had been retained (i.e., were not assigned a “P” promotion code and did not meet one of the "good cause" exemptions).

Miami-Dade County Public Schools Third Grade Summer Reading Camps
Office of Program Evaluation Page 3
Table 1 Features of the Third Grade Summer Reading Camps
Program Features 2011 2012 2013 2014 2015 Hours per day a
Days per week Daily schedule Weeks per term Hours of instruction per term Teacher-student ratio Number of camps Student enrollment
3 5
8:30-11:30 5
60 1:18 33
2,273
3 5
8:30-11:30 5
60 1:18 34
1,833
5 5
8:30-2:00 5
100 1:18 25
2,048
5 5
8:30-2:00 5
100 1:18 25
2,656
5 5
8:30-2:00 5
100 1:18 30
1,279 Note. Each column represents the schedule in effect for that year. a Includes ½ hour for lunch.
Table 1 provides information on various operational features of the Reading Camp program in each summer that it was implemented during the last five years. The 2015 program differed from the 2013 and 2014 program in three ways: (a) the curriculum changed, (b) the number of host sites was increased, and (c) five additional days were added. Table 2 lists the schools that implemented the Reading Camps in 2015.
Table 2 List of Reading Camps, 2015
North Regional Center Central Regional Center
5021 Ben Sheppard 0201 Banyan
0641 Bunche Park 2041 Ben Franklin K-8
0761 Fienberg/Fisher K-8 1601 Edison Park
2911 Linda Lentin K-8 2661 Kensington Park
3421 Marcus A. Milam K-8 5001 Shenandoah
3701 Norland 5201 South Hialeah
3901 North Hialeah 5441 Sylvania Heights
4061 Ojus
South Regional Center Educational Transformation Office
4031 Gateway Environmental Learning K-8 0661 Caribbean
2151 Jack D. Gordon 5991 Charles D. Wyche, Jr.
2651 Kendale Lakes 1401 Charles R. Drew
1371 Marjory S. Douglas 2501 Holmes
4091 Olympia Heights 0081 Lenora B. Smith
4381 Perrine 0073 Mandarin Lakes K-8
5421 Sunset Park 1441 Paul L. Dunbar K-8
5521 Tropical

Miami-Dade County Public Schools Third Grade Summer Reading Camps
Office of Program Evaluation Page 4
METHODOLOGY
Research Questions An evaluation was undertaken by the district’s Office of Program Evaluation to assess the implementation of the Third Grade Summer Reading Camps, to explore the attitudes of responding principals toward the program, and to gauge its impact. The evaluation was guided by two questions:
1. Were the Reading Camps implemented as planned? 2. Did students who participated in the Reading Camps experience better reading
achievement outcomes than students who did not participate?
Data Sources Data were gathered from four sources to address the evaluation questions. The first source of data consisted of a review of documents obtained from the District’s Division of Language Arts/Reading, the District’s School Choice and Parental Options, and the Florida Department of Education. The second source of data was an online survey of principals designed to measure various aspects of the summer program including enrollment, planning, staffing, transportation, resources, materials, supplies, and specific curricular factors. The third source and fourth sources of data were students' demographic and assessment records maintained on the District's mainframe computer system. Each of the data sources will be discussed in detail in ensuing sections.
Implementation
Implementation was examined so that any observed effects on participants’ achievement could be properly attributed to the program. This portion of the evaluation was concerned with determining whether the Reading Camps were being operated as specified; and, whether or not sufficient planning, resources, and support were evident. Data were gathered from an online survey of principals entitled the Summer Reading Camps Implementation Survey to gauge implementation. (A copy of the survey may be found in Appendix A). All participating schools were included in this portion of the evaluation. The Summer Reading Camps Implementation Survey measures various aspects of the summer program including enrollment, planning, staffing, transportation, resources, materials, supplies, and specific curricular factors (i.e.; dosage, frequency, and duration of treatment; engagement; and, perceived effectiveness). The survey comprised 26 items of which 21 adhered to a Likert-type format with response options that varied. Two filter questions (15 and 27) were used to enable a branching process to bypass items that were not applicable to specific respondents. The first three items obtained identification, enrollment, and programmatic information; three items (4-6) assessed the adequacy of planning, and staffing levels; three items (7-9) pertained to transportation; and two items (10-11) addressed the sufficiency of instructional materials and supplies.

Miami-Dade County Public Schools Third Grade Summer Reading Camps
Office of Program Evaluation Page 5
Twelve program-specific curricular questions were also defined: three items (12-14) addressed the name, instructional format and dosage of the program; two items (16 and 18) examined the duration of test preparation and the number of computer work stations. Three items assessed the adequacy of the curriculum and three items (19-21) assessed the adequacy of the curriculum in terms of differentiated instruction, engagement, and effectiveness. Four summary items (22-25) solicited respondents’ impressions of the support that was available and of the program as a whole. Finally, space was provided to give respondents the option of suggesting areas for improvement. A total of 15 items measured implementation. The survey was administered online to assistant principals charged with implementing the program at participating sites during July and August 2015. Key items were organized into one of four implementation categories: Planning, Resources, Transportation, and Curriculum/Instruction. The percent of positive responses within a category are classified as 0-50 (not implemented), 51-69 (partially implemented), and 70-100 (fully implemented). Otherwise, the analysis of the results of the Summer Reading Camps Implementation Survey was limited to descriptive statistics. An attitudinal component measured principals’ summative perceptions of the program. The issues addressed included technical support, effectiveness, satisfaction with the status quo, and suggestions for improvement. Data for this component were drawn from the Summer Implementation Survey. Two of those items (22 and 25) measured attitude. The analysis of the results for the attitudinal component was limited to descriptive statistics.
Program Impact
Design and Samples
A non-equivalent groups quasi-experimental design (Campbell & Stanley, 1963) was used to compare the performance of students who participated in the Reading Camps with students who did not, using pretest scores to equate the groups' performance prior to exposure and posttest scores to measure their performance afterwards. The groups were considered nonequivalent because group membership was not assigned randomly. Of the 27,137 students third grade students who entered M-DCPS from August 18, 2014 to March 29, 2015 and were active at the end of the 2014-15 school year, 23.3% (n = 6,314) were slated for retention. A subset of those students (n = 4,845) qualified for one or more of the good cause exemptions delineated by the state. Table 3 lists the number and percent of students who utilized each exemption. Students listed as receiving an exemption based on the Portfolio and/or an Alternative assessment (i.e., Spring 2015 iReady and Spring 2014 SAT-10) earned a passing score on one of those measures. The remaining 1,469 students were eligible to attend the Reading Camps.

Miami-Dade County Public Schools Third Grade Summer Reading Camps
Office of Program Evaluation Page 6
Table 3
Good Cause Exemptions to Mandatory Retention Granted to M-DCPS Third Graders, 2014-15
n %
English Language Learnera 675 13.9 Students with Disabilitiesb 448 9.2 Alternative Assessment 2,965 61.2 Portfolio Assessment 118 2.4 Otherc 639 13.2 Total 4,845 100.0
Note. Percentages may not total to 100 due to rounding. aStudents with less than two years in an English for Speakers of Other Languages Program. bStudents with Disabilities who were previously retained and had two or more years of intensive remediation or for whom statewide assessment is not appropriate. c Includes students who received intensive remediation for two or more years and were previously retained for two years.
The students who completed the Reading Camps comprised the treatment pool. A comparison group was also defined which consisted of the eligible students who did not participate in the program. Students who participated but did not complete the program (n=33) and students who previously participated in the Summer Reading Camps (n=7) were excluded from both groups. As such, 97.3% of the 1,469 students slated for retention (n=1,429) were eligible to be included. The treatment pool was comprised of the 948 students who completed the Reading Camps and the comparison pool was comprised of the 481 students who did not have current or previous exposure to the program. Nine of the students drawn from those who completed the Reading Camps attended charter schools and were excluded from the analysis. Of the 939 students in the program pool, 92.9% (n = 872) had valid pre- and post- test (i.e., spring and summer alternative assessment) scores, and constituted the treatment groups. Of the 481 students in the comparison pool, only 9.4% (n = 45) had valid pre- and post- test scores, and constituted the comparison group. The characteristics of the final sample are described in Table 4. It lists for each subgroup the percentage of students in the program groups and the comparison group.

Miami-Dade County Public Schools Third Grade Summer Reading Camps
Office of Program Evaluation Page 7
Table 4 The Groups’ Demographic Characteristics as a Percentage of the Sample
Subgroup Reading
Camps Comparison
Gender Male 64.7 82.2 a Female 35.3 17.8
Ethnicity Black 39.7 13.3 b Non-Black 60.3 86.7
Eligible 96.8 35.6 c Non-Eligible 3.2 64.4
Current 48.1 26.7 d Former 1.7 2.2 Never 50.2 71.1
Special Education Disabled 25.5 22.2 Non-Disabled 74.5 77.8 Over Age for Grade Overage 20.9 11.1 Non-Overage 79.1 88.9 Age 9.5 9.4 N 872 45 Note. Statistically significant differences between the programs' demographic distributions within the subgroups are denoted by superscripts. Age is expressed in years. aφ (1,917) = .08, p < .05. bφ (1,917) = .12, p < .001. cφ (1,917) = .55, p < .001. \dφ (2,917) = .09, p < .05.
Table 4 shows that the Gender, Ethnicity, Free/Reduced Price Lunch, and English Language Learner distribution differed significantly among the program groups.
Instrumentation The posttest used for this analysis was the Reading Comprehension subtest of the Stanford Achievement Test, Tenth Edition, SAT-10, a standardized norm-referenced test designed to measure students’ performance in comparison to a national normative sample, and to facilitate comparisons among individuals and groups. It is currently administered by the district to third grade students as an Alternative Assessment for Grade Three Promotion (AAGTP) at the end of summer school. The Florida Standards Assessments, English Language Arts subtest (FSA/ELA) served as the pretest. The FSA/ELA, a criterion referenced test administered statewide each spring to students in Grades 3-8, is the primary accountability measure used in the state of Florida.
Data Analyses

Miami-Dade County Public Schools Third Grade Summer Reading Camps
Office of Program Evaluation Page 8
The question of whether participants benefitted by attending the Reading Camps is complex. First, did students score higher on the alternative assessment than they would have had they not attended? Second, was the improvement, if any, sufficient to meet the passing criterion established for promotion? Demographic and pretest differences are known to influence achievement so that any between-group variation on such variables can mask the program's impact. Therefore, the application of the quasi-experimental design used regression analysis to compare the groups’ posttest scores, while controlling for students’ initial ability and demographic characteristics. Improvement The question of whether participants scored higher on the alternative assessment than non-participants was gauged through a regression analysis that estimated the impact of the program on the students' posttest scores, controlling for students’ pretest scores and demographic characteristics. Students’ demographic characteristics, pretest, and program participation were the main predictors in the model. Interaction terms were also included to determine if the impact of the Reading Camps program was affected by prior participation in the Rising Literacy program, differed with students’ pretest scores, or some combination of both. Promotion The question of whether participants were more likely than non-participants to have scored high enough on the alternative assessment to be promoted was gauged through a logistic regression analysis that estimated the impact of the program on the likelihood that students' would exceed the criterion for passing the alternative assessment, controlling for students’ pretest scores and demographic characteristics. The passing criterion was the attainment of a score at or above the 45th percentile on the AATGP, which is the cutoff for promotion to the fourth grade. Participation in Literacy for Rising 3rd Grade Students (a summer program designed to provide compensatory instruction to low achieving students entering third grade), which may have influenced the impact of the Summer Reading Camps, was also included as a covariate in the analysis. Students' demographic characteristics (i.e., Gender, Ethnicity, Free/Reduced Price Lunch eligibility, English Language Learner status, Special Education participation, and over age for grade status), pretest, and program participation (i.e., Reading Camps, 1=participant, 0=non-participant and Rising Literacy (1=participant, 0=non-participant) were the main predictors in the model. Interaction terms (Reading Camps x Pretest, Rising Literacy x Pretest, and Reading Camps x Rising Literacy x Pretest) were also included to ascertain whether the impact of the Reading Camps program was affected by prior participation in the Rising Literacy program, differed with students’ pretest scores, or some combination of both.
Miami-Dade County Public Schools Third Grade Summer Reading Camps
Office of Program Evaluation Page 9
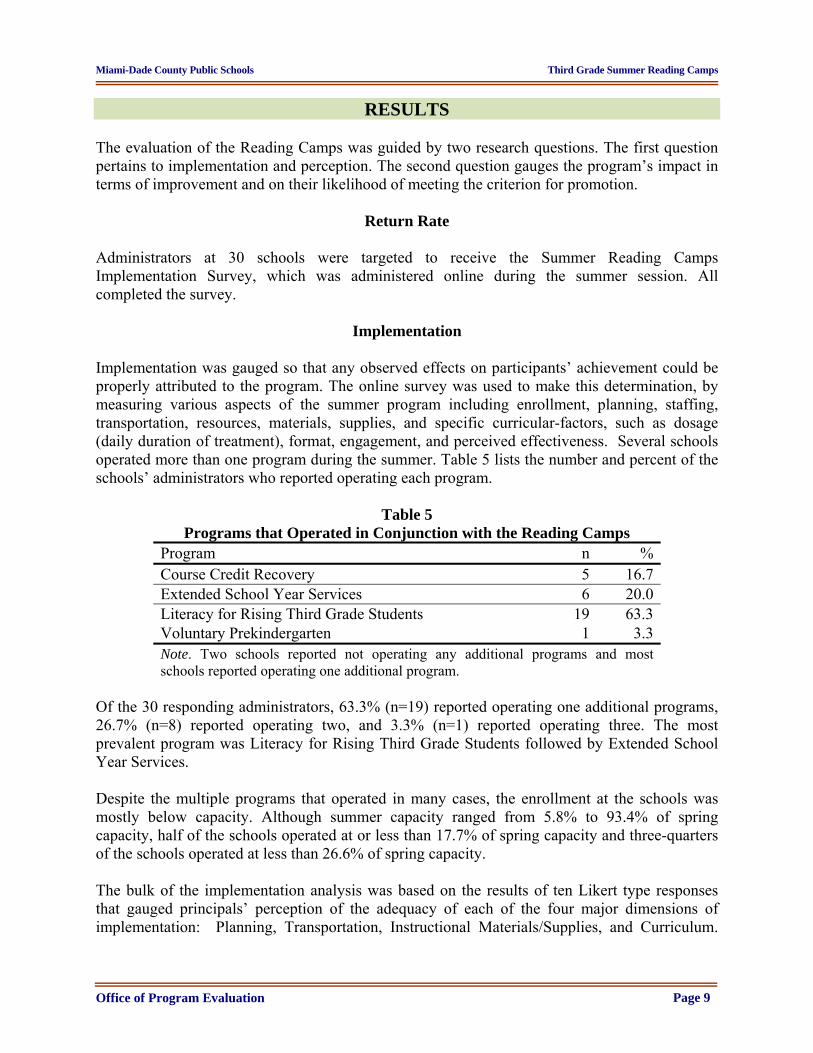
RESULTS The evaluation of the Reading Camps was guided by two research questions. The first question pertains to implementation and perception. The second question gauges the program’s impact in terms of improvement and on their likelihood of meeting the criterion for promotion.
Return Rate
Administrators at 30 schools were targeted to receive the Summer Reading Camps Implementation Survey, which was administered online during the summer session. All completed the survey.
Implementation
Implementation was gauged so that any observed effects on participants’ achievement could be properly attributed to the program. The online survey was used to make this determination, by measuring various aspects of the summer program including enrollment, planning, staffing, transportation, resources, materials, supplies, and specific curricular-factors, such as dosage (daily duration of treatment), format, engagement, and perceived effectiveness. Several schools operated more than one program during the summer. Table 5 lists the number and percent of the schools’ administrators who reported operating each program.
Table 5 Programs that Operated in Conjunction with the Reading Camps
Program n % Course Credit Recovery 5 16.7 Extended School Year Services 6 20.0 Literacy for Rising Third Grade Students 19 63.3 Voluntary Prekindergarten 1 3.3 Note. Two schools reported not operating any additional programs and most schools reported operating one additional program.
Of the 30 responding administrators, 63.3% (n=19) reported operating one additional programs, 26.7% (n=8) reported operating two, and 3.3% (n=1) reported operating three. The most prevalent program was Literacy for Rising Third Grade Students followed by Extended School Year Services. Despite the multiple programs that operated in many cases, the enrollment at the schools was mostly below capacity. Although summer capacity ranged from 5.8% to 93.4% of spring capacity, half of the schools operated at or less than 17.7% of spring capacity and three-quarters of the schools operated at less than 26.6% of spring capacity. The bulk of the implementation analysis was based on the results of ten Likert type responses that gauged principals’ perception of the adequacy of each of the four major dimensions of implementation: Planning, Transportation, Instructional Materials/Supplies, and Curriculum.

Miami-Dade County Public Schools Third Grade Summer Reading Camps
Office of Program Evaluation Page 10
Table 6 lists the positive and negative response options (classified according to a rubric) for each implementation dimension.
Table 6 Response Option Categories Assigned
to Each Implementation Dimension
Response Option Category Positive Negative
Implementation Dimension Response Option Response Option Planning Adequate Less than adequate
More than adequate
Transportation Usually on time Mostly not on time
Mostly on time Usually not on time
Instructional Materials/Supplies An appropriate level Less than needed
More than needed Much less than needed
Much more than needed
Curriculum Average Poor
Good Fair
Very good
Table 7 lists the number and percent of principals who responded positively and negatively to each item within each implementation dimension. A total line is also provided that summarizes the responses within each dimension. Total scores for each dimension are classified as: 0-49.9% (not implemented), 50-69.9% (partially implemented – dark), and 70-100% (fully implemented – light).

Miami-Dade County Public Schools Third Grade Summer Reading Camps
Office of Program Evaluation Page 11
Table 7 Principals’ Responses to Selected Items Addressing Implementation
Positive Negative
Dimension/Item n % n % Planning
4 How well was your summer location informed about the academic needs of the students who would be attending?
30 100.0 0 0.0
5 How well was your summer location informed of the number of students that would be attending?
30 100.0 0 0.0
6 How adequate were the instructional staffing levels at the school, relative to the number of students that attended
28 93.3 2 6.7
Total 97.8 2.2
Transportation
8 To what extent did the arrival of the buses typically align with the schedule of the school?
30 100.0 0 0.0
9 To what extent did the departure of the buses typically align with the schedule of the school?
30 100.0 0 0.0
Total 100.0 0.0
Instructional Materials/Supplies
10 How sufficient was the amount of curricular materials (i.e., books, workbooks, manipulatives, etc.) available?
27 90.0 3 10.0
11 How sufficient was the amount of instructional supplies (i.e., computers, whiteboards, pencils, paper, etc.) available?
28 93.3 2 6.7
Total 91.7 8.3
Curriculum
19 How would you rate the ability of the curriculum to remediate different students with different learning problems in the same classroom at the same time?
28 93.3 2 6.7
20 How would you rate the engagement of students in the curricular activities? 30 100.0 0 0.0
21 How would you rate the effectiveness of the curriculum at addressing the skills deficits of the students?
28 93.3 2 6.7
Total 95.6 4.4
Note. Total scores for each aspect are categorized as follows: 0-49.9% (not implemented - orange), 50-69.9% (partially implemented – yellow), and 70-100% (fully implemented – blue). Percentages may not add to 100 due to rounding.
The table shows that nearly all of the administrators rated planning, for the number and needs of students who would be attending their schools, positively. Staffing levels were assessed positively as a result. In terms of planning, the program may be considered to be fully implemented. On the issue of transportation, all administrators reported that the arrival and departure of the school buses aligned with the school schedule. In terms of transportation, the program may be considered to be fully implemented.
On the issue of Instructional Materials/Supplies, nearly all of the administrators felt that the amount of curricular materials and instructional supplies was adequate. In terms of instructional materials/supplies, the program may be considered to be fully implemented.

Miami-Dade County Public Schools Third Grade Summer Reading Camps
Office of Program Evaluation Page 12
Curriculum was an important area of inquiry and as such was addressed by four items, one of which asked respondents to identify the primary program operating in their school. While 96.7% of the administrators (n=29) identified Flex Literacy as the principal curricular program operating in the Reading Camps, 3.3% (n=14) identified SAT-10 Prep as such. Nearly all respondents felt that the curriculum was able to remediate students with different learning problems within the same classroom, that its subject matter was engaging to students, and that it was effective at addressing their skill deficits. On the issue of curriculum, the program may be considered to be fully implemented.
Finally, administrators were asked to indicate the daily time and format for delivery of the principal curriculum, the presence and quantity of computer workstations, and the estimated time in test preparation activities, the number of computer workstations, and the format of the program allotted to the curriculum. The recommended daily dosage is 225 minutes for Flex Literacy and 60 minutes for SAT-10 Prep as per program guidelines. For the purposes of this analysis, the ranges encompassing those recommended times are 181 to 240 minutes for Flex Literacy and 31 minutes to 60 minutes for SAT-10 Prep. Therefore, schools that implemented Flex Literacy for 181 minutes or more, and SAT-10 Prep for 31 minutes or more, were judged to have been properly implemented. While all schools reported implementing operating the principal curricular program (Flex Literacy), three schools did not provide daily test preparation activities as specified. Table 8 lists the estimated time spent in test preparation and Flex Literacy instructional time.
Table 8
Crosstablulation of Daily Flex Literacy Dosage x SAT-10 Prep Dosage
SAT-10 Prep (minutes)
Flex Literacy (minutes) 31 to 60 61 to 90 121 or more Total 61 to 120 0 1 0 1
121 to 180 1 1 0 2 181 to 240 1 1 0 2 241 to 300 16 1 1 18
301 or more 2 1 1 4 Total 20 5 2 27
Note. Schools that implemented Flex Literacy for 181 minutes or more and SAT-10 Prep for 30 minutes or more were judged to be properly implemented (shaded). Three schools (not shown above) that did not report using Flex Literacy were considered to have not properly implemented the program.
Cells in the rows three through six of the table depict schools that correctly implemented the curriculum, as evidenced by exposure to each component that is greater than or equal to that specified by program guidelines. Table 8 shows that the (24 of the 27) schools in the shaded region properly implemented the program and three schools additional schools not shown in the table did not report using Flex Literacy. As such, 80% of the schools that hosted the Reading Camps (24 of 30) properly implemented the program.
Miami-Dade County Public Schools Third Grade Summer Reading Camps
Office of Program Evaluation Page 13
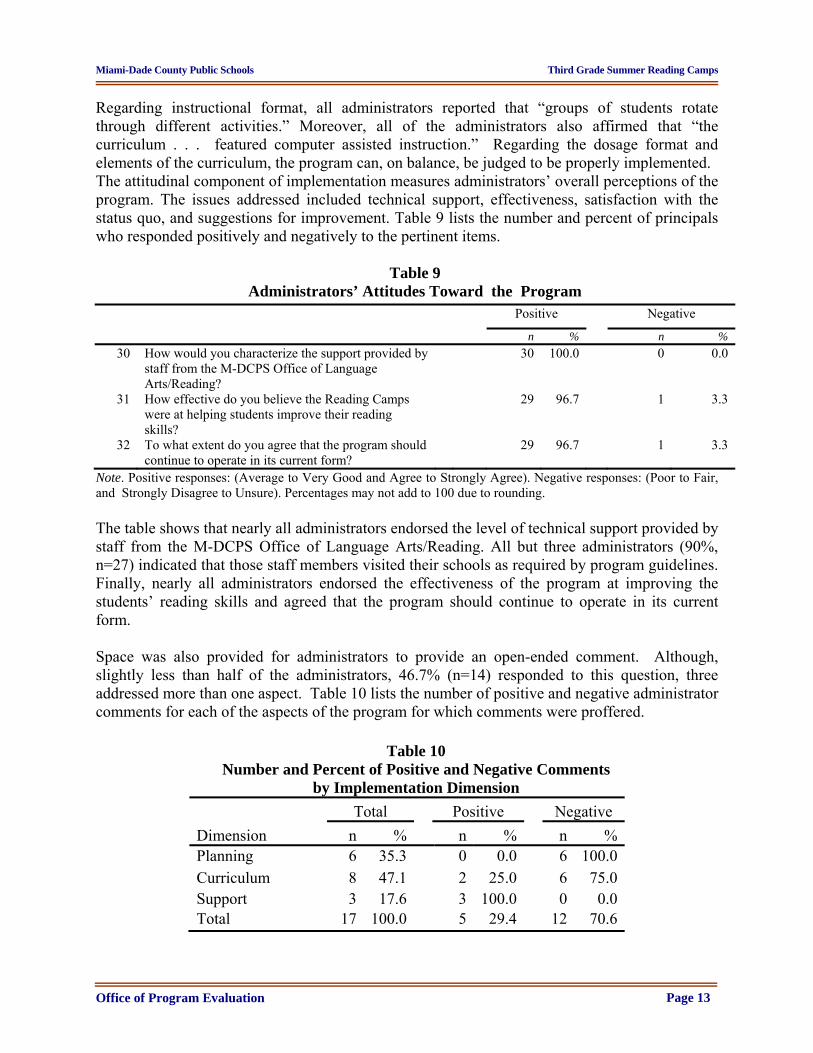
Regarding instructional format, all administrators reported that “groups of students rotate through different activities.” Moreover, all of the administrators also affirmed that “the curriculum . . . featured computer assisted instruction.” Regarding the dosage format and elements of the curriculum, the program can, on balance, be judged to be properly implemented. The attitudinal component of implementation measures administrators’ overall perceptions of the program. The issues addressed included technical support, effectiveness, satisfaction with the status quo, and suggestions for improvement. Table 9 lists the number and percent of principals who responded positively and negatively to the pertinent items.
Table 9
Administrators’ Attitudes Toward the Program Positive Negative
n % n %
30 How would you characterize the support provided by staff from the M-DCPS Office of Language Arts/Reading?
30 100.0 0 0.0
31 How effective do you believe the Reading Camps were at helping students improve their reading skills?
29 96.7 1 3.3
32 To what extent do you agree that the program should continue to operate in its current form?
29 96.7 1 3.3
Note. Positive responses: (Average to Very Good and Agree to Strongly Agree). Negative responses: (Poor to Fair, and Strongly Disagree to Unsure). Percentages may not add to 100 due to rounding. The table shows that nearly all administrators endorsed the level of technical support provided by staff from the M-DCPS Office of Language Arts/Reading. All but three administrators (90%, n=27) indicated that those staff members visited their schools as required by program guidelines. Finally, nearly all administrators endorsed the effectiveness of the program at improving the students’ reading skills and agreed that the program should continue to operate in its current form. Space was also provided for administrators to provide an open-ended comment. Although, slightly less than half of the administrators, 46.7% (n=14) responded to this question, three addressed more than one aspect. Table 10 lists the number of positive and negative administrator comments for each of the aspects of the program for which comments were proffered.
Table 10 Number and Percent of Positive and Negative Comments
by Implementation Dimension
Total Positive Negative
Dimension n % n % n % Planning 6 35.3 0 0.0 6 100.0 Curriculum 8 47.1 2 25.0 6 75.0 Support 3 17.6 3 100.0 0 0.0 Total 17 100.0 5 29.4 12 70.6

Miami-Dade County Public Schools Third Grade Summer Reading Camps
Office of Program Evaluation Page 14
Eight of the comments, concerned the curriculum, of which three quarters were negative and one-quarter were positive. The bulk of the negative comments related to the ability of the curriculum to provide for the needs of the most struggling students. One administrator felt,
There was not enough prior knowledge of the students nor good diagnostics to be able to assess the students at their current level to be able to differentiate the instruction. Groups were too large . . . and [the] curriculum was too broad. It did not allow you to introduce the story in a whole group before the students had to do independent work. Independent work was at a higher level and needed more teacher support than the program allowed.
A second administrator noted,
[Although], the program . . . will help [the retained students] continue to practice reading . . . , it may be difficult for students who have [repeatedly] failed to pass the many opportunities they were given before the end of the year. The retained third grade students would benefit from very small group instruction in a homogeneous setting.
A third administrator recalled, “The teachers recommend utilizing a lower level book since the summer population is comprised of struggling readers. The teachers did state that the program is good, but the readability is too high for the students to work independently.” Six of the comments, all negative, concerned planning, of which two of the comments concerned the manner in which technology was implemented: One administrator said, “It would be helpful if the summer school sites knew in advance that technology would be needed for the curriculum.” Another administrator added, “This program included an online component that was not ready for students and teachers to use the first day of summer school. Hopefully, these issues will be looked at in the future to avoid delaying the delivery of effective instruction.” The adequacy of training was also addressed. One administrator felt, “Professional development should be held more in advance to provide teachers with additional time to process the information and plan accordingly.” Three of the comments concerned support provided, of which all were positive. One administrator stated, “The support from the Language Arts Department, Region and District Staff to help allocate additional staff to work with our large number of special education students [was] greatly appreciated. Another administrator added, “The Language Arts Department did an amazing job training teachers and Assistant Principals [and] provided on-going support.” He continued by noting, “Our curriculum support specialist was extremely helpful, especially in working through the initial "glitches" experienced at the beginning of camp as related to computer issues.” A third administrator felt, “The support provided by the curriculum support specialist was instrumental in the implementation and development of the program. [She] was amazing in providing ongoing support to our teachers and students.” In sum, nearly all administrators gave positive reports of each of the core aspects of implementation (i.e., planning, resources, transportation, instructional materials/supplies and curriculum). However, open-ended comments, which offered universal acclaim for the support

Miami-Dade County Public Schools Third Grade Summer Reading Camps
Office of Program Evaluation Page 15
received, also uncovered some weaknesses regarding the ability of the curriculum to provide for the needs of the most struggling students. The Reading Camps curricula were rated effective with most respondents agreeing that they should continue in their present form and separate analyses of program dosage for the reading instruction and test preparation portions of the program, found four-fifths of the schools to have conformed to program guidelines. Therefore, the program may be judged to have been properly implemented.
Program Impact
The quasi-experimental designs were applied by using regression analyses to compare the posttest scores of participating and non-participating students. The analyses controlled for students’ demographic characteristics and initial ability as measured by their pretest scores. Of the 917 students included in this analysis, 9.6% (n=84) of the students who attended the Reading Camps and 4.4% (n=2) of the students who did not, passed the AATGP administered at the end of summer school. Improvement Regression analysis was used to apply the quasi-experimental non-equivalent groups design to compare the groups’ posttest scores in order to estimate the program’s impact on the students’ reading achievement, regardless of whether or not the students passed the alternative assessment. Table 11 depicts the results of the analysis and lists for each effect, the mean and standard error of its unstandardized predictor weight, followed by the standardized weight, followed by the results of a test which gauges the statistical significance of that weight. The model R2 is an effect size that classifies the proportion of variation in the outcome explained by the predictors in the model as .01 (weak), .13 (moderate), and .26 (strong), Cohen (1988).
Table 11 Regression Analysis of the Posttest Scores (R2 = .22, n = 917)
Predictor Unstandardized (B)
t M S.E. Standardized (β) Intercept 575.12 3.55 161.89 *** Black -5.93 1.82 -0.11 -3.25 ** English Language Learner - Current -4.60 1.78 -0.09 -2.59 ** English Language Learner - Former 17.18 6.62 0.08 2.59 ** Special Education -8.72 1.79 -0.14 -4.88 *** Pretest 1.52 0.11 0.39 13.23 *** Reading Camps 12.61 3.64 0.10 3.46 ***
Note. The weights represent the influence on the criterion variable of a unit change in the predictor. All predictors are expressed as deviations from the sample mean (i.e., grand-mean centered). Unstandardized weights are in original units. Standardized weights result from rescaling all variables to zero mean and unit variance. The t statistic represents the ratio of the mean weight to its standard error and tests whether the weight is significantly different from zero. *p < .05. **p < .01. ***p < .001
All continuous predictors are expressed as deviations from their sample mean value. Therefore, the intercept gives the value of the outcome variable when all dichotomous predictors are at their references values (i.e., non-Black, non-ELL, non-SPED/non-Gifted, non-Reading Camps participant) and the continuous predictors are equal to their sample mean values. The table gives

Miami-Dade County Public Schools Third Grade Summer Reading Camps
Office of Program Evaluation Page 16
the incremental impact of a one point change in each predictor on the students’ posttest scores, when all the remaining predictors are included in the model. The second through fifth predictors are dichotomously coded so their predictor weights give the difference in the outcome variable between the group coded “1” (i.e., the listed group) and the group coded “0.” Table 11 shows that Black, Current-ELL, and SPED students scored lower on the posttest, while Former-ELL students scored higher. Each one t-score point increase in the pretest score above the sample mean (31.75) predicts a 1.52 point increase on the posttest. Students who participated in the Rising Camps scored a significant 12.61 points higher on the posttest than students who did not participate. Examination of the standardized weights for the main effects show students' pretest scores to have the strongest effect on the posttest followed by SPED status. Less influential were classification as Black and Current and Former-ELL status. Promotion The program’s impact on the likelihood that participants would pass the alternative assessment, and ultimately be promoted, was gauged through a special regression analysis that compared the odds of exceeding the cutoff for participating and non-participating students after their demographic characteristics and pretest scores were taken into account. The posttest scores were converted to pass/fail outcomes based on whether or not the scores met or exceeded the criterion for promotion (i.e., 45th percentile). The analysis estimates the impact of the various predictors including the program impact in terms of the odds1 of passing. Table 12 lists for each effect, the predictor weight (B) and its standard error (SE) followed by the change in the odds ratio due to the predictor, and the Wald statistic used to gauge its statistical significance.
Table 12 Logistic Regression Analysis of the Posttest Scores (R2 = .17, n = 917)
B S.E. Odds Ratio Wald Intercept -3.16 0.75 0.04 17.70 ***
Black -0.60 0.26 0.55 5.18 *
English Language Learner (ELL) - Former 1.41 0.62 4.10 5.24 *
Special Education (SPED) -1.22 0.39 0.30 9.78 **
Pretest 0.12 0.02 1.13 37.20 ***
Reading Camps 1.03 0.76 2.81 1.87
Note. All predictors are grand-mean centered. B gives the predictor weight, which is the influence of the indicated effect on the outcome variable expressed on a log-odds scale. Wald is a measure of statistical significance given by the square of the ratio of B to its standard error. The odds ratio is found by raising the base of the natural logarithm to the power given by the predictor. This gives the probability of meeting the criterion divided by the probability of not meeting the criterion.
* p < .05. *** p < .001.
The Intercept gives the odds (0.04 to 1) of passing (i.e., 3.8%), for a student who is in the reference group, i.e., non-Black, English Language Learner (ELL)/non-ELL, non-Special
1 Odds, which represent the likelihood of passing divided by the likelihood of failing, enable the discontinuous change from failing to passing to be mathematically modeled as a smooth transition called a logistic curve.

Miami-Dade County Public Schools Third Grade Summer Reading Camps
Office of Program Evaluation Page 17
Education (SPED)/Gifted with a pretest score equal to the sample mean (i.e., t-score=31.75, 6th percentile). The odds of passing were lower for Black and SPED students and higher for Former English Language Learners than their non-Black, non-SPED/non-Gifted and Current-ELL/non-ELL counterparts, respectively. Each one t-score point increase in the pretest above the sample mean predicts a 1.13 to 1 increase in students’ odds of passing the promotion criterion (i.e., a score of 618 or higher on the AATGP). The odds of passing the test for students who completed the Reading Camps were, on average, a non-significant 2.81 times higher than those who did not participate, once their pretest scores and demographic characteristics were taken into account. In sum, the Reading Camps had a significant effect on participants’ posttest score, but did not have a significant impact on their chances of passing the AAGTP. This indicates that the program did significantly improve participating students’ reading ability, but not enough to improve their chances of being promoted.
DISCUSSION The district undertook an evaluation to gauge whether students who completed the state-mandated Third Grade Summer Reading Camps exhibited improved performance on the alternative assessment when compared to a comparison group of students who did not participate.
Summary
The evaluation of the Reading Camps described the operation and assessed outcome measures for the program that operated during its eleventh year of implementation. Conducted by the district’s Office of Program Evaluation, the study was guided by a series of questions that can now be answered. 1. Were the Reading Camps implemented as planned?
Nearly all administrators gave positive reports of each of the core aspects of implementation (i.e., planning, resources, transportation, instructional materials/supplies and curriculum). The Reading Camps curricula were also rated effective with most respondents agreeing that they should continue in their present form and separate analyses of program dosage for the reading instruction and test preparation portions of the program, found four-fifths of the schools to have conformed to program guidelines. However, some open-ended comments, which offered universal acclaim for the support received, also uncovered some weaknesses regarding the ability of the curriculum to provide for the needs of the most struggling students. Nonetheless, the program may be judged to have been properly implemented.
2. Did students who participated in the Reading Camps experience better reading
achievement outcomes than students who did not participate?

Miami-Dade County Public Schools Third Grade Summer Reading Camps
Office of Program Evaluation Page 18
Although, the mean scores of students who participated were significantly higher than those who did not, the accrued gains were not enough to avoid retention. Therefore, students who participated in the Reading Camps were not significantly more likely to meet the cutoff for promotion than students who did not attend but only registered to take the test.
Conclusions An evaluation of the Summer Reading Camps found participating students’ reading skills improved over similarly scoring students who did not attend, but the improvement realized was not high enough to result in promotion to the fourth grade. The recent adoption of the Florida Standards Assessments left districts without established achievement levels to make objective promotion decisions. Although, the best available data were used to establish local alternative promotion criteria, those ultimately applied may have been more generous than in previous years. As such fewer, but lower performing, students may have been recommended for participation in the program, leading to smaller percentages being able to master the content required for promotion.

Miami-Dade County Public Schools Third Grade Summer Reading Camps
Office of Program Evaluation Page 19
REFERENCES
Campbell, D.F., &, Stanley, J.C. (1963). Experimental and quasi-experimental designs for research. Boston: Houghton Mifflin.
Cohen, J. (1988). Statistical power analysis for the behavioral sciences. Hillsdale, NJ: Lawrence
Erlbaum Associates. Department of Language Arts/Reading (personal communication). Description of the remedial
components for third grade students. (Email transmittal, May 7, 2013). Miami, FL: Miami-Dade County Public Schools.
Department of Summer Services (2015). 2015 Summer Implementation Document. Miami, FL:
Miami-Dade County Public Schools. Retrieved July 28, 2015, from http://summerschool.dadeschools.net/pdfs13/implementation_doc.pdf
Florida Department of Education. (2008). Critical information for parents of third graders
[Electronic version] Retrieved July 27, 2013 from http://flbsi.org/pdf/2008ReadtoLearn.pdf
McLoyd, V. C. (1990). The impact of economic hardship on black families and children:
Psychological stress, parenting, and socioemotional development. Child Development, 61(1).
Public School Student Progression; Remedial Instruction; Reporting Requirements [Electronic
version], 48 Fla. Stat. §1008.25 (2014). Retrieved July 23, 2014, from http://www.flsenate.gov/Laws/Statutes/2013/1008.25
20
Appendix A
Summer School Implementation Survey

21
Summer Reading Camps Implementation Survey, 2015
InstructionsThis survey is designed to assess various aspects of the implementation of the Summer Reading Camp for Retained 3rd Graders offered at the school to which you are assigned during the 2015 summer. The information that you provide will be used to furnish formative feedback and inform future planning in the areas of logistics, human resources, and curriculum for this program. Please reflect honestly on your experience as a summer administrator and answer each item in the survey to the best of your ability. If you have any questions or need assistance with this survey you may contact Dr. Steven M. Urdegar at (305) 995-7538 Thank you in advance for your cooperation.
Preamble
1.Please select thename/locationnumberof the summer locationaboutwhich youwillbecompletingtheitemsthatfollowfromthedropdownlistprovided.
(Select only one) BANYAN EL (0201) BEN FRANKLIN K‐8 CENTER (2041) BEN SHEPPARD EL (5021) BUNCHE PARK EL (0641) CARIBBEAN EL (0661) CHARLES D. WYCHE, JR. (5991) CHARLES R DREW EL (1401) EDISON PARK EL (1601) FIENBERG/FISHER K‐8 (0761) GATEWAY ENV K‐8 LEARN (4031) HOLMES ELEMENTARY (2501) JACK D GORDON EL (2151) KENDALE LAKES EL (2651) KENSINGTON PARK EL (2661) LENORA BRAYNON SMITH (0081) LINDA LENTIN K‐8 CNTR (2911) MANDARIN LAKES K‐8 (0073) MARCUS A MILAM K‐8 CN (3421) MARJORY S DOUGLAS EL (1371) NORLAND EL (3701) NORTH HIALEAH EL (3901) OJUS EL (4061) OLYMPIA HEIGHTS EL (4091) PAUL LAURENCE DUNBAR E (1441) PERRINE ELEMENTARY (4381) SHENANDOAH EL (5001) SOUTH HIALEAH EL (5201) SUNSET PARK EL (5421)

22
SYLVANIA HEIGHTS EL (5441) TROPICAL EL (5521)
IntroductionThe items that follow pertain to the school to which you are assigned during the summer.
2.Approximately,howmanystudentsareparticipatinginoneormoreoftheprogramsofferedduringthesummeratyourpresentsummerlocation?
(Provide only one response)
PlanningThe items that follow pertain to ALL the programs operating at the school during the summer session.
3. Which other programs operate during the summer at your present summerlocation?
(Select all that apply) Course Credit Recovery Extended School Year (ESY) Services Literacy for Rising 3rd Grade Students (between 26th and 49th percentile) on the
SAT‐10, Grade 2 Reading Comprehension Subtest) Summer Voluntary Pre‐Kindergarten (VPK) Other (specify):
4. Howwell has your present summer location been informed about the academicneedsofthestudentswhowouldbeattending?
(Select only one) Less than adequately Adequately More than adequately Not applicable
5.Howwellhasyoursummer locationbeen informedofthenumberofstudentsthatwouldbeattending?
(Select only one) Less than adequately Adequately More than adequately Not applicable
6.Howadequatearetheinstructionalstaffinglevelsatyourpresentsummerlocation,relativetothenumberofstudentsthatattended
(Select only one) Less than adequate Adequately

23
More than Adequate Not applicable
Transportation1
7.Isbustransportationprovidedtoyourpresentsummerlocation?(Select only one) Yes No Don't know
Transportation2
8.Towhatextentdoesthearrivalofthebusestypicallyalignwiththescheduleofyourpresentsummerlocation?
(Select only one) Mostly not on time Usually not on time Usually on time Mostly on time
9.Towhatextentdoesthedepartureofthebusestypicallyalignwiththescheduleofyourpresentsummerlocation?
(Select only one) Mostly not on time Usually not on time Usually on time Mostly on time
InstructionThe remaining items in this survey pertain ONLY to the Summer Reading Camps program for third grade students slated for retention
10. How sufficient is the amount of curricular materials (i.e., books, workbooks,manipulatives,etc.)available?
(Select only one) Much less than needed Somewhat less than needed An appropriate level More than needed Much more than needed
11.Howsufficientistheamountofinstructionalsupplies(i.e.,computers,whiteboards,pencils,paper,etc.)available?
(Select only one) Much less than needed Somewhat less than needed

24
An appropriate level More than needed Much more than needed
Curriculum1
12.Whatisthenameoftheprincipalcurricularprogramthatoperatesinyourpresentsummerlocation?
(Select only one) Flex Literacy (McGraw‐Hill) After the Bell (Scholastic) Time Warp (Voyager) Other (specify):
13. How are the classrooms in your present summer location organized for themajorityofinstruction?
(Select only one) Whole class works on the same activity Groups of students rotate through different activities Each student practices a different skill Other (specify):
14.Howmanyminutesdailydoesyourpresentsummerlocationdevotetoinstruction?(Select only one) less than 60 61 to 120 121 to 180 181 to 240 241 to 300 301 or more
Curriculum2
15. Does your present summer location provide students with dedicated practicetakingtheSAT‐10?
(Select only one) Yes No Don't know
Curriculum3
16.Howmanyminutes daily do students at your present summer location practicetakingtheSAT‐10?
(Select only one) less than 30 31 to 60
25
61 to 90 91 to 120 121 or more
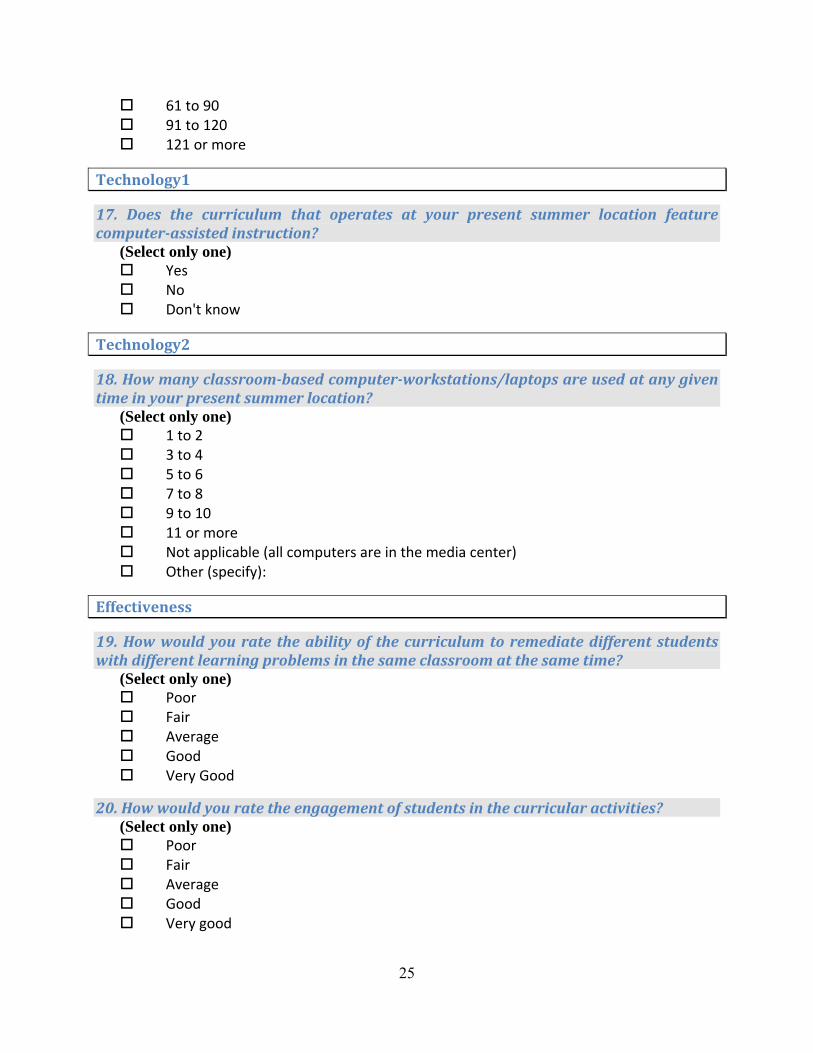
Technology1
17. Does the curriculum that operates at your present summer location featurecomputer‐assistedinstruction?
(Select only one) Yes No Don't know
Technology2
18.Howmanyclassroom‐basedcomputer‐workstations/laptopsareusedatanygiventimeinyourpresentsummerlocation?
(Select only one) 1 to 2 3 to 4 5 to 6 7 to 8 9 to 10 11 or more Not applicable (all computers are in the media center) Other (specify):
Effectiveness
19.Howwouldyourate theabilityof thecurriculum toremediatedifferentstudentswithdifferentlearningproblemsinthesameclassroomatthesametime?
(Select only one) Poor Fair Average Good Very Good
20.Howwouldyouratetheengagementofstudentsinthecurricularactivities?(Select only one) Poor Fair Average Good Very good

26
21.Howwouldyouratethecurriculum'seffectivenessataddressingtheskillsdeficitsofthestudents?
(Select only one) Poor Fair Average Good Very Good
Summary1
22.HowwouldyoucharacterizethesupportprovidedbystafffromtheM‐DCPSOfficeofLanguageArts/Reading?
(Select only one) Poor Fair Average Good Very Good Not applicable
23. How many times per week did staff from the M‐DCPS Office of LanguageArts/Readingvisityourpresentsummerlocationtomonitorimplementation?
(Select only one) 0 1 2 3 4 5
Summary2
24.HoweffectivedoyoubelievetheSummerReadingCampsprogramwasathelpingthirdgradestudentsslatedforretentiontoimprovetheirreadingskills?
(Select only one) Poor Fair Average Good Very Good Not applicable
25.Towhatextentdoyouagree that theprogram should continue tooperate in itscurrentform?
(Select only one)

27
Strongly disagree Disagree Unsure Agree Strongly agree
Summary3
26.Optionally,shareanyadditional thoughtsyoumighthaveabout theThirdGradeSummerReadingCamps.
(Provide only one response)