mh 3 en final - eumofa
TRANSCRIPT

In this issue Over the 36-month period from January 2017 toDecember 2019, the average first-sales price ofEuropean seabass in France was 15,13 EUR/kg. This was 10% more than the first-sales price of Europeanseabass in Portugal (13,74 EUR/kg), and 6% more than the price in Spain (14,30 EUR/kg). As for surmullet, among the surveyed countries, the highest average first-sales price was recorded in Spain at 9,65 EUR/kg, 26% higher than in France (7,68 EUR/kg), and 38% higher than in Italy (7,00 EUR/kg).
In the EU, the average import price of fresh/chilled European seabass from Turkey was 3,69 EUR/kg in the third week of January 2020, slightly higher by 1% compared to the same week in 2019.
In 2019, the average retail price of fresh mackerel was 22% lower in Ireland than in the Netherlands.
In 2019, Norwegian vessels landed more than 2,3 million tonnes of fish and shellfish in Norway and abroad, valued at EUR 2,14 billion. Of this, 395.000 tonnes were landed abroad.
Global scallop catches amounted to 631.718 tonnes in 2017. The leading producers were Japan and the USA, which provided 37% and 31% of the total world production, respectively.
The United Kingdom officially left the European Union on 31st January 2020 at midnight but will continue to be bound to the EU’s Common Fisheries Policy and terms of relevant international agreements until the transition period ends on 31st December 2020.
Contents
First sales in Europe European seabass (France, Portugal, Spain) and surmullet (France, Italy, Spain)
Extra-EU imports Weekly average EU import prices of selected products from selected countries of origin
Consumption Fresh mackerel in Denmark, Ireland, and the Netherlands
Case studies Fisheries and aquaculture in Norway Scallop in the European market
Global highlights
Macroeconomic context Marine fuel, consumer prices, and exchange rates
Find all data, information, and more at: www.eumofa.eu
Follow us on Twitter: @EU_MARE #EUMOFA
Monthly Highlights No. 3 / 2020
HighlightsNo. 4, 2014

European Market Observatory for Fisheries and Aquaculture Products
MONTHLY HIGHLIGHTS | NO.3/2020 FIRST SALES IN EUROPE
2
1. First sales in Europe For the period of January–December 2019, 14 EU Member States (MS), Norway, and the United Kingdom reported first-sales data for 10 commodity groups1. First-sales data are based on both sales notes and data collected from auction markets.
1.1. Compared to the same period last year
Increases in value and volume: first sales grew in Estonia, Greece, Italy, Latvia, Poland, Portugal, and the UK. An increased supply of both carp and salmon was the main factor leading to higher first sales in Estonia.
Decreases in value and volume: first sales declined in Belgium, Denmark, France, Lithuania, the Netherlands, and Sweden. The decrease in the Netherlands was mainly due to a decline in shrimp (Crangon spp.) and herring supply. The decrease in Lithuania was due to cod, while that in the Netherlands was the consequence of lower first sales of herring.
Table 1. JANUARY–DECEMBER OVERVIEW OF FIRST SALES FROM THE REPORTING COUNTRIES (volume in tonnes and value in million EUR) *
January–December
2017 January–December
2018 January–December
2019
Change from January–December
2018 Country Volume Value Volume Value Volume Value Volume Value
Belgium 16.425 66,18 14.289 60,27 13.717 59,05 -4% -2%
Denmark 265.144 356,15 269.769 365,50 250.510 344,20 -7% -6%
Estonia 47.483 11,03 48.393 11,95 60.686 13,26 25% 11%
France 193.817 667,63 188.906 639,58 178.488 614,24 -6% -4%
Greece n/a n/a 21.590 46,75 24.884 52,44 15% 12%
Italy 93.059 336,22 85.900 316,12 86.933 346,99 1% 10%
Latvia 57.815 11,53 48.493 8,67 51.743 8,79 7% 1%
Lithuania 1.533 1,41 1.676 1,24 960 0,74 -43% -40%
Netherlands 222.922 418,53 351.530 543,73 248.158 387,34 -29% -29%
Norway 2.903.142 2.334,87 2.984.359 2.527,19 2.784.755 2.535,64 -7% 0%
Poland 84.843 28,70 76.542 23,83 89.752 25,04 17% 5%
Portugal 93.003 186,03 98.290 198,53 110.759 204,97 13% 3%
Spain 452.978 1197,36 488.243 1383,74 476.789 1406,19 -2% 2%
Sweden 476.129 350,91 214.368 100,23 175.380 90,91 -18% -9%
UK 286.070 522,44 263.175 515,62 280.554 596,47 7% 16% Source: EUMOFA (updated 16.02.2020). Possible discrepancies in % changes are due to rounding. * Volumes are reported in net weight for EU Member States and in live weight equivalent (LWE) for Norway. Prices are reported in EUR/kg (without VAT). For Norway, prices are reported in EUR/kg of live weight. **Partial data: first-sales data for Italy cover 229 ports (approximately 50% of the total landings in the country)
1 Bivalves and other molluscs and aquatic invertebrates, cephalopods, crustaceans, flatfish, freshwater fish, groundfish, salmonids, small pelagics, tuna and tuna-like species, and other marine fish.

European Market Observatory for Fisheries and Aquaculture Products
MONTHLY HIGHLIGHTS | NO.3/2020 FIRST SALES IN EUROPE
3
The most recent weekly first-sales data (up to week 12 of 2020) are available via the EUMOFA website, and can be accessed here.
The most recent monthly first-sales data for January 2020 are available via the EUMOFA website, and can be accessed here.
1.2. In December 2019
Increases in value and volume: first sales grew in Belgium, Estonia, Greece, Lithuania, Poland, and Spain. The increase in Lithuania was due to an increase in the supply of smelt and herring. Good supply of herring was also behind high increase in Poland.
Decreases in value and volume: first sales declined in Denmark, Italy, Latvia, the Netherlands, Norway, Sweden, and
the UK. In Norway, the decline was due to a decrease in the supply of cod and haddock. In Sweden, first sales decreased due to a reduced supply of herring and sprat.
Table 2. DECEMBER OVERVIEW OF FIRST SALES FROM THE REPORTING COUNTRIES (volume in tonnes and value in million EUR) *
December 2017 December 2018 December 2019
Change from December 2018
Country Volume Value Volume Value Volume Value Volume Value
Belgium 1.878 7,11 1.277 5,16 1.293 5,97 1% 16%
Denmark 17.426 26,62 11.825 19,96 9.432 19,24 -20% -4%
Estonia 5.182 1,07 4.797 0,89 4837 0,96 1% 8%
France 14.761 61,50 13.256 56,98 13.301 57,43 0% 1%
Greece n/a n/a 1.439 3,29 1.535 3,93 7% 19%
Italy 6.016 26,42 6.327 27,87 5.831 26,60 -8% -5%
Latvia 4.194 0,77 3.975 0,65 3.513 0,65 -12% -1%
Lithuania 72 0,08 90 0,08 112 0,10 24% 27%
Netherlands 24.097 38,98 22.361 36,25 22.187 33,38 -1% -8%
Norway 141.468 113,34 109.059 125,59 64.811 70,10 -41% -44%
Poland 1.675 0,52 2.435 0,64 4.694 1,25 93% 96%
Portugal 3.481 9,63 3.982 13,17 4.801 11,43 21% -13%
Spain 21.982 101,99 26.997 118,37 28.417 124,26 5% 5%
Sweden 4.662 4,62 11.926 5,17 4.668 4,13 -61% -20%
UK 9.463 24,80 13.440 37,38 11.664 34,58 -13% -7%
Source: EUMOFA (updated 16.02.2020). Possible discrepancies in % changes are due to rounding. Volumes are reported in net weight for EU Member States and in live weight equivalent (LWE) for Norway. Prices are reported in EUR/kg (without VAT). For Norway, prices are reported in EUR/kg of live weight. *Partial data: first-sales data for Italy cover 229 ports (approximately 50% of the total landings in the country).

European Market Observatory for Fisheries and Aquaculture Products
MONTHLY HIGHLIGHTS | NO.3/2020 FIRST SALES IN EUROPE
4
1.3. First sales in selected countries
In Belgium in 2019, first-sales value and
volume fell slightly in comparison to 2018 (by 2% and 4%, respectively). The species contributing the most to this trend were cuttlefish, European plaice and shrimp (Crangon spp.). In December 2019, both total value and volume increased relative to December 2018. Common sole, ray, squid and scallop were among the main species responsible for this growth. The lower sales of common sole could be partly explained by a lack of fishing opportunities in some fishing areas. The increase in sales of ray was due to good stock status and a 6% increase in quota relative to 2018.
Figure 1. FIRST SALES OF THE MAIN COMMERCIAL SPECIES IN BELGIUM, DECEMBER 2019
Percentages show change from the previous year. Source: EUMOFA (updated 16.02.2020).
Figure 2. FIRST SALES OF THE MAIN COMMERCIAL SPECIES IN DENMARK, DECEMBER 2019
Percentages show change from the previous year. Source: EUMOFA (updated 16.02.2020).
Figure 3. FIRST SALES OF THE MAIN COMMERCIAL SPECIES IN ESTONIA, DECEMBER 2019
Percentages show change from the previous year. Source: EUMOFA (updated 16.02.2020). *EUMOFA aggregation for species (Metadata 2, Annex 3: http://eumofa.eu/supply-balance-and-other-methodologies).
In Denmark in 2019, shrimp (Crangon spp.)
was the main species responsible for the decrease of 6% in first-sales value, while herring was largely responsible for the overall 7% fall in volume, compared to 2018. In December 2019, first sales decreased in both value and volume, compared to December 2018. Herring, Norway lobster, European plaice and shrimp (Crangon spp.) were the primary species behind this declining trend. Of these species, shrimp registered the highest price increase (+43%) reaching 3,90 EUR/kg.
In 2019, Estonia saw growth in both first-sales
value (+11%) and volume (+25%) compared to 2018, mainly due to herring and sprat. In December 2019, first sales were higher than they had been during the same month one year previously. This was primarily due to a high supply of sprat and, to a lesser extent, high supplies of other freshwater fish*. Herring, as one of the most caught species, decreased in supply. This led to an 11% increase in the average price, which reached 0,17 EUR/kg.
600
1.200
1.800
2.400
40
80
120
160
200
Common sole Ray Squid Scallop
Volume (tonnes) Value (EUR 1000)
+97%
+106%+91%
+112%
+91%
+247%
+107%
+124%
Total volume: 1.293 tonnes, +1%Total value: EUR 6,0 million, +16%
200
400
600
500
1.000
1.500
2.000
2.500
3.000
Sprat Other freshwater fish Herring
Volume (tonnes) Value (EUR 1000)
+8%
+58%
0%
+7%
+39%
-10%
Total volume: 4.837 tonnes, +1%Total value: EUR 1,0 million, +8%
400
800
1.200
1.600
2.000
400
800
1.200
1.600
2.000
2.400
Herring Norway lobster European plaice Shrimp Crangon spp.
Volume (tonnes) Value (EUR 1000)
-52%
-9%
-26%
-44%
-47%
-27%
-31%
-61%
Total volume: 9.432 tonnes, -20%Total value: EUR 19,2 million, -4%

European Market Observatory for Fisheries and Aquaculture Products
MONTHLY HIGHLIGHTS | NO.3/2020 FIRST SALES IN EUROPE
5
In France in 2019, first sales decreased by 4%
in value and 6% in volume compared to 2018. This decline was largely due to falling supplies of monk, hake, and clam. In December 2019, compared to December 2018, increases in value for scallop, European seabass, and red mullet, and increases in volume for sardine, were among the key reasons responsible for stable trends in first sales. The good status of sardine stocks is reflected in the catches, explaining the volume increase compared to December 2018. Among the key species, red mullet registered the most significant decrease in average price (33%), falling to 4,31 EUR/kg.
In Greece in 2019, both first-sales value and
volume increased due to higher supplies of sardine (by 12% and 15% respectively) relative to 2018. In December 2019, first-sales value and volume were higher than in December 2018. This growth was due to sardine, anchovy, octopus, and hake. Of these species, sardine recorded the highest increase in average price, reaching 1,17 EUR/kg, which represents an increase of 52%.
Figure 4. FIRST SALES OF THE MAIN COMMERCIAL SPECIES IN FRANCE, DECEMBER 2019
Percentages show change from the previous year. Source: EUMOFA (updated 16.02.2020).
Figure 5. FIRST SALES OF THE MAIN COMMERCIAL SPECIES IN GREECE, DECEMBER 2019
Percentages show change from the previous year. Source: EUMOFA (updated 16.02.2020). *EUMOFA aggregation for species (Metadata 2, Annex 3: http://eumofa.eu/supply-balance-and-other-methodologies).
In Italy in 2019, compared to 2018, first
sales grew by 10% in value and 1% in volume. These changes were mainly due to the increasing value of anchovy (+54%) and increasing volume of sardine (+8%). In December 2019, sales decreased in value and volume relative to December 2018. Decreasing sales of clam, warmwater shrimp, octopus, and miscellaneous shrimp* were among the main factors responsible for negative trends.
Figure 6. FIRST SALES OF THE MAIN COMMERCIAL SPECIES IN ITALY, DECEMBER 2019
Percentages show change from the previous year. Source: EUMOFA (updated 16.02.2020). *EUMOFA aggregation for species (Metadata 2, Annex 3: http://eumofa.eu/supply-balance-and-other-methodologies).
3.000
6.000
9.000
12.000
1.000
2.000
3.000
4.000
Scallop Europeanseabass
Red mullet Sardine
Volume (tonnes) Value (EUR 1000)
+11%+24%
+49%
+22%
+107% +41% +113%+43%
Total volume: 13.301 tonnes, 0%Total value: EUR 57,4 million, +1%
100200300400500600700
100
200
300
400
Sardine Anchovy Octopus Hake
Volume (tonnes) Value (EUR 1000)
-16%
+27%
+45%+66%
+46%
+44%+37%
17%
Total volume: 1.535 tonnes, +7%Total value: EUR 3,9 million, +19%
1.000
2.000
3.000
4.000
400
800
1.200
1.600
Clam Warmwater shrimp Octopus Miscellaneousshrimp
Volume (tonnes) Value (EUR 1000)
-9%-6%
-37%
-17%
-32%
-20%
-32%
-34%
Total volume: 5.831 tonnes, -8%Total value: EUR 26,6 million, -5%

European Market Observatory for Fisheries and Aquaculture Products
MONTHLY HIGHLIGHTS | NO.3/2020 FIRST SALES IN EUROPE
6
In Latvia in 2019, small pelagics were the
key species responsible for increases in first-sales value (sprat) and in volume (herring and smelt) compared to 2018. Overall, first sales declined by 1% in value and by 7% in volume. In December 2019, first-sales value and volume decreased due to herring. The average price of smelt increased by 40% to 0,13 EUR/kg, due to reduced supply and stable market demand.
In Lithuania in 2019, first sales decreased by
40% in value and 43% in volume compared to 2018. This was mainly due to a ban imposed on fishing cod (from June 2019) following the adoption of EU regulations aiming to alleviate a serious threat to eastern Baltic cod stocks in International Council for the Exploration of the Sea subdivisions 24, 25 and 26. In December 2019, first sales experienced an upward trend compared to December 2018. The key contributing species include smelt, herring and sprat.
In the Netherlands in 2019, first sales fell by
29% in both value and volume compared to 2018. This was mainly due to a significant decrease in the supply of blue whiting, herring, mackerel, and shrimp (Crangon spp.). In December 2019, first-sales value and volume fell compared to December 2018 levels, due in large part to herring, shrimp (Crangon spp.), mackerel and common sole.
Figure 7. FIRST SALES OF THE MAIN COMMERCIAL SPECIES IN LATVIA, DECEMBER 2019
Percentages show change from the previous year. Source: EUMOFA (updated 16.02.2020).
Figure 8. FIRST SALES OF THE MAIN COMMERCIAL SPECIES IN LITHUANIA, DECEMBER 2019
Percentages show change from the previous year. Source: EUMOFA (updated 16.02.2020).
Figure 9. FIRST SALES OF THE MAIN COMMERCIAL SPECIES IN THE NETHERLANDS, DECEMBER 2019
Percentages show change from the previous year. Volume data is reported in live weight equivalent (LWE). Prices are reported in EUR/kg of live weight.
0
25
50
75
100
0
20
40
60
80
Smelt Herring Sprat
Volume (tonnes) Value (EUR 1000)
+120%
+95% +71%
+40% +499%
+350%
Total volume: 112 tonnes, +24%Total value: EUR 0,1 million, +27%
100
200
300
400
400800
1.2001.6002.0002.400
Herring Sprat SmeltVolume (tonnes) Value (EUR 1000)
-43% -35%
+30%+49%
-15% +19%
Total volume: 3.513 tonnes, -12%Total value: EUR 0,6 million, -1%
3.0006.0009.00012.00015.000
2.000
4.000
6.000
8.000
Herring Shrimp Crangonspp.
Mackerel Common sole
Volume (tonnes) Value (EUR 1000)
-45%
-45%
-54% -41%-25%
-15%
Total volume 22.187 tonnes, -1%Total value: EUR 33,4 million, −8%
-59% -59%

European Market Observatory for Fisheries and Aquaculture Products
MONTHLY HIGHLIGHTS | NO.3/2020 FIRST SALES IN EUROPE
7
In Norway in 2019, first–sales value
remained stable, whereas first-sales volume decreased by 7% compared to 2018. Volume fell due to lower sales of miscellaneous small pelagics*. In December 2019, compared to December 2018, first-sales value and volume fell by more than 40%. This was mainly due to cod, haddock, saithe and crab. Of the key species, crab recorded the highest average price increase (63%), reaching 11,53 EUR/kg.
In Poland in 2019, first sales increased by 5%
in value and 17% in volume due to high sales of herring, sprat, and European flounder, compared to 2018. In December 2019, first-sales value and volume spiked upwards to approximately double their 2018 values due to high supplies of herring, sprat and European flounder. Good stock availability and market demand were responsible for the significant increases in first sales of herring. In addition, the European Commission ban on cod fishing2, enforced from July 2019, compelled fishermen to redirect their focus from cod to European flounder.
Figure 10. FIRST SALES OF THE MAIN COMMERCIAL SPECIES IN NORWAY, DECEMBER 2019
Percentages show change from the previous year. Volume data is reported in live weight equivalent (LWE). Prices are reported in EUR/kg of live weight. *EUMOFA aggregation for species (Metadata 2, Annex 3: http://eumofa.eu/supply-balance-and-other-methodologies).
Figure 11. FIRST SALES OF THE MAIN COMMERCIAL SPECIES IN POLAND, DECEMBER 2019
Percentages show change from the previous year. Source: EUMOFA (updated 16.02.2020).
2 EC REGULATION (EU) 2019/1248 of 22 July 2019 https://eur-lex.europa.eu/legal-content/EN/TXT/PDF/?uri=CELEX:32019R1248&from=EN.
5.00010.00015.00020.00025.00030.00035.000
3.000
6.000
9.000
12.000
15.000
18.000
Cod Haddock Saithe Crab
Volume (tonnes) Value (EUR 1000)
-48% -52%
-44%-46%
-83% -72%
Total volume 64.811 tonnes, -41%Total value: EUR 70,1 million, −44%
-57%-57%
200
400
600
800
1.000
500
1.000
1.500
2.000
2.500
3.000
Herring European flounder Sprat
Volume (tonnes) Value (EUR 1000)
+138%+231%
+288% +192%
+44%
+53%
Total volume: 4.694 tonnes, +93%Total value: EUR 1,2 million, +96%

European Market Observatory for Fisheries and Aquaculture Products
MONTHLY HIGHLIGHTS | NO.3/2020 FIRST SALES IN EUROPE
8
In Portugal in 2019, first sales increased by
3% in value and 13% in volume compared to 2018. These increases were mostly linked to high sales of Atlantic horse mackerel and mackerel. In December 2019 compared to December 2018, first-sales value decreased due to declines in octopus, while volume grew largely due to increases in mackerel. Octopus decrease could be explained by natural abundance and the species' biology (“boom and bust” cycles). The increase in mackerel sales was due partly to an improvement in the stock status, which led to higher quotas3. Other important species that affected overall trends in December include clam and cuttlefish.
Figure 12. FIRST SALES OF THE MAIN COMMERCIAL SPECIES IN PORTUGAL, DECEMBER 2019
Percentages show change from the previous year. Source: EUMOFA (updated 16.02.2020).
In Spain in 2019, first sales increased in value
by 2% due to deep-water rose shrimp, anchovy, albacore tuna, and octopus, whereas volume decreased by 2% due to low supply of mackerel, compared to 2018. In December 2019, first-sales increased by 5% in both value and volume in comparison to the same month in 2018. This was mostly linked to higher sales of clam, skipjack tuna, deep-water rose shrimp, and hake. Skipjack fishing effort has risen in the Western and Central Pacific Ocean resulting in higher sales, mainly in the Basque Country port of Bermeo.
Figure 13. FIRST SALES OF THE MAIN COMMERCIAL SPECIES IN SPAIN, DECEMBER 2019
Percentages show change from the previous year. Source: EUMOFA (updated 16.02.2020).
3 Council Regulation (EU) 2020/123 of 27 January 2020 https://eur-lex.europa.eu/legal-content/EN/TXT/?uri=CELEX%3A32020R0123.
500
1.000
1.500
2.000
400
800
1.200
1.600
2.000
Octopus Cuttlefish Clam Mackerel
Volume (tonnes) Value (EUR 1000)
-54%
-50%
-64%-54%
-14%
-9%
+256%
+204%
Total volume: 4.801 tonnes, +21%Total value: EUR 11,4 million, -13%
5.00010.00015.00020.00025.00030.000
2.000
4.000
6.000
8.000
Clam Skipjack tuna Deep-water roseshrimp
Hake
Volume (tonnes) Value (EUR 1000)
+25%
+19%
+43%
+253% +20%+29%
+26%+4%
Total volume: 28.417 tonnes, +5%Total value: EUR 124,3 million, +5%

European Market Observatory for Fisheries and Aquaculture Products
MONTHLY HIGHLIGHTS | NO.3/2020 FIRST SALES IN EUROPE
9
In Sweden in 2019, first sales dropped in both
value (−8%) and volume (−18%) compared to 2018. This is mainly due to herring, which recorded falls of 27% in value and volume. In December 2019 compared to December 2018, first-sales value and volume fell due to herring, sprat, and cod. Decreases in sales of cod led to an increase in its average price which went up by 63%, reaching 4,40 EUR/kg.
Figure 14. FIRST SALES OF THE MAIN COMMERCIAL SPECIES IN SWEDEN, DECEMBER 2019
Percentages show change from the previous year. Source: EUMOFA (updated 16.02.2020).
In the UK in 2019, first-sales value and
volume increased by 16% and 7%, respectively, compared to 2018. The increases were mostly due to Norway lobster, crab, and haddock. In December 2019, first-sales value and volume decreased compared to December 2018. The main species responsible for such negative trends include mackerel, cuttlefish, common sole, and monk.
Figure 15. FIRST SALES OF THE MAIN COMMERCIAL SPECIES IN THE UK, DECEMBER 2019
Percentages show change from the previous year. Source: EUMOFA (updated 16.02.2020).
5001.0001.5002.0002.5003.0003.500
200
400
600
800
Mackerel Cuttlefish Common sole Monk
Volume (tonnes) Value (EUR 1000)
-94% -93% -84% -88% -64-62%
-11%-13%
Total volume: 11.664 tonnes, -13%Total value: EUR 34,6 million, -7%
200
400
600
800
500
1.000
1.500
2.000
2.500
3.000
Herring Sprat Cod
Volume (tonnes) Value (EUR 1000)
-62% -58%
-67% -66%
-58%
Total volume: 4.668 tonnes, -61%Total value: EUR 4,1 million, -20%
-31%
European Market Observatory for Fisheries and Aquaculture Products
MONTHLY HIGHLIGHTS | NO.3/2020 FIRST SALES IN EUROPE
10
1.4. Comparison of first-sales prices of selected species in selected countries
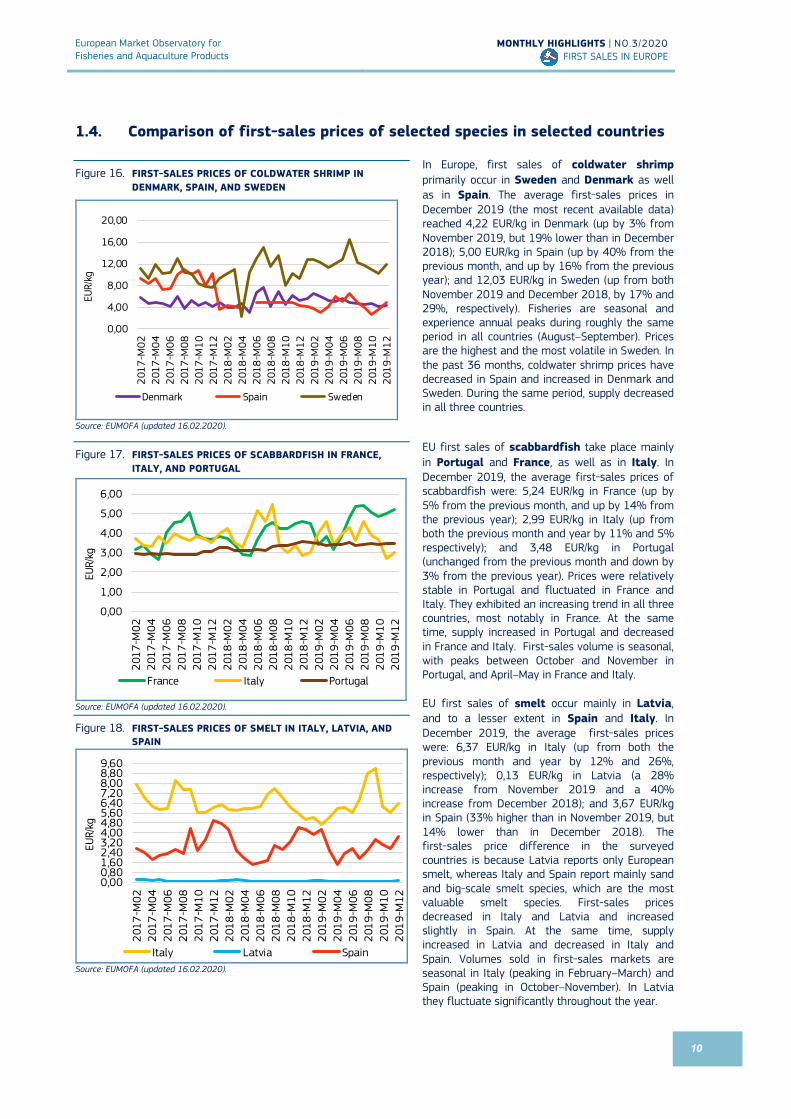
Figure 16. FIRST-SALES PRICES OF COLDWATER SHRIMP IN DENMARK, SPAIN, AND SWEDEN
Source: EUMOFA (updated 16.02.2020).
In Europe, first sales of coldwater shrimp primarily occur in Sweden and Denmark as well as in Spain. The average first-sales prices in December 2019 (the most recent available data) reached 4,22 EUR/kg in Denmark (up by 3% from November 2019, but 19% lower than in December 2018); 5,00 EUR/kg in Spain (up by 40% from the previous month, and up by 16% from the previous year); and 12,03 EUR/kg in Sweden (up from both November 2019 and December 2018, by 17% and 29%, respectively). Fisheries are seasonal and experience annual peaks during roughly the same period in all countries (August–September). Prices are the highest and the most volatile in Sweden. In the past 36 months, coldwater shrimp prices have decreased in Spain and increased in Denmark and Sweden. During the same period, supply decreased in all three countries.
Figure 17. FIRST-SALES PRICES OF SCABBARDFISH IN FRANCE, ITALY, AND PORTUGAL
Source: EUMOFA (updated 16.02.2020).
EU first sales of scabbardfish take place mainly in Portugal and France, as well as in Italy. In December 2019, the average first-sales prices of scabbardfish were: 5,24 EUR/kg in France (up by 5% from the previous month, and up by 14% from the previous year); 2,99 EUR/kg in Italy (up from both the previous month and year by 11% and 5% respectively); and 3,48 EUR/kg in Portugal (unchanged from the previous month and down by 3% from the previous year). Prices were relatively stable in Portugal and fluctuated in France and Italy. They exhibited an increasing trend in all three countries, most notably in France. At the same time, supply increased in Portugal and decreased in France and Italy. First-sales volume is seasonal, with peaks between October and November in Portugal, and April–May in France and Italy. EU first sales of smelt occur mainly in Latvia, and to a lesser extent in Spain and Italy. In December 2019, the average first-sales prices were: 6,37 EUR/kg in Italy (up from both the previous month and year by 12% and 26%, respectively); 0,13 EUR/kg in Latvia (a 28% increase from November 2019 and a 40% increase from December 2018); and 3,67 EUR/kg in Spain (33% higher than in November 2019, but 14% lower than in December 2018). The first-sales price difference in the surveyed countries is because Latvia reports only European smelt, whereas Italy and Spain report mainly sand and big-scale smelt species, which are the most valuable smelt species. First-sales prices decreased in Italy and Latvia and increased slightly in Spain. At the same time, supply increased in Latvia and decreased in Italy and Spain. Volumes sold in first-sales markets are seasonal in Italy (peaking in February–March) and Spain (peaking in October–November). In Latvia they fluctuate significantly throughout the year.
Figure 18. FIRST-SALES PRICES OF SMELT IN ITALY, LATVIA, AND SPAIN
Source: EUMOFA (updated 16.02.2020).
0,00
4,00
8,00
12,00
16,00
20,00
2017
-M02
2017
-M04
2017
-M06
2017
-M08
2017
-M10
2017
-M12
2018
-M02
2018
-M04
2018
-M06
2018
-M08
2018
-M10
2018
-M12
2019
-M02
2019
-M04
2019
-M06
2019
-M08
2019
-M10
2019
-M12
EUR/kg
Denmark Spain Sweden
0,00
1,00
2,00
3,00
4,00
5,00
6,00
2017
-M02
2017
-M04
2017
-M06
2017
-M08
2017
-M10
2017
-M12
2018
-M02
2018
-M04
2018
-M06
2018
-M08
2018
-M10
2018
-M12
2019
-M02
2019
-M04
2019
-M06
2019
-M08
2019
-M10
2019
-M12
EUR/kg
France Italy Portugal
0,000,801,602,403,204,004,805,606,407,208,008,809,60
2017
-M02
2017
-M04
2017
-M06
2017
-M08
2017
-M10
2017
-M12
2018
-M02
2018
-M04
2018
-M06
2018
-M08
2018
-M10
2018
-M12
2019
-M02
2019
-M04
2019
-M06
2019
-M08
2019
-M10
2019
-M12
EUR/kg
Italy Latvia Spain

European Market Observatory for Fisheries and Aquaculture Products
MONTHLY HIGHLIGHTS | NO.3/2020 FIRST SALES IN EUROPE
11
1.5. Commodity group of the month: other marine fish4
The “other marine fish” commodity group (CG5) ranked 2nd in value and 4th in volume among the 10 CGs sold at the first-sales stage in December 20196. First sales of these species reached EUR 46,9 million and 10.703 tonnes, experiencing decreases in value and volume of 9% and 4%, respectively, compared to December 2018. In the past 36 months, the highest value of first sales of other marine fish was registered in May 2019, at EUR 57,1 million.
The “Other marine fish” include the following main commercial species (MCS) cusk-eel, dogfish, gurnard, John Dory, monk, picarel, ray, red mullet, scabbardfish, European seabass and other seabass, gilt-head seabream and other seabreams, smelt, weever, other marine fish, other sharks. At Electronic Recording and Reporting System (ERS) level, European seabass (12%) and surmullet (4%) together account for 16% of the total reported first-sales value of this commodity group in December 2019.
Figure 19. FIRST-SALES VALUE COMPARISON AT CG LEVEL, MCS LEVEL AND ERS LEVEL FOR REPORTING COUNTRIES* (JAN 2017 – DEC 2020)
*Norway is excluded from the analyses. Source: EUMOFA (updated 16.02.2020).
1.6. Focus on European seabass
European seabass (Dicentrarchus labrax) belongs to the family Moronidae, collectively called the temperate basses. There are two genetically distinct populations of wild European seabass – one found in the northeast Atlantic
Ocean and the second in the western Mediterranean Sea. European seabass habitats include estuaries, lagoons, coastal waters, and rivers. It is found in the eastern Atlantic Ocean (from Norway to Senegal), the Mediterranean Sea, and the Black Sea. The combination of slow growth, late maturity, spawning aggregation, and strong site fidelity increases the vulnerability of seabass to overexploitation. They reproduce from January to March in the Mediterranean and Black Seas, and up until June in the Atlantic. European seabass is mostly caught in the North Sea and the English Channel by EU fleets using pelagic and demersal trawls, seines, and hooks and lines. Most of the reported catches originate from the Atlantic Ocean, with France typically reporting the highest catches. In the Mediterranean, Italy typically reports the largest catches7.
In the EU, European seabass is managed through various measures8. These measures include area closures, fish bag limits for recreational fishermen, minimum landing size requirements9 and monthly catch limits which vary in different sea basins10. In 2020, it was decided to slightly increase the by-catch levels in the Northern areas and grant additional flexibility in their management. The bag limit for seabass recreational fisheries was set at two fish per angler per day under certain conditions, and only from 1 March to 30 November 2020 for Northern seabass. In Southern Atlantic waters, the two bass bag limit will be applicable all year long. In addition, France and Spain must ensure that the total catches of seabass by commercial and recreational fisheries combined in the Bay of Biscay do not exceed 2.533 tonnes.
4 EUMOFA aggregation for species (Metadata 2, Annex 3: http://eumofa.eu/supply-balance-and-other-methodologies 5 Annex 3: http://eumofa.eu/supply-balance-and-other-methodologies 6 More data on commodity groups can be found in Table 1.2 of the Annex. 7 http://paoloni.pl/produkt,132,0,0,labraks-patroszony-300400,eng 8 COUNCIL REGULATION (EU) 2020/123 https://eur-lex.europa.eu/legal-content/EN/TXT/PDF/?uri=CELEX:32020R0123&from=EN 9 Council Regulation (EC) No 1967/2006 http://eur-lex.europa.eu/LexUriServ/LexUriServ.do?uri=OJ:L:2006:409:0011:0085:EN:PDF 10 Commission Regulation (EU) 2015/1316) https://eur-lex.europa.eu/legal-content/EN/TXT/PDF/?uri=CELEX:32015R1316&from=EN
0
10
20
30
40
50
2017 2018 2019
Valu
e (m
illio
n EU
R)
Other marine fish (CG) Red mullet (MCS)
European seabass (MCS) Surmullet (ERS)
European seabass (ERS)

European Market Observatory for Fisheries and Aquaculture Products
MONTHLY HIGHLIGHTS | NO.3/2020 FIRST SALES IN EUROPE
12
Selected countries
In France in 2019, first sales of European seabass remained stable in value and decreased by 2% in volume compared to 2018. Compared to 2017, first sales decreased 5% in value and 6% in volume. Of other marine fish sold at first-sales stage in December 2019, European seabass accounted for 29% of total value and 8% of volume. Les Sables-d'Olonne, La Cotinière, and Noirmoutier-en-l'Île in the Bay of Biscay were the ports with the highest reported first sales in 2019.
Figure 20. EUROPEAN SEABASS: FIRST SALES IN FRANCE
Source: EUMOFA (updated 16.02.2020).
Figure 21. FIRST SALES: COMPARISON OF OTHER MARINE FISH (ERS) IN FRANCE, VALUE AND VOLUME, DECEMBER 2019
Source: EUMOFA (updated 16.02.2020).
In Portugal in 2019, first sales of European seabass increased by 7% in value and 13% in volume over 2018. Compared with 2017, value and volume decreased by 2% and 4%, respectively. Of other marine fish sold in December 2019, European seabass accounted for 19% of total first-sales value and 9% of total first-sales volume. The ports of Peniche, Sesimbra, and Viana do Castelo on Portugal's Atlantic coast were responsible for 63% of total first-sales value in 2019.
Figure 22. EUROPEAN SEABASS: FIRST SALES IN PORTUGAL
Source: EUMOFA (updated 16.02.2020).
0,00
0,20
0,40
0,60
0,80
1,00
1,20
0
25
50
75
100
125
Feb
Apr
Jun
Aug
Oct
Dec
Feb
Apr
Jun
Aug
Oct
Dec
Feb
Apr
Jun
Aug
Oct
Dec
2017 2018 2019
Valu
e
Volu
me
Volume (tonnes) Value (million EUR)
European seabass25%
Monkfishes nei37%
Surmullet7%
John Dory6%
Other25%
Total valueEUR 15,7 mil
European seabass
8%
Monkfishes nei26%
Surmullet9%
John Dory2%
Other55% Total volume
2.870 tonnes
0,00
1,00
2,00
3,00
4,00
5,00
0
80
160
240
320
400
480
Feb
Apr
Jun
Aug
Oct
Dec Feb
Apr
Jun
Aug
Oct
Dec Feb
Apr
Jun
Aug
Oct
Dec
2017 2018 2019
Valu
e
Volu
me
Volume (tonnes) Value (million EUR)

European Market Observatory for Fisheries and Aquaculture Products
MONTHLY HIGHLIGHTS | NO.3/2020 FIRST SALES IN EUROPE
13
Figure 23. FIRST SALES: COMPARISON OF OTHER MARINE FISH (ERS) IN PORTUGAL, VALUE AND VOLUME, DECEMBER 2019
Source: EUMOFA (updated 16.02.2020).
In Spain in 2019, first sales of European seabass increased by 4% in value and 16% in volume compared to 2018. Compared with 2017, first-sales value was slightly up by 1%, whereas volume remained stable. Of other marine fish sold at first-sales stage in December 2019, European seabass accounted for 5% in value and 1% in volume. Santa Eugenia De Ribeira, A Coruña, and Vigo, near the Bay of Biscay, were the ports with the highest first-sales value in 2019.
Figure 24. EUROPEAN SEABASS: FIRST SALES IN SPAIN
Source: EUMOFA (updated 16.02.2020).
Figure 25. FIRST SALES: COMPARISON OF OTHER MARINE FISH (ERS) IN SPAIN, VALUE AND VOLUME, DECEMBER 2019
Source: EUMOFA (updated 16.02.2020).
Black scabbardfish
14%European seabass
19%
Gilthead seabream
7%
Surmullet5%
Thornback ray5%
Other50% Total value
EUR 2,7 mil
Black scabbardfish
24%
European seabass
9%
Gilthead seabream
3%
Surmullet2%Thornback ray
10%
Other52%
Total volume519 tonnes
Angler9%
Blackbellied angler30%
Blue shark17%
European seabass
5%
Surmullet2%
Other37%
Total valueEUR 23,0 mil
Angler5%
Blackbellied angler18%
Blue shark33%
European seabass
1%
Surmullet1%
Other42%
Total volume5.604 tonnes
0,00
0,30
0,60
0,90
1,20
1,50
0
40
80
120
160
200
Feb
Apr
Jun
Aug
Oct
Dec
Feb
Apr
Jun
Aug
Oct
Dec
Feb
Apr
Jun
Aug
Oct
Dec
2017 2018 2019
Valu
e
Volu
me
Volume (tonnes) Value (million EUR)
European Market Observatory for Fisheries and Aquaculture Products
MONTHLY HIGHLIGHTS | NO.3/2020 FIRST SALES IN EUROPE
14
Price trend
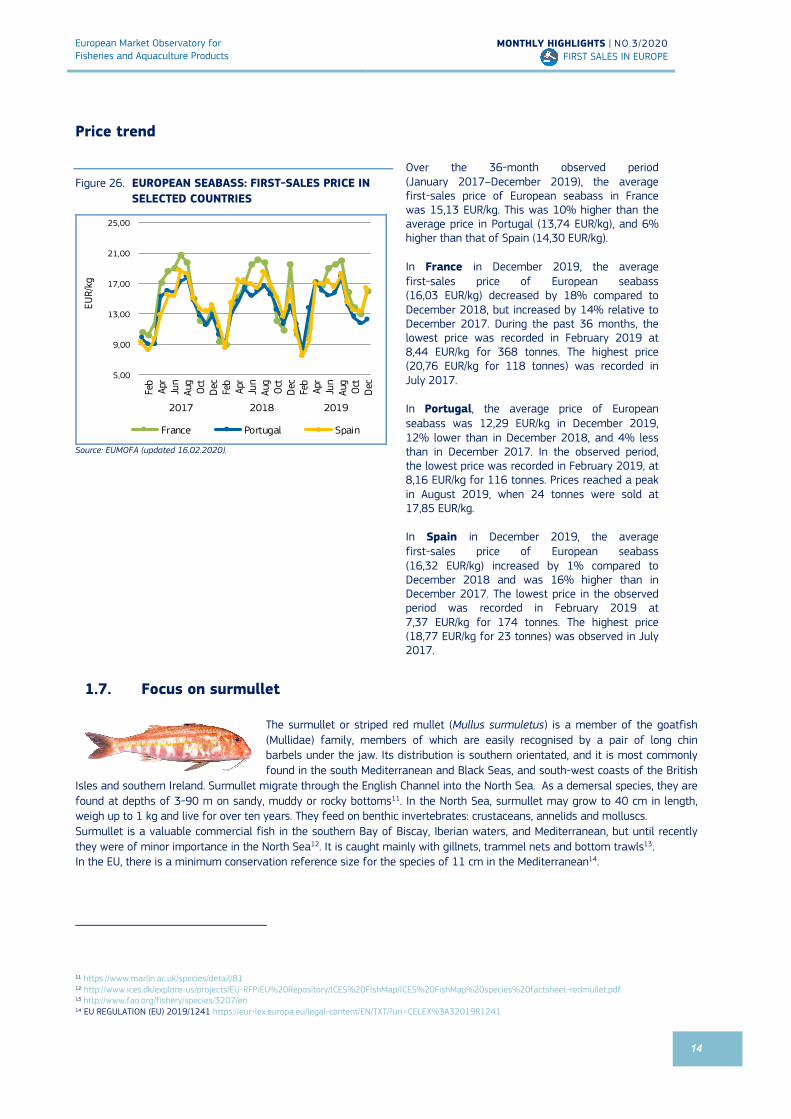
Figure 26. EUROPEAN SEABASS: FIRST-SALES PRICE IN SELECTED COUNTRIES
Source: EUMOFA (updated 16.02.2020).
Over the 36-month observed period (January 2017–December 2019), the average first-sales price of European seabass in France was 15,13 EUR/kg. This was 10% higher than the average price in Portugal (13,74 EUR/kg), and 6% higher than that of Spain (14,30 EUR/kg). In France in December 2019, the average first-sales price of European seabass (16,03 EUR/kg) decreased by 18% compared to December 2018, but increased by 14% relative to December 2017. During the past 36 months, the lowest price was recorded in February 2019 at 8,44 EUR/kg for 368 tonnes. The highest price (20,76 EUR/kg for 118 tonnes) was recorded in July 2017. In Portugal, the average price of European seabass was 12,29 EUR/kg in December 2019, 12% lower than in December 2018, and 4% less than in December 2017. In the observed period, the lowest price was recorded in February 2019, at 8,16 EUR/kg for 116 tonnes. Prices reached a peak in August 2019, when 24 tonnes were sold at 17,85 EUR/kg. In Spain in December 2019, the average first-sales price of European seabass (16,32 EUR/kg) increased by 1% compared to December 2018 and was 16% higher than in December 2017. The lowest price in the observed period was recorded in February 2019 at 7,37 EUR/kg for 174 tonnes. The highest price (18,77 EUR/kg for 23 tonnes) was observed in July 2017.
1.7. Focus on surmullet
The surmullet or striped red mullet (Mullus surmuletus) is a member of the goatfish (Mullidae) family, members of which are easily recognised by a pair of long chin barbels under the jaw. Its distribution is southern orientated, and it is most commonly found in the south Mediterranean and Black Seas, and south-west coasts of the British
Isles and southern Ireland. Surmullet migrate through the English Channel into the North Sea. As a demersal species, they are found at depths of 3-90 m on sandy, muddy or rocky bottoms11. In the North Sea, surmullet may grow to 40 cm in length, weigh up to 1 kg and live for over ten years. They feed on benthic invertebrates: crustaceans, annelids and molluscs. Surmullet is a valuable commercial fish in the southern Bay of Biscay, Iberian waters, and Mediterranean, but until recently they were of minor importance in the North Sea12. It is caught mainly with gillnets, trammel nets and bottom trawls13. In the EU, there is a minimum conservation reference size for the species of 11 cm in the Mediterranean14.
11 https://www.marlin.ac.uk/species/detail/81 12 http://www.ices.dk/explore-us/projects/EU-RFP/EU%20Repository/ICES%20FIshMap/ICES%20FishMap%20species%20factsheet-redmullet.pdf 13 http://www.fao.org/fishery/species/3207/en 14 EU REGULATION (EU) 2019/1241 https://eur-lex.europa.eu/legal-content/EN/TXT/?uri=CELEX%3A32019R1241
5,00
9,00
13,00
17,00
21,00
25,00
Feb
Apr
Jun
Aug
Oct
Dec Feb
Apr
Jun
Aug
Oct
Dec Feb
Apr
Jun
Aug
Oct
Dec
2017 2018 2019
EUR/kg
France Portugal Spain

European Market Observatory for Fisheries and Aquaculture Products
MONTHLY HIGHLIGHTS | NO.3/2020 FIRST SALES IN EUROPE
15
Selected countries
In France in 2019, first sales of surmullet increased by 27% in value and by 83% in volume compared to 2018. Compared with 2017, first-sales value increased slightly (by 1%), while volume increased by 41%. Of other marine fish sold in December 2019, surmullet accounted for 7% of total first-sales value and 9% of total first-sales volume (see Figure 21).
Boulogne-sur-Mer, Les Sables-d'Olonne, and Lorient were the fishing ports with the highest first-sales value registered in 2019.
Figure 27. SURMULLET: FIRST SALES IN FRANCE
Source: EUMOFA (updated 16.02.2020).
In Italy in 2019, first sales of surmullet decreased by 21% in value and by 28% in volume compared to 2018. Compared with 2017, first-sales value decreased by 14%, while volume fell by 20%. Of other marine fish sold in December 2019, surmullet accounted for 8% of total first-sales value and 5% of total first-sales volume. The fishing ports of Lampedusa, Cagliari, and Mazara del Vallo in the Mediterranean Sea registered approximately 40% of Italy’s first-sales value of surmullet in 2019.
Figure 28. SURMULLET: FIRST SALES IN ITALY
Source: EUMOFA (updated 16.02.2020).
0,00
0,50
1,00
1,50
2,00
2,50
0
100
200
300
400
500
600
Feb
Apr
Jun
Aug
Oct
Dec Feb
Apr
Jun
Aug
Oct
Dec Feb
Apr
Jun
Aug
Oct
Dec
2017 2018 2019
Valu
e
Volu
me
Volume (tonnes) Value (million EUR)
0,00
0,10
0,20
0,30
0,40
0,50
0
20
40
60
80
Feb
Apr
Jun
Aug
Oct
Dec Feb
Apr
Jun
Aug
Oct
Dec Feb
Apr
Jun
Aug
Oct
Dec
2017 2018 2019
Valu
e
Volu
me
Volume (tonnes) Value (million EUR)

European Market Observatory for Fisheries and Aquaculture Products
MONTHLY HIGHLIGHTS | NO.3/2020 FIRST SALES IN EUROPE
16
Figure 29. FIRST SALES: COMPARISON OF OTHER MARINE FISH (ERS) IN ITALY, VALUE AND VOLUME, DECEMBER 2019
Source: EUMOFA (updated 16.02.2020).
In Spain in 2019, first sales of surmullet increased by 10% in value and 16% in volume compared to 2018. Compared with 2017, first sales grew by 21% in value and by 24% in volume. Of other marine fish sold in December 2019, surmullet accounted for 2% of total first-sales value and 1% of total volume (see Figure 25). Santa Pola, Palma de Mallorca, and Pasajes in the Bay of Biscay were the fishing ports with the highest first sales activities in 2019.
Figure 30. SURMULLET: FIRST SALES IN SPAIN
Source: EUMOFA (updated 16.02.2020).
Angler10%
European seabass
6%
Red mullet26%
Surmullet8%
Other50%
Total valueEUR 2,8 mil
Angler5%
European seabass
1%
Red mullet30%
Surmullet5%
Other59%
Total volume705 tonnes
0,00
0,20
0,40
0,60
0,80
1,00
0
20
40
60
80
100
120
Feb
Apr
Jun
Aug
Oct
Dec Feb
Apr
Jun
Aug
Oct
Dec Feb
Apr
Jun
Aug
Oct
Dec
2017 2018 2019Va
lue
Volu
me
Volume (tonnes) Value (million EUR)

European Market Observatory for Fisheries and Aquaculture Products
MONTHLY HIGHLIGHTS | NO.3/2020 FIRST SALES IN EUROPE
17
Price trends Over the 36-month period from January 2017 to December 2019, the highest average price of surmullet among the selected countries was recorded in Spain at 9,65 EUR/kg. This was 26% higher than in France (7,68 EUR/kg), and 38% more than in Italy (7,00 EUR/kg).
In France in December 2019, the average price (4,36 EUR/kg) was 33% lower than in December 2018, and 25% lower than in December 2017. The lowest price was observed in October 2019 (2,79 EUR/kg for 526 tonnes), whereas the highest was recorded in April 2018 (10,20 EUR/kg for 70 tonnes). In Italy in December 2019, the average price of surmullet was 6,34 EUR/kg, representing a decrease of 12% compared to December 2018, and an increase of 1% relative to December 2017. The lowest price was recorded in October 2018 at 5,62 EUR/kg for 53 tonnes. The highest price was observed in July 2019 at 9,48 EUR/kg for 28 tonnes. In Spain, the average price of surmullet in December 2019 was 8,10 EUR/kg, 12% lower than in December 2018, and 1% lower than in December 2017. Over the past 36 months, first-sales price was the lowest in November 2019 when 105 tonnes of surmullet were sold for 5,61 EUR/kg. The highest price was observed in August 2019 at 13,55 EUR/kg, when the total supply amounted to 47 tonnes.
Figure 31. SURMULLET: FIRST-SALES PRICE IN SELECTED COUNTRIES
Source: EUMOFA (updated 16.02.2020).
0,00
3,00
6,00
9,00
12,00
15,00
Feb
Apr
Jun
Aug
Oct
Dec Feb
Apr
Jun
Aug
Oct
Dec Feb
Apr
Jun
Aug
Oct
Dec
2017 2018 2019EU
R/kg
France Italy Spain

European Market Observatory for Fisheries and Aquaculture Products
MONTHLY HIGHLIGHTS | NO.3/2020 EXTRA-EU IMPORTS
18
2. Extra-EU imports Each month, the weekly extra-EU import prices (average values per week, in EUR per kg) of nine species are examined. The three species that are the most significant in terms of value and volume are examined: fresh whole Atlantic salmon from Norway, frozen Alaska pollock fillets from China, and frozen tropical shrimp (genus Penaeus) from Ecuador. The other six species change every month, with three selected from the commodity group of the month (in this issue, other marine fish). This month, the featured commodity species are fresh or chilled European seabass, gilthead seabream from Turkey, and frozen monkfish from Namibia. The remaining three species for this month have been randomly selected: frozen skipjack or stripe-bellied bonito from Curaçao, prepared or preserved mussels from Chile, and frozen fillets of herring from Norway.
The weekly price of fresh, whole Atlantic salmon (Salmo salar, CN code 03021400) imported from Norway reached 7,73 EUR/kg in week 3 (commencing 13th January). This price increased slightly (+1%) from the preceding four-week average (7,63 EUR/kg) and 22% from the previous year (6,35 EUR/kg). The price Atlantic salmon was 1% lower than the previous week, corresponding to a 3% decrease in volume. Imports in week 3 totalled 10.747 tonnes, 9% higher than the average over the previous four weeks, and down by 1% from the previous year. The relative high import prices seen in the first weeks of 2020 must be related to severe weather conditions which have hampered logistic operations (harvest, transport) for most of the salmon producing countries. Over the past three years, price exhibited a slight decrease, while volume went up.
Figure 32. IMPORT PRICE OF ATLANTIC SALMON, FRESH AND WHOLE FROM NORWAY
Source: European Commission (updated 16.02.2020).
For frozen fillets of Alaska pollock (Theragra chalcogramma, CN code 03047500) imported from China, the price in week 3 was 2,92 EUR/kg, 1% higher than the preceding four-week average (2,90 EUR/kg), and 22% higher than in the same week in 2019 (2,38 EUR/kg). The price of Alaska pollock has increased over the past three years, while volume has exhibited a slight decreasing trend. The price has shown an upward trend in the past two years.
Figure 33. IMPORT PRICE OF ALASKA POLLOCK, FROZEN FILLETS FROM CHINA
Source: European Commission (updated 16.02.2020).
1,50
2,00
2,50
3,00
3,50
4,00
2017
/07
2017
/11
2017
/15
2017
/19
2017
/23
2017
/27
2017
/31
2017
/35
2017
/39
2017
/43
2017
/47
2017
/51
2018
/03
2018
/07
2018
/11
2018
/15
2018
/19
2018
/23
2018
/27
2018
/31
2018
/35
2018
/39
2018
/43
2018
/47
2018
/51
2019
/03
2019
/07
2019
/11
2019
/15
2019
/19
2019
/23
2019
/27
2019
/31
2019
/35
2019
/39
2019
/43
2019
/47
2019
/51
2020
/03
EUR/
kg
Week 3: 2,92 EUR/kg
4,00
5,00
6,00
7,00
8,00
9,00
2017
/07
2017
/11
2017
/15
2017
/19
2017
/23
2017
/27
2017
/31
2017
/35
2017
/39
2017
/43
2017
/47
2017
/51
2018
/03
2018
/07
2018
/11
2018
/15
2018
/19
2018
/23
2018
/27
2018
/31
2018
/35
2018
/39
2018
/43
2018
/47
2018
/51
2019
/03
2019
/07
2019
/11
2019
/15
2019
/19
2019
/23
2019
/27
2019
/31
2019
/35
2019
/39
2019
/43
2019
/47
2019
/51
2020
/03
EUR/
kg
Week 3: 7,73 EUR/kg

European Market Observatory for Fisheries and Aquaculture Products
MONTHLY HIGHLIGHTS | NO.3/2020 EXTRA-EU IMPORTS
19
The price of frozen tropical shrimp (genus Penaeus, CN code 03061792) from Ecuador was 5,99 EUR/kg in week 3: 2% lower than the average over the preceding four weeks (6,08 EUR/kg), and 5% higher than the same week in 2019 (5,71 EUR/kg). This product experienced high fluctuations in supply, with both price and volume exhibiting increasing trends over the past year.
Figure 34. IMPORT PRICE OF FROZEN TROPICAL SHRIMP FROM ECUADOR
Source: European Commission (updated 16.02.2020).
Figure 35. IMPORT PRICE OF FRESH OR CHILLED EUROPEAN SEABASS FROM TURKEY
Source: European Commission (updated 16.02.2020).
The price of fresh or chilled European seabass (Dicentrarchus labrax, CN code 03028410) imported from Turkey was 3,69 EUR/kg in week 3. This was slightly lower than the preceding four-week average (–1%), and 1% higher than the same week in 2019. The volume recorded in week 3 (565 tonnes) was significantly higher than the preceding four-week average (+35%), and down 1% from the same week in 2019. This product’s price and volume showed very little weekly volatility in 2019 and so far in 2020. Over the past year, price has increased slightly while volume began to fall. The Netherlands and Italy are the biggest importers of European seabass from Turkey.
4,00
5,00
6,00
7,00
8,00
9,00
2017
/07
2017
/11
2017
/15
2017
/19
2017
/23
2017
/27
2017
/31
2017
/35
2017
/39
2017
/43
2017
/47
2017
/51
2018
/03
2018
/07
2018
/11
2018
/15
2018
/19
2018
/23
2018
/27
2018
/31
2018
/35
2018
/39
2018
/43
2018
/47
2018
/51
2019
/03
2019
/07
2019
/11
2019
/15
2019
/19
2019
/23
2019
/27
2019
/31
2019
/35
2019
/39
2019
/43
2019
/47
2019
/51
2020
/03
EUR/
kg
Week 3: 5,99 EUR/kg
3,00
3,40
3,80
4,20
4,60
5,00
5,40
5,80
2017
/12
2017
/19
2017
/26
2017
/33
2017
/40
2017
/47
2018
/02
2018
/09
2018
/16
2018
/23
2018
/30
2018
/37
2018
/44
2018
/51
2019
/06
2019
/13
2019
/20
2019
/27
2019
/34
2019
/41
2019
/48
2020
/03
EUR/
kg
Week 3: 3,69 EUR/kg
European Market Observatory for Fisheries and Aquaculture Products
MONTHLY HIGHLIGHTS | NO.3/2020 EXTRA-EU IMPORTS
20
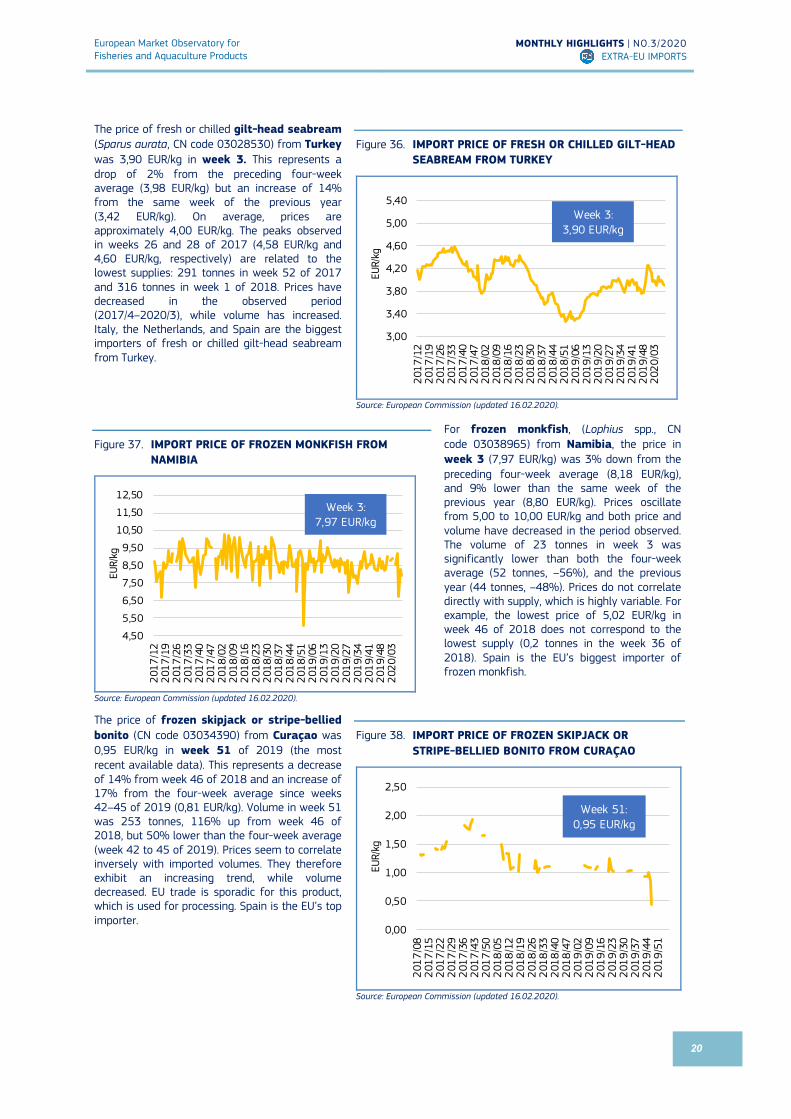
The price of fresh or chilled gilt-head seabream (Sparus aurata, CN code 03028530) from Turkey was 3,90 EUR/kg in week 3. This represents a drop of 2% from the preceding four-week average (3,98 EUR/kg) but an increase of 14% from the same week of the previous year (3,42 EUR/kg). On average, prices are approximately 4,00 EUR/kg. The peaks observed in weeks 26 and 28 of 2017 (4,58 EUR/kg and 4,60 EUR/kg, respectively) are related to the lowest supplies: 291 tonnes in week 52 of 2017 and 316 tonnes in week 1 of 2018. Prices have decreased in the observed period (2017/4–2020/3), while volume has increased. Italy, the Netherlands, and Spain are the biggest importers of fresh or chilled gilt-head seabream from Turkey.
Figure 36. IMPORT PRICE OF FRESH OR CHILLED GILT-HEAD SEABREAM FROM TURKEY
Source: European Commission (updated 16.02.2020).
Figure 37. IMPORT PRICE OF FROZEN MONKFISH FROM NAMIBIA
Source: European Commission (updated 16.02.2020).
For frozen monkfish, (Lophius spp., CN code 03038965) from Namibia, the price in week 3 (7,97 EUR/kg) was 3% down from the preceding four-week average (8,18 EUR/kg), and 9% lower than the same week of the previous year (8,80 EUR/kg). Prices oscillate from 5,00 to 10,00 EUR/kg and both price and volume have decreased in the period observed. The volume of 23 tonnes in week 3 was significantly lower than both the four-week average (52 tonnes, –56%), and the previous year (44 tonnes, –48%). Prices do not correlate directly with supply, which is highly variable. For example, the lowest price of 5,02 EUR/kg in week 46 of 2018 does not correspond to the lowest supply (0,2 tonnes in the week 36 of 2018). Spain is the EU’s biggest importer of frozen monkfish.
The price of frozen skipjack or stripe-bellied bonito (CN code 03034390) from Curaçao was 0,95 EUR/kg in week 51 of 2019 (the most recent available data). This represents a decrease of 14% from week 46 of 2018 and an increase of 17% from the four-week average since weeks 42–45 of 2019 (0,81 EUR/kg). Volume in week 51 was 253 tonnes, 116% up from week 46 of 2018, but 50% lower than the four-week average (week 42 to 45 of 2019). Prices seem to correlate inversely with imported volumes. They therefore exhibit an increasing trend, while volume decreased. EU trade is sporadic for this product, which is used for processing. Spain is the EU’s top importer.
Figure 38. IMPORT PRICE OF FROZEN SKIPJACK OR STRIPE-BELLIED BONITO FROM CURAÇAO
Source: European Commission (updated 16.02.2020).
3,00
3,40
3,80
4,20
4,60
5,00
5,40
2017
/12
2017
/19
2017
/26
2017
/33
2017
/40
2017
/47
2018
/02
2018
/09
2018
/16
2018
/23
2018
/30
2018
/37
2018
/44
2018
/51
2019
/06
2019
/13
2019
/20
2019
/27
2019
/34
2019
/41
2019
/48
2020
/03
EUR/
kg
Week 3: 3,90 EUR/kg
4,50
5,50
6,50
7,50
8,50
9,50
10,50
11,50
12,50
2017
/12
2017
/19
2017
/26
2017
/33
2017
/40
2017
/47
2018
/02
2018
/09
2018
/16
2018
/23
2018
/30
2018
/37
2018
/44
2018
/51
2019
/06
2019
/13
2019
/20
2019
/27
2019
/34
2019
/41
2019
/48
2020
/03
EUR/
kg
Week 3: 7,97 EUR/kg
0,00
0,50
1,00
1,50
2,00
2,50
2017
/08
2017
/15
2017
/22
2017
/29
2017
/36
2017
/43
2017
/50
2018
/05
2018
/12
2018
/19
2018
/26
2018
/33
2018
/40
2018
/47
2019
/02
2019
/09
2019
/16
2019
/23
2019
/30
2019
/37
2019
/44
2019
/51
EUR/
kg
Week 51: 0,95 EUR/kg
European Market Observatory for Fisheries and Aquaculture Products
MONTHLY HIGHLIGHTS | NO.3/2020 EXTRA-EU IMPORTS
21
Figure 39. IMPORT PRICE OF PREPARED OR PRESERVED MUSSELS FROM CHILE
Source: European Commission (updated 16.02.2020).
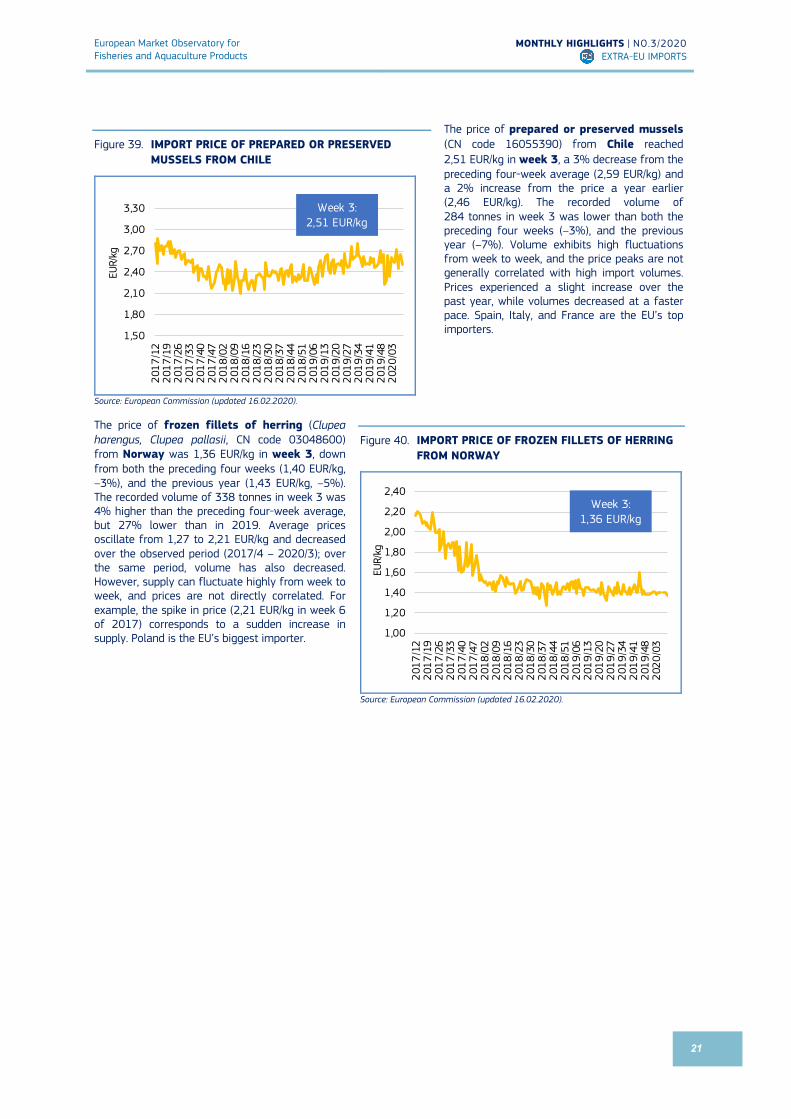
The price of prepared or preserved mussels (CN code 16055390) from Chile reached 2,51 EUR/kg in week 3, a 3% decrease from the preceding four-week average (2,59 EUR/kg) and a 2% increase from the price a year earlier (2,46 EUR/kg). The recorded volume of 284 tonnes in week 3 was lower than both the preceding four weeks (–3%), and the previous year (–7%). Volume exhibits high fluctuations from week to week, and the price peaks are not generally correlated with high import volumes. Prices experienced a slight increase over the past year, while volumes decreased at a faster pace. Spain, Italy, and France are the EU’s top importers.
The price of frozen fillets of herring (Clupea harengus, Clupea pallasii, CN code 03048600) from Norway was 1,36 EUR/kg in week 3, down from both the preceding four weeks (1,40 EUR/kg, –3%), and the previous year (1,43 EUR/kg, –5%). The recorded volume of 338 tonnes in week 3 was 4% higher than the preceding four-week average, but 27% lower than in 2019. Average prices oscillate from 1,27 to 2,21 EUR/kg and decreased over the observed period (2017/4 – 2020/3); over the same period, volume has also decreased. However, supply can fluctuate highly from week to week, and prices are not directly correlated. For example, the spike in price (2,21 EUR/kg in week 6 of 2017) corresponds to a sudden increase in supply. Poland is the EU’s biggest importer.
Figure 40. IMPORT PRICE OF FROZEN FILLETS OF HERRING FROM NORWAY
Source: European Commission (updated 16.02.2020).
1,50
1,80
2,10
2,40
2,70
3,00
3,30
2017
/12
2017
/19
2017
/26
2017
/33
2017
/40
2017
/47
2018
/02
2018
/09
2018
/16
2018
/23
2018
/30
2018
/37
2018
/44
2018
/51
2019
/06
2019
/13
2019
/20
2019
/27
2019
/34
2019
/41
2019
/48
2020
/03
EUR/
kg
Week 3: 2,51 EUR/kg
1,00
1,20
1,40
1,60
1,80
2,00
2,20
2,40
2017
/12
2017
/19
2017
/26
2017
/33
2017
/40
2017
/47
2018
/02
2018
/09
2018
/16
2018
/23
2018
/30
2018
/37
2018
/44
2018
/51
2019
/06
2019
/13
2019
/20
2019
/27
2019
/34
2019
/41
2019
/48
2020
/03
EUR/
kg
Week 3: 1,36 EUR/kg

European Market Observatory for Fisheries and Aquaculture Products
MONTHLY HIGHLIGHTS | NO.3/2020 CONSUMPTION
22
The most recent weekly consumption data (up to week 12 of 2020) are available on the EUMOFA website, and can be accessed here.
3. Consumption
3.1. HOUSEHOLD CONSUMPTION IN THE EU
In December 2019, the consumption of fresh fisheries and aquaculture products increased in both volume and value in Denmark, Hungary, the Netherlands, and the UK relative to December 2018. In Germany, volume decreased while value increased. In Spain, the opposite trend was observed. In the rest of the Member States, both volume and value decreased. The decrease seen in Sweden was mainly due to a decreased consumption of cod and salmon (-30% and -15%, respectively). A rise in salmon and trout consumption in Denmark (+29% and +20%, respectively) and the UK (+36% and +18%) contributed to the overall increase in consumption in those two countries. The increased consumption (+40%) of shrimps was the main reason for the increase in the volume of seafood consumed in the Netherlands.
Table 3. DECEMBER OVERVIEW OF THE REPORTING COUNTRIES (volume in tonnes and value in million EUR)
Country
Per capita consumption
2017* (live weight equivalent,
LWE) kg/capita/year
December 2017 December 2018 November 2019 December 2019 Change from
December 2018 to December 2019
Volume Value Volume Value Volume Value Volume Value Volume Value
Denmark 27,0 891 15,93 940 16,49 921 15,44 1.227 21,43 France 33,7 29.169 324,89 26.369 306,03 17.596 198,30 24.937 295,07
Germany 13,4 7.275 91,85 6.539 86,07 5.056 68,31 6.264 93,12
Hungary 5,6 1.940 10,40 2.163 11,90 358 1,79 2.546 13,45
Ireland 23,0 1.215 19.50 1.289 20,90 953 13,50 1.214 19,32
Italy 30,9 39.640 482,13 41.248 460,54 24.451 265,92 39.640 438,13
Netherlands 21,1 3.215 55,88 3.170 53,74 2.408 37,53 3.444 59,99 0%
Poland 15,0 14.750 70,32 13.514 67,11 4.112 26,50 12.489 65,46
Portugal 56,8 4.251 32,76 4.412 36,15 4.082 27,22 4.270 31,90
Spain 45,6 57.807 515,78 51.665 502,54 56.862 409,12 52.686 479,80
Sweden 26,6 866 11,88 849 11,09 620 8,29 730 9,39
UK 22,9 3.327 50,52 3.593 50,68 4.488 69,57 4.175 57,36
Source: EUMOFA, based on Europanel (updated 19.02.2020). *Data on per capita consumption of all fish and seafood products for all EU Member States can be found at: https://eumofa.eu/documents/20178/157549/EN_The+EU+fish+market_2019.pdf
For the past three years, household consumption of fresh fisheries and aquaculture products in December has been above the annual average in both volume and value for the majority of countries analysed. Only in the UK, volume was the same as the annual average, while value was lower. Portugal was the only Member State where volume was below the average.
13%
4%
18%
12%
8%
13%
31%
9%
30%
2%
2%
4% 5%
5%
6% 8%
4%
8%
16%
3%
5%
14%
12%
15%
European Market Observatory for Fisheries and Aquaculture Products
MONTHLY HIGHLIGHTS | NO.3/2020 CONSUMPTION
23
We have covered mackerel in previous Monthly Highlights:
First sales: France 1/2018; Norway 8/2015, 5/2014; Portugal 1/2018, 3/2016, September 2013; Sweden 1/2018; UK 9/2016, April 2013.
Consumption: Denmark 9/2016; France 8/2018; Ireland 9/2016; Italy 10/2015; Latvia 3/2014; Lithuania 3/2014; the Netherlands 9/2016; Spain 9/2016, 10/2015; Poland 3/2014; Portugal 8/2018, 9/2016; the UK 8/2018, 9/2016.
Extra-EU Import: Faroe Islands 1/2018, 9/2018; Greenland 1/2018; Morocco 7/2018; Norway 1/2018.
Topic of the month: EU Trade 5/2018, 5/2016, 4/2015; Atlantic mackerel in the EU 7/2018.
3.2. Fresh mackerel
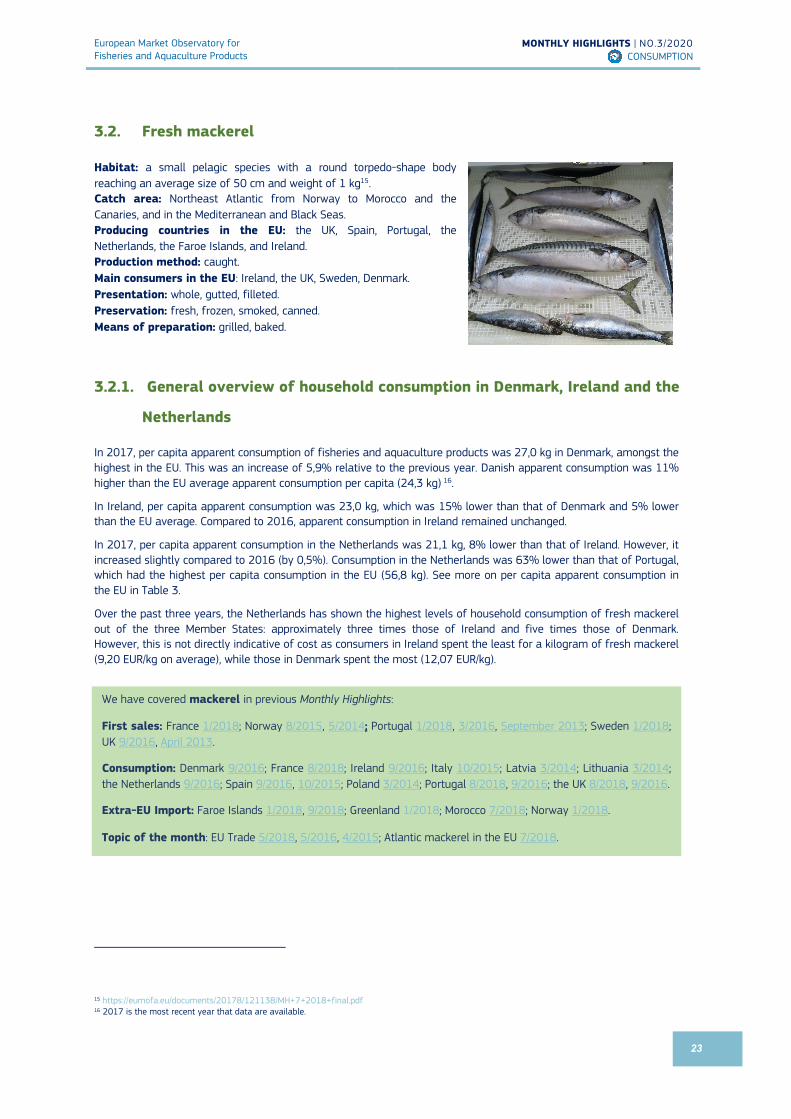
Habitat: a small pelagic species with a round torpedo-shape body reaching an average size of 50 cm and weight of 1 kg15. Catch area: Northeast Atlantic from Norway to Morocco and the Canaries, and in the Mediterranean and Black Seas. Producing countries in the EU: the UK, Spain, Portugal, the Netherlands, the Faroe Islands, and Ireland. Production method: caught. Main consumers in the EU: Ireland, the UK, Sweden, Denmark. Presentation: whole, gutted, filleted. Preservation: fresh, frozen, smoked, canned. Means of preparation: grilled, baked.
3.2.1. General overview of household consumption in Denmark, Ireland and the
Netherlands
In 2017, per capita apparent consumption of fisheries and aquaculture products was 27,0 kg in Denmark, amongst the highest in the EU. This was an increase of 5,9% relative to the previous year. Danish apparent consumption was 11% higher than the EU average apparent consumption per capita (24,3 kg) 16.
In Ireland, per capita apparent consumption was 23,0 kg, which was 15% lower than that of Denmark and 5% lower than the EU average. Compared to 2016, apparent consumption in Ireland remained unchanged.
In 2017, per capita apparent consumption in the Netherlands was 21,1 kg, 8% lower than that of Ireland. However, it increased slightly compared to 2016 (by 0,5%). Consumption in the Netherlands was 63% lower than that of Portugal, which had the highest per capita consumption in the EU (56,8 kg). See more on per capita apparent consumption in the EU in Table 3.
Over the past three years, the Netherlands has shown the highest levels of household consumption of fresh mackerel out of the three Member States: approximately three times those of Ireland and five times those of Denmark. However, this is not directly indicative of cost as consumers in Ireland spent the least for a kilogram of fresh mackerel (9,20 EUR/kg on average), while those in Denmark spent the most (12,07 EUR/kg).
15 https://eumofa.eu/documents/20178/121138/MH+7+2018+final.pdf 16 2017 is the most recent year that data are available.

European Market Observatory for Fisheries and Aquaculture Products
MONTHLY HIGHLIGHTS | NO.3/2020 CONSUMPTION
24
Figure 41. PRICES OF FRESH MACKEREL PURCHASED BY HOUSEHOLDS
Source: EUMOFA, based on Europanel (updated 19.02.2020).
Figure 42. HOUSEHOLD PURCHASES OF FRESH MACKEREL
Source: EUMOFA based on Europanel (updated 19.02.2020).
6,00
8,00
10,00
12,00
14,00
16,00Ja
nFe
bM
ar Apr
May Jun
Jul
Aug
Sep
Oct
Nov
Dec
Jan
Feb
Mar Ap
rM
ay Jun
Jul
Aug
Sep
Oct
Nov
Dec
Jan
Feb
Mar Ap
rM
ay Jun
Jul
Aug
Sep
Oct
Nov
Dec
2017 2018 2019
Pric
e (E
UR/k
g)
Denmark Ireland Netherlands
0
60
120
180
240
300
360
Jan
Feb
Mar Apr
May Jun
Jul
Aug
Sep
Oct
Nov
Dec
Jan
Feb
Mar Apr
May Jun
Jul
Aug
Sep
Oct
Nov
Dec
Jan
Feb
Mar Apr
May Jun
Jul
Aug
Sep
Oct
Nov
Dec
2017 2018 2019
Tonn
es
Denmark Ireland Netherlands

European Market Observatory for Fisheries and Aquaculture Products
MONTHLY HIGHLIGHTS | NO.3/2020 CONSUMPTION
25
3.2.2. Consumption trends in Denmark
Long-term trend (January 2017 to December 2019): Increasing slightly in both price and volume. Yearly average price: 12,05 EUR/kg (2017), 11,69 EUR/kg (2018), 12,48 EUR/kg (2019). Yearly consumption: 348 tonnes (2017), 359 tonnes (2018), 384 tonnes (2019).
Figure 43. RETAIL PRICE AND VOLUME OF FRESH MACKEREL PURCHASED BY HOUSEHOLDS IN DENMARK
Source: EUMOFA, based on Europanel (updated 19.02.2020).
3.2.3. Consumption trends in Ireland
Long-term trend (January 2017 to December 2019): decreasing both in volume and in price. Yearly average price: 9,39 EUR/kg (2017), 9,29 EUR/kg (2018), 8,91 EUR/kg (2019). Yearly consumption: 593 tonnes (2017), 557 tonnes (2018), 587 tonnes (2019).
Figure 44. RETAIL PRICE AND VOLUME OF FRESH MACKEREL PURCHASED BY HOUSEHOLDS IN IRELAND
Source: EUMOFA, based on Europanel (updated 19.02.2020).
0,00
8,00
16,00
24,00
32,00
0
15
30
45
60
75
Jan
Feb
Mar Apr
May Jun
Jul
Aug
Sep
Oct
Nov
Dec
Jan
Feb
Mar Ap
rM
ay Jun
Jul
Aug
Sep
Oct
Nov
Dec
Jan
Feb
Mar Apr
May
June
July
Aug
Sep
Oct
Nov
Dec
2017 2018 2019
Pric
e
Volu
me
Volume (tonnes) Price (EUR/kg)
In 2019, retail prices fluctuated between 10,73 EUR/kg and 13,34 EUR/kg. The latter was the highest price registered since 2017, when prices reached 14,46 EUR/kg in August, the highest for the period.
Despite the drop in consumtion levels seen in November 2019, the highest consumed volumes of the last three years were registered in 2019.
0,00
8,00
16,00
24,00
0
20
40
60
80
100
120
Jan
Feb
Mar Apr
May Jun
Jul
Aug
Sep
Oct
Nov
Dec
Jan
Feb
Mar Apr
May Jun
Jul
Aug
Sep
Oct
Nov
Dec
Jan
Feb
Mar Apr
May
June
July
Aug
Sep
Oct
Nov
Dec
2017 2018 2019
Pric
e
Volu
me
Volume (tonnes) Price (EUR/kg)
The highest prices recorded were in 2017, when they reached 10,80 EUR/kg, 15% higher than the average for the year.
In November 2019, consumption dropped to 31 tonnes, the lowest for the past three years. However, on a yearly basis consumed volumes increased by 5% compared to 2018.

European Market Observatory for
Fisheries and Aquaculture Products
MONTHLY HIGHLIGHTS | NO.3/2020
CONSUMPTION
26
3.2.4. Consumption trends in the Netherlands
Long-term trend (January 2017 to December 2019): Increasing in price and decreasing in volume. Yearly average price: 9,71 EUR/kg (2017), 9,37 EUR/kg (2018), 10,87 EUR/kg (2019). Yearly consumption: 2.295 tonnes (2017), 2.423 tonnes (2018), 2.094 tonnes (2019).
Figure 45. RETAIL PRICE AND VOLUME OF FRESH MACKEREL PURCHASED BY HOUSEHOLDS IN THE NETHERLANDS
Source: EUMOFA, based on Europanel (updated 19.02.2020)
0,00
5,00
10,00
15,00
20,00
25,00
0
80
160
240
320
400
480
Jan
Feb
Mar Apr
May Jun
Jul
Aug Sep
Oct
Nov
Dec Jan
Feb
Mar Apr
May Jun
Jul
Aug Sep
Oct
Nov
Dec Jan
Feb
Mar Apr
May
June
July
Aug Sep
Oct
Nov
Dec
2017 2018 2019
Pric
e
Vol
ume
Volume (tonnes) Price (EUR/kg)
In the second half of 2019, prices increased by 8% compared to the first six months, reaching an average of 11,28 EUR/kg.
In the past three years, consumption fluctuated reaching an average of 189 tonnes/month. The highest volumes consumed were recorded in 2018, when they reached 202 tonnes/month.

European Market Observatory for
Fisheries and Aquaculture Products
MONTHLY HIGHLIGHTS | NO.3/2020
CASE STUDY
27
4. Case study – Fisheries and aquaculture in Norway
The Kingdom of Norway is a Nordic country in north-western Europe, whose territory comprises the western and northernmost portion of the Scandinavian Peninsula; the remote island of Jan Mayen and the archipelago of Svalbard (in the Barents Sea)17. The length of the Norwegian coastline is 25.148 km, inclusive of its fjords.
Norway is part of the European Economic Area (EEA) through its membership in the European Free Trade Association (EFTA), meaning that the country is to a very large degree a partner in the internal market on the same terms as EU Member States. However, EU common agriculture and fisheries policy, the customs union, and the common trade policy are not covered by the EEA agreement.
The EU has three fisheries agreements with Norway: the bilateral, the trilateral and the neighbouring agreements. The bilateral agreement encompasses the North Sea and the Atlantic, while the trilateral agreement covers Skagerrak and Kattegat (Denmark, Sweden and Norway), and the neighbourhood agreement covers the Swedish fishery in Norwegian waters of the North Sea18.
The seafood sector is important for Norway. Value creation in the total seafood value chain (including ripple effects) was estimated at NOK 94 billion in 2017 (EUR 10 billion19), and the number of people employed in the sector was estimated to be 58.000 Full Time Equivalents (FTEs)20. Production in Norway amounted to 3,67 million tonnes in 2019. Approximately 2,6 million tonnes of fisheries and aquaculture products were exported from the country at value of EUR 10,75 billion21.
4.1. Fisheries
Following the expansion of the Norwegian exclusive economic zone in the 1970s to 200 nautical miles, the fishing grounds for the Norwegian fishing fleet expanded to include Svalbard and the Barents Sea in the north and Skagerrak in the south. Together with Russia, Norway manages the world’s largest stock of Atlantic cod, which is found in the Barents Sea. The North Sea is the main fishing ground for pelagic species such as herring and Atlantic mackerel.
17 The Spitsbergen Treaty (also known as the Svalbard Treaty) of 9 February 1920 recognises Norway's full and absolute sovereignty over the Arctic Archipelago of Spitsbergen (now called Svalbard). 18 https://ec.europa.eu/fisheries/cfp/international/agreements/norway_en 19 Exchange rate as available in European Central Bank was used for converting NOK to EUR (2017 average exchange rate: 0.10730 EUR for 1 NOK).
20 Sintef Community, Sintef Oceans; The Norwegian seafood industry – Importance for the national economy. 21 Norway Directorate of Fisheries.
Source: https://ukfisheries.net.

European Market Observatory for
Fisheries and Aquaculture Products
MONTHLY HIGHLIGHTS | NO.3/2020
CASE STUDY
28
Figure 46. NORWEGIAN CATCH VOLUMES, NUMBER OF VESSELS AND NUMBER OF FISHERMEN
Source: Norway Directorate of Fisheries.
In Norway, first sales of fisheries products are managed through a system of six sales cooperatives. One is Norges Sildesalgslag (the Norwegian Fishermen’s Sales Organization for Pelagic Fish)22, Europe’s largest marketplace for first sales of pelagics (1,6 million tonnes in 2018). First sales of other species are made through the remaining five organisations, of which Norges Råfisklag (the Norwegian Fishermen’s Sales Organization)23 is the largest, covering more than half of the Norwegian coastline and accounting for around 80% of the remaining sales volume. Over the past 20 years, catch volumes have been relatively stable, ranging between 2,1 and 2,7 million tones. Until 2015, the number of registered vessels and fishermen fell steadily. From 2015 to 2018 the number of vessels increased slightly to more than 6.000. In 2019, a total of 5.978 vessels were operating, of which 80% were coastal vessels with a hull length of less than 11 meters, typically operated by only one person. In the same year, 9.438 people registered fishing as their main occupation.
The value of Norwegian first sales has increased steadily over the past 20 years and exceeded NOK 20 billion for the first time in 2018. The first-sales value in 2018 amounted to NOK 20,8 billion (EUR 2,17billion). In 2019, first-sales value increased by 1% to NOK 21,1 billion (EUR 2,14 billion).
Figure 47. VALUE OF LANDINGS BY THE NORWEGIAN FLEET
Source: Norway Directorate of Fisheries.
In 2019, Norwegian vessels landed more than 2,3 million tonnes of fish and shellfish in Norway and abroad, valued at EUR 2,14 billion. This represented a 7% decrease in volume and a 1% decrease in value compared with 2018. Of this, 395.000 tonnes were landed abroad. The species landed abroad were mainly Antarctic krill (237.000 tonnes landed in Uruguay), blue whiting (90.000 tonnes landed in Denmark, Ireland and Iceland), and herring (33.000 tonnes mainly landed in Denmark).
22 Norwegian Fishermen’s Sales Organization for Pelagic Fish: https://www.sildelaget.no/en 23 Norwegian Fishermen’s Sales Organisation: https://www.rafisklaget.no/portal/page/portal/NR/Omoss/Norwegian_fishermens_sales_organization
0
2.000
4.000
6.000
8.000
10.000
12.000
14.000
16.000
0
500
1.000
1.500
2.000
2.500
3.000
Num
ber o
f fis
herm
en/v
esse
ls
1000
tonn
es
Catch volumes Number of vesselsNumber of fishermen
0
500
1.000
1.500
2.000
2.500
0
5.000
10.000
15.000
20.000
25.000
Mill
ion
EUR
Mill
ion
NO
K
Value in million NOK Value in million EUR
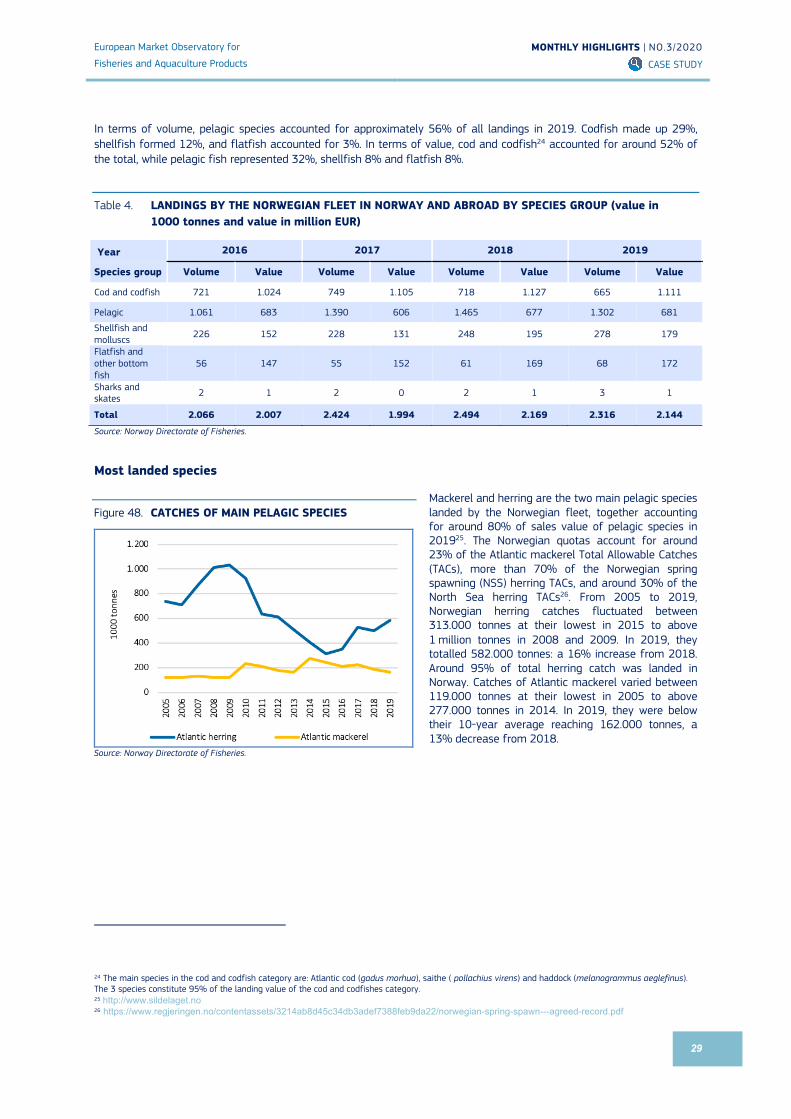
European Market Observatory for
Fisheries and Aquaculture Products
MONTHLY HIGHLIGHTS | NO.3/2020
CASE STUDY
29
In terms of volume, pelagic species accounted for approximately 56% of all landings in 2019. Codfish made up 29%, shellfish formed 12%, and flatfish accounted for 3%. In terms of value, cod and codfish24 accounted for around 52% of the total, while pelagic fish represented 32%, shellfish 8% and flatfish 8%.
Table 4. LANDINGS BY THE NORWEGIAN FLEET IN NORWAY AND ABROAD BY SPECIES GROUP (value in 1000 tonnes and value in million EUR)
Year 2016 2017 2018 2019
Species group Volume Value Volume Value Volume Value Volume Value
Cod and codfish 721 1.024 749 1.105 718 1.127 665 1.111
Pelagic 1.061 683 1.390 606 1.465 677 1.302 681
Shellfish and molluscs 226 152 228 131 248 195 278 179
Flatfish and other bottom fish
56 147 55 152 61 169 68 172
Sharks and skates 2 1 2 0 2 1 3 1
Total 2.066 2.007 2.424 1.994 2.494 2.169 2.316 2.144
Source: Norway Directorate of Fisheries.
Most landed species
Figure 48. CATCHES OF MAIN PELAGIC SPECIES
Source: Norway Directorate of Fisheries.
Mackerel and herring are the two main pelagic species landed by the Norwegian fleet, together accounting for around 80% of sales value of pelagic species in 201925. The Norwegian quotas account for around 23% of the Atlantic mackerel Total Allowable Catches (TACs), more than 70% of the Norwegian spring spawning (NSS) herring TACs, and around 30% of the North Sea herring TACs26. From 2005 to 2019, Norwegian herring catches fluctuated between 313.000 tonnes at their lowest in 2015 to above 1 million tonnes in 2008 and 2009. In 2019, they totalled 582.000 tonnes: a 16% increase from 2018. Around 95% of total herring catch was landed in Norway. Catches of Atlantic mackerel varied between 119.000 tonnes at their lowest in 2005 to above 277.000 tonnes in 2014. In 2019, they were below their 10-year average reaching 162.000 tonnes, a 13% decrease from 2018.
24 The main species in the cod and codfish category are: Atlantic cod (gadus morhua), saithe ( pollachius virens) and haddock (melanogrammus aeglefinus). The 3 species constitute 95% of the landing value of the cod and codfishes category. 25 http://www.sildelaget.no 26 https://www.regjeringen.no/contentassets/3214ab8d45c34db3adef7388feb9da22/norwegian-spring-spawn---agreed-record.pdf

European Market Observatory for
Fisheries and Aquaculture Products
MONTHLY HIGHLIGHTS | NO.3/2020
CASE STUDY
30
Cod, saithe and haddock are the main groundfish species landed by the Norwegian fleet. In 2019, they accounted for 93% of the volume and 95% of the value of total landings of the “cod and codfish”27 group. During the past 20 years, Atlantic cod catches varied between 190.000 tonnes at their lowest (in 2005) to 473.000 tonnes (in 2014). In 2019, they totalled 329.000 tonnes, a 13% decrease from the previous year. Saithe is the second most landed species, with levels between 147.000 tonnes (in 2013) to 256.000 tonnes (in 2006). In 2019, landings amounted to 195.000 tonnes, a 4% decrease from 2018. Haddock landings amounted to around 160.000 tonnes at their highest in 2011 and 2012 and have remained relatively stable (between 90.000 tonnes and 110.000 tonnes) over the past six years. In 2019, 95.000 tonnes of haddock were landed by Norwegian vessels, the same as in 2018.
Figure 49. CATCHES OF MAIN COD AND CODFISH SPECIES
Source: Norway Directorate of Fisheries.
Figure 50. CATCHES OF MAIN SHELLFISH SPECIES
Source: Norway Directorate of Fisheries.
Shrimp landings ranged from 52.000 tonnes at their peak in 2005 to 13.300 tonnes at their lowest in 2017. In 2019, they accounted for 28.000 tonnes, a 1% decrease from 2018. King crab is a relatively new species in Norwegian fisheries, originally coming from waters around the Kamchatka peninsula. The species has now spread to coastal areas in northern Norway and become an increasingly important commercial species due to a steep rise in market prices over recent years.
27 Cod, saithe and haddock are grouped as cod and codfish by the Norway Directorate of Fisheries. That is why the same grouping is used in the text.

European Market Observatory for
Fisheries and Aquaculture Products
MONTHLY HIGHLIGHTS | NO.3/2020
CASE STUDY
31
Price development at landing stage
From 2013 to 2019, the price of Atlantic cod increased dramatically (+102%) reaching 2,23 EUR/kg, while the price of haddock increased to 1,63 EUR/kg (+21%) and the price of saithe increased to 0,86 EUR/kg (+4%). Atlantic mackerel also showed a significant price increase, reaching 1,56 EUR/kg in 2019, a 37% growth from 2013. In contrast, the price of NSS herring declined, falling to 0,45 EUR/kg in 2019, a 32% decrease from 2013.
Figure 51. PRICE OF MAIN WHITE FISH AND PELAGIC SPECIES AT LANDING STAGE
Source: Norway Directorate of Fisheries.
Figure 52. PRICE OF SHRIMP AND KING CRAB AT LANDING STAGE
Source: Norway Directorate of Fisheries.
The price of king crab grew considerably (+128% from 2013), reaching 17,80 EUR/kg in 2019. This increase in price must be seen in relation to increase in demand from the EU, South Korea and the USA. As with NSS herring, the price of shrimp fell. A 20% decrease was recorded from 2013 to 2019, with shrimp prices reaching 3,41 EUR/kg.
4.2. Aquaculture
Since the first commercial salmonid farming began in the 1970s, aquaculture has become an increasingly important industry for Norway. Together with the fisheries sector, petroleum and shipbuilding industry, aquaculture contributes to the maintaining of strong communities along the coast. It is estimated that, as of 2017, the aquaculture-based value chain (including ripple effects) employed around 33.700 FTEs28. According to the Norway Directorate of Fisheries, aquaculture production in Norway totalled 1,35 million tonnes in 2018 for a value of NOK 68,6 billion (EUR 7,1 billion). Although 2018 saw lower total production than in 2015, the value of the catch was high, and set a new record.
28 Sintef Community, Sintef Oceans: The Norwegian seafood industry – Importance for the national economy.
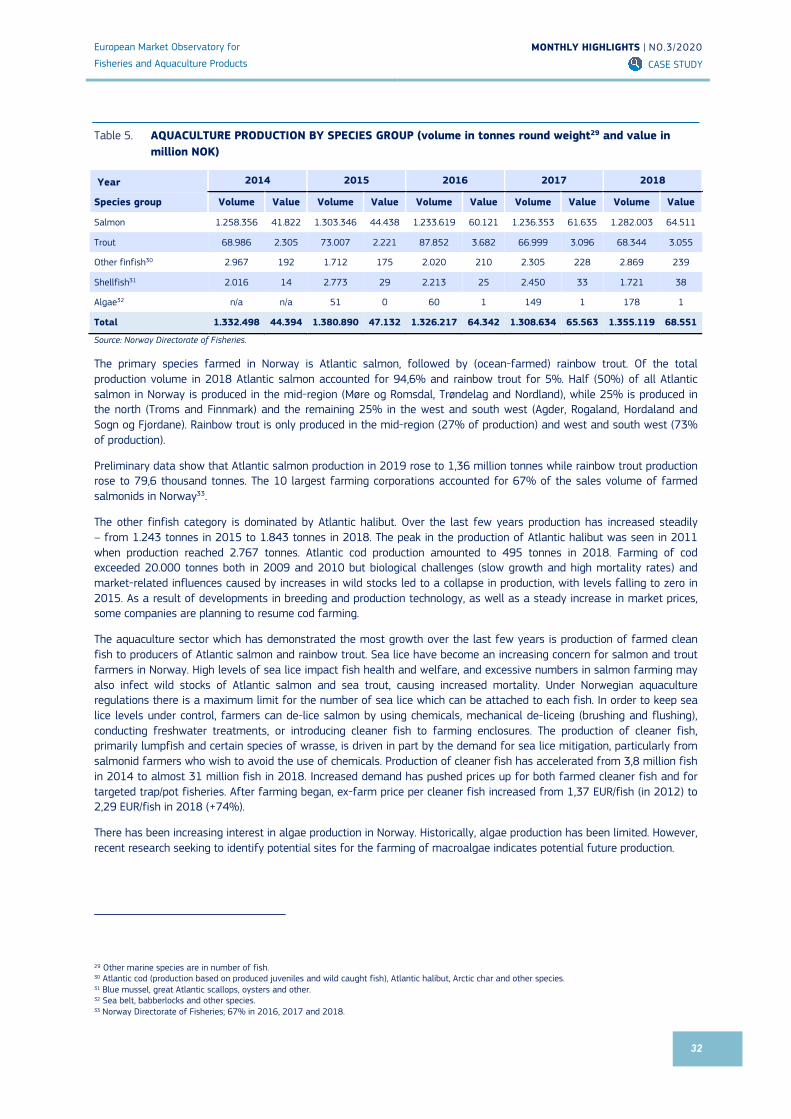
European Market Observatory for
Fisheries and Aquaculture Products
MONTHLY HIGHLIGHTS | NO.3/2020
CASE STUDY
32
Table 5. AQUACULTURE PRODUCTION BY SPECIES GROUP (volume in tonnes round weight29 and value in million NOK)
Year 2014 2015 2016 2017 2018
Species group Volume Value Volume Value Volume Value Volume Value Volume Value
Salmon 1.258.356 41.822 1.303.346 44.438 1.233.619 60.121 1.236.353 61.635 1.282.003 64.511
Trout 68.986 2.305 73.007 2.221 87.852 3.682 66.999 3.096 68.344 3.055
Other finfish30 2.967 192 1.712 175 2.020 210 2.305 228 2.869 239
Shellfish31 2.016 14 2.773 29 2.213 25 2.450 33 1.721 38
Algae32 n/a n/a 51 0 60 1 149 1 178 1
Total 1.332.498 44.394 1.380.890 47.132 1.326.217 64.342 1.308.634 65.563 1.355.119 68.551
Source: Norway Directorate of Fisheries.
The primary species farmed in Norway is Atlantic salmon, followed by (ocean-farmed) rainbow trout. Of the total production volume in 2018 Atlantic salmon accounted for 94,6% and rainbow trout for 5%. Half (50%) of all Atlantic salmon in Norway is produced in the mid-region (Møre og Romsdal, Trøndelag and Nordland), while 25% is produced in the north (Troms and Finnmark) and the remaining 25% in the west and south west (Agder, Rogaland, Hordaland and Sogn og Fjordane). Rainbow trout is only produced in the mid-region (27% of production) and west and south west (73% of production).
Preliminary data show that Atlantic salmon production in 2019 rose to 1,36 million tonnes while rainbow trout production rose to 79,6 thousand tonnes. The 10 largest farming corporations accounted for 67% of the sales volume of farmed salmonids in Norway33.
The other finfish category is dominated by Atlantic halibut. Over the last few years production has increased steadily – from 1.243 tonnes in 2015 to 1.843 tonnes in 2018. The peak in the production of Atlantic halibut was seen in 2011 when production reached 2.767 tonnes. Atlantic cod production amounted to 495 tonnes in 2018. Farming of cod exceeded 20.000 tonnes both in 2009 and 2010 but biological challenges (slow growth and high mortality rates) and market-related influences caused by increases in wild stocks led to a collapse in production, with levels falling to zero in 2015. As a result of developments in breeding and production technology, as well as a steady increase in market prices, some companies are planning to resume cod farming.
The aquaculture sector which has demonstrated the most growth over the last few years is production of farmed clean fish to producers of Atlantic salmon and rainbow trout. Sea lice have become an increasing concern for salmon and trout farmers in Norway. High levels of sea lice impact fish health and welfare, and excessive numbers in salmon farming may also infect wild stocks of Atlantic salmon and sea trout, causing increased mortality. Under Norwegian aquaculture regulations there is a maximum limit for the number of sea lice which can be attached to each fish. In order to keep sea lice levels under control, farmers can de-lice salmon by using chemicals, mechanical de-liceing (brushing and flushing), conducting freshwater treatments, or introducing cleaner fish to farming enclosures. The production of cleaner fish, primarily lumpfish and certain species of wrasse, is driven in part by the demand for sea lice mitigation, particularly from salmonid farmers who wish to avoid the use of chemicals. Production of cleaner fish has accelerated from 3,8 million fish in 2014 to almost 31 million fish in 2018. Increased demand has pushed prices up for both farmed cleaner fish and for targeted trap/pot fisheries. After farming began, ex-farm price per cleaner fish increased from 1,37 EUR/fish (in 2012) to 2,29 EUR/fish in 2018 (+74%).
There has been increasing interest in algae production in Norway. Historically, algae production has been limited. However, recent research seeking to identify potential sites for the farming of macroalgae indicates potential future production.
29 Other marine species are in number of fish. 30 Atlantic cod (production based on produced juveniles and wild caught fish), Atlantic halibut, Arctic char and other species. 31 Blue mussel, great Atlantic scallops, oysters and other. 32 Sea belt, babberlocks and other species. 33 Norway Directorate of Fisheries; 67% in 2016, 2017 and 2018.

European Market Observatory for
Fisheries and Aquaculture Products
MONTHLY HIGHLIGHTS | NO.3/2020
CASE STUDY
33
Since 2016 prices paid to farmers for Atlantic salmon and trout have shown a high trend. Prices for (ocean farmed) rainbow trout averaged 4,7 EUR/kg in the period from 2016 to 2018, while prices for Atlantic salmon averaged 5,27 EUR/kg. Spot market prices for fresh whole farmed Atlantic salmon from Norway decreased by 3% from 2018 to 2019 and it is expected that ex-farm prices followed the same trend. Prices for farmed Atlantic halibut have shown an upward trend for some years, and in 2018 ex-farm prices for the species surpassed 10 EUR/kg for the first time.
Figure 53. EX-FARM PRICE DEVELOPMENT OF MAIN FARMED SPECIES
Source: Norway Directorate of Fisheries, ECB (converting NOK to EUR).
4.3. Processing
In 2017, 11.400 people were employed in the Norwegian processing industry (including both aquaculture and fisheries). From 2015 to 2017, it is estimated that the value of fish processing in Norway increased by 58% to EUR 1,56 billion34.
Among the main drivers behind higher margins in the processing activities associated with wild fish were positive development in the raw material situation for fishmeal and fish oil, and increased prices in the conventional industry (groundfish). The Norwegian groundfish processing industry consists of around 200 companies and includes production of clip fish, salted fish, dried fish, whole gutted fish, and fillets.
In the aquaculture sector the processing share is relatively low. Unlike the fishing processing industry, most products from aquaculture are sold fresh and only a limited share of the production is actually processed in Norway. Based on trade data35, only 16% of the total export volume of salmon and trout was processed in Norway. The low processing share is impacted by high tariffs on products with high value added. Consequently, some Norwegian salmon and trout farming companies have established or acquired processing capacities in the EU for processing of smoked salmon and other ready-to-eat products.
4.4. Exports
From 2016 to 2019, Norwegian fisheries and aquaculture exports rose by 8% in volume and 10% in value.
The main species exported from Norway is salmon. In 2019, exports of salmon exceeded 1,1 million tonnes at a value of EUR 7,34 billion. This represents an increase of 15% in volume and 11% in value from 2016. Cod was the species with the second highest export value in 2019.
Herring ranked second in export volume in 2019. Between 346 and 524 tonnes of herring products were exported from Norway at a value of EUR 305 million in the same year. Despite a 48% increase in export volume from 2016 to 2019, export value dropped by 8%.
The highest export growth in the period was observed for redfishes with increases in both volume and value of 52% and 58%, respectively.
34 https://www.sintef.no/contentassets/d727158330ac4d00a00c77783b89acf2/nasjonal-verdiskapning_2018_endelig_100818.pdf 35 EUMOFA.
2,00
3,00
4,00
5,00
6,00
7,00
8,00
9,00
10,00
11,00
EUR/
kgAtlantic halibut Atlantic salmonRainbow trout

European Market Observatory for
Fisheries and Aquaculture Products
MONTHLY HIGHLIGHTS | NO.3/2020
CASE STUDY
34
Table 6. NORWEGIAN EXPORTS OF MAIN COMMERCIAL SPECIES (volume in tonnes and value in million EUR)
Year 2016 2017 2018 2019
Species Volume Value Volume Value Volume Value Volume Value
Salmon 965.149 6.606 985.985 6.922 1.041.627 7.063 1.105.796 7.344
Cod 212.588 932 215.283 979 193.113 976 177.344 1.018
Mackerel 308.799 443 370.490 483 68.013 99 238.581 431
Trout 68.442 420 38.415 299 46.509 312 59.578 373
Herring 234.480 331 253.880 272 291.423 271 346.524 305
Saithe (=Coalfish) 72.574 194 83.857 205 106.290 221 115.443 252
Haddock 71.193 155 75.119 181 61.605 175 60.109 179
Fish oil 85.186 106 88.794 102 99.224 119 115.673 134
Crab 7.045 98 4.920 86 4.936 90 5.638 107
Fishmeal 45.603 76 43.799 62 55.337 85 60.263 98
Halibut, Greenland 11.565 61 16.414 78 13.785 69 15.744 77
Caviar, livers and roes 9.984 25 8.526 20 11.083 31 13.145 47
Redfish 14.899 24 18.007 30 15.153 28 22.583 38
Other groundfish 9.114 27 11.232 33 11.062 33 11.616 36
Ling 8.300 34 8.085 37 7.400 36 7.190 33
Halibut, other 2.314 24 2.260 23 2.398 24 2.867 28
Other 321.932 210 385.206 251 485.080 277 278.410 242
Total 2.449.169 9.766 2.610.274 10.062 2.514.038 9.909 2.636.505 10.745 Source: EUMOFA, based on Statistics Norway data.
In 2019, Norway exported seafood to 151 different countries. However, the export markets for Norwegian seafood are dominated by the EU, with Poland, Denmark and France the most prominent export partners. In 2019, 1,5 million tonnes of seafood were exported from Norway to the EU for a value of EUR 6,36 billion. This represented 57% of the country’s total export volume and 59% of its export value.
The United States represents Norway’s largest non-EU market, with a share of export value of 6%, followed by China at 5%.

European Market Observatory for
Fisheries and Aquaculture Products
MONTHLY HIGHLIGHTS | NO.3/2020
CASE STUDY
35
Table 7. NORWEGIAN EXPORTS OF TOTAL FISHERIES AND AQUACULTURE PRODUCTS BY MAIN DESTINATION (volume in tonnes and value in million EUR)
Year 2016 2017 2018 2019
Country Volume Value Volume Value Volume Value Volume Value
Poland 210.013 1.044 192.239 961 225.766 1.064 230.516 1.079
Denmark 353.128 825 386.631 869 402.410 883 338.133 935
France 132.491 848 120.414 752 132.312 811 117.799 721
United States 70.414 499 79.179 605 78.378 623 79.859 679
United Kingdom
144.851 600 125.696 557 146.037 638 155.874 630
Netherlands 131.559 471 134.932 500 113.837 498 125.166 532
China 143.339 298 193.280 378 114.577 335 169.271 530
Spain 74.544 431 78.345 464 87.363 485 86.534 504
Italy 53.950 391 58.280 398 66.996 449 73.475 481
Japan 121.199 478 135.954 459 53.653 314 96.843 439
Other EU 358.543 1.497 379.029 1.518 392.723 1.462 376.629 1.474
Other non-EU 655.137 2.383 726.294 2.600 699.985 2.348 786.406 2.741
Total 2.449.169 9.766 2.610.274 10.062 2.514.038 9.909 2.636.505 10.745
EU total 1.459.078 6.108 1.475.567 6.019 1.567.444 6.290 1.504.125 6.355 Source: EUMOFA, based on Statistics Norway data.
Figure 54. EXPORT SHARES TO THE EU OF SELECTED SPECIES/COMMODITIES – MEASURED IN EXPORT VALUE
Source: EUMOFA, based on Statistics Norway data.
The total export value of salmon in 2019 amounted to EUR 7,34 billion, 64% of which was destined to the EU (Poland, France, Denmark and the Netherlands in descending order). The EU accounted for 76% of the export value of cod from Norway. The main EU market for cod in 2019 was Portugal and the main products were dried and salted cod36. Denmark followed suit, with a strong preference for fresh cod. The highest export share to the EU is recorded for fishmeal with 84%. Conversely, the EU only accounts for 15% of the export value of farmed rainbow trout. The main markets for both species are Eastern Europe and Asia.
36 For an analysis of the price structure in the supply chain of dried salted cod from Norway to Portugal, see the EUMOFA case study via the following link https://www.eumofa.eu/documents/20178/113218/Cod+in+NO_EN.pdf.
64%76%
65% 57%
84%
17%
49%
26%15%
38%
0%10%20%30%40%50%60%70%80%90%
100%
% Non EU %EU

European Market Observatory for
Fisheries and Aquaculture Products
MONTHLY HIGHLIGHTS | NO.3/2020
CASE STUDY
36
4.5. Imports
Although Norway is a net exporter of fisheries and aquaculture products, its large aquaculture industry has made the country dependent on imports of fish feed ingredients, particularly fish oil. From 2016 to 2019, Norwegian imports of fish oil increased by 14% in terms of volume and 5% in terms of value. While fish oil is still a vital component of fish feed, the share and amount of fish meal used for fish feed has declined over the last decade as fish meal has been increasingly substituted with alternative (plant-based) protein sources. From 2016 to 2019 import volume of fish meal dropped by 18% while value dropped by 15%. In 2019, a large part of fish oil imports came from Peru (30% of the import volume) and Denmark (21%). In imports of fish meal, Denmark and Iceland were the main trade partners with import shares of 36% and 33%, respectively. The third most important imported species is mackerel (82.504 tonnes in 2019). The majority of imports (95%) consist of landings of foreign vessels in Norway. The United Kingdom is the predominant foreign lander of mackerel in Norway with an import share of 71% in 2019, followed by Denmark (15%) and Ireland (7%). Most of the mackerel landed in Norway is re-exported to other markets. Like mackerel, most of the cod imported to Norway is landed by foreign vessels. Of 28.080 tonnes of cod imported in 2019, 16.900 tonnes originated from Russia.
Table 8. NORWEGIAN IMPORTS OF MAIN COMMERCIAL SPECIES (volume in tonnes and value million EUR)
Year 2016 2017 2018 2019
Main commercial species Volume Value Volume Value Volume Value Volume Value
Fish oil 191.887 355 211.523 322 204.490 322 219.076 373
Fishmeal 175.859 281 191.412 251 168.296 247 143.565 238
Mackerel 106.346 127 111.400 130 96.529 134 82.504 138
Cod 21.000 73 20.470 83 23.057 101 28.038 129
Shrimp, miscellaneous 5.880 68 6.759 72 6.206 67 6.275 69
Other marine fish 9.517 37 10.276 37 11.797 41 10.770 43
Other 123.486 213 107.572 188 121.599 205 122.283 203
Total 633.976 1.154 659.413 1.082 631.974 1.118 612.510 1.192 Source: EUMOFA, based on Statistics Norway data.
4.6. Consumption
According to the FAO, Norway was ranked 11th in the list of countries with the highest per capita seafood consumption. With a total production of seafood for human consumption at 3,3 million tonnes (past 5-year average) production per capita is around 600 kg. Per capita consumption of seafood and aquaculture products in Norway is estimated at 53 kg37. According to research conducted on consumer habits38, Norwegians eat an average of 140 seafood-based meals per year. The corresponding figure for Europe was 97. Despite relatively high consumption, at-home consumption of seafood has fallen by 22% since 2013. The biggest drop in consumption is observed for the youngest generations. For people aged 34 years and under, at-home seafood consumption fell by half39. The youngest generation also consumes seafood the least in the EU. Results from studies on consumer habits in the EU show that the percentage of consumers of fisheries and aquaculture products in the age class 15-24 is lower than the average of regular consumers.
Salmon is the most consumed species in Norway, followed by cod, mackerel and trout. Salmon and cod are the most consumed species on weekdays, whereas shrimp and trout score highest as the preferred species at weekends, and there is a preference for halibut and wolfish when eating at restaurants.
Consumers in Norway purchase most of their seafood for home consumption at large-scale retailers (super-/hypermarkets) or at local shops. Over the last few years, an increasing share has been purchased at local shops as opposed to super- and hypermarkets.
37 Norwegian Seafood Council. 38 Norwegian Seafood Council; https://seafood.no/markedsinnsikt/fiskemarked-h2018/norge-h2018/. 39 Ibidem.

European Market Observatory for
Fisheries and Aquaculture Products
MONTHLY HIGHLIGHTS | NO.3/2020
CASE STUDY
37
5. Case study – Scallop in the European market
Several species of scallop are caught or farmed globally, representing a total production of 2,8 million tonnes. In 2017, EU catches of scallop species reached almost 67.000 tonnes, with two main producers (France and the UK) and two main species: great Atlantic scallop (or king scallop, 86%) and queen scallop (14%)40. The European supply is supplemented by significant imports, mostly frozen, from North America (the USA, Canada) and South America (Argentina, Peru). In 2019, first-sales prices of great Atlantic scallop decreased in French markets and at points of sale in the UK.
5.1. Biology, resource and exploitation
Biology
Scallop is the common name applied to any one of the numerous species of saltwater clams or marine filter-feeding bivalve molluscs in the taxonomic family Pectinidae. Scallops live mainly on sand or gravel beds. Many species are highly prized as a food source, and some are farmed. The main species found in European waters are great Atlantic scallop or king scallop (Pecten maximus) and queen scallop (Chlamys opercularis). In addition, several other species are imported into the EU market such as American scallop (Placopecten magellanicus), Peruvian scallop (Argopecten purpuratus), and Patagonian scallop (Zygochlamys patagonica).
Great Atlantic scallop is found along the length of the European Atlantic coast from northern Norway to the Iberian Peninsula. The species has also been reported in waters off West Africa, the Azores, the Canary Islands, and Madeira. As a hermaphroditic animal, there is no distinct difference in size range between male and female individuals once they have reached maturity. The average maximum size for mature individuals is 15 cm, but specimens of up to 21 cm have been recorded. Atlantic scallops begin to mature at 2 years, reaching full maturity between 3 and 5 years of age41. Although considered sedentary, scallops are able to swim limited distances propelled by jets of water.
Queen scallop is found in the Mediterranean Sea and eastern Atlantic coast from Norway to the Cape Verde Islands, the Azores, and the North Sea at depths of 20 to 45 meters in shallow subtidal areas. It grows quickly, reaching sexual maturity at around 1 to 2 years of age and at a size of 40 mm (shell length). The species lives on the seafloor (across all habitats) for a maximum lifespan of 6 years42. Queen scallops are raised on experimental farms in Spain, France, and the United Kingdom43.
Resource, exploitation, and management in Europe
There are three methods traditionally used for harvesting scallops: diving, bottom trawling and dredging. The European nations accountable for the majority of catch of this species are France and the UK.
Current EU legislation specifies a minimum conservation size for scallops of 110 mm shell length in the Irish Sea and in the Eastern English Channel, and 100 mm shell length in other fishing areas 44. There are no catch limits in place in the form of TACs or quotas. Gear selectivity measures and Minimum Landing Sizes (MLS) are common methods used to ensure that scallops are not harvested at too small a size for breeding.
40 For the related species profile, please consult EUMOFA at https://www.eumofa.eu/the-eu-market#speciesProfiles. 41 http://www.marlin.ac.uk/biotic/browse.php?sp=4236 42 https://www.marlin.ac.uk/species/detail/1997 43 https://www.inlandseafood.com/seapedia/queen-scallops 44 COUNCIL REGULATION (EC) No 850/98 http://eur-lex.europa.eu/legal-content/EN/TXT/PDF/?uri=CELEX:31998R0850&from=EN
European Market Observatory for
Fisheries and Aquaculture Products
MONTHLY HIGHLIGHTS | NO.3/2020
CASE STUDY
38
Queen scallops are typically sourced from coastal fisheries. Major fisheries for the species are operated by the UK fleet which has consistently accounted for the highest catches, followed by France, the Faroe Islands, and the Isle of Man. They are primarily harvested with dredges that are towed along the seabed. Scallop meat is usually shucked (taken out of the shell) immediately after harvest.
Management measures instigating intermittent closures of fishing grounds for periods of several years to increase yield or protect part of the spawning stock have been found to be very successful. In France, rotational closures together with enhancement techniques using cultured juveniles are also used successfully to improve yields45.
Management measures are used to varying degrees in areas where queen scallop is harvested. The Isle of Man trawl fishery has been certified by the Marine Stewardship Council46. The EU minimum catch size for the species is 40 mm shell height (SH); however, it is generally uneconomic to process queen scallops of less than 55 mm SH. In France (the Bay of Biscay), there are specific limits on the amount of fishing time and size of vessels permitted47.
Since the 1970s, cultivation of scallops has increased rapidly and now accounts for nearly 80% of total (caught and farmed) world production48. Several scallop species are also farmed, particularly Chinese species (Chlamys farreri and Argopecten irradians) and Yesso scallop (Pecten yessoensis) farmed in Asia, and Peruvian scallop (Argopecten purpuratus) farmed in Peru and Chile. They are either farmed via suspension culture or in bottom culture systems using spat that has been harvested from collectors at sea and/or provided by hatcheries49. More recently, both Chile and China have advanced with trials to cultivate imported great Atlantic scallop which, if proved successful, could have significant implications for European producers and markets. Small quantities of great Atlantic scallop have been cultivated in Europe (the UK, Channel Islands, France, Ireland, and Norway) for many years.
5.2. Production
Catches
Global catches production of scallop amounted to 631.718 tonnes in 2017. The main species produced were American sea scallop (40%), yesso scallop (39%), great Atlantic scallop (10%), Patagonian scallop (6%), and queen scallop (2%).
The leading producers were Japan and the USA, which provided 37% and 31% of the total world production, respectively, in 2017, followed by the EU at 11%. Other major producers were Canada (9%) and Argentina (6%).
Over the last decade (2008–2017), world production of wild-caught scallops has experienced a 17% decrease, corresponding to a fall in volume of more than 130.000 tonnes. This was primarily attributable to reduced Japanese production (–24%) and, to a lesser extent, declines in US and Canadian production (–4% and –17%, respectively). Increasing catches have been reported in the EU–28 (+11%) and, more significantly, in Russia (+142%).
45 http://www.seafish.org/media/publications/SeafishResponsibleSourcingGuide_Scallops_201301.pdf 46 https://fisheries.msc.org/en/fisheries/isle-of-man-queen-scallop-trawl/@@assessments 47 Seafish 2008; Townsend et al. 2008. 48 https://www.seafish.org/media/1403315/_2_scallops_rsg_cocker-04-15kg.pdf 49 http://www.fao.org/fishery/culturedspecies/Patinopecten_yessoensis/en

European Market Observatory for
Fisheries and Aquaculture Products
MONTHLY HIGHLIGHTS | NO.3/2020
CASE STUDY
39
Table 9. WORLD CATCHES OF SCALLOP (volume in tonnes)
Country 2008 2009 2010 2011 2012 2013 2014 2015 2016 2017
Japan 310.205 319.638 327.087 302.990 315.387 347.541 358.982 233.885 213.710 236.000
USA 203.689 219.816 218.020 224.357 216.692 156.607 129.682 135.679 153.820 195.453
EU-28 59.998 66.498 79.564 86.141 83.307 85.484 64.655 65.980 69.259 66.693
Canada 67.621 62.921 60.300 59.880 53.306 64.684 69.745 61.061 53.764 55.944
Argentina 58.713 80.810 50.870 47.844 36.820 42.202 33.583 31.627 35.536 39.297
Russian Federation
4.982 3.797 5.389 4.863 3.405 4.888 8.700 10.762 12.734 12.081
Australia 10.299 7.004 7.608 6.950 3.563 6.745 4.421 4.322 5.013 6.091
Peru 19.618 26.478 62.827 93.050 14.896 22.178 56.002 17.176 13.343 5.727
Thailand 171 132 268 282 421 325 757 4.051 2.727 4.090
Isle of Man 2.311 3.051 4.133 6.062 5.238 4.769 2.602 6.367 5.627 3.999
Others 24.856 25.398 26.378 27.030 17.791 11.592 11.608 6.615 6.401 6.343
Total 762.463 815.543 842.444 859.449 750.826 747.015 740.737 577.525 571.934 631.718
Source: FAO.
According to the FAO, EU catch of scallop amounted to 66.693 tonnes in 2017 (86% great Atlantic scallop and 14% queen scallop), providing approximately 11% of the world supply of wild-caught scallops. France and the UK together accounted for almost all of the EU’s total catch volume of scallops; 46% and 49% respectively. Other important EU producers are Ireland (4%) and Belgium (1%).
Over 2008-2017, EU production experienced strong fluctuations, peaking between 2011 and 2013 when production averaged 85.000 tonnes annually. Fluctuations were mostly due to the strong variability of queen scallop catches. Both France and the UK saw increased catches over the course of the decade (+13% and +10%, respectively). According to preliminary Eurostat figures for 2018, great Atlantic scallop landings in France more than doubled relative to 2017 (reaching 60.039 tonnes) especially due to a significantly increasing scallop estimated biomass at sea50. However, first sales in French auctions increased by only 3% from 2017 to 2018. In 2019, first sales in French auctions stayed stable compared to 2018.
50 https://wwz.ifremer.fr/content/download/120557/file/CP_CSJ_2018.pdf

European Market Observatory for
Fisheries and Aquaculture Products
MONTHLY HIGHLIGHTS | NO.3/2020
CASE STUDY
40
Table 10. EU CATCHES OF SCALLOP (volume in tonnes)
Country 2008 2009 2010 2011 2012 2013 2014 2015 2016 2017
France 28.749 26.775 31.425 32.891 26.403 30.977 23.533 24.552 26.568 32.441
United Kingdom
27.802 34.449 43.862 49.448 52.415 50.061 36.187 37.970 38.910 30.447
Ireland 1.121 2.644 1.975 2.292 2.701 3.040 2.952 2.053 2.225 2.555
Belgium 674 886 1.037 898 751 618 1.224 765 769 836
Spain 567 496 557 226 301 332 308 213 176 170
Italy 297 472 364 301 679 346 296 239 437 140
Croatia - 20 26 78 53 106 152 182 168 99
Netherlands 781 754 315 - - - - - 1 3
Greece 6 2 3 7 4 4 3 6 5 2
Denmark 1 - - - - - - - - -
Total 59.998 66.498 79.564 86.141 83.307 85.484 64.655 65.980 69.259 66.693
Source: FAO.
Aquaculture
Global production of farmed scallops amounted to 2,19 million tonnes in 2017. The leading producer, China, provided 93% of the total world aquaculture production for the same year, followed by Japan at 6% and Peru at 1%. Other important producers were Russia, Chile and Korea (each accounting for 0,2% of total production).
Volumes of farmed scallops worldwide grew by 55% from 2008 to 2017. This growth was driven by Chinese production (up by 76%). However, significant decreases were reported in Japan (–40%) and Peru (–19%).
During the same period, EU production fell by 82% due to the sharp decrease in Irish production (0 tonnes reported in 2017). Only the UK (92% of EU production) and Spain (8%) reported farmed scallop production in 2017. Overall, EU production amounted to only 19 tonnes in 2017 (39% great Atlantic scallop and 58% queen scallop).
Table 11. EU AQUACULTURE OF SCALLOP SPECIES (volume in tonnes)
Country 2008 2009 2010 2011 2012 2013 2014 2015 2016 2017
China 1.148.194 1.277.223 1.395.937 1.273.699 1.375.121 1.555.806 1.593.216 1.727.549 1.867.078 2.024.032
Japan 225.607 256.695 219.649 118.425 184.287 167.844 184.588 248.209 214.571 135.100
Peru 14.802 16.047 58.101 52.213 24.782 67.694 55.096 23.029 20.975 11.927
Russian Federation
85 843 854 725 504 1.311 2.400 2.000 3.745 5.463
Chile 21.277 16.864 8.840 11.018 5.798 5.001 4.146 2.960 3.547 4.706
Korea 421 348 253 403 519 484 956 1.557 2.995 3.493
EU-28 101 66 66 62 52 50 39 59 45 19
Others 412 610 914 515 441 393 425 304 310 503
Total 1.410.899 1.568.695 1.684.615 1.457.060 1.591.503 1.798.583 1.840.866 2.005.667 2.113.266 2.185.243
Source: FAO.

European Market Observatory for
Fisheries and Aquaculture Products
MONTHLY HIGHLIGHTS | NO.3/2020
CASE STUDY
41
Processing and marketing
Fresh scallops are mostly available from November to April, when the fishing season is open in France and at its most active in the UK. The majority of scallops are sold as whole products (shell on), but a significant share is shelled and packed to be sold fresh or frozen through retail channels, to HoReCa, or exported.
Scallops have a firm, meaty texture, which requires minimal cooking (by steaming, pan-frying or grilling). It may also be consumed raw as sushi or carpaccio in restaurants.
A significant scallop processing industry exists in Europe (mainly freezing and shucking), particularly in the UK. In addition, a small industry based around the preparation of frozen meals (stuffed scallops) and chilled terrines exists, mostly in France51.
An increasing number of scallop products are certified with quality-assurance schemes. A certain share of imports from Peru have been certified by the Aquaculture Stewardship Council (ASC), and some wild-caught scallops imported from Canada and Argentina are Marine Stewardship Council (MSC) certified52. In the EU, producers try to add value through certifications of origin (national, regional or local), the use of brand labels and/or Geographical Indications (e.g. PGI53 Coquille Saint-Jacques des Côtes-d’Armor), or with quality-assurance schemes such as Label Rouge. However, even if imported frozen scallop can be marketed as noix de Saint-Jacques, especially in the food service sector or in prepared meals, the Great Atlantic scallop caught by the EU fleet is mostly marketed as whole and fresh. It has different organoleptic characteristics, thus it belongs to a different product category.
5.3. First sales in Europe
First-sale monthly data show the strong seasonality of great Atlantic scallop fisheries, with higher catch volumes during winter months in the primary scallop producing countries (France and the UK). In France, scallop fisheries are closed from May to October, while UK fisheries remain operational throughout the year. During the fishing season, monthly first-sale volumes in French auctions fluctuate between 1.500 and 3.500 tonnes, whereas in the UK average monthly first-sale volumes are lower (between 500 and 2.500 tonnes). The main auctions for great Atlantic scallop in France are Dieppe, Port-en-Bessin and Saint-Quay-Portrieux. In the UK, first sales mainly occur at Shoreham-by-Sea, Brixham and Hartlepool. In both the UK and France, a significant share of scallop catch is not sold in auctions, but rather directly to processors, traders or wholesalers and even as direct sales.
Prices at first-sale stage are more stable in the UK than in France due to the regularity of supplies. Over the course of a typical year, however, average prices are similar in the two countries (ranging between 2,60 and 3,00 EUR/kg). Between 2018 and 2019, a decrease in first-sale prices was seen in both France (–4%) and the UK (–9%).
Figure 55. FIRST SALES OF GREAT ATLANTIC SCALLOP IN FRANCE (volume in tonnes, price in EUR/kg)
Source: EUMOFA.
51 https://www.eumofa.eu/documents/20178/137160/King+scallop_31-1.pdf 52 Produits de la mer Magazine number 198 (Dec-Jan 2020). 53 Protected Geographical Indication.
0,000,501,001,502,002,503,003,504,004,50
0
500
1.000
1.500
2.000
2.500
3.000
3.500
4.000
Pric
e (E
UR/
kg)
Volu
me
(ton
nes)
Volume Price

European Market Observatory for
Fisheries and Aquaculture Products
MONTHLY HIGHLIGHTS | NO.3/2020
CASE STUDY
42
Figure 56. FIRST SALES OF GREAT ATLANTIC SCALLOP IN THE UK (volume in tonnes, price in EUR/kg)
Source: EUMOFA.
For queen scallop, first-sale data indicate a pattern of seasonality with higher volumes during the spring and summer months in France, whereas seasonality for the UK is not clearly defined. During the fishing season, monthly first-sale volumes in France and the UK fluctuate between 200 and 800 tonnes. In 2019, both countries experienced a significant decrease of first-sale volumes relative to 2018. The primary place of sale for queen scallop in the UK is Kirkcudbright and, in France, Erquy and Grandville.
Over the 2017–2019 period, first-sale prices are highly sensitive to fluctuations in volume but were more stable in the UK than in France, owing to the stability provided by regular queen scallop supplies. On a yearly basis, average prices are lower in France (ranging between 0,70 and 1,05 EUR/kg over 2017–2019) than in the UK (ranging between 1,02 and 1,42 EUR/kg). In 2019, compared to 2018, average queen scallop prices decreased in the UK (–15%) but increased in France (+52%).
Figure 57. FIRST SALES OF QUEEN SCALLOP IN FRANCE (volume in tonnes, price in EUR/kg)
Source: EUMOFA.
0,00
0,50
1,00
1,50
2,00
2,50
3,00
3,50
0
500
1.000
1.500
2.000
2.500
Pric
e (E
UR/
kg)
Volu
me
(ton
nes)
Volume Price
0,00
0,50
1,00
1,50
2,00
2,50
3,00
3,50
0100200300400500600700800900
1.000
2017
-M01
2017
-M02
2017
-M03
2017
-M04
2017
-M05
2017
-M06
2017
-M07
2017
-M08
2017
-M09
2017
-M10
2017
-M11
2017
-M12
2018
-M01
2018
-M02
2018
-M03
2018
-M04
2018
-M05
2018
-M06
2018
-M07
2018
-M08
2018
-M09
2018
-M10
2018
-M11
2018
-M12
2019
-M01
2019
-M02
2019
-M03
2019
-M04
2019
-M05
2019
-M06
2019
-M07
2019
-M08
2019
-M09
2019
-M10
2019
-M11
2019
-M12
Pric
e (E
UR/
kg)
Volu
me
(ton
nes)
Volume Price

European Market Observatory for
Fisheries and Aquaculture Products
MONTHLY HIGHLIGHTS | NO.3/2020
CASE STUDY
43
Figure 58. FIRST SALES OF QUEEN SCALLOP IN THE UK (volume in tonnes, price in EUR/kg)
Source: EUMOFA.
5.4. Import – Export
In 2018, the EU experienced a EUR 180 million trade deficit in scallops. The deficit was mainly attributable to the imports of frozen scallop from Chile, Peru, Canada and Argentina. Extra-EU imports of live/fresh scallop products are limited (13 million EUR for 860 tonnes in 2018), and mostly come from the USA, Faroe Islands, and Norway.
Scallop trade between EU Member States is predominantly centered around fresh products. In 2018, intra-EU exports reached EUR 262.493 million for more than 24.000 tonnes, of which 49% were fresh products and 38% were frozen products. The UK and the Netherlands are the main suppliers. France and, to a lesser extent Spain and Italy, are the main destination markets.
Extra-EU exports are relatively low (EUR 15 million for 3.125 tonnes in 2018), and the main destinations for fresh and frozen scallop are Switzerland, Vietnam, and the USA.
Figure 59. THE EU SCALLOP TRADE MARKET IN 2019
Source: EUMOFA based on Eurostat-COMEXT.
0,000,200,400,600,801,001,201,401,601,802,00
0
100
200
300
400
500
60020
17-M
0120
17-M
0220
17-M
0320
17-M
0420
17-M
0520
17-M
0620
17-M
0720
17-M
0820
17-M
0920
17-M
1020
17-M
1120
17-M
1220
18-M
0120
18-M
0220
18-M
0320
18-M
0420
18-M
0520
18-M
0620
18-M
0720
18-M
0820
18-M
0920
18-M
1020
18-M
1120
18-M
1220
19-M
0120
19-M
0220
19-M
0320
19-M
0420
19-M
0520
19-M
0620
19-M
0720
19-M
0820
19-M
0920
19-M
1020
19-M
1120
19-M
12
Pric
e (E
UR/
kg)
Volu
me
(ton
nes)
Volume Price
INTRA-EU TRADE
EU MARKET
87% frozen6% live/fresh7% unspecified
EUR 15 million
Main exporters: UK 37%, Netherlands 23%, France 16%, Others 24%
Main destinations: France 39%, Italy 16 %, Spain 11%, Others 34%
• USA 31% • Peru 17%, • Canada 15%• Argentina 12%• Others 25%
• Switzerland 29% • Vietnam 26%• USA 15%• Norway 6%• Others 24%
EUR 195 million
EUR 262 million49% live/fresh38% frozen4% prepared/preserved9% unspecified
60% frozen19% prepared/preserved14% live/fresh7% unspecified
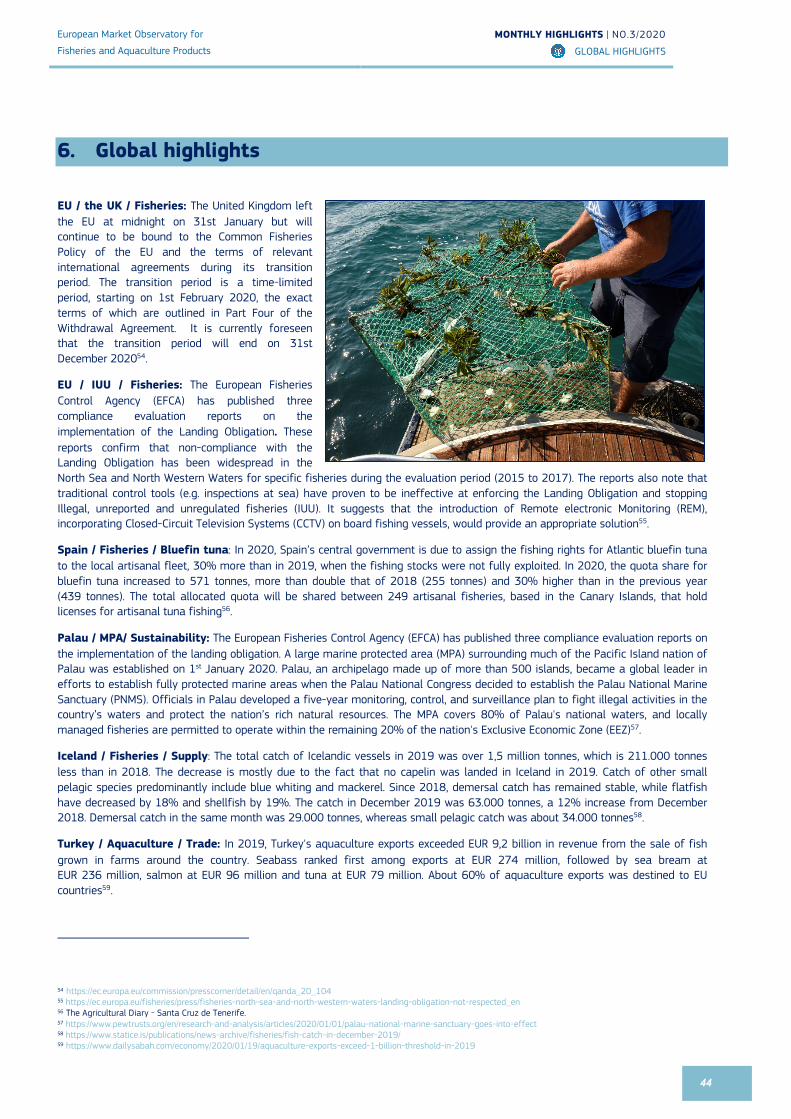
European Market Observatory for
Fisheries and Aquaculture Products
MONTHLY HIGHLIGHTS | NO.3/2020
GLOBAL HIGHLIGHTS
44
6. Global highlights
EU / the UK / Fisheries: The United Kingdom left the EU at midnight on 31st January but will continue to be bound to the Common Fisheries Policy of the EU and the terms of relevant international agreements during its transition period. The transition period is a time-limited period, starting on 1st February 2020, the exact terms of which are outlined in Part Four of the Withdrawal Agreement. It is currently foreseen that the transition period will end on 31st December 202054.
EU / IUU / Fisheries: The European Fisheries Control Agency (EFCA) has published three compliance evaluation reports on the implementation of the Landing Obligation. These reports confirm that non-compliance with the Landing Obligation has been widespread in the North Sea and North Western Waters for specific fisheries during the evaluation period (2015 to 2017). The reports also note that traditional control tools (e.g. inspections at sea) have proven to be ineffective at enforcing the Landing Obligation and stopping Illegal, unreported and unregulated fisheries (IUU). It suggests that the introduction of Remote electronic Monitoring (REM), incorporating Closed-Circuit Television Systems (CCTV) on board fishing vessels, would provide an appropriate solution55.
Spain / Fisheries / Bluefin tuna: In 2020, Spain’s central government is due to assign the fishing rights for Atlantic bluefin tuna to the local artisanal fleet, 30% more than in 2019, when the fishing stocks were not fully exploited. In 2020, the quota share for bluefin tuna increased to 571 tonnes, more than double that of 2018 (255 tonnes) and 30% higher than in the previous year (439 tonnes). The total allocated quota will be shared between 249 artisanal fisheries, based in the Canary Islands, that hold licenses for artisanal tuna fishing56.
Palau / MPA/ Sustainability: The European Fisheries Control Agency (EFCA) has published three compliance evaluation reports on the implementation of the landing obligation. A large marine protected area (MPA) surrounding much of the Pacific Island nation of Palau was established on 1st January 2020. Palau, an archipelago made up of more than 500 islands, became a global leader in efforts to establish fully protected marine areas when the Palau National Congress decided to establish the Palau National Marine Sanctuary (PNMS). Officials in Palau developed a five-year monitoring, control, and surveillance plan to fight illegal activities in the country’s waters and protect the nation’s rich natural resources. The MPA covers 80% of Palau's national waters, and locally managed fisheries are permitted to operate within the remaining 20% of the nation's Exclusive Economic Zone (EEZ)57.
Iceland / Fisheries / Supply: The total catch of Icelandic vessels in 2019 was over 1,5 million tonnes, which is 211.000 tonnes less than in 2018. The decrease is mostly due to the fact that no capelin was landed in Iceland in 2019. Catch of other small pelagic species predominantly include blue whiting and mackerel. Since 2018, demersal catch has remained stable, while flatfish have decreased by 18% and shellfish by 19%. The catch in December 2019 was 63.000 tonnes, a 12% increase from December 2018. Demersal catch in the same month was 29.000 tonnes, whereas small pelagic catch was about 34.000 tonnes58.
Turkey / Aquaculture / Trade: In 2019, Turkey's aquaculture exports exceeded EUR 9,2 billion in revenue from the sale of fish grown in farms around the country. Seabass ranked first among exports at EUR 274 million, followed by sea bream at EUR 236 million, salmon at EUR 96 million and tuna at EUR 79 million. About 60% of aquaculture exports was destined to EU countries59.
54 https://ec.europa.eu/commission/presscorner/detail/en/qanda_20_104 55 https://ec.europa.eu/fisheries/press/fisheries-north-sea-and-north-western-waters-landing-obligation-not-respected_en 56 The Agricultural Diary - Santa Cruz de Tenerife. 57 https://www.pewtrusts.org/en/research-and-analysis/articles/2020/01/01/palau-national-marine-sanctuary-goes-into-effect 58 https://www.statice.is/publications/news-archive/fisheries/fish-catch-in-december-2019/ 59 https://www.dailysabah.com/economy/2020/01/19/aquaculture-exports-exceed-1-billion-threshold-in-2019

European Market Observatory for
Fisheries and Aquaculture Products
MONTHLY HIGHLIGHTS | NO.3/2020
MACROECONOMIC CONTEXT
45
7. Macroeconomic Context
7.1. Marine fuel
Average prices for marine fuel in February 2020 ranged between 0,43 and 0,46 EUR/litre in ports in France, Italy, Spain, and the UK. These prices were about 11% lower compared with the previous month and 9% lower compared with the same month in 2019.
Table 12. AVERAGE PRICE OF MARINE DIESEL IN ITALY, FRANCE, SPAIN, AND THE UK (EUR/litre) Member State Feb 2020 Change from Jan 2020 Change from Feb 2019 France (ports of Lorient and Boulogne) 0,43 -10% -10%
Italy (ports of Ancona and Livorno) 0,46 -10% -10%
Spain (ports of A Coruña and Vigo) 0,46 -10% -6%
The UK (ports of Grimsby and Aberdeen) 0,43 -12% -10%
Source: Chamber of Commerce of Forlì-Cesena, Italy; DPMA, France; MABUX.
Figure 60. AVERAGE PRICE OF MARINE DIESEL IN ITALY, FRANCE, SPAIN, AND THE UK (EUR/litre)
Source: Chamber of Commerce of Forlì-Cesena, Italy; DPMA, France; MABUX.
7.2. Consumer prices
The EU annual inflation rate was at 1,7% in January 2020, up from 1,6% in the previous month. A year earlier, it was 1,5%.
Inflation: lowest rates in January 2020, compared with January 2019.
0,4% 0,7% 0,8%
Italy Cyprus Denmark, Portugal
Inflation: highest rates in January 2020, compared with January 2019.
4,7% 3,9% 3,8%
Hungary Romania Czech Republic, Poland
0,25
0,35
0,45
0,55
0,65
0,75
Feb/17
Apr/17
Jun/17
Aug/17
Oct/17
Dec
/17
Feb/18
Apr/18
Jun/18
Aug/18
Oct/18
Dec
/18
Feb/19
Apr/19
Jun/19
Aug/19
Oct/19
Dec
/19
Feb/20
ItalyFranceSpainUK

European Market Observatory for
Fisheries and Aquaculture Products
MONTHLY HIGHLIGHTS | NO.3/2020
MACROECONOMIC CONTEXT
46
Table 13. HARMONISED INDEX OF CONSUMER PRICES IN THE EU (2015 = 100)
HICP Jan
2018 Jan
2019 Dec
2019 Jan
2020 Change from
Dec 2019 Change from
Jan 2019
Food and non-alcoholic beverages 103,99 105,46 107,26 108,10 Ç 0,8% Ç 2,5%
Fish and seafood 109,43 111,05 111,59 113,87 Ç 2,0% Ç 2,5% Source: Eurostat.
7.3. Exchange rates
Table 14. EXCHANGE RATES FOR SELECTED CURRENCIES
Currency Feb 2018 Feb 2019 Jan 2020 Feb 2020
NOK 9,6153 9,7268 10,1893 10,3888
JPY 130,72 126,44 120,35 119,36
USD 1,2214 1,1416 1,1052 1,0977 Source: European Central Bank.
In February 2020, the euro appreciated against the Norwegian krone (+2,0%) from January 2019. However, it depreciated against the Japanese yen (–0,8%) and the US dollar (–0,7%). For the past six months, the euro has fluctuated around 1,10 against the US dollar. Compared with February 2019, the euro has depreciated 5,6% against the Japanese yen and 3,8% against the US dollar, but it appreciated 6,8% against the Norwegian krone.
Figure 61. TREND OF EURO EXCHANGE RATES
Source: European Central Bank.
8,50
8,90
9,30
9,70
10,10
10,50
Feb/17
May
/17
Aug/17
Nov
/17
Feb/18
May
/18
Aug/18
Nov
/18
Feb/19
May
/19
Aug/19
Nov
/19
Feb/20
NOK
110
115
120
125
130
135
140
Feb/17
May
/17
Aug/17
Nov
/17
Feb/18
May
/18
Aug/18
Nov
/18
Feb/19
May
/19
Aug/19
Nov
/19
Feb/20
JPY
1,00
1,05
1,10
1,15
1,20
1,25
1,30Fe
b/17
May
/17
Aug/17
Nov
/17
Feb/18
May
/18
Aug/18
Nov
/18
Feb/19
May
/19
Aug/19
Nov
/19
Feb/20
USD

4
Manuscript completed in March 2020
Neither the European Commission nor any person acting on behalf of the Commission is responsible for the use that might be made of the following information.
Luxembourg: Publications Office of the European Union, 2020
© European Union, 2020
Reuse is authorised provided the source is acknowledged.
The reuse policy of European Commission documents is regulated by Decision 2011/833/EU (OJ L 330, 14.12.2011, p. 39).
Copyright for photographs: © EUROFISH, 2020, UK Fisheries Ltd.
For any use or reproduction of photos or other material that is not under the EU copyright, permission must be sought directly from the copyright holders.
PDF ISSN 2314–9671
FOR MORE INFORMATION AND COMMENTS:
Directorate-General for Maritime Affairs and Fisheries B-1049 BrusselsTel: +32 229-50101E-mail: [email protected]
This report has been compiled using EUMOFA data and the following sources:
First sales: The Council of European Union, European Commission, FAO, ICES, Marlin.ac.uk.
Consumption: EUROPANEL.
Case studies: European Commission, SINTEF, Norway Directorate of Fisheries, Sildelaget, regjeringen.no, ECB, Statistics Norway, Norwegian Seafood Council, The Marine Life Information Network, Inland Seafood, EU Council, Seafish, Marine Stewardship Council, FAO, Produits de la mer Magazine.
Global highlights: DG-Mare European Commission, Pewtrust.org, Statistics Iceland.
Macroeconomic context: EUROSTAT, Chamber of Commerce of Forlì-Cesena, Italy: DPMA, France: ARVI, Spain: MABUX, European Central Bank.
The underlying first-sales data is in a separate annex available on the EUMOFA website. Analyses are made at aggregated (main commercial species) level and according to the EU Electronic recording and reporting system (ERS).
In the context of this Monthly Highlight, analyses are led in current prices and expressed in nominal values.
The European Market Observatory for Fisheries and Aquaculture Products (EUMOFA) was developed by the European Commission, representing one of the tools of the new Market Policy in the framework of the reform of the Common Fisheries Policy. [Regulation (EU) No 1379/2013 art. 42].
As a market intelligence tool, EUMOFA provides regular weekly prices, monthly market trends, and annual structural data along the supply chain.
The database is based on data provided and validated by Member States and European institutions. It is available in 24 languages.
The EUMOFA website is publicly available at the following address: www.eumofa.eu.
EUMOFA Privacy Policy
KL-AK-20-003-EN-N