mgs4700 operations management - georgia state …dscgpz/mgs4700/chap2.pdf · mgs4700 operations...
TRANSCRIPT

Quality Management
MGS4700 Operations Management
Lecture 2
___________________________________
___________________________________
___________________________________
___________________________________
___________________________________
___________________________________
___________________________________
2
Lecture Outline
Meaning of Quality Total Quality Management and QMSQuality Improvement and Role of EmployeesRole of Employees in Quality ImprovementSix SigmaQuality in ServicesCost of QualityQuality Management and ProductivityQuality AwardsISO 9000
___________________________________
___________________________________
___________________________________
___________________________________
___________________________________
___________________________________
___________________________________
3
What Is Quality?
A degree or level of excellence(Oxford American Dictionary)
The totality of features and characteristics that satisfies given needs (ASQ definition)
Consumer’s and Producer’s Perspective
___________________________________
___________________________________
___________________________________
___________________________________
___________________________________
___________________________________
___________________________________
4
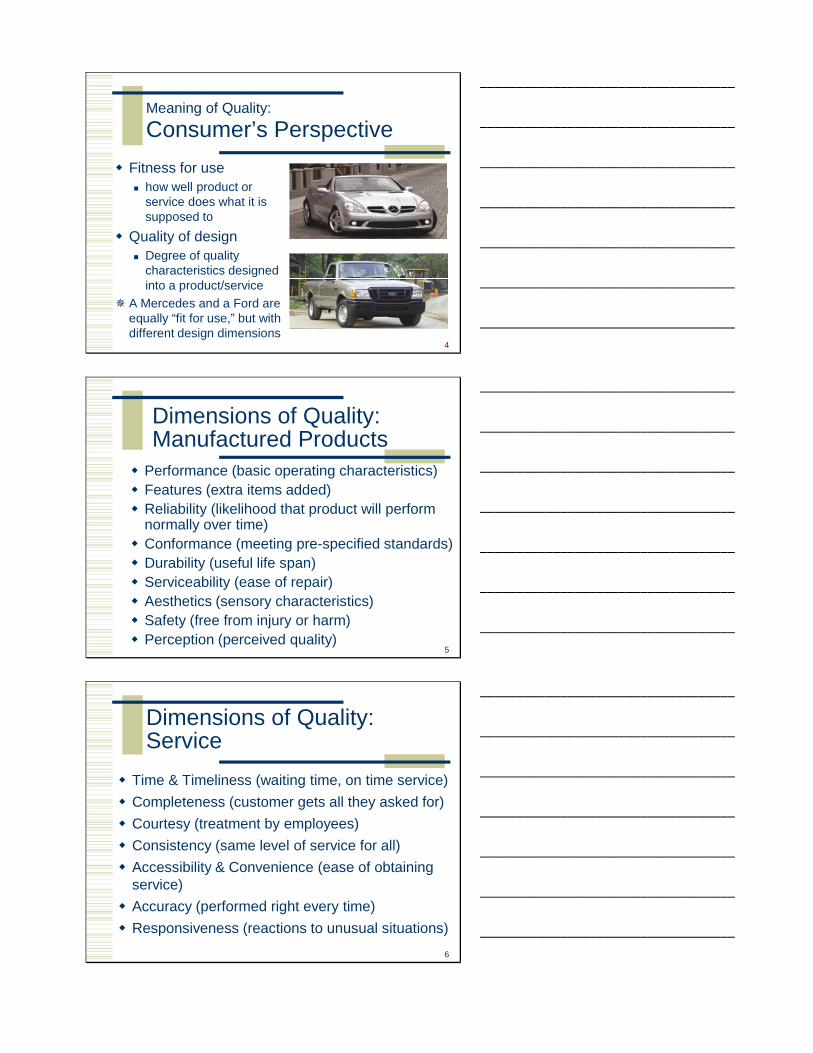
Meaning of Quality:Consumer’s Perspective
Fitness for usehow well product or service does what it is supposed to
Quality of designDegree of quality characteristics designed into a product/service
A Mercedes and a Ford are equally “fit for use,” but with different design dimensions
___________________________________
___________________________________
___________________________________
___________________________________
___________________________________
___________________________________
___________________________________
5
Dimensions of Quality:Manufactured Products
Performance (basic operating characteristics)Features (extra items added)Reliability (likelihood that product will perform normally over time)Conformance (meeting pre-specified standards)Durability (useful life span)Serviceability (ease of repair)Aesthetics (sensory characteristics)Safety (free from injury or harm)Perception (perceived quality)
___________________________________
___________________________________
___________________________________
___________________________________
___________________________________
___________________________________
___________________________________
6
Dimensions of Quality:Service
Time & Timeliness (waiting time, on time service)Completeness (customer gets all they asked for)Courtesy (treatment by employees)Consistency (same level of service for all)Accessibility & Convenience (ease of obtaining service)Accuracy (performed right every time)Responsiveness (reactions to unusual situations)
___________________________________
___________________________________
___________________________________
___________________________________
___________________________________
___________________________________
___________________________________

7
Meaning of Quality:
Producer’s Perspective
Quality of ConformanceMaking sure a product or service is produced according to design
if new tires do not conform to specifications, they wobbleif a hotel room is not clean when a guest checks in, the hotel is not functioning according to specifications of its design
___________________________________
___________________________________
___________________________________
___________________________________
___________________________________
___________________________________
___________________________________
8
Fitness forConsumer Use
Producer’s Perspective Consumer’s Perspective
Quality of Conformance
• Conformance to specifications
• Cost
Quality of Design
• Quality characteristics• Price
MarketingProduction
Meaning of Quality
Meaning of Quality:A Final Perspective
___________________________________
___________________________________
___________________________________
___________________________________
___________________________________
___________________________________
___________________________________
9
Total Quality Management (TQM)
Management of the entire organization
so that it excels on all dimensions of
products and services that are important
to the customer
___________________________________
___________________________________
___________________________________
___________________________________
___________________________________
___________________________________
___________________________________

10
Total Quality Management
Principles1. Customer-driven quality2. Top management leadership3. Quality as a strategic issue4. All employees responsible for quality5. Continuous improvement (CI)6. Shared problem solving7. Statistical quality control (SQC)8. Training & education for all employees
___________________________________
___________________________________
___________________________________
___________________________________
___________________________________
___________________________________
___________________________________
11
Total Quality Management
Quality GurusWalter Shewhart
In 1920s, developed control chartsKnown as the father of statistical quality control
W. Edwards DemingAfter war, taught Japanese the statistical quality control techniquesAdvocated continuous improvement via PDCAProposed famous 14 points for TQM
Joseph M. JuranFollowed Deming to Japan in 1954Focused on strategic quality planningPublished “Juran’s Quality Handbook”
___________________________________
___________________________________
___________________________________
___________________________________
___________________________________
___________________________________
___________________________________
12
Armand V. FeigenbaumPublished “Quality Control” and introduced concepts of total quality control and continuous quality improvement
Philip Crosby Published “Quality Is Free” and emphasized that costs of poor quality far outweigh the cost of preventionEmphasized conformance to requirements, prevention, and “zero defects”
Kaoru IshikawaPromoted use of quality circlesDeveloped “fishbone” diagram Emphasized importance of internal customer
Total Quality Management
Quality Gurus (cont.)
___________________________________
___________________________________
___________________________________
___________________________________
___________________________________
___________________________________
___________________________________

13
Total Quality Management
Deming Wheel: PDCA Cycle
1. PlanIdentify problem and develop a plan for improvement.
2. DoImplement plan on a test basis.
3. Study/CheckAssess plan; is it working?
4. ActInstitutionalize improvement; continue cycle.
___________________________________
___________________________________
___________________________________
___________________________________
___________________________________
___________________________________
___________________________________
14
Total Quality Management
Deming’s 14 Points
1. Create constancy of purpose2. Adopt philosophy of prevention3. Cease mass inspection4. Select a few suppliers based on quality5. Constantly improve system and workers6. Institute worker training7. Instill leadership among supervisors
___________________________________
___________________________________
___________________________________
___________________________________
___________________________________
___________________________________
___________________________________
15
8. Eliminate fear among employees9. Eliminate barriers between departments10. Eliminate slogans11. Remove numerical quotas12. Enhance worker pride13. Institute vigorous training and education
programs14. Develop a commitment from top management to
implement above 13 points
Total Quality Management
Deming’s 14 Points (cont.)
___________________________________
___________________________________
___________________________________
___________________________________
___________________________________
___________________________________
___________________________________
16
Quality Improvement and Role of Employees
Participative problem solving
every employee has undergone extensive training to provide quality service to Disney’s guests
Kaizeninvolves everyone in process of continuous improvement
___________________________________
___________________________________
___________________________________
___________________________________
___________________________________
___________________________________
___________________________________
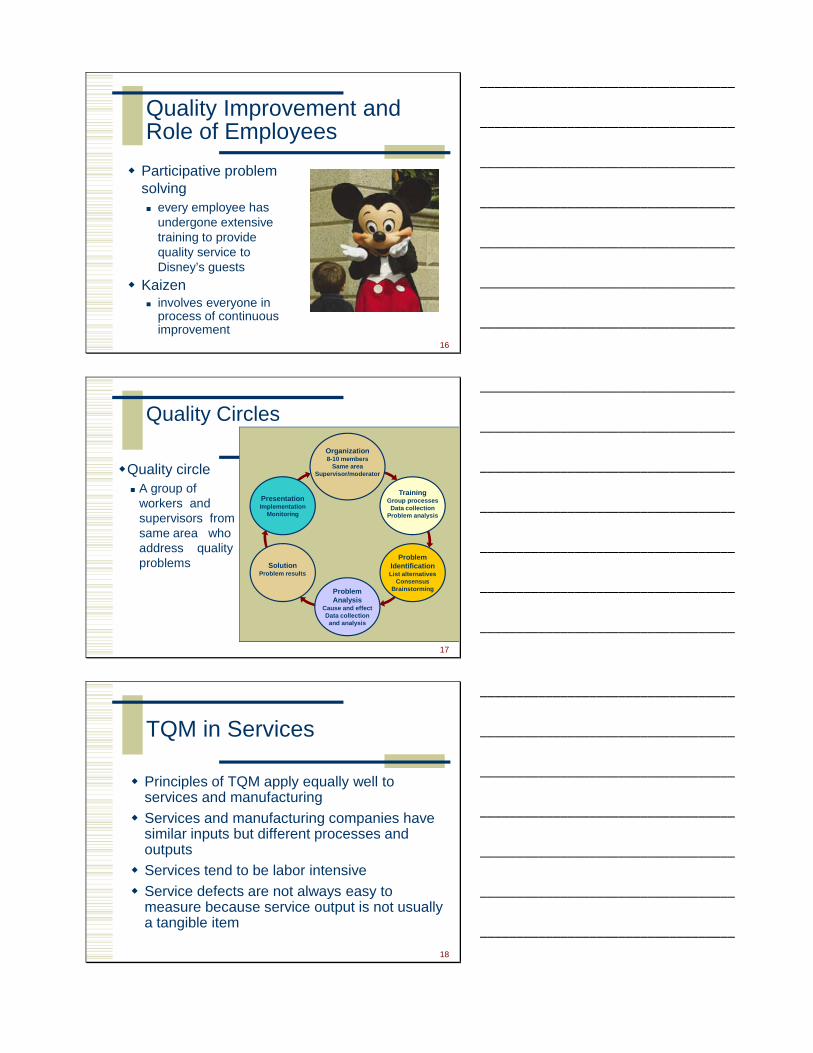
Quality circleA group of workers and supervisors from same area who address quality problems
PresentationImplementation
Monitoring
SolutionProblem results
Problem Analysis
Cause and effectData collection
and analysis
Problem IdentificationList alternatives
ConsensusBrainstorming
TrainingGroup processes
Data collectionProblem analysis
Organization8-10 members
Same areaSupervisor/moderator
Quality Circles
17
___________________________________
___________________________________
___________________________________
___________________________________
___________________________________
___________________________________
___________________________________
18
TQM in Services
Principles of TQM apply equally well to services and manufacturingServices and manufacturing companies have similar inputs but different processes and outputsServices tend to be labor intensiveService defects are not always easy to measure because service output is not usually a tangible item
___________________________________
___________________________________
___________________________________
___________________________________
___________________________________
___________________________________
___________________________________

19
Six Sigma
A process for developing and delivering near perfect products and servicesMeasure of how much a process deviates from perfectionSix-Sigma = 3.4 defects per million opportunities (DPMO)
___________________________________
___________________________________
___________________________________
___________________________________
___________________________________
___________________________________
___________________________________
Copyright 2009 John Wiley & Sons, Inc.2-20
3.4 DPMO
67,000 DPMOcost = 25% of
sales
DEFINE CONTROLIMPROVEANALYZEMEASURE
Six Sigma Methodology—
DMAIC
___________________________________
___________________________________
___________________________________
___________________________________
___________________________________
___________________________________
___________________________________
21
People Involved in Six-Sigma Projects
Black Belts and Green BeltsChampion
an executive responsible for project success
Black Beltproject leader
Master Black Belta teacher and mentor for Black Belts
Green Beltsproject team members
___________________________________
___________________________________
___________________________________
___________________________________
___________________________________
___________________________________
___________________________________

22
Cost of Quality
Cost of achieving good qualityPrevention (quality planning and training, identify and removing poor quality source) Appraisal (inspection, testing)
Cost of poor qualityInternal failure costs (scrap, rework, repair)External failure costs (returned products, warranty charges, complaints, liability)
___________________________________
___________________________________
___________________________________
___________________________________
___________________________________
___________________________________
___________________________________
23
Quality–Cost Relationship
Quality is FreeCost of doing things wrong (20 to 35% of revenues)Cost of doing things right (3 to 4% of revenues)Profitability
In the long run, quality is free
In general, when the cost of achieving good quality increases, the cost of poor quality declines.Increased prevention costs lead to decreased failure costs.Improved quality leads to increased sales and market share.Higher quality products can command higher prices.
___________________________________
___________________________________
___________________________________
___________________________________
___________________________________
___________________________________
___________________________________
24
Quality Impact on ProductivityFewer defects increase output and quality improvement reduces inputsYield: a measure of productivity
Yield=(total input)(% good units)
+ (total input)(1-%good units)(% reworked)
Y=(I)(%G)+(I)(1-%G)(%R)
___________________________________
___________________________________
___________________________________
___________________________________
___________________________________
___________________________________
___________________________________

Yield Illustration
25
I Production Process
%G
(I)(%G)
(I)(1-%G) ReworkProcess
%R
(I)(1-%G)(%R)
Yield (Y)
+
___________________________________
___________________________________
___________________________________
___________________________________
___________________________________
___________________________________
___________________________________
26
Product Yield
ExampleThe Colonial House Furniture Company manufactures two-drawer oak file cabinets that are sold unassembled through catalogs. The company initiates production of 150 cabinet packages each week. The percentage of good-quality cabinets average 83 percent per week, and the percentage of poor-quality cabinets that can be reworked is 60%.
a. Determine the weekly product yield of file cabinets.b. If the company desires a product yield of 145 units
per week, what increase in the percentage of good-quality products must result?
___________________________________
___________________________________
___________________________________
___________________________________
___________________________________
___________________________________
___________________________________
27
a. Yield = (total input) (% good units) + (total input)(1 - % good units)(% reworked)
= 150 x 83% + 150 x (1 – 83%) x 60%= 139.8 file cabinets
b. Yield = (total input) (% good units) + (total input)(1 - % good units)(% reworked)
145 = 150 x G + 150 x (1 – G) x 60%Thus, G = 91.67%
Product Yield
Example
___________________________________
___________________________________
___________________________________
___________________________________
___________________________________
___________________________________
___________________________________

28
Product Cost Per Unit
YRKIK rd ))(())(( +
=Product Cost
where:Kd = direct manufacturing cost per unitI = inputKr = rework cost per unitR = reworked unitsY = yield
___________________________________
___________________________________
___________________________________
___________________________________
___________________________________
___________________________________
___________________________________
29
Example of Product Cost
In the last example, if the direct manufacturing cost for cabinets is $27 and the rework cost is $8, compute the manufacturing cost per good product.
Product cost =
(direct manufacturing cost per unit)(input) + (rework cost per unit)(reworked units)
yield
=27 x 150 + 8 x 15
139.8= $29.8
___________________________________
___________________________________
___________________________________
___________________________________
___________________________________
___________________________________
___________________________________
30
Product Yield and Product Cost
In-Class Exercise
A manufacturing company has a weekly production plan of 1700 units. The average percentage of good-quality products is 85%. Of the poor-quality products, 75% can be reworked and sold as good-quality products. a. Determine the weekly product yield.b. If the direct manufacturing cost for the products is $30 and the rework cost is $10, compute the manufacturing cost per-good product.
___________________________________
___________________________________
___________________________________
___________________________________
___________________________________
___________________________________
___________________________________

31
Computing ProductYield for Multistage Processes
Y = (I)(%g1)(%g2) … (%gn)
where:I = input of items to the production process that will result in finished productsgi = good-quality, work-in-process products at stage i
1 2 n…I Y
___________________________________
___________________________________
___________________________________
___________________________________
___________________________________
___________________________________
___________________________________
32
Example of the Yield for a Process
The colonial House Furniture Company manufactures four-drawer oak filing cabinets in six stages. In the first stage, the boards forming the walls of the cabinet are cut; in the second stage the front drawer panels are wood-worked; in the third stage the boards are sanded and finished; in the fourth stage the boards are cleaned, stained, and painted with a clear finish; in the fifth stage the hardware for pulls, runners, and fittings is installed; and in the final stage the cabinets are assembled. Inspection occurs at each stage of the process, and the average percentages of good-quality units are given in the following table.
___________________________________
___________________________________
___________________________________
___________________________________
___________________________________
___________________________________
___________________________________
The cabinets are produced in weekly production runs with a product input for 300 units. Determine the weekly product yield of good-quality cabinets.
Stage Average PercentageGood Quality
1 87%2 91%3 94%4 93%5 93%6 96%
Example of Process Yield
Y = (I) (%g1)(%g2)...(%gn)=300 x 87% x 91% x 94% x 93% x 93% x 96%= 185 cabinets
___________________________________
___________________________________
___________________________________
___________________________________
___________________________________
___________________________________
___________________________________

34
Quality–Productivity Ratio
QPRproductivity index that includes productivity and quality costs
QPR =(good quality units)
(input) (processing cost) + (defective units) (reworked cost)
___________________________________
___________________________________
___________________________________
___________________________________
___________________________________
___________________________________
___________________________________
Example of the Quality-Productivity Ratio
QPR = (100)Good-quality units
(input)(processing cost) + (defective units)(rework cost)
The total processing cost for producing the X-Pacer running shoe is $18. The Omega Shoe Company starts production of 650 pairs of the shoes weekly, and the average weekly yield is 90%, with 10% defective shoes. One quarter of the defective shoes can be reworked at a cost of $3.75. Compute the quality productivity ratio.
= (100)650x 90% + 650x10%/4
650 x 18 + 650x10%/4 x3.75= 5.11
___________________________________
___________________________________
___________________________________
___________________________________
___________________________________
___________________________________
___________________________________
36
Quality Tools
1. Pareto analysis2. Process flowcharts3. Check sheets4. Histograms5. Scatter diagrams6. Control charts7. Cause & effect diagrams
___________________________________
___________________________________
___________________________________
___________________________________
___________________________________
___________________________________
___________________________________

37
Poor design 80 64Wrong part dimensions 16 13Defective parts 12 10Incorrect machine calibration 7 6Operator errors 4 3Defective material 3 2Surface abrasions 3 2
125 100 %
NUMBER OFCAUSE DEFECTS %
Seven Quality Control Tools:
1.Pareto Analysis
Perc
ent f
rom
eac
h ca
use
Causes of poor quality
0
10
20
30
40
50
60
70
(64)
(13) (10)(6) (3) (2) (2)
___________________________________
___________________________________
___________________________________
___________________________________
___________________________________
___________________________________
___________________________________
38
Seven Quality Control Tools:
2.Flow Chart
Operation DecisionStart/ Finish
Start/ Finish
Operation
OperationOperation
Operation
Decision
___________________________________
___________________________________
___________________________________
___________________________________
___________________________________
___________________________________
___________________________________
39
Seven Quality Control Tools:
3.Check SheetCOMPONENTS REPLACED BY LABTIME PERIOD: 22 Feb to 27 Feb 2005REPAIR TECHNICIAN: Bob
TV SET MODEL 1013
Integrated Circuits ||||Capacitors |||| |||| |||| |||| |||| ||Resistors ||Transformers ||||CommandsCRT |
___________________________________
___________________________________
___________________________________
___________________________________
___________________________________
___________________________________
___________________________________

40
Seven Quality Control Tools:
4.Histogram
0
5
10
15
20
1 2 6 13 10 16 19 17 12 16 2017 13 5 6 2 1
___________________________________
___________________________________
___________________________________
___________________________________
___________________________________
___________________________________
___________________________________
41
Seven Quality Control Tools:
5.Scatter DiagramY
X
___________________________________
___________________________________
___________________________________
___________________________________
___________________________________
___________________________________
___________________________________
42
Seven Quality Control Tools:
6.Control Chart
18
12
6
3
9
15
21
24
2 4 6 8 10 12 14 16Sample number
Num
ber o
f def
ects
UCL = 23.35
LCL = 1.99
c = 12.67
___________________________________
___________________________________
___________________________________
___________________________________
___________________________________
___________________________________
___________________________________

43
Seven Quality Control Tools:
7.Cause-and-Effect Diagram
QualityProblem
Out of adjustment
Tooling problems
Old / worn
MachinesFaultytesting equipment
Incorrect specifications
Improper methods
Measurement
Poor supervision
Lack of concentration
Inadequate training
Human
Deficienciesin product design
Ineffective qualitymanagement
Poor process design
Process
Inaccuratetemperature control
Dust and Dirt
Environment
Defective from vendor
Not to specifications
Material-handling problems
Materials
___________________________________
___________________________________
___________________________________
___________________________________
___________________________________
___________________________________
___________________________________
44
Quality Awards
The Malcolm Baldrige National Quality Award (USA, since 1987)
www.quality.nist.gov
The Deming Prize (Japan, since 1951)
www.deming.org
___________________________________
___________________________________
___________________________________
___________________________________
___________________________________
___________________________________
___________________________________
45
ISO 9000
A set of procedures and policies for international quality certification of suppliersStandards
ISO 9000:2000ISO 9001:2000ISO 9004:2000
ImplicationsRequirement for overseas businessISO 9000 accreditationA total commitment to quality is required throughout an organization
___________________________________
___________________________________
___________________________________
___________________________________
___________________________________
___________________________________
___________________________________