mgs4700 operations management - georgia state …dscgpz/mgs4700/chap13.pdf · mgs4700 operations...
TRANSCRIPT

Inventory Management
MGS4700 Operations Management
Lecture 9
___________________________________
___________________________________
___________________________________
___________________________________
___________________________________
___________________________________
___________________________________
2
Lecture Outline
Elements of Inventory ManagementInventory Control Systems
Continuous Inventory SystemsPeriodic Inventory SystemsSingle Period Model for Yield Management
___________________________________
___________________________________
___________________________________
___________________________________
___________________________________
___________________________________
___________________________________
3
Elements of Inventory Management
1. What is inventory?
2. Customer demand
3. Why do we hold inventory?
4. Inventory Costs
___________________________________
___________________________________
___________________________________
___________________________________
___________________________________
___________________________________
___________________________________

4
Elements of Inventory Management
What Is Inventory?
DefinitionStock of items held to meet future demands/needs
Types of InventoryRaw materials, component parts
Work in process
Finished products
Supplies
Op 1 Op 2RMI WIP FGI
___________________________________
___________________________________
___________________________________
___________________________________
___________________________________
___________________________________
___________________________________
5
Elements of Inventory Management
Customer Demand
Inventory exists to meet customer demands. The demand can be either dependent or independent.
Dependent demand (internal demand) items: used internally to produce a final product (Ex. Tires)Independent demand (external demand) items: final products demanded by external customers (Ex. Cars)
Op 1 Op 2RMI WIP FGI
___________________________________
___________________________________
___________________________________
___________________________________
___________________________________
___________________________________
___________________________________
6
Raw Material Inventory
To take advantage of scale economy in purchasing
price discount of large ordertransportation and other fixed order cost
To safeguard variations in supplier deliveries
Op 1 Op 2RMI WIP FGI
Why do we hold inventory?
Suppliers
___________________________________
___________________________________
___________________________________
___________________________________
___________________________________
___________________________________
___________________________________

7
Work in Progress
To maintain independence of operationsProduction can continue smoothly and avoid work stoppages in the case of machine breakdowns or uneven operation times
To have large batch size
Op 1 Op 2RMI
WIPFGI
Why do we hold inventory?
___________________________________
___________________________________
___________________________________
___________________________________
___________________________________
___________________________________
___________________________________
8
Finished Goods Inventory
To meet demand immediately and no wait To reduce risk of stock-out in an uncertain environmentTo smooth the production if the demand is seasonal or cyclical
Op 1 Op 2RMI WIP FGI
Why do we hold inventory?
___________________________________
___________________________________
___________________________________
___________________________________
___________________________________
___________________________________
___________________________________
9
Elements of Inventory Management
Inventory CostsCarrying (or holding ) costs
Storage cost (space, utilities, personnel)Opportunity cost of capitalInsurance, taxes, possible loss of value
Ordering or Setup (production change) costsOrder processing costTransportation and receiving cost
Shortage (or stockout) costsBackorder related cost (tracking, rush shipment) Lost sales/profit
___________________________________
___________________________________
___________________________________
___________________________________
___________________________________
___________________________________
___________________________________
10
Objective of Inventory Management
Minimizing the sum of the inventory carrying, ordering and shortage costs by determining:
the type of inventory control system to usehow much to order when to order
___________________________________
___________________________________
___________________________________
___________________________________
___________________________________
___________________________________
___________________________________
11
Inventory Control Systems
Multi-Period Inventory SystemsContinuous (fixed-order-quantity) system
A continual record of the inventory level for every item is maintainedA constant amount is ordered when inventory declines to a predetermined level
Periodic (fixed-time-period) system The inventory on hand is counted at specific time intervals An order is placed for a variable amount after a fixed passage of time
Single-Period Inventory SystemsInventory used only for one-period (Example: special t-shirts at a football game)
___________________________________
___________________________________
___________________________________
___________________________________
___________________________________
___________________________________
___________________________________
12
How to Classify Inventory?−The ABC Classification System
___________________________________
___________________________________
___________________________________
___________________________________
___________________________________
___________________________________
___________________________________

13
Annual $ valueof items
A
BC
High
Low
Few Many
The ABC Classification System
Classifying inventory according to some measure of importance and allocating control efforts accordingly.
A - very important
B - mod. important
C - least important
Number of Items
___________________________________
___________________________________
___________________________________
___________________________________
___________________________________
___________________________________
___________________________________
14
ABC Classification
Class Aabout 5-15 % of units with 70-80% of valuerequires very tight control, complete and accurate records
Class Babout 30% of units with 15% of valuerequires less attention than A items, and good records
Class Cabout 50-60 % of units with 5-10% of valuerequires least control, and minimal records
___________________________________
___________________________________
___________________________________
___________________________________
___________________________________
___________________________________
___________________________________
15
ABC Classification
Example
1 $ 60 902 350 403 30 1304 80 605 30 1006 20 1807 10 1708 320 509 510 60
10 20 120
PART UNIT COST ANNUAL USAGE (Demand)
___________________________________
___________________________________
___________________________________
___________________________________
___________________________________
___________________________________
___________________________________

16
1 $ 60 90 $5,400 2 350 40 $14,0003 30 130 $3,9004 80 60 $4,8005 30 100 $3,0006 20 180 $3,6007 10 170 $1,7008 320 50 $16,0009 510 60 $30,600
10 20 120 $2,400
PART UNIT COST ANNUAL USAGE TOTAL VALUE
ABC Classification Example
1. Calculate the Value of Each Item
___________________________________
___________________________________
___________________________________
___________________________________
___________________________________
___________________________________
___________________________________
17
ABC Classification Example
2. Rank with Total Value (High to Low)
TOTAL ANNUALPART VALUE USAGE
9 $30,600 608 16,000 502 14,000 401 5,400 904 4,800 603 3,900 1306 3,600 1805 3,000 100
10 2,400 1207 1,700 170
$85,400 1,000
___________________________________
___________________________________
___________________________________
___________________________________
___________________________________
___________________________________
___________________________________
18
TOTAL % OF TOTAL % OF TOTALPART VALUE VALUE %CUM. VAL. QUANTITY % CUM.QNT.
9 $30,600 35.9 35.9 6.0 6.08 16,000 18.7 54.6 5.0 11.02 14,000 16.4 71.0 4.0 15.01 5,400 6.3 77.3 9.0 24.04 4,800 5.6 82.9 6.0 30.03 3,900 4.6 87.5 13.0 43.06 3,600 4.2 91.7 18.0 61.05 3,000 3.5 95.2 10.0 71.0
10 2,400 2.8 98.0 12.0 83.07 1,700 2.0 100.0 17.0 100.0
$85,400
ABC Classification Example
3. Compute Percentage Value and Percentage Quantity
___________________________________
___________________________________
___________________________________
___________________________________
___________________________________
___________________________________
___________________________________

19
TOTAL % OF TOTAL %CUM. % OF TOTAL % CUM.PART VALUE VALUE VAL. QUANTITY QNT.
9 $30,600 35.9 35.9 6.0 6.08 16,000 18.7 54.6 5.0 11.02 14,000 16.4 71.0 4.0 15.01 5,400 6.3 77.3 9.0 24.04 4,800 5.6 82.9 6.0 30.03 3,900 4.6 87.5 13.0 43.06 3,600 4.2 91.7 18.0 61.05 3,000 3.5 95.2 10.0 71.0
10 2,400 2.8 98.0 12.0 83.07 1,700 2.0 100.0 17.0 100.0
$85,400
ABC Classification Example
4. Classify the Items
A
B
C
%UNITS %DOLLARSA 5 - 15 70 - 80B 30 15C 50 - 60 5 - 10
___________________________________
___________________________________
___________________________________
___________________________________
___________________________________
___________________________________
___________________________________
20
ABC Classification Example
Summary
% OF TOTAL % OF TOTALCLASS ITEMS VALUE QUANTITY
A 9, 8, 2 71.0 15.0B 1, 4, 3 16.5 28.0C 6, 5, 10, 7 12.5 57.0
___________________________________
___________________________________
___________________________________
___________________________________
___________________________________
___________________________________
___________________________________
21
Assumptions of the Basic Economic Order Quantity (EOQ) Model
Demand is known with certainty and is constant over timeNo shortages are allowedLead time for the receipt of orders is constantThe order quantity is received all at oncePurchase price is constant
Continuous Inventory Systems
Economic Order Quantity Models
___________________________________
___________________________________
___________________________________
___________________________________
___________________________________
___________________________________
___________________________________

22
The Basic EOQ Model
Demand rate
TimeLead time
Lead time
Order placed
Order placed
Order receipt
Order receipt
Inve
ntor
y Le
vel
Reorder point, R
Order quantity, Q
0
___________________________________
___________________________________
___________________________________
___________________________________
___________________________________
___________________________________
___________________________________
23
The Basic EOQ Model
If annual demand is D, order quantity is Q, thenAverage Inventory = Q/2Number of Orders per year = D/QThe Order Cycle Time = Time between 2 orders = Q/D(D * CT =Q CT=Q/D)
time
inve
ntor
y
Q
0Order CT
D
___________________________________
___________________________________
___________________________________
___________________________________
___________________________________
___________________________________
___________________________________
24
The Basic EOQ Model
Model Development
Co - cost of placing one order D - annual demandCc - annual per-unit carrying cost Q - order quantity
Annual ordering cost = (# orders)×(cost/order) =DQ
Annual carrying cost = (avg. inventory)×(unit cost) =Q2
Total cost = +CoDQ
CcQ2
Co
Cc
___________________________________
___________________________________
___________________________________
___________________________________
___________________________________
___________________________________
___________________________________
25
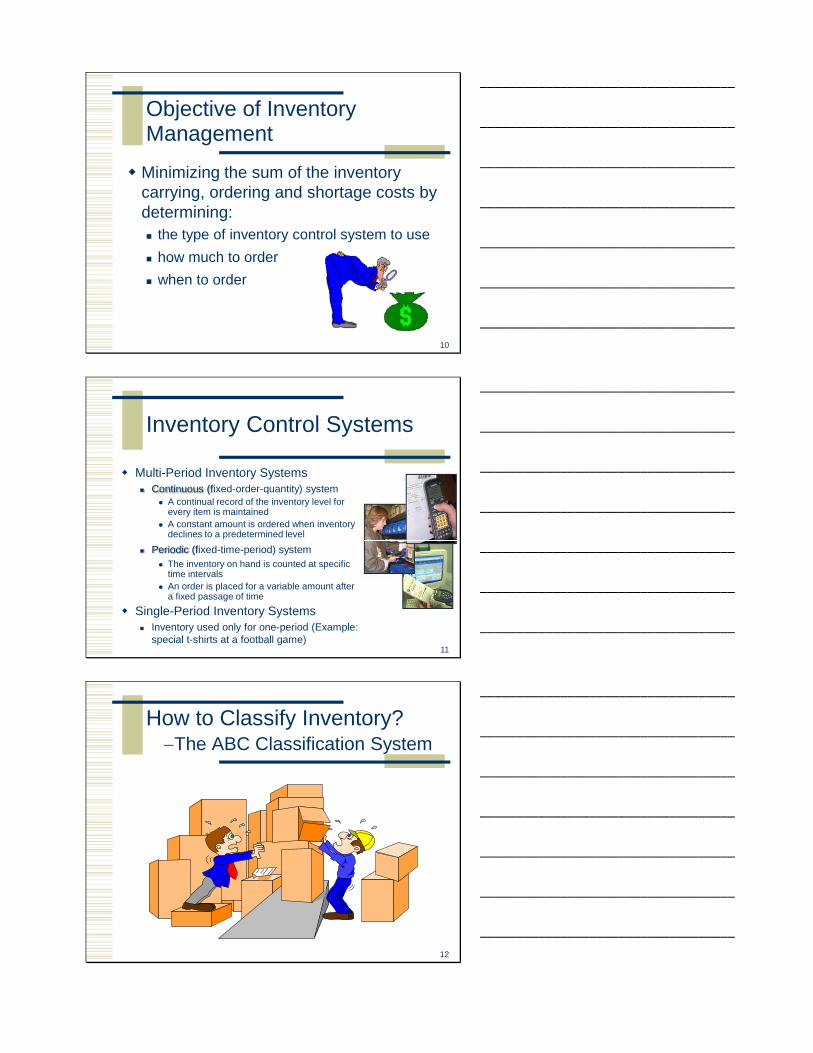
The Basic EOQ Model
Cost Function Illustrations
Slope = 0Total Cost
Order Quantity, Q
Annual cost ($)
Minimum total cost
Optimal orderQopt
Carrying Cost =CcQ
2
Ordering Cost =CoDQ
___________________________________
___________________________________
___________________________________
___________________________________
___________________________________
___________________________________
___________________________________
26
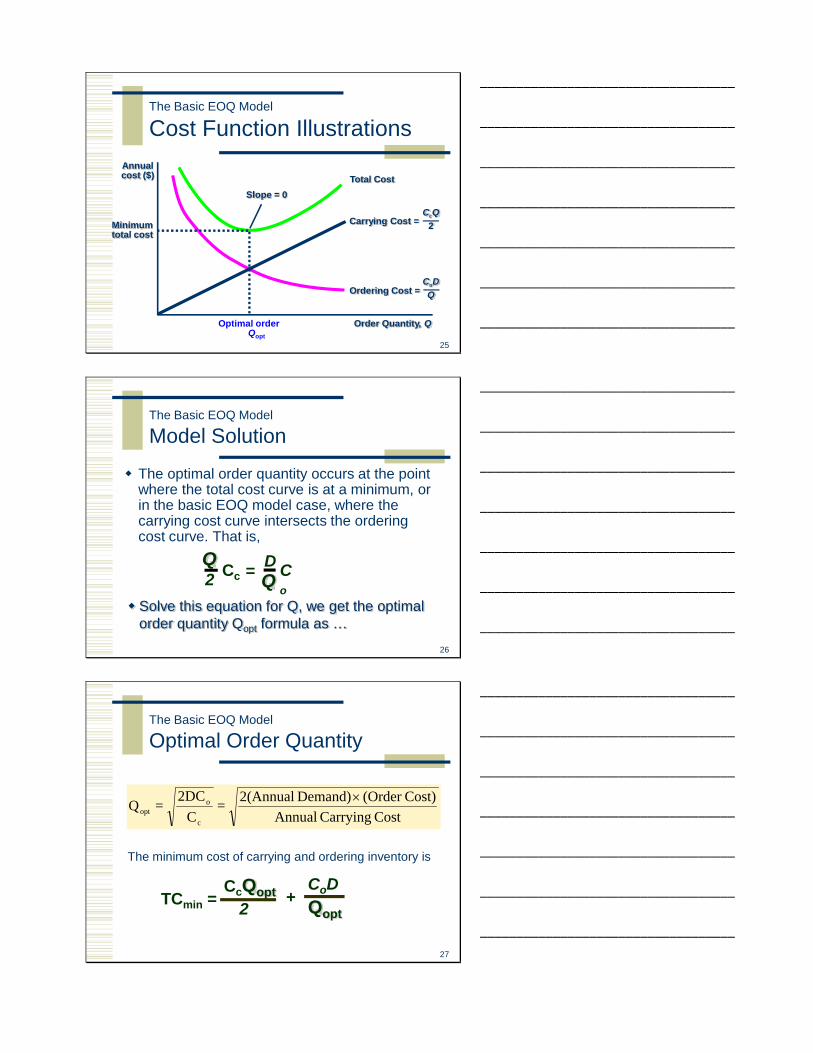
The optimal order quantity occurs at the point where the total cost curve is at a minimum, or in the basic EOQ model case, where the carrying cost curve intersects the ordering cost curve. That is,
Q2 Cc
DQ C
o=
The Basic EOQ Model
Model Solution
Solve this equation for Q, we get the optimal order quantity Qopt formula as …
___________________________________
___________________________________
___________________________________
___________________________________
___________________________________
___________________________________
___________________________________
27
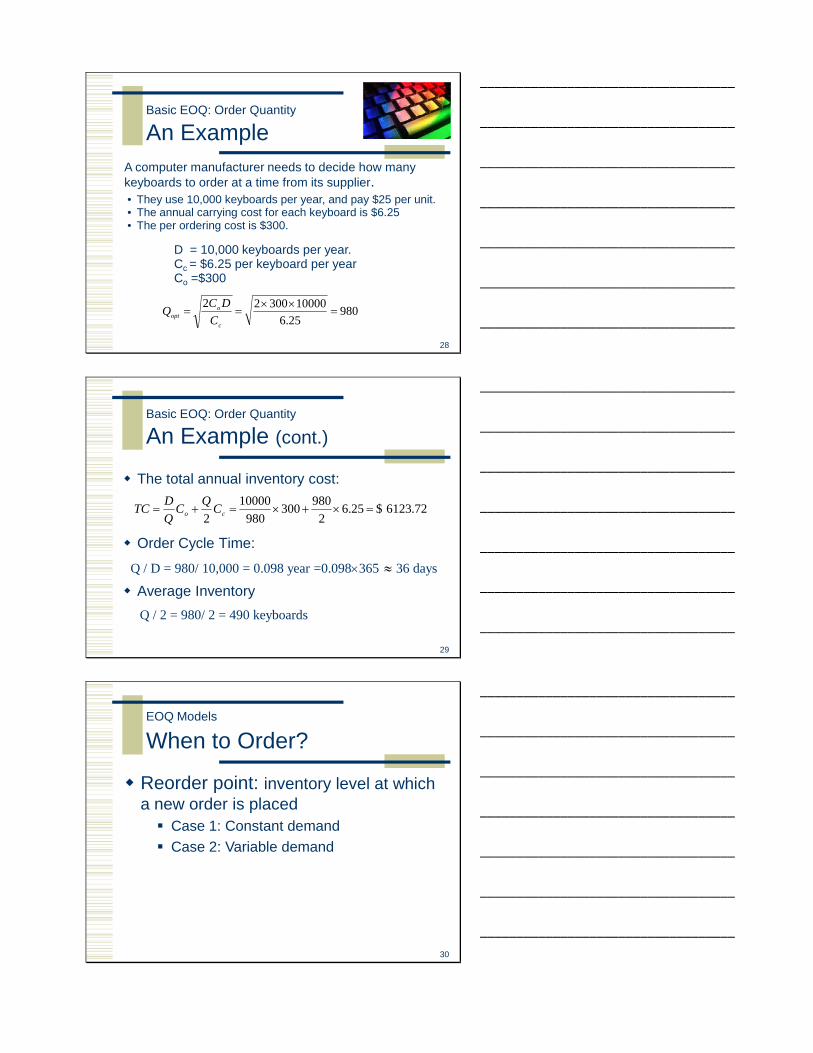
Cost Carrying AnnualCost)(Order Demand) 2(Annual =
C2DC = Q
c
oopt
×
The minimum cost of carrying and ordering inventory is
The Basic EOQ Model
Optimal Order Quantity
CcQopt2
CoDQopt
TCmin = +
___________________________________
___________________________________
___________________________________
___________________________________
___________________________________
___________________________________
___________________________________
28
Basic EOQ: Order Quantity
An Example
98025.6
1000030022=
××==
c
oopt C
DCQ
• They use 10,000 keyboards per year, and pay $25 per unit. • The annual carrying cost for each keyboard is $6.25• The per ordering cost is $300.
D = 10,000 keyboards per year.Cc = $6.25 per keyboard per yearCo =$300
A computer manufacturer needs to decide how many keyboards to order at a time from its supplier.
___________________________________
___________________________________
___________________________________
___________________________________
___________________________________
___________________________________
___________________________________
29
The total annual inventory cost:
Order Cycle Time:
Average Inventory
72.6123$25.62
980300980
100002
=×+×=+= co CQCQDTC
Q / D = 980/ 10,000 = 0.098 year =0.098×365 36 days
Q / 2 = 980/ 2 = 490 keyboards
≈
Basic EOQ: Order Quantity
An Example (cont.)
___________________________________
___________________________________
___________________________________
___________________________________
___________________________________
___________________________________
___________________________________
30
Reorder point: inventory level at which a new order is placed
Case 1: Constant demandCase 2: Variable demand
EOQ Models
When to Order?
___________________________________
___________________________________
___________________________________
___________________________________
___________________________________
___________________________________
___________________________________

31
Reorder Point
Case 1: Constant DemandR = Lead time demand = dLwhere d = demand rate per period, L = Lead time
Demand rate
TimeLead time
Lead timeOrder
placedOrder placed
Order receipt
Order receipt
Inve
ntor
y Le
vel
Reorder point, R
Order quantity, Q
0
___________________________________
___________________________________
___________________________________
___________________________________
___________________________________
___________________________________
___________________________________
32
Reorder Point
Example
D = 10,000 keyboards per year.Cc = $6.25 per keyboard per yearCo =$300 / order
The computer manufacturer needs to decide how many keyboards to order at a time from its supplier.
980=CDC2
=Qc
oopt
If the delivery lead time is 7 days, what is the reorder point?
R = dL = 10,000/365 units/day × 7 days= 192 keyboards
Inventory Control Policy: When the inventory level drops to 192 keyboards, order 980 units.
___________________________________
___________________________________
___________________________________
___________________________________
___________________________________
___________________________________
___________________________________
33
EOQ Models
EOQ with Variable DemandWhen demand is variable (uncertain), shortage (stockout) is possible Shortage can only occur during the lead timeSafety stock is often used to reduce the risk of stockout
Safety stock is the additional inventory held above the expected demandService level is often used to determine safety stock
The probability that the inventory available during lead time will meet demand
___________________________________
___________________________________
___________________________________
___________________________________
___________________________________
___________________________________
___________________________________
34
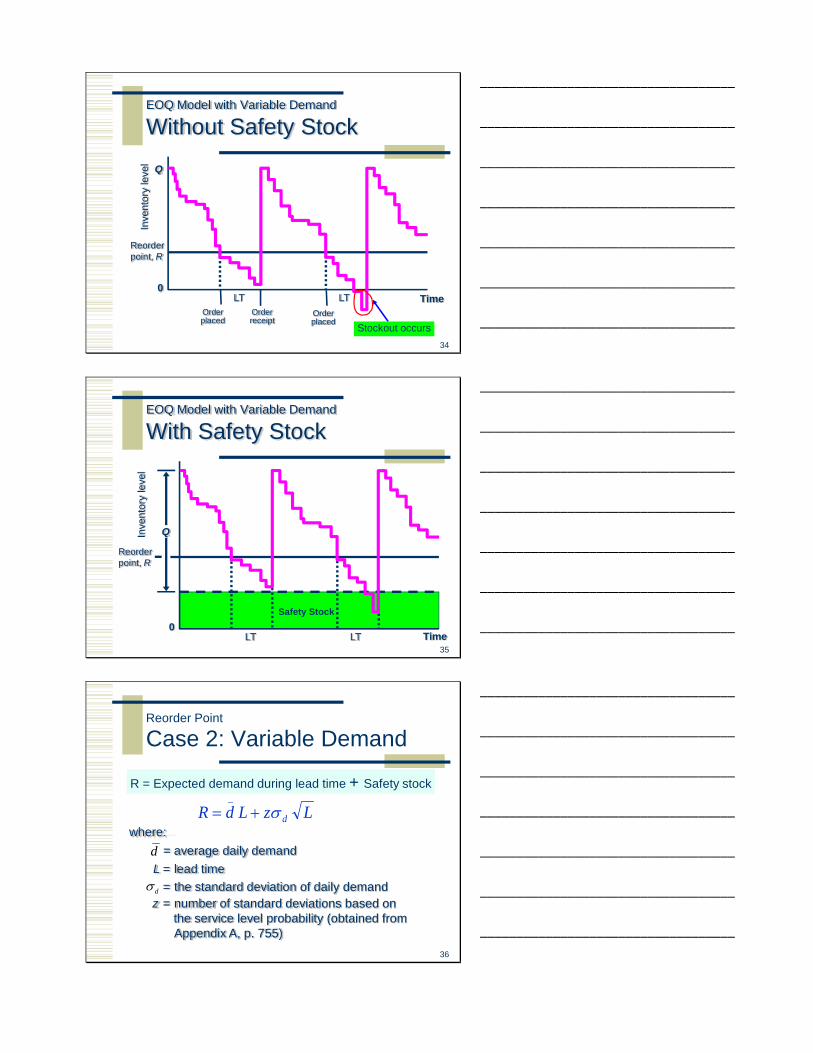
EOQ Model with Variable Demand
Without Safety Stock
Reorderpoint, R
Q
LT TimeLT
Inve
ntor
y le
vel
0
Stockout occursOrder placed
Order receipt
Order placed
___________________________________
___________________________________
___________________________________
___________________________________
___________________________________
___________________________________
___________________________________
35
Reorderpoint, R
Q
LT TimeLT
Inve
ntor
y le
vel
0Safety Stock
EOQ Model with Variable Demand
With Safety Stock
___________________________________
___________________________________
___________________________________
___________________________________
___________________________________
___________________________________
___________________________________
36
where:= average daily demand
L = lead time= the standard deviation of daily demand
z = number of standard deviations based on the service level probability (obtained from Appendix A, p. 755)
Reorder Point
Case 2: Variable Demand
LzLdR dσ+=_
d
dσ
R = Expected demand during lead time + Safety stock
___________________________________
___________________________________
___________________________________
___________________________________
___________________________________
___________________________________
___________________________________
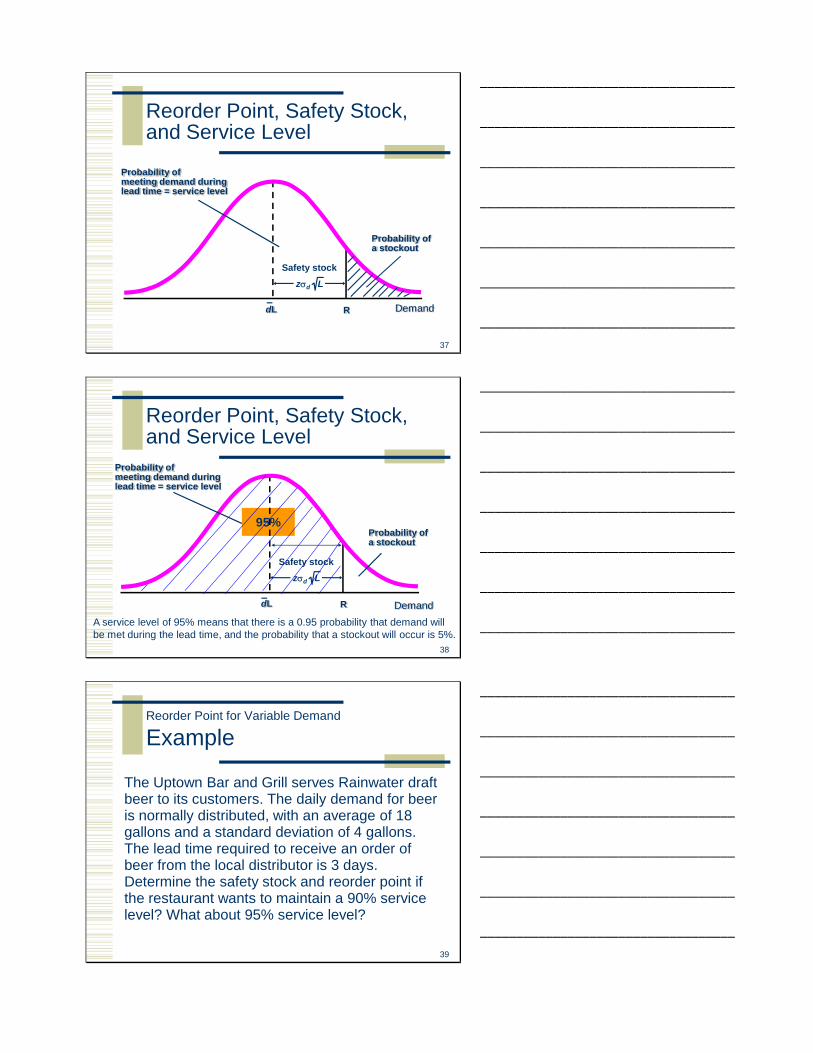
37
Reorder Point, Safety Stock, and Service Level
Probability of meeting demand during lead time = service level
Probability of a stockout
R
Safety stock
dL
zσd L
Demand
___________________________________
___________________________________
___________________________________
___________________________________
___________________________________
___________________________________
___________________________________
38
A service level of 95% means that there is a 0.95 probability that demand will be met during the lead time, and the probability that a stockout will occur is 5%.
95%
Probability of meeting demand during lead time = service level
Probability of a stockout
R
Safety stock
dL
zσd L
Demand
Reorder Point, Safety Stock, and Service Level
___________________________________
___________________________________
___________________________________
___________________________________
___________________________________
___________________________________
___________________________________
39
Reorder Point for Variable Demand
Example
The Uptown Bar and Grill serves Rainwater draft beer to its customers. The daily demand for beer is normally distributed, with an average of 18 gallons and a standard deviation of 4 gallons. The lead time required to receive an order of beer from the local distributor is 3 days. Determine the safety stock and reorder point if the restaurant wants to maintain a 90% service level? What about 95% service level?
___________________________________
___________________________________
___________________________________
___________________________________
___________________________________
___________________________________
___________________________________

40
Average daily demand: = 18 gallonsLead time: L = 3 daysThe standard deviation of daily demand: = 4 gallonsService level = 90%
d
dσ
Step 1: Look the table in the appendix A and find the z value
Step 2: Calculate the reorder pointZ = 1.29
94.623429.1318 =××+×=+= LzLdR dσ
Reorder Point for Variable Demand
Example (cont.)
Safety stock = 1.29×4× = 8.943
___________________________________
___________________________________
___________________________________
___________________________________
___________________________________
___________________________________
___________________________________
41
Average daily demand: = 18 gallonsLead time: L = 3 daysThe standard deviation of daily demand: = 4 gallonsService level = 95%
d
dσ
Step 1: Look the table in the appendix A and find the z value
Step 2: Calculate the reorder pointZ = ______
18 3 ____ 4 3dR dL z Lσ= + = × + × × =
Reorder Point for Variable Demand
Example (cont.)
Safety stock = _____ × 4 × = 3
___________________________________
___________________________________
___________________________________
___________________________________
___________________________________
___________________________________
___________________________________
42
Safety Stock Reduction
As safety stock deceases, the risk of stockout increases; but the cost of carrying extra inventory decreasesSo there is a trade-off between safety stock and risk of stockoutQuestion: how can a company guarantee the same service level while reducing the safety stock level?
Lz dσ=StockSafety
___________________________________
___________________________________
___________________________________
___________________________________
___________________________________
___________________________________
___________________________________

43
Periodic Inventory Systems
Check the inventory once every review period and then order a quantity that is large enough to cover demand until the next order will come in
time between orders is constantorder size may varysafety stock is used to protect against variable demand
___________________________________
___________________________________
___________________________________
___________________________________
___________________________________
___________________________________
___________________________________
44
where= average demand rate
tb = the fixed time between ordersL = lead timeσd = standard deviation of demand
= safety stockI = inventory in stock
Periodic Inventory System
Order Quantity
Ltz bd +σ
ILtzLtdQ bdb −+++= σ)(_
d
___________________________________
___________________________________
___________________________________
___________________________________
___________________________________
___________________________________
___________________________________
45
Periodic Inventory System
ExampleThe Mediterranean Restaurant stocks a red Chilean table wine it purchases from a wine merchant in a nearby city. The daily demand for the wine at the restaurant is normally distributed, with a mean of 18 bottles and a standard deviation of 4 bottles. The wine merchant sends a representative to check the restaurant’s wine cellar every 30 days, and during a recent visit there were 25 bottles in stock. The lead time to receive an order is 2 days. The restaurant manager has requested an order size that will enable him to limit the probability of stockout to 2 percent. What is the order size?
___________________________________
___________________________________
___________________________________
___________________________________
___________________________________
___________________________________
___________________________________

46
Step 1: Look the table in the appendix A and find the z value
Step 2: Calculate the order quantityZ = 2.06
59825230406.2)230(18 =−+××++×=Q
Safety stock = 46.61
dσ
Average demand rate d = 18 bottlesThe fixed time between orders tb = 30 daysLead time L = 2Standard deviation of demand = 4Inventory level I = 25Service Level = 1 – 2% = 98%
Periodic Inventory System
Example (cont.)
___________________________________
___________________________________
___________________________________
___________________________________
___________________________________
___________________________________
___________________________________
47
Step 1: Look the table in the appendix A and find the z value
Step 2: Calculate the order quantity
dσ
Average demand rate d = 18 bottlesThe fixed time between orders tb = 30 daysLead time L = 2Standard deviation of demand = 4Inventory level I = 25Service Level = 95%
Periodic Inventory System
In-class Exercise
___________________________________
___________________________________
___________________________________
___________________________________
___________________________________
___________________________________
___________________________________
48
Single Period Inventory Model
Also called Newsvendor modelUseful for ordering perishables and other items with a limited useful lifeMain issue: how much to order?
___________________________________
___________________________________
___________________________________
___________________________________
___________________________________
___________________________________
___________________________________
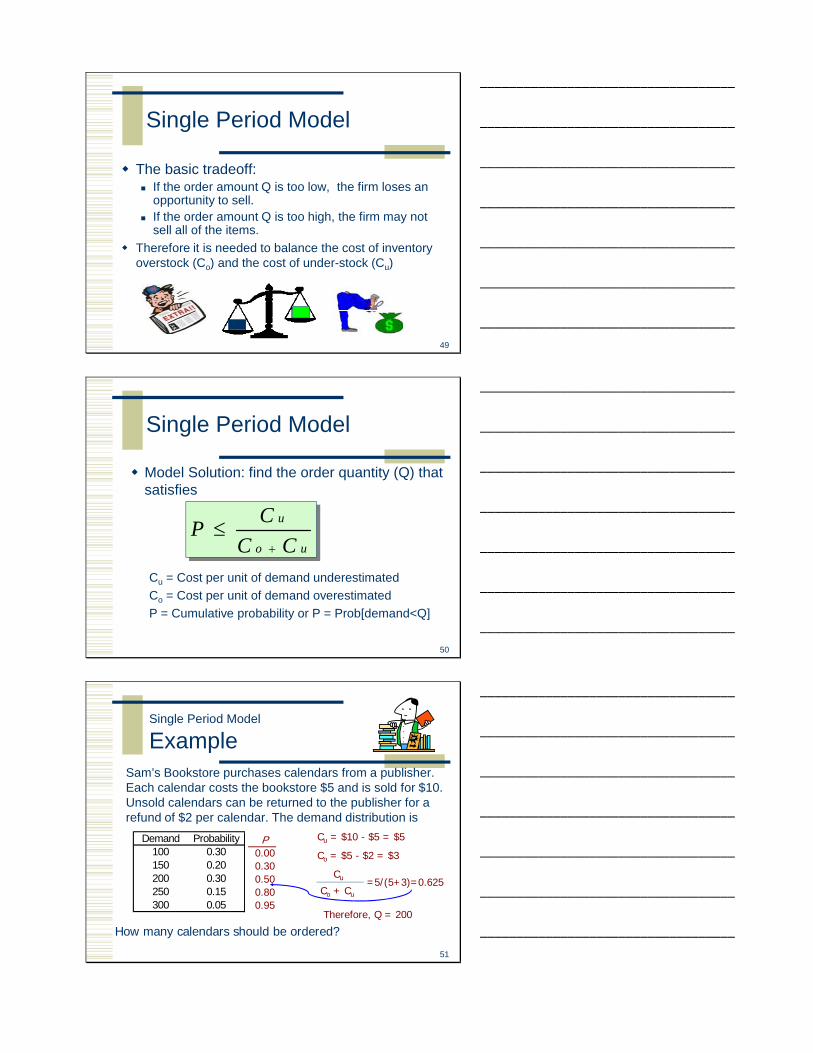
49
The basic tradeoff:If the order amount Q is too low, the firm loses an opportunity to sell.If the order amount Q is too high, the firm may not sell all of the items.
Therefore it is needed to balance the cost of inventory overstock (Co) and the cost of under-stock (Cu)
Single Period Model
___________________________________
___________________________________
___________________________________
___________________________________
___________________________________
___________________________________
___________________________________
50
Single Period Model
Model Solution: find the order quantity (Q) that satisfies
Cu = Cost per unit of demand underestimatedCo = Cost per unit of demand overestimatedP = Cumulative probability or P = Prob[demand<Q]
uo
u
CCCP+
≤
___________________________________
___________________________________
___________________________________
___________________________________
___________________________________
___________________________________
___________________________________
51
Single Period Model
ExampleSam’s Bookstore purchases calendars from a publisher. Each calendar costs the bookstore $5 and is sold for $10. Unsold calendars can be returned to the publisher for a refund of $2 per calendar. The demand distribution is
Demand Probability100 0.30150 0.20200 0.30250 0.15300 0.05
How many calendars should be ordered?
Cu = $10 - $5 = $5
Co = $5 - $2 = $3
Cu
Co + Cu
=5/(5+3)=0.625
Therefore, Q = 200
P0.000.300.500.800.95
___________________________________
___________________________________
___________________________________
___________________________________
___________________________________
___________________________________
___________________________________
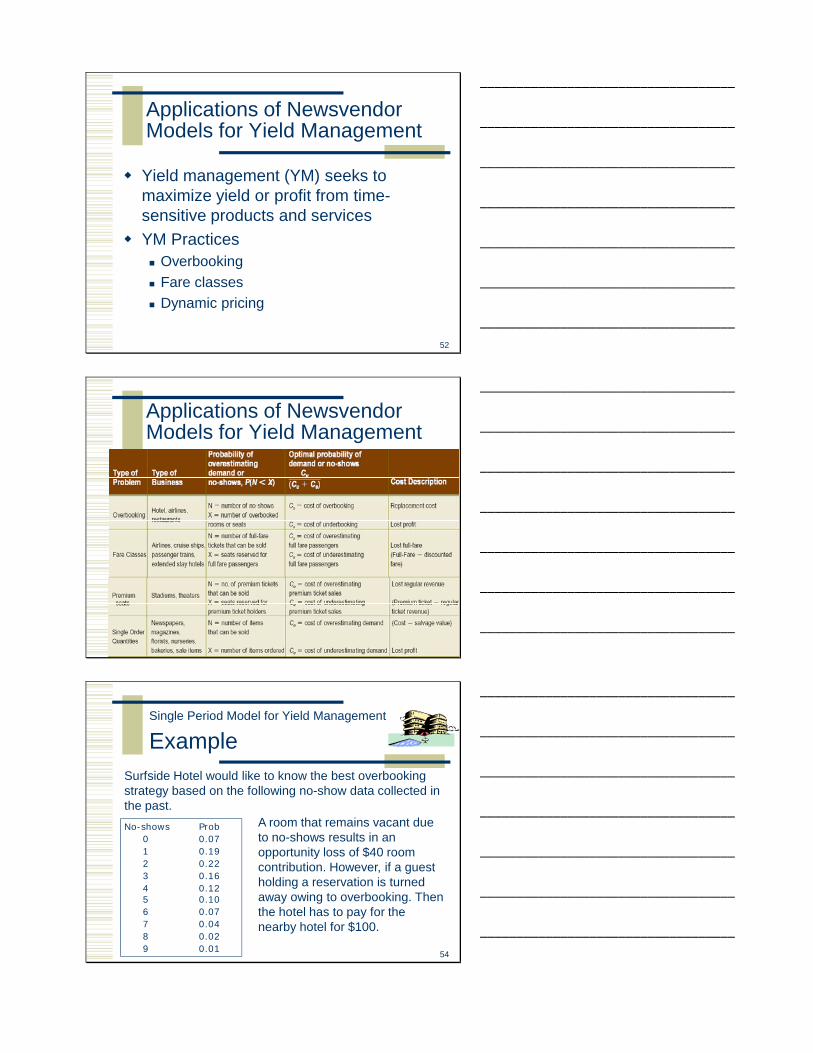
52
Applications of Newsvendor Models for Yield Management
Yield management (YM) seeks to maximize yield or profit from time-sensitive products and servicesYM Practices
OverbookingFare classesDynamic pricing
___________________________________
___________________________________
___________________________________
___________________________________
___________________________________
___________________________________
___________________________________
53
Applications of Newsvendor Models for Yield Management
___________________________________
___________________________________
___________________________________
___________________________________
___________________________________
___________________________________
___________________________________
54
Single Period Model for Yield Management
ExampleSurfside Hotel would like to know the best overbooking strategy based on the following no-show data collected in the past.No-shows Prob
0 0.071 0.192 0.223 0.164 0.125 0.106 0.077 0.048 0.029 0.01
A room that remains vacant due to no-shows results in an opportunity loss of $40 room contribution. However, if a guest holding a reservation is turned away owing to overbooking. Then the hotel has to pay for the nearby hotel for $100.
___________________________________
___________________________________
___________________________________
___________________________________
___________________________________
___________________________________
___________________________________

55
The best strategy is overbooking by two rooms
ou
u
CCCP+
≤
Cu = cost of underbooking
Co = cost of overbooking
2857.0100$40$
40$=
+=
+ ou
u
CCC
No-show prob P
0 0.07 0.00
1 0.19 0.07
2 0.22 0.26
3 0.16 0.48… … …
Single Period Model for Yield Management
Example (Cont.)
___________________________________
___________________________________
___________________________________
___________________________________
___________________________________
___________________________________
___________________________________