mexican fresh tomatoes - university of arizona · mexican fresh tomatoes: agribusiness value chain...
TRANSCRIPT

Mexican Fresh TomatoesAgribusiness Value Chain Contributions to the U.S. Economy
Dari Duval Ashley Kerna Bickel George Frisvold

Mexican Fresh Tomatoes:Agribusiness Value Chain Contributions to the U.S. Economy
Dari DuvalEconomic Impact Analyst
Ashley Kerna BickelEconomic Impact Analyst
George FrisvoldProfessor and Extension Specialist
Department of Agricultural and Resource Economics Cooperative Extension The University of Arizona
November 2018

© 2018 The Department of Agricultural and Resource Economics, The University of Arizona.Any products, services or organizations that are mentioned, shown or indirectly implied in this publication do not imply endorsement by The University of Arizona.Issued in furtherance of Cooperative Extension work, acts of May 8 and June 30, 1914, in cooperation with the U.S. Department of Agriculture, Jeffrey C. Silvertooth, Associate Dean & Director, Extension & Economic Development, College of Agriculture and Life Sciences, The University of Arizona.The University of Arizona is an equal opportunity, affirmative action institution. The University does not discrim-inate on the basis of race, color, religion, sex, national origin, age, disability, veteran status, or sexual orientation in its programs and activities.

ContentsFigures 3Tables 4Executive Summary 5
What Is the Issue? 5What Did the Study Find? 5How Was the Study Conducted? 6
Introduction 7Background 8Value Chain Linkages 12Economic Contribution Analysis 20U.S. Consumer Welfare Analysis 23Report Summary 25References 26Appendices 29
Appendix A. Price Margin Approach for Estimating Economic Contribution and Derivation of Estimated Foodservice Price of Tomatoes 29Appendix B. U.S. Consumer Welfare Analysis Details—Price Elasticity of Demand 30
FiguresFigure 1. U.S. Annual Per Capita Fresh Tomato Availability (Demand), 1960–2014 8Figure 2. U.S. Fresh Tomato Supply (Production, Imports, and Exports), 1960–2014 9Figure 3. U.S. Fresh Tomato Imports from Mexico by Growing Technology (100,000 Pound Units), 2016 11Figure 4. Daily Fresh Tomato Crossing from Mexico (10,000 Pound Units), 2012–2016 13Figure 5. Daily Fresh Tomato Crossing from Mexico by Port of Entry (10,000 Pound Units), 2012–2016 14Figure 6. Forward-Linked U.S. Value Chain for Produce Wholesale and Retail 16Figure 7. Imported Fresh Tomato Value Chain Schematic and Scope of Forward-Linked Contribution
Analysis 17Figure 8. Estimated Price per Pound of Fresh Tomatoes Sold at Retail by Value Chain Component and
Tomato Variety, 2016 18Figure 9. Estimated Price per Pound of Fresh Tomatoes Sold at Foodservice by Value Chain Component
and Tomato Variety, 2016 18Figure 10. Relationship between Components of Economic Output (Sales) 20Figure 11. Consumer Surplus and U.S. Value Chain Effects of Reduction in Supply of Mexico-Produced
Tomatoes 23Figure 12. Demonstration of Price Margin or “Markup” Approach 29

4
Mexican Fresh Tomatoes: Agribusiness Value Chain Contributions to the U.S. Economy
TablesTable 1. U.S. Utilized Tomato Production (1,000 cwt), for Fresh Market and Processing, by State, 2016 8Table 2. U.S. Value of Utilized Tomato Production, for Fresh Market and Processing, by State, 2016 8Table 3. North American Fresh-Market Field and Protected Agriculture Tomato Shipping Seasons by
Region 10Table 4. Mexico Total Tomato Acreage, 2016 10Table 5. Tomato Shipments from Mexico to the United States by Type of Tomato and Technology
(100,000 lb. Units), 2016 14Table 6. Estimated Direct Economic Contribution of Mexican Tomato Imports by Value Chain
Component, 2016 19Table 7. Estimated Total Economic Contribution to the U.S. Economy of Mexican Tomatoes, 2016 21Table 8. Top 10 Industries by Employment Contributed Through Mexican Tomato Import-Linked
Economic Activity, 2016 22Table 9. U.S. Imports of Fresh Tomatoes by Country and Share of Total U.S. Fresh Tomato Imports,
2016 23Table 10. Summary of Literature on Elasticity of Tomato Demand in the United States 30Table 11. Estimated Range of U.S. Consumer Surplus Impact of 5% Decrease in Fresh Tomato Supply at
Retail 30

5
Mexican Fresh Tomatoes: Agribusiness Value Chain Contributions to the U.S. Economy
Executive Summary
What Is the Issue?
U.S. consumers enjoy a wide variety of fresh fruits and vegetables year-round. This is facilitated by the United States importing produce from countries that can grow crops during times of the year when production is not possible in the United States. Even though it is grown and har-vested elsewhere, produce grown abroad supports economic activity, jobs, and income in the United States. U.S. businesses and workers are engaged in different parts of international agribusiness supply chains. First, there are activities that deliver fresh produce to end users, referred to as forward linkages in the supply chain. Second, foreign producers may purchase agricultural inputs from U.S. suppliers. These are known as backward linkages. Both forward and backward linkages support additional economic activity for U.S. businesses. Such is the case for imported fresh tomatoes from Mexico.
Tomato production and trade in North America rely on international agribusiness supply chains that take advantage of growing conditions, industrial specializations, and comparative advantages across countries. The benefits of trade for a net-importer of fresh tomatoes such as the United States are not limited to the increased availability of tomatoes for consumers. Benefits include economic activity taking place within the transportation, warehousing, wholesale, retail, and foodservice industries to deliver tomatoes to end buyers in the United States and Canada, as well as economic activity supported by demand for goods and services from tomato producers in Mexico, such as agricultural inputs to production. This study provides an estimate of the economic contribution of the forward supply chain link-ages to the U.S. economy supported by imports of Mexican fresh tomatoes, both those tomatoes destined for consumption in the United States, as well as those shipped by truck across the country to Canada. Using these estimates of the direct effect of forward supply chain linkages on the economy, the study also estimates the indirect effects and induced effects of this economic activity to the U.S. economy, generally referred to as multiplier effects. These effects are measured in terms of economic output (sales), value added (gross domestic product), employee compensation
and business owner income (labor income), and full- and part-time jobs. Finally, the study explores the economic benefits to U.S. consumers, known as consumer surplus, from Mexican tomatoes by simulating the effects of a reduction in the volume of imports.
What Did the Study Find?
U.S. and Canadian imports of fresh tomatoes from Mexico contributed an estimated $4.8 billion in total economic activity to the U.S. economy in 2016 including direct, indirect, and induced multiplier effects. That activity supported nearly 33,000 full- and part-time jobs earning $1.4 billion in employee compensation, $353 million in business owner income, and $801 million in cor-porate profits and other returns. In total, $2.9 bil-lion in GDP was directly and indirectly supported by the value chain delivering imported fresh tomatoes from Mexico to Canada and to U.S. consumers through grocery retail and foodservice industries. Over $400 million in federal tax reve-nue was generated through direct and multiplier effects and nearly $350 million was generated in state and local tax revenues in 2016.
Tomatoes Imported from Mexico Comprise an Important Share of U.S. Fresh Tomato Supply
f The United States imported approximately $1.9 billion worth of fresh tomatoes from Mexico in 2016. In terms of weight, imports of fresh tomatoes from Mexico totaled 3.4 billion pounds in 2016.
f As of 2015 (most recent data available) total U.S. fresh tomato supply, including domestic production and imports net of exports, was 6.6 billion pounds. In recent years, imports of fresh tomatoes from Mexico have repre-sented between 40% and 50% of the U.S. fresh tomato supply.
f By weight, 1.7 billion pounds of imports from Mexico were round tomatoes, 1.5 billion pounds were plum (Roma) tomatoes, and the remainder of imports (228 million pounds combined) were cherry and grape tomatoes.
f By weight, most tomatoes imported from Mexico (2.4 billion pounds) were produced using protected agriculture techniques for cultivation, with 1 billion pounds of imports produced in the open field.

6
Mexican Fresh Tomatoes: Agribusiness Value Chain Contributions to the U.S. Economy
f While the United States. is a net importer of fresh tomatoes from Mexico, it is a net exporter of processed tomato products to Mexico. Exports of processed tomato prod-ucts totaled $96 million in 2016, with nearly 247 million pounds of prepared or processed tomatoes, tomato juices, and tomato sauces and catsup exported to Mexico.
Accounting For Indirect and Induced Multiplier Effects, the Total Sales Contribution of Imported Mexican Tomatoes to the U.S. Economy Was an Estimated $4.8 Billion in 2016
f Forward-linked wholesale, retail, and food-service activities required to deliver imported Mexican tomatoes to U.S. consumers directly contributed an estimated $2.0 billion in sales to the U.S. economy in 2016; $991 million in sales occurred through wholesale, $816 million was in retail, and $145 million was in foodservices.
f In-bond shipment of Mexican tomatoes to Canada directly supported nearly $30 million in economic activity within the U.S. transpor-tation and logistics sector.
f Combined, direct forward supply chain link-ages of roughly $2 billion (including ship-ments to Canada) support an additional $2.8 billion in economic output through multiplier effects. Of those sales, approximately $1 billion were through indirect effects, and $1.8 billion were through induced effects.
U.S. and Canadian Imports of Fresh Tomatoes from Mexico Supported $2.9 billion in U.S. GDP (Value Added)
f Value added is the measure that best reflects the value of production of goods and services within an economy. Analogous to GDP, value added measures the value of a good or service above and beyond the cost of intermediate inputs used for its production and includes employee compensation, business owner income, profits, and taxes.
f The total value added (GDP) contribution to the U.S. economy in 2016 was an estimated $2.9 billion.
U.S. and Canadian Imports of Fresh Tomatoes from Mexico Supported Nearly 33,000 Jobs and $1.8 Billion in Labor Income in the U.S. Economy
f An estimated 33,000 full- and part-time jobs are supported in the U.S. economy by U.S. and Canadian import of Mexican tomatoes.
f A total of $1.8 billion in labor income was supported ($1.4 billion in employee compen-sation and $353 million in business owner (proprietor) income).
U.S. Consumer Welfare Analysis
f A 5% decrease in the supply of fresh tomatoes at retail in the United States, assuming all decreases occur in standard round tomatoes and plum tomatoes, would correspond to decreases in U.S. consumer surplus of $528 million (ranging from $396 million to $792 million).
How Was the Study Conducted?
This study was conducted using a variety of meth-ods and data sources. Forward supply chain link-ages (for wholesale and retail activities) were esti-mated using a price margin approach applied to shipping point, terminal market, and retail price data for tomatoes in the United States National input-output accounts were used to estimate the value of foodservice tomatoes using gross operat-ing surplus as a share of total costs. The IMPLAN 3.1 national input-output model was used to estimate the multiplier effects of this supply chain activity to the U.S. economy. The consumer wel-fare analysis section uses import data, price data, and estimated demand elasticities from recent studies on tomato demand in the United States to estimate changes in consumer surplus that would result from a hypothetical decrease in the volume of Mexican tomatoes imported by the United States.
7
Mexican Fresh Tomatoes: Agribusiness Value Chain Contributions to the U.S. Economy
IntroductionThe United States and Mexico rank as top agri-cultural export markets with one another. In 2016, Mexico was the largest exporter of crops1 to the United States, with $11.6 billion in exports. Mexico is the United States’ third largest crop export market destination after China and Canada, with nearly $7 billion in U.S. crops exported to Mexico in 2016 (U.S. Department of Commerce, 2017). Like other industries in North America characterized by interdependence of value chains between the United States, Mexico, and Canada, such as automotive and aerospace industries (Villarreal, 2017), agri-cultural value chains cross borders as inputs to production and final commodities are traded between countries. This trade relationship makes the year-round availability and afford-ability of many fresh produce items possible for all three countries. The integration of agricul-tural supply chains across countries has an impact not only on consumers of fresh produce, but also on the businesses producing crops, and the busi-nesses that supply those producers. Furthermore, individuals are employed throughout the agricul-tural supply chain, supporting jobs and income in communities within those countries. This trade relationship can be understood through examining supply chains linked to a specific crop. To do so, this study will examine the case of tomatoes.
In 2016, the United States imported over 3.4 billion pounds of fresh tomatoes from Mexico (US Department of Agriculture, 2016) and Canada
directly imported over 313 million pounds from Mexico (Statistics Canada, 2017). Imports and exports are measured in terms of value of sales and country of origin and destination, and trade balances between countries for individual com-modities are not reflective of the role of global supply chains in providing inputs to production and forward-linked value-added contributions. It therefore follows that this trade activity does not simply amount to a transfer of cash from the one country to another, but rather, businesses on both sides of the border contribute to the value chain from seed genetics, to cultivation, to logistics, to distribution to the final consumer, supporting
economic activity in both countries. This study estimates the contribution of the agricultural value chain delivering Mexican fresh tomatoes to the United States and Canada to the U.S. economy in 2016. It includes an estimate
of post-harvest industries involved in delivering tomatoes imported from Mexico to the end-con-sumer in the United States, such as logistics, transportation, warehousing, wholesale, retail, and foodservice industries involved in this process, as well as the contribution of in-bond shipments of Mexican tomatoes to Canada. Beyond the direct contribution of forward-linked value chain connections, it estimates the subsequent rounds of economic activity, known as multiplier effects, in other U.S. industries. Furthermore, this study estimates effects on consumer welfare that would result from reduced availability of tomatoes at retail in the United States.
“A [value] chain represents the entire input-output process that brings a product or service from initial conception to the consumer’s hands. The main segments in the chain vary by industry, but typically include: research and design, inputs, production, distribution and marketing, and sales, and in some cases the recycling of the products after use.” (Gereffi & Fernandez-Stark, 2016)
1 Crops as measured by export sales of goods classified under NAICS Code 111 (Crop Production).

8
Mexican Fresh Tomatoes: Agribusiness Value Chain Contributions to the U.S. Economy
BackgroundTomatoes are a species native to the Americas and were first cultivated in Mexico (SAGARPA, 2010). In fact, their name originates from the Náhuatl word, xictlitomatl (CONABIO, 2017). The United States is one of the largest producers of tomatoes in the world, ranking third worldwide in 2014 with 8.5% of global production. That same year, Mexico ranked tenth (FIRA, 2017). The trade in tomatoes between the United States and Mexico represents a reciprocal relationship, with the United States rely-ing on Mexico for fresh tomatoes and Mexico rely-ing on the United States for processed tomatoes.
Most tomato production in the United States is for the processed market, with production for processing nearly ten times production for fresh market. Most processed market production occurs in California and most fresh market production occurs in California and Florida (Table 1) (USDA, 2017). While the United States is one of the largest tomato producers in the world, imports play an important role in satisfying demand for fresh toma-toes since most U.S. production is destined for the processed market. California is the leading state by quantity of production for both fresh market and processing, with the vast majority of its production going to processing. Florida ranks second for its quantity of tomatoes produced for the fresh market.
In terms of value, Florida has the highest value of production of fresh market tomatoes with California ranking second. Again, California dominates nationally in the value of production of tomatoes for processing (Table 2).
Per capita availability of fresh tomatoes in the United States (a proxy for demand) has remained relatively steady since the early 2000s, hover-ing between 16 and 18 pounds per capita. This followed a gradual increase since the early 1980s (Figure 1).
Fresh Market Processing
California 10,626 225,839
Florida 7,280 —
All Other 5,762 9,693
Total 23,668 235,532
Table 1. U.S. Utilized Tomato Production (1,000 cwt), for Fresh Market and Processing, by State, 2016
Source: USDA NASS (2017)
Fresh Market Processing
California $297,528,000 $1,031,995,000
Florida $382,200,000 —
All Other $283,300,000 $60,754,000
Total $963,028,000 $1,092,749,000
Table 2. U.S. Value of Utilized Tomato Production, for Fresh Market and Processing, by State, 2016
Source: USDA NASS (2017)
0
2
4
6
8
10
12
14
16
18
20
1960
1962
1964
1966
1968
1970
1972
1974
1976
1978
1980
1982
1984
1986
1988
1990
1992
1994
1996
1998
2000
2002
2004
2006
2008
2010
2012
2014
Poun
ds
Year
Figure 1. U.S. Annual Per Capita Fresh Tomato Availability (Demand), 1960–2014
Source: USDA ERS (2017)

9
Mexican Fresh Tomatoes: Agribusiness Value Chain Contributions to the U.S. Economy
The growth in U.S. per capita tomato demand has been fulfilled through a combination of growth in domestic production and imports (Figure 2). Fueled by consumer demand over the last 25 years, per capita fresh tomato supply has increased by 32%, fulfilled largely by imports.
Year-round availability of fresh produce in the United States is made possible through imports, supplementing domestic production. “Fresh tomato imports (primarily from Mexico and Canada) and domestic greenhouse produc-tion combine to boost total U.S. tomato supply during the first few months of the year” (Lucier, et al., 2006). Based upon U.S. customs values of
0
1,000
2,000
3,000
4,000
5,000
6,000
7,000
8,000
Mill
ions
of P
ound
s
Production Imports Exports
1960
1962
1964
1966
1968
1970
1972
1974
1976
1978
1980
1982
1984
1986
1988
1990
1992
1994
1996
1998
2000
2002
2004
2006
2008
2010
2012
2014
Year
Figure 2. U.S. Fresh Tomato Supply (Production, Imports, and Exports), 1960–2014
Source: USDA ERS (2017)
imported tomatoes for 2016, the value of Mexican imports was $1.964 billion, Canadian imports were $278 million, and a small remainder of tomato imports (under $4 million combined) came from Guatemala, the Dominican Republic, and Ecuador.
In general, fresh market tomatoes are either field-grown or grown via protected agriculture. Production of field-grown tomatoes for the fresh market rotates seasonally within the United States and Mexico. The summer and fall shipping season is dominated by California and Baja California, and the winter and spring shipping season is dominated by Florida and Sinaloa. Protected

10
Mexican Fresh Tomatoes: Agribusiness Value Chain Contributions to the U.S. Economy
agriculture production occurs year-round in North America (Table 3). Use of protected agri-culture in Mexico has seen significant growth in recent years, particularly for tomato production, which today represents 70% of protected agricul-ture in Mexico (USDA FAS, 2017).
Within Mexico, a variety of production tech-nologies are used to produce tomatoes and in recent years, protected agriculture production has increased markedly. In 2016, 61% of tomato production by volume in Mexico was protected production, most of which produces export-qual-ity tomatoes (FIRA, 2017). However, in terms of land area, open field production represents more than double the number of hectares of protected agriculture tomato production (Table 4). Sinaloa has about 14,220 ha (35,138 acres) dedicated to
tomato cultivation, of which 6,000 ha (14,826 acres) are protected agriculture (USDA FAS, 2017). Yields of protected agriculture production, however, are significantly higher than open field production.
Tomato production in Mexico is broken into two main growing seasons: March to May which corresponds to the Fall–Winter harvest (the major peak in shipments seen between December and March), and September to November, which corresponds with Spring–Summer harvest (FIRA, 2016). Approximately 75% of Sinaloa’s harvest and 73% of Sonora’s harvest occurs in Fall–Winter (FIRA, 2016). For other major tomato-producing states such as Baja California, San Luis Potosí, Michoacán, and Zacatecas, their main harvest season is Spring–Summer. Sinaloa is the largest exporter of tomatoes among Mexican states, with 99.3% of its tomato exports (by volume) going to the United States (FIRA, 2007).
Of this total production taking place in Mexico, a share is exported to the United States. Typically, protected agriculture represents a higher pro-portion of production for export from Mexico. In terms of weight, tomatoes grown via pro-tected agriculture represent the largest portion of movements (shipments) from Mexico to the
Technology 2016 Hectares
Open Field 36,855
Protected Agriculture 15,006
Total 51,861
Table 4. Mexico Total Tomato Acreage, 2016
Source: FIRA (2017) One hectare = 2.47 acres
Jan Feb Mar Apr May Jun Jul Aug Sep Oct Nov Dec
Open Field
California
Florida
Rest of U.S.
Sinaloa, MX
Baja California, MX
Canada
Protected Agriculture
United States
Canada
Mexico
Source: Adapted from USDA ERS (2012)
Table 3. North American Fresh-Market Field and Protected Agriculture Tomato Shipping Seasons by Region

11
Mexican Fresh Tomatoes: Agribusiness Value Chain Contributions to the U.S. Economy
United States in 2016 (Figure 3). Movements of tomatoes from Mexico to the United States reach their highest peak in February and March, with a secondary peak in October.
In Mexico, roughly 98% of tomato production is for fresh market, with roughly half of that destined for export, and just 2% is for processing (FIRA, 2016). As a result, Mexico is a net importer of processed tomatoes from the United States (FIRA, 2016) to meet their demand for processed tomato products. A reciprocal relationship of sorts exists between the two countries in the provision of fresh and processed tomatoes.
0
500
1,000
1,500
2,000
2,500
3,000
3,500
Jan Feb Mar Apr May Jun Jul Aug Sep Oct Nov Dec
100,
000
Poun
d U
nits
Open Field Protected Agriculture
Month
Figure 3. U.S. Fresh Tomato Imports from Mexico by Growing Technology (100,000 lb. Units), 2016
Source: USDA AMS, Fresh Fruit and Vegetable Shipments (2016)
Not only do the two countries trade in final goods, they also trade intermediate goods as inputs to production along the value chain. Caliendo and Parro (2014) find that incorporat-ing trade in intermediate goods and cross-border input-output relationships are important compo-nents of assessing the welfare effects of trade and trade policies. The next section addresses inter-in-dustry buyer–supplier relationships between the United States and Mexico in the fresh tomato value chain and estimates the contributions of forward-linked value chain connections to the U.S. economy.

12
Mexican Fresh Tomatoes: Agribusiness Value Chain Contributions to the U.S. Economy
2 Input-Output analysis is a type of regional economic analysis, originally pioneered by Wassily Leontief, which uses a system of linear equations in the form of a matrix to quantify the flow of goods and services between businesses, households, government, invest-ment, imports, and exports within a regional economy (Miller & Blair, 2009). Input-output techniques are used to simulate multiplier effects stimulated by shocks to an economy, as well as the interdependence of industries within a region.
Value Chain LinkagesAgricultural value chains connect across borders and even include the two-way exchange of similar or related commodities. According to Gereffi & Fernandez-Stark (2016), “[a] [global value] chain represents the entire input-output process that brings a product or service from initial conception to the consumer’s hands. […] This input-output structure involves goods and services, as well as a range of supporting industries.” This demon-strates the concept of backward and forward linkages. In input-output analysis,2 the sourcing of inputs to production is known as backward linkages, whereas demand stimulated in down-stream industries that deliver those goods pro-duced to final consumers is known as forward linkages (Miller & Blair, 2009). In the case of tomato production, backward linkages include industries that supply agricultural inputs such as fertilizers, machinery, and utilities. According to FIRA (2006), major providers of material inputs to tomato production in Mexico are based in the Netherlands, Spain, and Mexico (greenhouses and equipment); the Netherlands, Israel, and the United States (seeds); Mexico and Canada (seed-lings); and Mexico, Israel, and the United States (fertilizers).
The U.S. government does not track the share of imports that contain intermediate inputs originally sourced from within the United States. Obtaining an estimate of this share presents a series of challenges. According to the National Research Council (2006), “[t]he foreign content of U.S. product exports can be estimated by
proxy and with some accuracy given available data and assumptions regarding the similarity of imported intermediate inputs (e.g., parts) and U.S.-produced intermediate inputs. The mea-surement of the U.S. content of U.S. imports of products cannot be done with confidence because there is no reliable way of tracking U.S. exports that are subsequently incorporated into imports in one form or another.” Furthermore, due to the fact that imported inputs to production represent only a share of total inputs, and of those imported inputs, only a share are from the United States, it’s reasonable to expect that the magnitude of backward-linked supply chain connections are small compared to the value of forward linkages, particularly so when expressed as sales versus as value added. Given limited data availability and the relatively small magnitude of backward linkages in comparison to forward linkages, this report does not focus on quantifying backward supply chain linkages.
Forward linkages include transportation, ware-housing, and the wholesale, retail, and foodservice industries. U.S. and Canadian demand for toma-toes produced in Mexico stimulates demand for forward-linked industries doing business in the United States. This study focuses on direct for-ward-linked economic activity in the United States and, additionally, utilizes input-output methods to estimate the multiplier effects of forward supply chain linkages of Mexican tomato production to the U.S. national economy. Price data and a mar-gin approach are used to estimate the wholesale, retail, and foodservice activity in the United States supported by imported Mexican tomatoes.

13
Mexican Fresh Tomatoes: Agribusiness Value Chain Contributions to the U.S. Economy
0
500
1,000
1,500
2,000
2,500
10,0
00 P
ound
Uni
ts
Jan
2012
Mar
201
2
Jul 2
012
Sep
2012
Nov
201
2
May
201
2
Jan
2013
Mar
201
3
Jul 2
013
Sep
2013
Nov
201
3
May
201
3
Jan
2014
Mar
201
4
Jul 2
014
Sep
2014
Nov
201
4
May
201
4
Jan
2015
Mar
201
5
Jul 2
015
Sep
2015
Nov
201
5
May
201
5
Jan
2016
Mar
201
6
Jul 2
016
Sep
2016
Nov
201
6
May
201
6
Month
Figure 4. Daily Fresh Tomato Crossing from Mexico (10,000 Lb. Units), 2012–2016
Source: USDA AMS Specialty Crop Custom Movement Report
In this analysis, forward linkages are measured as downstream industries in the supply chain that deliver fresh tomatoes from the U.S.-Mexico bor-der to wholesale, retail, and foodservice markets throughout the country, as well as to the Canadian border. Upon crossing the U.S. border, Mexican tomato shipments are met by sophisticated fresh produce logistics clusters at ports of entry that inspect shipments for food safety, provide warehousing and transportation, and manage
cross-border business transactions (Pavlakovich-Kochi & Thompson, 2013). On a daily basis, millions of pounds of fresh tomatoes arrive from Mexico to the United States, on average 9.4 mil-lion pounds per day in 2016. Over the course of the year, however, movements fluctuate with the harvest, with the peak of tomato deliveries occur-ring in spring months corresponding with the January to March harvest in Sinaloa (Thompson & Wilson, 1996) (Figure 4).

14
Mexican Fresh Tomatoes: Agribusiness Value Chain Contributions to the U.S. Economy
Tomatoes imported from Mexico into the United States fall under four categories—toma-toes (round), cherry tomatoes, grape tomatoes, and plum-type tomatoes (also known as Roma tomatoes). In terms of weight, round tomatoes represent the majority of imports, followed by plum tomatoes. For all types of tomatoes, pro-tected agriculture represents the largest share of imports by weight (Table 5).
Open Field Protected Agriculture
Tomatoes (Round) 3,250 13,982
Cherry Tomatoes 146 463
Grape Tomatoes 773 900
Plum (Roma) Tomatoes 5,852 9,068
Table 5. Tomato Shipments from Mexico to the United States by Type of Tomato and Technology (100,000 lb. Units), 2016
Source: USDA AMS (2017) Specialty Crop Shipment Report
0
200
400
600
800
1,000
1,200
1,400
1,60010
,000
Pou
nd U
nits
Pharr, TX Otay, CA Nogales, AZ All Other
Jan
2012
Mar
201
2
Jul 2
012
Sep
2012
Nov
201
2
May
201
2
Jan
2013
Mar
201
3
Jul 2
013
Sep
2013
Nov
201
3
May
201
3
Jan
2014
Mar
201
4
Jul 2
014
Sep
2014
Nov
201
4
May
201
4
Jan
2015
Mar
201
5
Jul 2
015
Sep
2015
Nov
201
5
May
201
5
Jan
2016
Mar
201
6
Jul 2
016
Sep
2016
Nov
201
6
May
201
6
Month
Figure 5. Daily Fresh Tomato Crossing from Mexico by Port of Entry (10,000 Lb. Units), 2012–2016
Source: USDA AMS Specialty Crop Custom Movement Report
More than three-quarters of U.S. imports of tomatoes from Mexico enter through just two ports of entry. Nogales, Arizona is the U.S. port of entry that handled the largest volume of tomato imports from Mexico in 2016, with roughly 42% of imports by weight. Nogales was followed by Pharr, Texas (near McAllen, Texas) which handled around 34% of imports by weight. Third was Otay Mesa, California (near San Diego, California). Combined, these three top ports of entry accounted for 90% of tomato imports by volume from Mexico in 2016. Import volume through Nogales is highly seasonal, once again reflecting the spring harvest in Sinaloa (Figure 5). These ports of entry support sophisticated logistics clusters, contributing jobs and income to their respective local economies.

15
Mexican Fresh Tomatoes: Agribusiness Value Chain Contributions to the U.S. Economy
tomatoes commanding the highest price per pound and plum tomatoes the lowest. The average F.O.B. price per pound for tomatoes in 2016 ranged from $0.42 per pound for plum tomatoes up to $1.57 per pound for cherry tomatoes (values calculated based
upon varying standard carton weights). Shipping point prices are fairly consistent between ports of entry. Insomuch as there is a difference in average price by port of entry, it would be as a result of prevailing prices by season, as some ports of entry do not have movements of tomatoes during particular times of the year.
Terminal market prices represent “sales by first receivers to retailers or other large users of wholesale lots of gen-erally good quality and condition” (USDA AMS, 2017b). This represents the cost of tomatoes to retail outlets and foodservice outlets that purchase tomatoes in bulk to transform them into other finished prod-ucts. Yet again, plum tomatoes command the lowest price per pound, at a calculated average of $0.66 per pound. Cherry tomatoes commanded the highest price per pound at $1.97 per pound (calculated).
Tomatoes generally reach final consumers in the United States either through retail stores or through the foodservice industry. Retail prices represent “advertised prices for fruits and vegetables at major retail supermar-ket outlets” (USDA AMS, 2017b). Following pre-vious patterns, cherry tomatoes had the highest per-pound price ($3.65) and plum tomatoes had the lowest ($1.12). Though prices fluctuated on a weekly basis in 2016, they maintained a relatively consistent price throughout the year.
This analysis uses the concept of price “mark-ups” as a means of estimating the wholesale, retail, and foodservice activity attributable to U.S. imports of fresh tomatoes from Mexico. The USDA Agricultural Marketing Service collects data on shipping point, terminal market, and retail market prices for agricultural food commodities, including the four aforementioned tomato types. Through an examination of these different prices,3 an aver-age price “markup” can be calculated between the shipping point and wholesale prices, and between wholesale and grocery retail prices. A derived estimate of the price of tomatoes at foodservice is estimated (see Appendix A). This in turn allows for estima-tion of the additional value of sales generated by wholesalers, retailers, and foodservice estab-lishments in the U.S. economy.
According to the USDA AMS (2017b) “[s]hipping point prices are F.O.B. (free on board) prices that represent open market (spot) sales by first handlers at point of production or port of entry on product of gen-erally good quality and condition.” In the case of tomatoes imported from Mexico, the F.O.B. price represents the price imported at the port of entry. Shipping point prices vary by type of tomato and time of year, with cherry
3 This analysis uses F.O.B., wholesale, and retail prices for all tomatoes imported from Mexico for 2016, not including organic tomatoes. While there are some organic tomatoes imported from Mexico by the United States, they represent a very small share of total tomato imports (less than 1%).
Types of Tomatoes
The USDA Agricultural Marketing Service classifies tomatoes under four general categories
Tomatoes (Round)
Standard large round tomatoes including vine-ripes and mature greens
Cherry Tomatoes*
Small round tomatoes
Grape Tomatoes**
Small oblong tomatoes
Plum (Roma) Tomatoes
Large oblong tomatoes commonly known as Roma tomatoes* Courtesy: Luc Viatour** Courtesy: Denzil Green

16
Mexican Fresh Tomatoes: Agribusiness Value Chain Contributions to the U.S. Economy
Production Wholesale Final Consumer
DomesticGrowers
&Shippers
Growers/ShippersConsumer Retail
Produce Wholesalers
Brokers
Food Service& Other
Figure 6. Forward-Linked U.S. Value Chain for Produce Wholesale and Retail
Source: Adapted from USDA ERS (2017b), McLaughlin, et al. (2015)
When tomatoes reach final consumers through foodservice establishments, they are not sold as an individual commodity, but rather as part of trans-formed finished products such as salads, soups, or other food products. Nonetheless, they are an ingredient used in producing final products for consumers, generating a price “markup” for food-service establishments. In order to estimate that foodservice markup, data on foodservice industry costs and gross operating margins was used to estimate an average gross margin over all costs, and this average margin was applied to tomatoes purchased by foodservice establishments. The details of this calculation can be consulted in Appendix A.
The value of price markups (value of sales generated above the value of tomatoes purchased) attributable to tomato imported from Mexico is generated through different types of businesses operating within the fresh produce industry. The fresh produce business is characterized by a diver-sity of operations in terms of their level of vertical integration. Some operations are grower–shippers and include all activities from on-farm cultivation up through wholesale, while other operations function as integrated wholesale–retail opera-tions that contract with growers. Additionally,
there are firms that are not vertically integrated, including growers, shippers, brokers, wholesalers, and retailers. The forward-linked U.S. value chain for grocery wholesale, retail, and foodservice is summarized visually in Figure 6.
This analysis considers those steps along the fresh tomato value chain where tomatoes are sold as-is in wholesale and retail settings in the United States, and attributes a proportion of foodservice price margins to tomatoes sold as part of trans-formed final products. Using existing estimates of the share of tomato sales by sales channel (USDA ERS, 2016; Cook, 2015), this analysis assumes that 50% of wholesale sales by weight reach consum-ers through foodservice channels (retail restau-rants, institutional users, and other) and 50% of wholesale sales go on to grocery retail to be sold at retail prices to consumers. In other words, in calculating the value of retail sales in the United States that is attributable to imported Mexican tomatoes, 50% of imports go on to generate grocery retail activity while the other 50% go on to be transformed into other finished products via foodservice industries (for a more detailed explanation of the price margin calculation, please consult Appendix A). Finally, the volume of toma-toes transported by ground through the United

17
Mexican Fresh Tomatoes: Agribusiness Value Chain Contributions to the U.S. Economy
Productionin Mexico
U.S. Imports
Transport
Wholesale
FoodServiceSales
Shrinkageand Spoilage
RetailSales
Canadian Imports
100%50%
50%GroceryRetail
14.5%
85.5%
FoodService 85.5%
{
Figure 7. Imported Fresh Tomato Value Chain Schematic and Scope of Forward-Linked Contribution Analysis
States to Canada generates economic activity in the transportation and logistics industry. Figure 7 summarizes the process by which imported fresh tomatoes reach Canada and final consumers in the United States, either through retail or foodservice channels, and the share of weight by channel. The area shaded in red is representative of the steps along the forward-linked value chain captured by this analysis.
As fresh produce moves through these chan-nels, inevitably some of the produce will be lost to spoilage, damage, water weight loss, theft, and unsold produce, among other causes. As a result, the weight sold at retail and through foodservices is less than the amount produced or imported. Recent estimates of supermarket shrink for
tomatoes is between 11.9% and 14.7% at retail, with an average of 14.5% (Buzby, et al., 2016). This analysis uses the 14.5% estimate from Buzby, et al. (2016) applied to both retail and foodservice. While this study does not take into account losses at the wholesale level, the FAO estimates that food loss and waste for postharvest handling and stor-age for fruits and vegetables in general in North American and Oceania totals 4% (FAO, 2011).
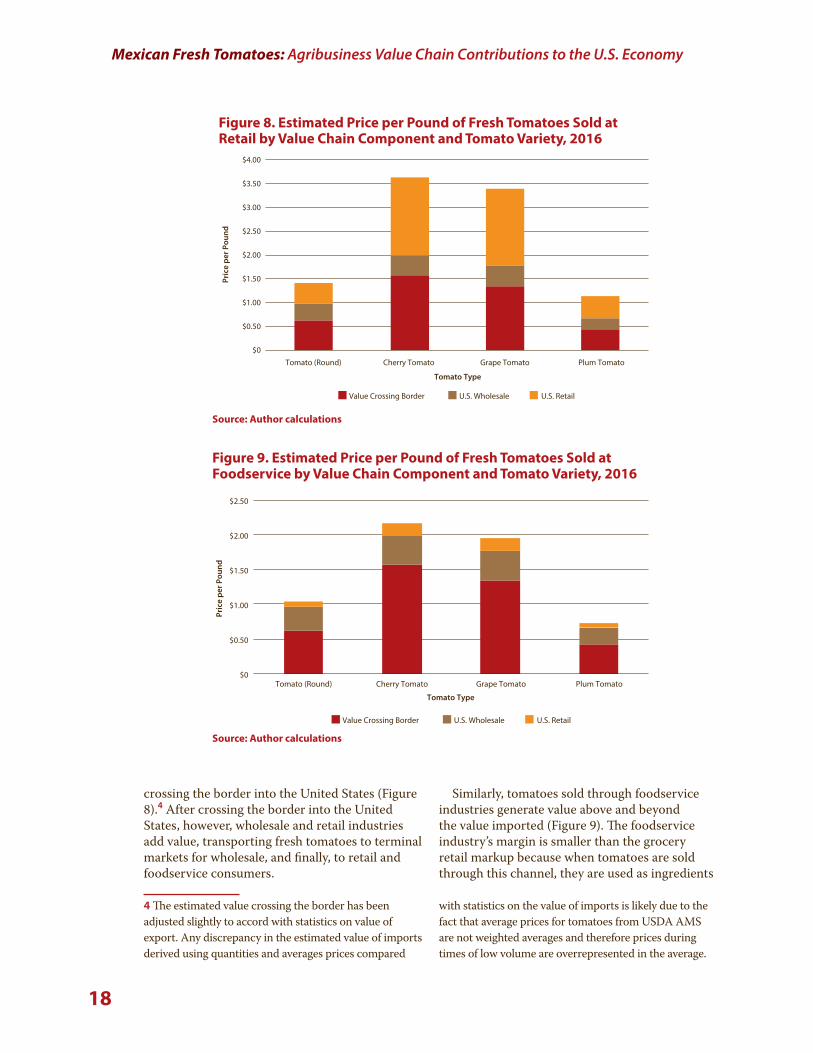
Applying weight of tomato imports from Mexico by type, estimates of the value chain component contributions to the price paid by final consumers can be generated for each of the four types of tomato. For 2016, on a per-pound basis, less than half of the retail value of tomatoes occurs in inputs, production, and logistics prior to
18
Mexican Fresh Tomatoes: Agribusiness Value Chain Contributions to the U.S. Economy
crossing the border into the United States (Figure 8).4 After crossing the border into the United States, however, wholesale and retail industries add value, transporting fresh tomatoes to terminal markets for wholesale, and finally, to retail and foodservice consumers.
Similarly, tomatoes sold through foodservice industries generate value above and beyond the value imported (Figure 9). The foodservice industry’s margin is smaller than the grocery retail markup because when tomatoes are sold through this channel, they are used as ingredients
4 The estimated value crossing the border has been adjusted slightly to accord with statistics on value of export. Any discrepancy in the estimated value of imports derived using quantities and averages prices compared
with statistics on the value of imports is likely due to the fact that average prices for tomatoes from USDA AMS are not weighted averages and therefore prices during times of low volume are overrepresented in the average.
$0
$0.50
$1.00
$1.50
$2.00
$2.50
$3.00
$3.50
$4.00
Tomato (Round) Cherry Tomato Grape Tomato Plum Tomato
Pric
e pe
r Pou
nd
Value Crossing Border U.S. Wholesale U.S. Retail
Tomato Type
Figure 8. Estimated Price per Pound of Fresh Tomatoes Sold at Retail by Value Chain Component and Tomato Variety, 2016
Source: Author calculations
$0
$0.50
$1.00
$1.50
$2.00
$2.50
Pric
e pe
r Pou
nd
Tomato (Round) Cherry Tomato Grape Tomato Plum Tomato
Value Crossing Border U.S. Wholesale U.S. Retail
Tomato Type
Figure 9. Estimated Price per Pound of Fresh Tomatoes Sold at Foodservice by Value Chain Component and Tomato Variety, 2016
Source: Author calculations
19
Mexican Fresh Tomatoes: Agribusiness Value Chain Contributions to the U.S. Economy
in producing transformed final products, and not tomatoes “as-is.” Although only part of a final good, tomatoes contribute to generate a price “markup” for foodservice establishments, cap-tured here. For a more detailed explanation of the price margin approach used in this analysis, please consult Appendix A.
Summed across all tomato types, as well as applying the retail price margin to 50% of the volume of imported Mexican tomatoes by weight and the foodservice price margin to the other 50%, (per Figures 8 and 9), we derive estimates for the value chain breakdown of U.S. consumer spending on imported Mexican tomatoes. As mentioned previously, this breakdown of wholesale, retail, and foodservice activity generated is derived using price data including shipping point prices (port of entry), terminal market prices, retail prices, and a derived foodservice price. Therefore, these sales markups are not necessarily representative of vertically integrated grower–shippers or large wholesale–retail firms that perform shipping, warehousing, and retailing in-house, but rather are activity-based estimates of output generated along each step of the value chain. Forward-linked economic activity in the United States result-ing from U.S.-imported tomatoes from Mexico totaled roughly $2 billion in 2016, of which $1 billion was in wholesale activities, $816 million was in retail activity, and $145 million was in foodservice activity.
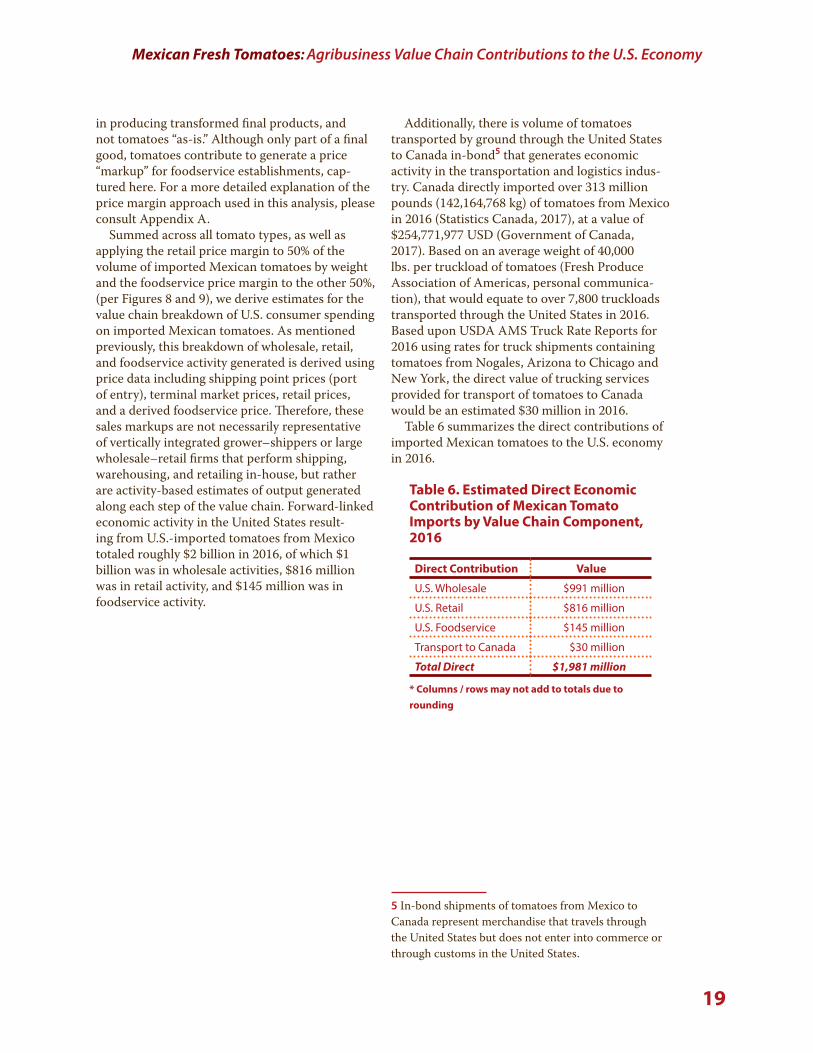
Additionally, there is volume of tomatoes transported by ground through the United States to Canada in-bond5 that generates economic activity in the transportation and logistics indus-try. Canada directly imported over 313 million pounds (142,164,768 kg) of tomatoes from Mexico in 2016 (Statistics Canada, 2017), at a value of $254,771,977 USD (Government of Canada, 2017). Based on an average weight of 40,000 lbs. per truckload of tomatoes (Fresh Produce Association of Americas, personal communica-tion), that would equate to over 7,800 truckloads transported through the United States in 2016. Based upon USDA AMS Truck Rate Reports for 2016 using rates for truck shipments containing tomatoes from Nogales, Arizona to Chicago and New York, the direct value of trucking services provided for transport of tomatoes to Canada would be an estimated $30 million in 2016.
Table 6 summarizes the direct contributions of imported Mexican tomatoes to the U.S. economy in 2016.
5 In-bond shipments of tomatoes from Mexico to Canada represent merchandise that travels through the United States but does not enter into commerce or through customs in the United States.
Direct Contribution Value
U.S. Wholesale $991 million
U.S. Retail $816 million
U.S. Foodservice $145 million
Transport to Canada $30 million
Total Direct $1,981 million
Table 6. Estimated Direct Economic Contribution of Mexican Tomato Imports by Value Chain Component, 2016
* Columns / rows may not add to totals due to rounding

20
Mexican Fresh Tomatoes: Agribusiness Value Chain Contributions to the U.S. Economy
Economic Contribution Analysis
As developed in previous sections, tomatoes imported from Mexico have backward and forward value chain linkages that represent economic activity within the U.S. economy even though the tomatoes are not grown on U.S. soil. Backward linkages occur when industries producing a particular good or service purchase inputs from other supplier businesses, gener-ating additional rounds of economic activity.6 Forward linkages occur when industries such as wholesalers and retailers provide their services to deliver goods to end users or consumers. Forward linkages supported after tomatoes cross into the United States totaled an estimated $2 billion in direct wholesale, retail, foodservice, and trans-portation activity in 2016.
The economic contribution of wholesale, retail, and foodservice industries, however, goes beyond those sales supported directly by tomato demand. Demand for those goods and services indirectly support demand for additional inputs and labor, stimulating additional rounds of economic activ-ity. These are referred to as multiplier effects. Multiplier effects include direct effects, economic
activity directly supported by an industry; indi-rect effects, demand for goods and services stim-ulated in those businesses that supply the direct industries, the businesses that supply them, and so on and so forth; and induced effects, economic activity stimulated through demand for household goods and services by those people employed by direct industries and businesses that supply the direct industries.
Economic contributions can be represented using a number of metrics. Economic output is a measure synonymous with sales and measures the flow of money through an economy. Output (sales), however, double counts the cost of inputs to production as goods and services change hands across the value chain. Value added is a measure that more accurately reflects the value of produc-tion of goods and services within an economy. Analogous to gross domestic product, value added measures the value of a good or service above and beyond the cost of intermediate inputs used for its production. It includes employee compensa-tion, business owner income, profits, and taxes. Labor income, a subset of value added, includes employee compensation (wages and benefits) and business owner income. The relationship between output (sales), value added, and labor income is illustrated in Figure 10.
6 Backward linkages supported in the United States by imported Mexican tomatoes are not estimated in this study due to limited economic data on U.S. agricultural inputs imported by Mexican producers for use in pro-duction for export.
LaborIncome
ValueAdded Sales
Wages, Salaries, and Benefits of Employees
Proprietor Income
Income
Other Property Type Income
Profits
TaxesInput Costs
Value Added
Figure 10. Relationship between Components of Economic Output (Sales)

21
Mexican Fresh Tomatoes: Agribusiness Value Chain Contributions to the U.S. Economy
Impact Type Direct Effect Indirect Effect Induced Effect Total Effect
Employment
Full- & Part-Time Jobs 16,100 5,800 10,900 32,800
Value Added (GDP)
Employee Compensation $675,505,000 $289,072,000 $476,334,000 $1,440,911,000
Proprietor Income $219,121,000 $53,627,000 $80,390,000 $353,138,000
Other Property Type Income $267,837,000 $195,687,000 $337,841,000 $801,365,000
Taxes on Production & Imports
$215,467,000 $35,385,000 $82,273,000 $333,125,000
Total Value Added $1,377,930,000 $573,771,000 $976,838,000 $2,928,539,000
Economic Output (Sales)
Sales (Output) $1,981,458,000 $1,028,250,000 $1,792,691,000 $4,802,399,000
Table 7. Estimated Total Economic Contribution to the U.S. Economy of Mexican Tomatoes, 2016
* Columns / rows may not add to totals due to rounding
Finally, employment measures the num-ber of full- and part-time jobs associated with the economic activity in question. In order to estimate these indirect and induced economic contributions to the U.S economy associated with imported Mexican tomatoes, an input-output model was used. This analysis uses the IMPLAN 3.1 national model with 2014 data. Details of the economic contributions methods used can be found in Appendix A.
Accounting for indirect and induced multiplier effects, the total contribution of imported Mexican tomatoes to the U.S. economy in 2016 was an esti-mated $4.8 billion in sales (output). Of those sales, $1 billion were through indirect effects, and $1.8 billion were through induced effects. The total value added (gross domestic product) contribution
was an estimated $2.9 billion, including a total of $1.8 billion in labor income supported ($1.4 billion in employee compensation and $353 million in business owner (proprietor) income), $801 million in business profits and other gross operational sur-plus, and $333 million in taxes on production and imports. An estimated 16,100 full- and part-time jobs were directly supported in industries that have forward value chain linkages with tomatoes imported from Mexico. Including jobs that were supported by spending on inputs purchased from other U.S. industries (indirect effects) and spend-ing of profits and wages (induced effects), the total number of jobs supported in the U.S economy was an estimated 32,800 full- and part-time jobs. Table 7 details the estimated economic contribution by component.

22
Mexican Fresh Tomatoes: Agribusiness Value Chain Contributions to the U.S. Economy
The top 10 industries in terms of total employ-ment contributed through economic activity linked to imports of Mexican tomatoes are presented in Table 8. Generally speaking, these are also most of the top industries in terms of output, value added, and labor income supported. These industries reflect a combination of industries supported by direct effects (food and beverage retail, whole-sale trade, truck transportation) and industries
Description Employment Labor Income Value Added Output (Sales)
Retail—Food & Beverage Stores 12,400 $396,891,000 $575,658,000 $833,943,000
Wholesale Trade 4,500 $393,744,000 $736,911,000 $1,111,372,000
Real Estate 1,000 $26,359,000 $164,739,000 $226,657,000
Full-Service Restaurants 600 $13,147,000 $14,278,000 $26,089,000
Employment Services 500 $19,783,000 $28,686,000 $34,794,000
Limited-Service Restaurants 500 $9,733,000 $23,032,000 $41,172,000
Warehousing and Storage 500 $22,582,000 $29,234,000 $51,292,000
Hospitals 500 $35,863,000 $41,006,000 $71,855,000
Truck Transportation 400 $23,503,000 $28,645,000 $65,951,000
Services to Buildings 400 $8,421,000 $9,093,000 $14,029,000
Table 8. Top 10 Industries by Employment Contributed Through Mexi-can Tomato Import-Linked Economic Activity, 2016
supported by indirect and induced effects (real estate, hospitals, services to buildings). Some industries such as food and beverage retail are sup-ported through both direct and multiplier effects.
Based upon IMPLAN estimates, over $400 million in federal tax revenue was generated through direct and multiplier effects and roughly $350 million was generated in state and local tax revenues in 2016.

23
Mexican Fresh Tomatoes: Agribusiness Value Chain Contributions to the U.S. Economy
U.S. Consumer Welfare Analysis
The USDA reports 3.4 billion pounds of fresh tomatoes were imported from Mexico by the United States in 2016. In 2015 (the most recent data available), the U.S. supply of fresh toma-toes, excluding exports, was 6.6 billion pounds (AMS, 2017), with 2.8 billion pounds of imports from Mexico. That said, Mexican tomatoes represent roughly half of U.S. fresh tomato supply in recent years. In terms of value of imports, in 2016 Mexico repre-sented 87% of U.S. fresh tomato imports (U.S. ITC, 2017). Mexican-grown tomatoes clearly comprise an important part of U.S. tomato supply (Table 9).
According to Russo, et al. (2008), fresh toma-toes are generally sold on the open market versus tomatoes for processing which are contracted by processors. Asci, et al. (2016) find that aggregated across open field and greenhouse-grown tomatoes, U.S. consumers consider U.S. domestically pro-duced and imported Mexican tomatoes as substi-tute goods. This analysis will consider a hypotheti-cal decrease in the total supply of fresh tomatoes in the United States at retail. A more detailed account of literature and methods used for the consumer welfare analysis can be consulted in Appendix B.
A hypothetical decrease in supply of fresh toma-toes would result in an increase in price in order for supply and demand to equalize, all else held constant. The increase in price would be associated with a decrease in consumer surplus, highlighted in red in Figure 11. Consumer surplus is a measure of consumers’ willingness to pay for a good or ser-vice in excess of its market price, or from another angle, the amount of money a consumer of the
good would have to be paid in order to give up consuming it. It serves as a measure of how well off a consumer is as a result of consum-ing a good given the price they paid for it. In aggregate across all consumers, consumer surplus is a measure
of gains from trade (Varian, 2010). An increase in price results in two negative effects on consumers: the effect of reduced availability of the good, and the corresponding reduced utility from consuming it (the triangular portion of the highlighted red area in Figure 11), and the effect of having to pay more per unit for the quantity of the good still consumed (the rectangular portion of the high-lighted red area in Figure 11) (Varian, 2010).
Lost Consumer Surplus
Reduced U.S. ValueChain Linkages
D
QQ'
P'
P
Figure 11. Consumer Surplus and U.S. Value Chain Effects of Reduction in Supply of Mexico-Produced Tomatoes
Consumer surplus is a measure of how well-off a consumer is as a result of consuming a good given the price they paid for it, in other words, the net benefits derived by purchasing and consuming a good. It can also be thought of as the amount that consumer would have to be paid in order to give up consuming the good, or their willingness to pay in excess of the pre-vailing price. (Varian, 2010)
Country 2016 Imports Share of U.S. Imports
Canada $277,830,245 12.285%
Colombia $12,142 0.001%
Dominican Rep $10,675,438 0.472%
Ecuador $11,385 0.001%
Guatemala $8,612,145 0.381%
Mexico $1,964,315,933 86.861%
Table 9. U.S. Imports of Fresh Tomatoes by Country and Share of Total U.S. Fresh Tomato Imports, 2016
Source: U.S. Department of Commerce & U.S. International Trade Commission; HTS Code 0702.00 (Tomatoes, fresh or chilled)
24
Mexican Fresh Tomatoes: Agribusiness Value Chain Contributions to the U.S. Economy
Additionally, a reduced quantity of production in Mexico implies fewer inputs to production, a portion of which would be sourced from the United States, and the forward-linked supply chain connections supported in the United States would also be reduced, creating a negative economic impact to the U.S. economy. This is rep-resented in the light yellow portion of the shaded yellow area in Figure 11.
The 2016 annual average retail price (per pound) of tomatoes (round tomatoes and plum tomatoes) was roughly $1.48 per pound (AMS, 2017). For purposes of this analysis, we will focus on these commodities since they represent the large majority of U.S. tomato imports from Mexico, both in terms of value and weight.
In 2015, the most recent data available, total U.S. fresh tomato supply, including domestic production and imports less exports, was 6.6 billion pounds. As detailed earlier in this analysis,
an estimated one-half of that supply (3.3 billion pounds) goes to retail while the other half is sold through foodservice and other channels. Using a range of values from existing research on con-sumer demand response to changes in tomato prices, price response to changes in retail supply can be estimated. Based upon that information, a 5% decrease in supply of fresh tomatoes at retail in the United States would result in a price increase of $0.16 per pound (ranging from $0.12 to $0.25 per pound), holding all else constant. This assumes a linear demand curve and the annual average price per pound for standard round tomatoes and plum tomatoes of $1.48 per pound in 2016 (the same as the annual average price of $1.48 per pound in 2015). When applied to the estimated retail supply of 3.3 billion pounds in 2015, the resulting decrease in consumer surplus would be an estimated $528 million (ranging from $396 million to $792 million).

25
Mexican Fresh Tomatoes: Agribusiness Value Chain Contributions to the U.S. Economy
Report SummaryImported fresh produce, such as tomatoes, sup-ports economic activity, jobs, and income in the United States, even though it is grown elsewhere. In the case of tomatoes grown in Mexico, interna-tional agribusiness supply chains support for-ward-linked industries that deliver fresh tomatoes to end buyers in the United States and Canada, as well as backward-linked industries that supply inputs to agricultural producers in Mexico. This study estimates the total contribution of Mexican fresh tomatoes to the U.S. economy, including industries involved in delivering fresh tomatoes from ports of entry to end consumers (direct effects), and the multiplier effects in other U.S. industries through business-to-business transac-tions (indirect effects) and household-to-business transactions (induced effects).
The direct contribution of Mexico-produced tomatoes imported by the United States and Canada to the U.S. economy is $2 billion in sales and when considering multiplier effects supported by that activity, the total annual sales contribution is approximately $4.8 billion (in 2016). A more commonly employed measure of economic activity at the national level is value added, also known as gross domestic prod-uct (GDP). The backward and forward-linked economic activity in the United States tied to imported Mexican tomatoes directly supported an estimated $1.4 billion in GDP in 2016, and
including multiplier effects, the total estimated contribution to GDP in 2016 was $2.9 billion. Also supported were a total of 32,800 full- and part-time jobs, including multiplier effects, earn-ing $1.4 billion in employee compensation and $353 million in business owner income.
Most U.S. tomato production is destined for the processed market, therefore imports from Mexico play an important role in the availability and affordability of fresh tomatoes in the United States for much of the year. Reductions in supply drive price increases and resultant decreases in con-sumer surplus. A reduction in fresh tomato supply at retail as small as 5% could lead to decreases in consumer surplus between $396 million and $792 million annually. Additionally, that decreased pro-duction would have impacts to businesses in the United States across the fresh tomato supply chain.
Imports and exports are measured in terms of value of sales and country of origin and destina-tion, and trade balances between countries for individual commodities are reflective of the value of sales of imports and exports. These measures, however, are not reflective of the role of global supply chains in providing inputs to production and value-added contributions. Furthermore, imports support logistics, wholesale, and retail industries domestically. This analysis has examined the case of U.S. imports of Mexican-produced tomatoes to highlight the significance of binational economic linkages and interdepen-dence for supply of intermediate and final goods.

26
Mexican Fresh Tomatoes: Agribusiness Value Chain Contributions to the U.S. Economy
ReferencesAsci, S., Seale, J., Onel, G., & VanSickle, J. (2016).
“U.S. and Mexican Tomatoes: Perceptions and Implications of the Renegotiated Suspension Agreement.” Journal of Agricultural and Resource Economics. Vol 41 No 1 pp 138–160.
Buzby, J., Bentley, J., Padera, B., Campuzano, J., & Ammon, C. (2016). Updated Supermarket Shrink Estimates for Fresh Foods and Their Implications for ERS Loss-Adjusted Food Availability Data. United States Department of Agriculture, Economic Research Service. Economic Information Bulletin Number 155. June 2016.
Caliendo, L. & Parro, F. (2014). “Estimates of the Trade and Welfare Effects of NAFTA.” Review of Economic Studies. July 24, 2014.
CONABIO (2017). Jitomate. Comisión Nacional para el Conocimiento y Uso de la Biodiversidad. Accessed at http://www.biodiversidad.gob.mx/usos/alimentacion/jitomate.html
Cook, R. (2015). Fresh Fruit Market Trends: Context for Key Ripening Fruits. Postharvest Technology Center, UC Davis. Presentation. March 18, 2015.
Day, F. (No Date). Principles of Impact Analysis & IMPLAN Applications. Minnesota IMPLAN Group.
FAO (2011). Global Food Losses and Food Waste: Extent, Causes and Prevention. Food and Agriculture Organization of the United Nations. Accessed at http://www.fao.org/docrep/014/mb060e/mb060e00.pdf
FIRA (2016). Panorama Agroalimentario: Tomate Rojo 2016. Dirección de Investigación y Evalucación Económica y Sectorial. Fideicomisos Instituidos en Relación con la Agricultura. Accessed at https://www.gob.mx/cms/uploads/attachment/file/200635/Panorama_Agroalimentario_Tomate_Rojo_2016.pdf
Gereffi, G. & Fernandez-Stark, K. (2016). Global Value Chain Analysis: A Primer. Second Edition. Center on Globalization, Governance & Competitiveness. Social Science Research Institute. Duke University. July 2016.
Government of Canada (2017). Trade Data Online. Accessed at https://www.ic.gc.ca/app/scr/tdst/tdo/crtr.html?&productType=HS6&lang=eng
IMF (2017). Inflation, Consumer Prices (Annual %). International Monetary Fund, International Financial Statistics and data files. Accessed at http://data.worldbank.org/indicator/FP.CPI.TOTL.ZG?end=2016&locations=MX&start=2008
IRS (2017). Yearly Average Currency Exchange Rates. Internal Revenue Service. Accessed at https://www.irs.gov/individuals/international-taxpayers/yearly-average-currency-exchange-rates
Lucier, G., Pollack, S., Ali, M., & Perez, A. (2006). Fruit and Vegetable Backgrounder. USDA Economic Research Service. VGS-313-01. April 2006. Accessed at https://www.ers.usda.gov/webdocs/publications/39507/13029_vgs31301.pdf?v=41056
McLaughlin, E., Park, K., & Hawkes, G. (2015). Produce Industry Procurement: Changes Preferences and Practices. E.B. 2015-10. Charles H. Dyson School of Applied Economics and Management, College of Agriculture and Life Sciences, Cornell University.
Miller, R. & Blair, P. (2009). Input-Output Analysis: Foundations and Extensions. Second Edition. Cambridge University Press.
National Research Council (2006). Analyzing the U.S. Content of Imports and the Foreign Content of Exports. Washington, DC: The National Academies Press. https://doi.org/10.17226/11612.
27
Mexican Fresh Tomatoes: Agribusiness Value Chain Contributions to the U.S. Economy
Okrent, A. & Alston, J. (2012). The Demand for Disaggregated Food-Away-From-Home and Food-at-Home Products in the United States. Economic Research Report Number 139. United States Department of Agriculture, Economic Research Service. August 2012.
Park, K. (2016). Produce Industry Procurement Study Results, Part I: Describing Retail and Wholesale Produce Buyers. Dyson School of Applied Economics and Management, Cornell University.
Pavlakovich-Kochi, V. & Thompson, G. (2013). Bi-National Business Linkages Associated with Fresh Produce and Production-Sharing: Foundations and Opportunities for Nogales and Santa Cruz County. University of Arizona for Nogales Community Development. June 2013.
Statistics Canada (2017). Canadian International Merchandise Trade Database. Table 990-0007: Imports—Edible Vegetables and Certain Roots and Tubers. Accessed at http://www5.statcan.gc.ca/cimt-cicm/topNCommodi-ties-marchandises?lang=eng&chapterId=7&-sectionId=0§ionLabel=II+-+Veg-etable+products&refMonth=9&re-fYr=2016&freq=12&countryId=874&us-aState=0&provId=1&country=Mexico&data-Transformation=0&arrayId=9900007&topNDe-fault=10&tradeType=3&monthStr=Septem-ber&showCountryFootnote=false
Russo, C., Green, R., & Howitt, R. (2008). Estimation of Supply and Demand Elasticities of California Commodities. Working Paper No. 08-001, June 2008. Department of Agricultural and Resource Economics, University of California, Davis.
SAGARPA (2010). Monograf ía de Cultivos: Jitomate. Subsecretaría de Fomento a los Agronegocios. Secretaría de Agricultura, Ganadería, Desarrollo Rural, Pesca y Alimentación. Accessed at http://www.sag-arpa.gob.mx/agronegocios/Documents/pablo/Documentos/Monografias/Jitomate.pdf
Santos, B., Vallad, G., & Torres, Quezada, E. (2017). Protected Culture for Vegetable and Small Fruit Crops: Types of Structures. University of Florida IFAS Extension. HS1224. Accessed at http://edis.ifas.ufl.edu/pdffiles/HS/HS122400.pdf
Seale, J., Zhang, L., & Traboulsi, M. (2013). “U.S. Import Demand and Supply Response for Fresh Tomatoes, Cantaloupes, Onions, Oranges, and Spinach.” Journal of Agricultural and Applied Economics, Vol 45, No 3, pp 435–452.
Thompson, G. & Wilson, P. (1996). The Organizational Structure of the North American Fresh Tomato Market: Implications for Seasonal Trade Disputes. Selected Paper presented at the Tri-National Research Symposium entitled “NAFTA and Agriculture: Is the Experiment Working?” November 1–2, 1996, San Antonio, Texas.
U.N. Trade Statistics Branch (2017). UN Comtrade Database. Accessed at https://com-trade.un.org/data/
U.S. Bureau of Economic Analysis (2016). Use of Commodities by Industries, Before Redefinitions (Producers’ Prices), 2016. Accessed at https://www.bea.gov/iTable/iTableHtml.cfm?reqid=52&step=102&i-suri=1&5206=4&5205=sec
U.S. Bureau of Labor Statistics (2017). CPI Inflation Calculator. Accessed at https://www.bls.gov/data/inflation_calculator.htm
USDA (2017). Vegetables 2016 Summary. National Agricultural Statistics Service, USDA. Accessed at http://usda.mannlib.cornell.edu/usda/cur-rent/VegeSumm/VegeSumm-02-22-2017_revi-sion.pdf
USDA AMS (2017). Fresh Fruit and Vegetable Shipments: By Commodities, States, and Months. FVAS-4 Calendar Year 2016. May 2017.

28
Mexican Fresh Tomatoes: Agribusiness Value Chain Contributions to the U.S. Economy
USDA AMS (2017b). Shipping Point Averages & Retail Averages. Custom Average Tool. United States Department of Agriculture Agricultural Marketing Service. Accessed at https://cat.ams.usda.gov/app/main#/dashboards/58d-7ca1a733656a41a000029?embed=true&l=-false&r=false&h=false&t=false&volatile=true
USDA ERS (2012). Vegetables and Pulses Outlook. VGS-350. June 28, 2012. Accessed at http://ucce.ucdavis.edu/files/datastore/234-2294.pdf
USDA ERS (2016). Tomatoes. Accessed at https://www.ers.usda.gov/topics/crops/vegeta-bles-pulses/tomatoes.aspx
USDA ERS (2017). Food Availability (Per Capita) Data System. Accessed at https://www.ers.usda.gov/data-products/food-availability-per-capita-data-system/
USDA ERS (2017b). Wholesaling. Accessed at https://www.ers.usda.gov/topics/food-markets-prices/retailing-wholesaling/wholesaling/
USDA FAS (2017). Mexico Tomato Annual: Mexican Tomato Production Continues to Grow. GAIN Report Number MX7023. Global Agricultural Information Network, USDA Foreign Agricultural Service. June 21, 2017.
U.S. Department of Commerce (2017). TradeStats Express. Accessed at http://tse.export.gov/tse/tsehome.aspx
U.S. Federal Reserve (2009). Federal Reserve Statistical Release G.5 A: Foreign Exchange Rates (Annual). Accessed at https://www.feder-alreserve.gov/releases/g5a/20090102/
United States International Trade Commission (2017). Interactive Tariff and Trade DataWeb. Accessed at https://dataweb.usitc.gov/
Varian, H. (2010). Intermediate Microeconomics: A Modern Approach. 8th Edition. W. W. Norton & Company, New York, New York.
Villarreal, M. (2017) U.S.-Mexico Economic Relations: Trends, Issues, and Implications. Congressional Research Service. April 27, 2017.
You, Z., Huang, C., & Epperson, J. (1997). “Demand Elasticities for Fresh Vegetables in the United States.” Journal of International Food & Agribusiness Marketing, 9:2, 57–71.

29
Mexican Fresh Tomatoes: Agribusiness Value Chain Contributions to the U.S. Economy
$0
$0.20
$0.40
$0.60
$0.80
$1.00
$1.20
$1.40
$1.60
Tomato
Retail Price
WholesalePrice
F.O.B.Price
Retail Markup
WholesaleMarkup
Pric
e pe
r Pou
nd
Figure 12. Demonstration of Price Margin or “Markup” Approach
Appendices
Appendix A. Price Margin Approach for Estimating Economic Contribution and Derivation of Estimated Foodservice Price of Tomatoes
This analysis estimates the economic contribu-tion of imported tomatoes using a price margin approach (Figure 12). While purchases of imported Mexican tomatoes at retail grocer establishments might typically be modeled as a simple retail trans-action in input-output analysis, this analysis breaks the total value of retail sales of fresh Mexican tomatoes into value chain components, attributing a portion of final sales along each step in the value chain. This approach is similar to the concept of retail and wholesale margining used in IMPLAN analysis (Day, F., No Date), however, in this case it is done manually using data specific to the tomato trade. Using F.O.B., retail, and wholesale prices, a price “markup” is calculated by subtracting the price paid to the previous value chain actor. This concept is different than value added because the additional value is only net of the cost of tomatoes, not all intermediate input costs.
As data is not available for the foodservice price of tomatoes, a comparable yet distinct margin approach is used to derive an estimate of the food-service price of tomatoes. This foodservice margin approach is different from the approach used for retail or wholesale tomatoes because tomatoes sold by the foodservice industry are no longer sold as tomatoes, but rather as part of a transformed final product. To account for the fact that consum-ers are demanding a transformed final product (for example, a meal in a restaurant) as well as the “service” component of foodservices, this analy-sis does not attribute jobs or spending on other inputs in the foodservice industry to tomatoes, and therefore simply applies a foodservice indus-try markup net of all expenses to the wholesale value of tomatoes. National account input-out-put data from the Bureau of Economic Analysis (BEA, 2016) were used to calculate the average gross operating surplus over all costs for the food services and drinking places industry (NAICS 722) in 2016, calculated at 11.28%. This margin represents the mark-up charged by foodservice establishments and reflects the profits of the industry. Assuming that this mark-up is applied to all components of foodservice production equally,
we estimate the value of foodservice tomatoes by applying that margin to the estimated value of tomatoes purchased by foodservice establishments from wholesale, roughly $1.3 billion in sales. We also account for shrinkage and spoilage estimated at 14.5%, yielding a final estimate of roughly $145 million in foodservice economic activity.
The economic contribution analysis uses the IMPLAN 3.1 model with 2014 data. The analysis was run as using the industry change method for wholesale, retail, and in-bond shipments because the direct economic contributions of Mexican tomatoes represent only a portion of the respec-tive forward-linked industries at the national level, and therefore using the methods applied to the contribution of an entire industry is not appropri-ate. Forward-linked retail and wholesale indus-tries were modeled individually as the value of wholesale and retail sales margins using industry changes in the wholesale and retail sectors, and trucking activity to Canada was modeled under the trucking transportation industry. Both whole-sale and retail were modeled as margins since contributions to the value chain were accounted for in previous calculations and wholesale was removed from the retail spending pattern to avoid double counting backward-linked purchases in the value chain. Forward-linked foodservice activ-ity was measured in terms of business owner gross operating margin and therefore was modeled as a proprietor income change in IMPLAN . This limits the analysis to the estimated foodservice price markup of tomatoes. A proprietor income change is the most appropriate method of mod-eling business owner income net of intermediate inputs, labor, and all other operating costs.

30
Mexican Fresh Tomatoes: Agribusiness Value Chain Contributions to the U.S. Economy
Appendix B. U.S. Consumer Welfare Analysis Details—Price Elasticity of Demand
A variety of studies have estimated own-price elasticity of demand for fresh tomatoes, either exclusively, or as part of a larger basket of goods (Table 10). Russo, Green & Howitt (2008) estimate national demand for a variety of commodities pro-duced in California and estimate the own-price elasticity of tomatoes at -0.32, indicating relatively inelastic demand for fresh tomatoes. You, Huang, & Epperson (1997) estimate price elasticities for the eight most commonly purchased fresh pro-duce items by U.S. consumers and estimate own-price elasticity of demand for tomatoes at -0.36. Other studies have estimated relatively more elas-tic demand for tomatoes, with Okrent & Alston (2012) estimating an own-price elasticity of -0.58 in an analysis of demand for a variety of at-home food items. Other studies incorporate country of origin into their models, such as Jung, VanSickle, & Seale (2005) who estimate elasticities of U.S.
Study Model Elasticity Value
Russo, Green & Howitt (2008) Almost ideal demand system Own-price elasticity of demand for tomatoes -0.32
Jung, VanSickle, & Seale (2005)
First difference, almost ideal demand system
Uncompensated own-price elasticity for Mexico-produced tomatoes -0.42
You, Huang, & Epperson (1997) Almost ideal demand system Uncompensated own-price elasticity of demand for
tomatoes -0.36
Okrent & Alston (2012)
Generalized ordinary differen-tial demand system model
Unconditional own-price elasticity of demand for tomatoes -0.58
Asci, et al (2016) General (nested) model (Rotterdam, AIDS, CBS, NBR)
Cournot (uncompensated) own-price elasticity of demand for Mexico-produced tomatoes -0.72
Cournot (uncompensated) own-price elasticity of demand for Mexico-produced greenhouse tomatoes -0.41
Cournot (uncompensated) own-price elasticity of demand for Mexico-produced field grown tomatoes
-0.39
Table 10. Summary of Literature on Elasticity of Tomato Demand in the United States
ElasticityDecrease in Quantity at Retail (lbs)
Percentage Price Increase Price Increase U.S. Consumer
Surplus Impact
-0.30 164,634,000 16.7% $0.25 -$792,000,000
-0.45 164,634,000 11.1% $0.16 -$528,000,000
-0.60 164,634,000 8.3% $0.12 -$396,000,000
Table 11. Estimated Range of U.S. Consumer Surplus Impact of 5% Decrease in Fresh Tomato Supply at Retail
fresh tomato demand, examining differences in demand for tomatoes from the United States, Mexico, and Canada. They found an uncompen-sated own-price elasticity of demand for Mexican-grown tomatoes of -0.4239 using a first difference, almost ideal demand system model. Finally, Asci, et al. (2016) estimate an own-price elasticity of demand of -0.72 for Mexican-grown tomatoes in aggregate, and an elasticity of -0.39 for Mexican field-grown tomatoes and -0.41 for Mexican greenhouse tomatoes, all calculated at the sample means. This study relies on estimates of price elasticity of demand examining the U.S. supply of fresh tomatoes in aggregate, versus those that differentiate by country of origin.
Observing a range of estimated elasticities in the literature, three approximate uncompen-sated own-price elasticity of demand values were used to produce an estimated range of potential consumer surplus impacts, per Russo, Green & Howitt (2008), Jung, VanSickle, & Seale (2005), You, Huang, & Epperson (1997), and Okrent & Alston (2012) (Table 11).
COLLEGE OF AGRICULTURE & LIFE SCIENCES
CooperativeExtension