metropolitan lighthouse charter school item time facilitator attachments action items opening •...
TRANSCRIPT

We prepare our students for college through a rigorous arts-infused program.
500 Courtlandt Avenue· Bronx, NY 10451 · Ph: 646.915.0025 · Fax: 646.915.0037 www.lighthouse-academies.org
Metropolitan Lighthouse Charter School
We prepare our students for college through a rigorous arts-infused program.
Board of Trustees Thursday, February 6th 2014
6:30 p.m. – 8:30 p.m. 500 Courtlandt Ave.
Call in number: 1-888-394-8197 Passcode #582970 Agenda
Our Mission
We prepare our students for college through a rigorous arts-infused program.
Our Vision All students will be taught by a highly effective teacher in a nurturing environment and will achieve at high levels.
Each student will develop the knowledge, skills and values necessary for responsible citizenship and life- long learning. The impact of our collective efforts will fundamentally change public education.
Agenda Item Time Facilitator Attachments Action Items
Opening • Call the meeting to order • Review of Agenda • Approval of January minutes
5 min.
Ms. Laraway
Agenda Attachment 1- January 9, 2014 Board Minutes
Approval of January 2014 minutes
Sign approved minutes
Action Items
5 min. Ms. Laraway
Committee Reports • Facility Updates • Board Development Committee
recruitment / retreat
• Education Committee Report • Ad Hoc Community Engagement
Committee
10 min.
Mr. Tavares Ms. Haber Ms. Lee Ms. Laraway
Attachment 2–CSSS, Inc. Board
Report
Final Approval of a date/place for the BOT Retreat
Principal’s Report • PAL Dashboard
LHA Report • Renewal Visit and Other Items
20 min.
Ms. Russell Dr. Lewis
Attachment 3 -PALs Monthly Report Attachment 4– LHA Report
Finance • Review January Financial report
10 min. Mr. Robinson Attachment 5- January Financial Report
Approval of January Financial Report (will be sent out under separate cover)
Public Comments 5 min. Ms. Laraway
We prepare our students for college through a rigorous arts-infused program.
500 Courtlandt Avenue· Bronx, NY 10451 · Ph: 646.915.0025 · Fax: 646.915.0037 www.lighthouse-academies.org
Metropolitan Lighthouse Charter School
We prepare our students for college through a rigorous arts-infused program.
Agenda Item Time Facilitator Attachments Action Items Executive Session
Closing • Review of Action Items • BOT Upcoming Member
Renewal: October 2014 (Y. Robinson)
• School Trustee Visit • Next Board Meeting: March 6th • Adjournment
5 min.
Ms. Laraway
Attachments: Attachment 1- January 9, 2014 Board Minutes Attachment 2- CSSS, Inc. Board Report Attachment 3- PALs Monthly Board Report Attachment 4 – LHA Report Attachment 5 – January Financial Report (will be sent out under separate cover)

1
METROPOLITAN LIGHTHOUSE CHARTER SCHOOL (“MetLCS”)
MINUTES OF A MEETING OF THE BOARD OF TRUSTEES HELD ON THURSDAY, JANUARY 9, 2013 AT 6:30PM AT METROPOLITAN LIGHTHOUSE CHARTER SCHOOL, 500 COURTLANDT AVENUE, THE BRONX, NY. Participants in attendance: • Ms. Courtney Russell, Principal, Metropolitan Lighthouse Charter School • Ms. Jessica Haber, Trustee and Secretary • Dr. Robert Lewis, LHA • Mr. Louis Tavares, LHA • Mr. Tim Bryan, Trustee • Ms. Gina Calvache, Trustee • Ms. Kimberly Mack, Trustee • Ms. Lauren Lebental, MetLCS Director of Teacher Leadership • Ms. Ana Gabin, Parent • Ms. Elena Ortiz, Parent • Ms. Shakira Durosinmi, Parent • Ms. Thomasina Moore, Parent and PTA Treasurer • Ms. Gina Calvache, Trustee • Ms. Janice Lee, Trustee • Ms. Jenna DeNicola, MetLCS Teacher Trustees in attendance: • Ms. Anne Laraway, President and Trustee • Ms. Jessica Haber, Trustee and Secretary • Mr. Tim Bryan, Trustee • Dr. Robert Lewis, Trustee • Ms. Gina Calvache, Trustee • Ms. Janice Lee, Trustee Trustees not in attendance: • Mr. Roj Robinson, Treasurer and Trustee • Mr. Jason Rawlins, Trustee Ms. Laraway called the meeting to order at 6:34pm. With 6 Board members present, a quorum was established. Ms. Bryan moved to pass the minutes from the December Board meeting (Attachment 1). Mr. Lewis seconded the motion. The minutes were unanimously approved. Mr. Tavares presented a facilities update. Mr. Tavares discussed a leak in the cafeteria and broken steam pipes that require repair, as well as an estimate for costs of repair and proposed steps for repair. Mr. Lewis discussed a memorandum regarding the charter schools support servicer (Attachment 3). Mr. Lewis led a discussion of the updated Bonus Goals Payout (Attachment 2).

2
Ms. Russell discussed the Principal’s Report, including the PAL Dashboard (Attachment 4) as well as the charter renewal process (Attachment 7). Mr. Lewis presented the LHA Report (Attachments 5, 6, and 8), including the LHA bonus goals for 2012-13 and 2013-14. • Ms. Haber motioned to approve the payout of bonuses for the goals met in 2012-13 and the bonus
structure for 2013-14. Mr. Bryan seconded the motion. The motion was unanimously approved. Mr. Bryan discussed the December Financial Report (Attachment 9). Ms. Haber and Mr. Rawlins discussed Board Development, including the board retreat timing and topics and visits to the school. Ms. Laraway led the public comment section of the meeting. Parents discussed issues including questions about recess. The board heard a report from the PTA. Ms. Laraway discussed closing items. Ms. Bryan motioned to adjourn the meeting at 7:39. Mr. Laraway seconded the motion, which was approved. Signed ____________________________ Jessica Haber
Signed ____________________________ Anne Laraway
Signed ____________________________ Tim Bryan
Signed ____________________________ Janice Lee
Signed ____________________________ Robert Lewis
Signed ____________________________ Kimberly Mack
Signed ____________________________ Gina Calvache

1661 Worcester Road, Suite 203 ▪ Framingham, MA 01701 ▪ Tel 508-626-0904 ▪ www.csssinc.org
January 24, 2014 Dear Board Members, Metropolitan Lighthouse Charter School has contracted with CFM Inc. to provide the services to the MET Lighthouse Charter School. CFM is now doing business as Charter School Support Services, Inc. (CSSS) a nonprofit with 501(c) (3) status. These services ensure compliance with the terms of the school’s current lease on Courtland Avenue.
1. CSSS will arrange for and oversee any repairs needed for the real property at the facility. Minor repairs, such as changing light bulbs or repairing hinges, shall be performed by the school’s on site staff. In addition CSSS shall establish a preventive maintenance and repair history database using its Service Channel™ PM system. The system will include all of the basic building systems, the scheduled preventative maintenance, work order functions and tracking warranty items. At this time the school has not fully implemented the Service Channel system but we are using it to monitor facility work that CSSS is supporting in the temporary facility.
2. Procurement of school operational services such as, FFE, field trip transportation, and other goods and services.
3. Contract development and support for third party vendor services selected by the school.
4. An annual safety walk through that includes an extensive checklist reviewed with school leadership.
Each month we will send a report to the Board on the items listed below. In addition we will update the Board on any capital projects.
All maintenance items have been added to CSSS’ Service Channel. These items are then sent out as Preventative Maintenance Work Orders to vendors approved by the school.
Building and Grounds Maintenance and Repairs
This month there were 2 preventative maintenance work orders to be performed. 1 has been completed. As an example Castle Oil completed a review on boiler. In addition there were 3 work orders for repairs in the schools. 2 have been completed. As an example In late December several steam system leaks and a room

1661 Worcester Road, Suite 203 ▪ Framingham, MA 01701 ▪ Tel 508-626-0904 ▪ www.csssinc.org
without heat were reported to CSSS. Balancing the need to keep heat running continuously with keeping repair costs at a minimum, CSSS engaged Signature Construction Group to assess and fix the situation in early January. This was done with minimal disruption to the school and without sinking major repair costs into the system as it will no longer be needed in 2-3 months. There were 0 acts of vandalism at the METLCS.
AHERA Compliance The school is up-to-date with their AHERA compliance.
Procurement We are currently working on renewal contracts for the FY15 school year. The renewals include Furniture, Fixture and Equipment (FFE) Services, Janitorial Services.
Capital Projects I toured the site with Ms. Russell on January 22. Construction of the new facility remains on budget. The work is behind schedule due to several factors: weather, additional excavation that was required and the need to determine how best to support the banking behind the school. At this time we still expect to complete work in time for the next school year.
Other We have prepared a detail plan for moving the school to the new site. The plan includes training requirements for the school’s custodian for certifications required in NYC.
Please let me know if you have any questions on these matters. Sincerely,
Michael Ronan CEO Cc. Phillis Nichols Anderson, Senior Vice President Midwest Luis Taveras, Regional Operations Manager

LHA Network Monthly Data Tracker, 2013-2014
Updated with data for: November 2013
Some cells in this sheet are protected to prevent accidental changes to formulas.To unlock, use the password "dashboard."
Please update data in yellow cells only, then change cell fill color to blue . If data have not changed, just change cell fill color to blue .
SAMPLE
Goal MetricSample School
(K-12)November December January
Data Certification and Date Line #I certify that these data are accurate and complete to the best of my knowledge. (After updating data, please enter your initials and today's date in this row under the column for your school):
ES 10-2-13 CR CR CR
1a Grade 10: Number of currently-enrolled grade 10 scholars who have already passed at least one AP exam. 01b Grade 10: Number of currently-enrolled grade 10 scholars who have already passed at least one dual-enrollment college course. 0
1c Grade 10: Number of currently-enrolled grade 10 scholars who have passed NEITHER an AP exam NOR a dual-enrollment college course. 50
1dGrade 10: Out of the grade 10 scholars in line 1c (those who have not yet passed any AP exams or dual-enrollment college courses), the number who are currently taking at least one AP or dual-enrollment college course.
5
1e Grade 10: Total number of scholars currently enrolled in grade 10. 501f CALCULATION: Percent of 10th grade scholars who have already passed at least one AP exam or dual-enrollment course. 0.0%
1g CALCULATION: Percent of 10th grade scholars who have not yet passed, but are currently enrolled in at least one AP or dual-enrollment course. 10.0%
1h Grade 11: Number of currently-enrolled grade 11 scholars who have already passed at least one AP exam. 01i Grade 11: Number of currently-enrolled grade 11 scholars who have already passed at least one dual-enrollment college course. 6
1j Grade 11: Number of currently-enrolled grade 11 scholars who have passed NEITHER an AP exam NOR a dual-enrollment college course. 43
1kGrade 11: Out of the grade 11 scholars in line 1j (those who have not yet passed any AP exams or dual-enrollment college courses), the number who are currently taking at least one AP or dual-enrollment college course.
25
1l Grade 11: Total number of scholars currently enrolled in grade 11. 491m CALCULATION: Percent of 11th grade scholars who have already passed at least one AP exam or dual-enrollment course. 12.2%
1n CALCULATION: Percent of 11th grade scholars who have not yet passed, but are currently enrolled in at least one AP or dual-enrollment course. 51.0%
1o Grade 12: Number of currently-enrolled grade 12 scholars who have already passed at least one AP exam. 41p Grade 12: Number of currently-enrolled grade 12 scholars who have already passed at least one dual-enrollment college course. 15
1q Grade 12: Number of currently-enrolled grade 12 scholars who have passed NEITHER an AP exam NOR a dual-enrollment college course. 25
1rGrade 12: Out of the grade 12 scholars in line 1q (those who have not yet passed any AP exams or dual-enrollment college courses), the number who are currently taking at least one AP or dual-enrollment college course.
20
1s Grade 12: Total number of scholars currently enrolled in grade 12. 441t CALCULATION: Percent of 12th grade scholars who have already passed at least one AP exam or dual-enrollment course. 43.2%
1u CALCULATION: Percent of 12th grade scholars who have not yet passed, but are currently enrolled in at least one AP or dual-enrollment course. 45.5%
2a NWEA fall-to-winter growth: Average RIT point growth achieved in READING:2b NWEA fall-to-winter growth: Average fall-to-spring RIT point growth projections in READING:2c NWEA fall-to-winter growth: Number of scholars tested both fall and winter in READING:2d CALCULATION: Percent of projected fall-to-spring growth achieved so far in READING:2e NWEA fall-to-winter growth: Average RIT point growth achieved in MATH:2f NWEA fall-to-winter growth: Average fall-to-spring RIT point growth projections in MATH:2g NWEA fall-to-winter growth: Number of scholars tested both fall and winter in MATH:2h CALCULATION: Percent of projected fall-to-spring growth achieved so far in MATH:2i NWEA fall-to-spring growth: Average RIT point growth achieved in READING:2j NWEA fall-to-spring growth: Average fall-to-spring RIT point growth projections in READING (revised for full-year cohort):2k NWEA fall-to-spring growth: Number of scholars tested both fall and spring in READING:2l CALCULATION: Percent of projected fall-to-spring growth achieved in READING:
2m NWEA fall-to-spring growth: Average RIT point growth achieved in MATH:2n NWEA fall-to-spring growth: Average fall-to-spring RIT point growth projections in MATH:2o NWEA fall-to-spring growth: Number of scholars tested both fall and spring in MATH:2p CALCULATION: Percent of projected fall-to-spring growth achieved in MATH:2q Growth of lowest quartile: Average RIT point growth achieved by bottom quartile in READING:2r Growth of lowest quartile: Average fall-to-spring RIT point growth projections for bottom quartile in READING:2s Growth of lowest quartile: Number of scholars in bottom quartile in fall and with growth data in READING:2t CALCULATION: Percent of projected fall-to-spring growth achieved by bottom quartile in READING:2u Growth of lowest quartile: Average RIT point growth achieved by bottom quartile in MATH:2v Growth of lowest quartile: Average fall-to-spring RIT point growth projections for bottom quartile in MATH:2w Growth of lowest quartile: Number of scholars in bottom quartile in fall and with growth data in MATH:2x CALCULATION: Percent of projected fall-to-spring growth achieved by bottom quartile in MATH:3a Number of scholars proficient on interim assessment #1 for ELA: 29 29 293b Number of scholars taking interim assessment #1 for ELA: 300 300 3003c CALCULATION: Percent of scholars proficient on interim assessment #1 for ELA: 9.7% 9.7% 9.7%
Question #1: Are our scholars taking rigorous courses?
Aspirational Goal: All graduating scholars will have earned college credit by either taking and passing an AP
exam or successfully earning credit through dual enrollment in a college course.
Question #2: Are our scholars learning at an accelerated rate?
Aspirational Goal: Part 1 (high average growth among all scholars)
For both math and reading, Lighthouse K-8 scholars in participating schools will achieve an average of at least
120% (1.2 years) of their projected growth on the NWEA MAP assessments each year. Growth will be measured between the fall and spring terms and also from one
spring term to the next.
Part 2 (highly accelerated growth for scholars who are behind)
For both math and reading, those K-8 Lighthouse scholars in participating schools whose baseline score falls in the bottom quartile according to national norms will achieve an average of at least 150% (1.5 years) of their projected
growth on the NWEA MAP assessments each year. Growth will be measured between the fall and spring
terms and also from one spring term to the next.

3d Number of scholars proficient on interim assessment #1 for MATH: 54 54 543e Number of scholars taking interim assessment #1 for MATH: 300 300 3003f CALCULATION: Percent of scholars proficient on interim assessment #1 for MATH: 18.0% 18.0% 18.0%3g Number of scholars proficient on interim assessment #2 for ELA:3h Number of scholars taking interim assessment #2 for ELA:3i CALCULATION: Percent of scholars proficient on interim assessment #2 for ELA:3j Number of scholars proficient on interim assessment #2 for MATH:3k Number of scholars taking interim assessment #2 for MATH:3l CALCULATION: Percent of scholars proficient on interim assessment #2 for MATH:
3m Number of scholars proficient on interim assessment #3 for ELA:3n Number of scholars taking interim assessment #3 for ELA:3o CALCULATION: Percent of scholars proficient on interim assessment #3 for ELA:3p Number of scholars proficient on interim assessment #3 for MATH:3q Number of scholars taking interim assessment #3 for MATH:3r CALCULATION: Percent of scholars proficient on interim assessment #3 for MATH:3s Number of scholars proficient on interim assessment #4 for ELA:3t Number of scholars taking interim assessment #4 for ELA:3u CALCULATION: Percent of scholars proficient on interim assessment #4 for ELA:3v Number of scholars proficient on interim assessment #4 for MATH:3w Number of scholars taking interim assessment #4 for MATH:3x CALCULATION: Percent of scholars proficient on interim assessment #4 for MATH:3y Number of scholars proficient on interim assessment #5 for ELA:3z Number of scholars taking interim assessment #5 for ELA:
3aa CALCULATION: Percent of scholars proficient on interim assessment #5 for ELA:3ab Number of scholars proficient on interim assessment #5 for MATH:3ac Number of scholars taking interim assessment #5 for MATH:3ad CALCULATION: Percent of scholars proficient on interim assessment #5 for MATH:3ae Number of scholars proficient on state test for ELA:3af Number of scholars taking state test for ELA:3ag CALCULATION: Percent of scholars proficient on state test for ELA:3ah Number of scholars proficient on state test for MATH:3ai Number of scholars taking state test for MATH:3aj CALCULATION: Percent of scholars proficient on state test for MATH:3ak Fall NWEA: Number of K-8 scholars in top quartile in READING. 55 55 553al Fall NWEA: Number of K-8 scholars in second quartile in READING. 90 90 90
3am Fall NWEA: Number of K-8 scholars in third quartile in READING. 95 95 953an Fall NWEA: Number of K-8 scholars in bottom quartile in READING. 56 56 563ao Fall NWEA: CALCULATION: Percent of scholars in top quartile in READING. 18.6% 18.6% 18.6%3ap Fall NWEA: Number of K-8 scholars in top quartile in MATH. 32 32 323aq Fall NWEA: Number of K-8 scholars in second quartile in MATH. 96 96 963ar Fall NWEA: Number of K-8 scholars in third quartile in MATH. 86 86 863as Fall NWEA: Number of K-8 scholars in bottom quartile in MATH. 84 84 843at Fall NWEA: CALCULATION: Percent of scholars in top quartile in MATH. 10.7% 10.7% 10.7%3au Winter NWEA: Number of K-8 scholars in top quartile in READING.3av Winter NWEA: Number of K-8 scholars in second quartile in READING.3aw Winter NWEA: Number of K-8 scholars in third quartile in READING.3ax Winter NWEA: Number of K-8 scholars in bottom quartile in READING.3ay Winter NWEA: CALCULATION: Percent of scholars in top quartile in READING.3az Winter NWEA: Number of K-8 scholars in top quartile in MATH.3ba Winter NWEA: Number of K-8 scholars in second quartile in MATH.3bb Winter NWEA: Number of K-8 scholars in third quartile in MATH.3bc Winter NWEA: Number of K-8 scholars in bottom quartile in MATH.3bd Winter NWEA: CALCULATION: Percent of scholars in top quartile in MATH.3be Spring NWEA: Number of K-8 scholars in top quartile in READING.3bf Spring NWEA: Number of K-8 scholars in second quartile in READING.3bg Spring NWEA: Number of K-8 scholars in third quartile in READING.3bh Spring NWEA: Number of K-8 scholars in bottom quartile in READING.3bi Spring NWEA: CALCULATION: Percent of scholars in top quartile in READING.3bj Spring NWEA: Number of K-8 scholars in top quartile in MATH.3bk Spring NWEA: Number of K-8 scholars in second quartile in MATH.3bl Spring NWEA: Number of K-8 scholars in third quartile in MATH.
3bm Spring NWEA: Number of K-8 scholars in bottom quartile in MATH.3bn Spring NWEA: CALCULATION: Percent of scholars in top quartile in MATH.
3bo EXPLORE: Number of 9th graders who have met college-readiness benchmark on EXPLORE (include best score from 8th or 9th grade). 17
3bp EXPLORE: Number of 9th graders who have taken EXPLORE at least once. 463bq EXPLORE: CALCULATION: Percent of 9th-grade EXPLORE test-takers who met college-readiness benchmark. 37.0%3br PLAN: Number of 10th graders who have met college-readiness benchmark on PLAN. 273bs PLAN: Number of 10th graders who have taken PLAN at least once. 483bt PLAN: CALCULATION: Percent of 10th-grade PLAN test-takers who met college-readiness benchmark. 56.3%
Question #3: Do external standardized assessments indicate that our scholars are academically on track for
college success?
Part II: High Achievement on Nationally-Normed Assessments
Aspirational Goal:Metrics for grades 9-12:
All scholars will take the EXPLORE/PLAN/ACT series of assessments. At least 75% of scholars will meet the
college readiness benchmarks on each exam .
Metrics for grades K-8:At least 75% of K-8 scholars in participating schools will
be in the top quartile on the NWEA MAP reading assessment and at least 75% of K-8 scholars will be in the
top quartile on the math assessment in the spring.
Question #3: Do external standardized assessments indicate that our scholars are academically on track for
college success?
Part I: Meeting Standards
Aspirational Goal:100% of scholars will score proficient on state grade-level
assessments in ELA and math.

3bu ACT: Number of 11th graders who have met college-readiness benchmark on ACT (use best score if scholar has taken test more than once). 0
3bv ACT: Number of 11th graders who have taken ACT at least once. 03bw ACT: CALCULATION: Percent of 11th-grade ACT test-takers who met college-readiness benchmark.
3bx ACT: Number of 12th graders who have met college-readiness benchmark on ACT (use best score if scholar has taken test more than once). 25
3by ACT: Number of 12th graders who have taken ACT at least once. 443bz ACT: CALCULATION: Percent of 12th-grade ACT test-takers who met college-readiness benchmark. 56.8%4a Cohort of entering 9th graders in fall 2010 (graduation in 2014): Number of scholars initially in cohort 52
4bCohort of entering 9th graders in fall 2010 (graduation in 2014): Number who have met state criteria to be removed from cohort (e.g. transferred into another diploma-granting high school, emigrated, or died).
11
4cCohort of entering 9th graders in fall 2010 (graduation in 2014): Number of these scholars who have left the school WITHOUT meeting state criteria to be removed from cohort (e.g. dropped out).
1
4dCohort of entering 9th graders in fall 2010 (graduation in 2014) CALCULATION: Number of scholars from 9th grade cohort entering fall 2010 who are still enrolled.
40
4eCohort of entering 9th graders in fall 2010 (graduation in 2014) CALCULATION: Projected maximum graduation rate for 9th grade cohort entering fall 2010.
97.6%
4f Cohort of entering 9th graders in fall 2010 (graduation in 2014): Number of these scholars who are on track to graduate in four years. 39
4gCohort of entering 9th graders in fall 2010 (graduation in 2014) CALCULATION: Number of scholars from 9th grade cohort entering fall 2010 who are still enrolled but not on track to graduate in four years.
1
4h Cohort of entering 9th graders in fall 2011 (graduation in 2015): Number of scholars initially in cohort 50
4iCohort of entering 9th graders in fall 2011 (graduation in 2015): Number who have met state criteria to be removed from cohort (e.g. transferred into another diploma-granting high school, emigrated, or died).
6
4jCohort of entering 9th graders in fall 2011 (graduation in 2015): Number of these scholars who have left the school WITHOUT meeting state criteria to be removed from cohort (e.g. dropped out).
0
4kCohort of entering 9th graders in fall 2011 (graduation in 2015) CALCULATION: Number of scholars from 9th grade cohort entering fall 2011 who are still enrolled.
44
4lCohort of entering 9th graders in fall 2011 (graduation in 2015) CALCULATION: Projected maximum graduation rate for 9th grade cohort entering fall 2011.
100.0%
4m Cohort of entering 9th graders in fall 2011 (graduation in 2015): Number of these scholars who are on track to graduate in four years. 43
4nCohort of entering 9th graders in fall 2011 (graduation in 2015) CALCULATION: Number of scholars from 9th grade cohort entering fall 2011 who are still enrolled but not on track to graduate in four years.
1
4o Cohort of entering 9th graders in fall 2012 (graduation in 2016): Number of scholars initially in cohort 50
4pCohort of entering 9th graders in fall 2012 (graduation in 2016): Number who have met state criteria to be removed from cohort (e.g. transferred into another diploma-granting high school, emigrated, or died).
5
4qCohort of entering 9th graders in fall 2012 (graduation in 2016): Number of these scholars who have left the school WITHOUT meeting state criteria to be removed from cohort (e.g. dropped out).
0
4rCohort of entering 9th graders in fall 2012 (graduation in 2016) CALCULATION: Number of scholars from 9th grade cohort entering fall 2012 who are still enrolled.
45
4sCohort of entering 9th graders in fall 2012 (graduation in 2016) CALCULATION: Projected maximum graduation rate for 9th grade cohort entering fall 2012.
100.0%
4t Cohort of entering 9th graders in fall 2012 (graduation in 2016): Number of these scholars who are on track to graduate in four years. 45
4uCohort of entering 9th graders in fall 2012 (graduation in 2016) CALCULATION: Number of scholars from 9th grade cohort entering fall 2012 who are still enrolled but not on track to graduate in four years.
0
4v Cohort of entering 9th graders in fall 2013 (graduation in 2017): Number of scholars initially in cohort 51
4wCohort of entering 9th graders in fall 2013 (graduation in 2017): Number who have met state criteria to be removed from cohort (e.g. transferred into another diploma-granting high school, emigrated, or died).
1
4xCohort of entering 9th graders in fall 2013 (graduation in 2017): Number of these scholars who have left the school WITHOUT meeting state criteria to be removed from cohort (e.g. dropped out).
0
4yCohort of entering 9th graders in fall 2013 (graduation in 2017) CALCULATION: Number of scholars from 9th grade cohort entering fall 2013 who are still enrolled.
50
4zCohort of entering 9th graders in fall 2013 (graduation in 2017) CALCULATION: Projected maximum graduation rate for 9th grade cohort entering fall 2013.
100.0%
4aa Cohort of entering 9th graders in fall 2013 (graduation in 2017): Number of these scholars who are on track to graduate in four years. 50
4abCohort of entering 9th graders in fall 2013 (graduation in 2017) CALCULATION: Number of scholars from 9th grade cohort entering fall 2013 who are still enrolled but not on track to graduate in four years.
0
4ac All scholars currently in grade 12 (regardless of when they entered): Total number enrolled 444ad All scholars currently in grade 12 (regardless of when they entered): Number on track to graduate in spring 2014. 414ae All scholars currently in grade 11 (regardless of when they entered): Total number enrolled 494af All scholars currently in grade 11 (regardless of when they entered): Number on track to graduate in spring 2015. 484ag All scholars currently in grade 10 (regardless of when they entered): Total number enrolled 504ah All scholars currently in grade 10 (regardless of when they entered): Number on track to graduate in spring 2016. 464ai All scholars currently in grade 9 (regardless of when they entered): Total number enrolled 504aj All scholars currently in grade 9 (regardless of when they entered): Number on track to graduate in spring 2017. 50
Question #4: Are our scholars graduating on time?
Aspirational Goal:100% of scholars enrolled at LHA since at least 9th grade will graduate high school in 4 years; 90% of scholars who
join us after 9th grade will graduate high school in 4 years and 100% of scholars who join us after 9th grade will
graduate high school in 5 years.

5a Number of 12th-grade scholars already accepted to at least one four-year college.
5b Number of 12th-grade scholars who have applied to at least one four-year college.5c Total number of applications to four-year colleges submitted by members of the 12th grade class.5d CALCULATION: Number of scholars currently in grade 12 (from above) 445e CALCULATION: Percent of 12th-grade scholars already accepted to at least one four-year college. 0.0%5f CALCULATION: Average number of applications submitted per scholar. 0
A1 School's average daily attendance (ADA) for Month 607.5 293.24 300.79 289.76
A2 School's average daily membership (ADM) for Month 615.5 310.24 313 315.35A3 CALCULATION: School's attendance rate for November 98.7% 94.5% 96.1% 91.9%A4 School's average daily attendance (ADA) year-to-date 599.8 177.63 190A5 School's average daily membership (ADM) year-to-date 614.8 177.63A6 CALCULATION: School's attendance rate year-to-date: 97.6% 107.0%
B1 Number of scholars who had a parent/guardian participate in a conference for QUARTER 1 260 260 260
B2 Number of scholars enrolled during QUARTER 1 (at time of conferences) 302 302 302B3 CALCULATION: School's family conference participation rate for QUARTER 1: 86.1% 86.1% 86.1%B4 Number of scholars who had a parent/guardian participate in a conference for QUARTER 2B5 Number of scholars enrolled during QUARTER 2 (at time of conferences)B6 CALCULATION: School's family conference participation rate for QUARTER 2:B7 Number of scholars who had a parent/guardian participate in a conference for QUARTER 3B8 Number of scholars enrolled during QUARTER 3 (at time of conferences)B9 CALCULATION: School's family conference participation rate for QUARTER 3:
B10 Number of scholars who had a parent/guardian participate in a conference for QUARTER 4B11 Number of scholars enrolled during QUARTER 4 (at time of conferences)B12 CALCULATION: School's family conference participation rate for QUARTER 4:B13 CALCULATION: School's family conference participation rate for ENTIRE YEAR:
C1 QUARTER 1: Number of families who "agree" or "completely agree" they would recommend the school to other families.
C2 QUARTER 1: Total number of families who responded to survey question about recommending the school to other families.C3 QUARTER 1: Total number of scholars who had a parent or guardian complete the survey.C4 Quarter 1 Satisfaction RateC5 CALCULATION: Survey response rate (QUARTER 1): 0.0% 0.0% 0.0%C6 QUARTER 2: Number of families who "agree" or "completely agree" they would recommend the school to other families.C7 QUARTER 2: Total number of families who responded to survey question about recommending the school to other families.C8 QUARTER 2: Total number of scholars who had a parent or guardian complete the survey.C9 Quarter 2 Satisfaction Rate
C10 CALCULATION: Survey response rate (QUARTER 2):C11 QUARTER 3: Number of families who "agree" or "completely agree" they would recommend the school to other families.C12 QUARTER 3: Total number of families who responded to survey question about recommending the school to other families.C13 QUARTER 3: Total number of scholars who had a parent or guardian complete the survey.C14 Quarter 3 Satisfaction RateC15 CALCULATION: Survey response rate (QUARTER 3):C16 QUARTER 4: Number of families who "agree" or "completely agree" they would recommend the school to other families.C17 QUARTER 4: Total number of families who responded to survey question about recommending the school to other families.C18 QUARTER 4: Total number of scholars who had a parent or guardian complete the survey.C19 Quarter 4 Satisfaction RateC20 CALCULATION: Survey response rate (QUARTER 4):
D1 School's enrollment as of fall count day (Oct. 1 if school does not have a fall count day). 617 303 303 303
D2 Number of those scholars enrolled on count day who are still enrolled (excludes new/replacement students who enrolled after fall count day). 303 303 303
D3 School's current enrollment (all scholars) 303 314 317D4 CALCULATION: Percent of count-day students who are still enrolled: 0.0% 100.0% 100.0% 100.0%E1 Total number of weekly observation sessions completed by instructional coaches in month 190 75 70 91E2 Total number of weekly observations sessions requiredIN month 204 75 75 100E3 Percent of observation sessions completed IN current month: 93.1% 100.0% 93.3% 91.0%E4 Total number of weekly in-person feedback meetings completed by instructional coachesIN month 186 88 66 88E5 Total number of weekly in-person feedback meetings required IN current month. 204 75 75 100E6 Percent of in-person feedback meetings completed IN current month: 91.2% 117.3% 88.0% 88.0%E7 Total number of weekly observation sessions completed by instructional coaches YEAR-TO-DATE. 254 194 264 355E8 Total number of weekly observations sessions required YEAR-TO-DATE (based on number of teachers and weeks of school) 306 340 415 515E9 Percent of observation sessions completed YEAR-TO-DATE 83.0% 57.1% 63.6% 68.9%
E10 Total number of weekly in-person feedback meetings completed by instructional coaches YEAR-TO-DATE. 231 245 311 311
E11 Total number of weekly in-person feedback meetings required YEAR-TO-DATE (based on number of teachers and weeks of school) 306 340 415 515
Question #5: How many of our graduating scholars are accepted to college?
Aspirational Goal:100% of 12th grade graduates are accepted to at least
one four-year college.
Process Question A: Are our scholars coming to school every day?
Process Question B: Are our scholars’ families actively supporting their path towards college?
Process Question C: Are families satisfied with the education their scholar is receiving?
Process Question D: Are our scholars staying with us?
Process Question E: Are we providing frequent and

E12 Percent of in-person feedback meetings completed YEAR-TO-DATE 75.5% 72.1% 74.9% 60.4%
E13 FALL STAFF SURVEY: Number of teachers who "agree" or "completely agree" the coaching and feedback they receive are helpful to them.
E14 FALL STAFF SURVEY: Number of teachers who answered question about whether the coaching and feedback they receive are helpful to them.
E15 CALCULATION: Percent of teachers who "agree" or "completely agree" the coaching and feedback they receive are helpful to them (FALL SURVEY).
E16 SPRING STAFF SURVEY: Number of teachers who "agree" or "completely agree" the coaching and feedback they receive are helpful to them.
E17 SPRING STAFF SURVEY: Number of teachers who answered question about whether the coaching and feedback they receive are helpful to them.
E18 CALCULATION: Percent of teachers who "agree" or "completely agree" the coaching and feedback they receive are helpful to them (SPRING SURVEY).
F1 FALL STAFF SURVEY: Number of staff who "agree" or "completely agree" they are satisfied with their job.
F2 FALL STAFF SURVEY: Number of staff who answered question about whether they are satisfied with their job.F3 CALCULATION: Percent of staff who are satisfied with their job (FALL SURVEY).F4 FALL STAFF SURVEY: Number of staff who "agree" or "completely agree" they are proud to tell others they work at their school.
F5 FALL STAFF SURVEY: Number of staff who answered question about whether they are proud to tell others they work at their school.
F6 CALCULATION: Percent of staff who are proud to tell others they work at their school (FALL SURVEY).
F7 SPRING STAFF SURVEY: Number of staff who "agree" or "completely agree" they are satisfied with their job.
F8 SPRING STAFF SURVEY: Number of staff who answered question about whether they are satisfied with their job.F9 CALCULATION: Percent of staff who are satisfied with their job (SPRING SURVEY).
F10 SPRING STAFF SURVEY: Number of staff who "agree" or "completely agree" they are proud to tell others they work at their school.
F11 SPRING STAFF SURVEY: Number of staff who answered question about whether they are proud to tell others they work at their school.
F12 CALCULATION: Percent of staff who are proud to tell others they work at their school (SPRING SURVEY).
G1 Number of teachers employed on Fall 2013 count day (Oct. 1 if school does not have a fall count day). 51 24 24 24G2 Number of those teachers employed on Fall 2013 count day who are still employed (excludes new/replacement staff). 24 25 25G3 Number of teachers currently employed (all teachers) 24 25 25G4 CALCULATION: Percent of count-day teachers still employed: 0.0% 100.0% 104.2% 104.2%
Process Question G: Are our teachers staying at Lighthouse?
Process Question E: Are we providing frequent and effective coaching to all of our teachers?
Process Question F: Are we building a healthy staff culture?
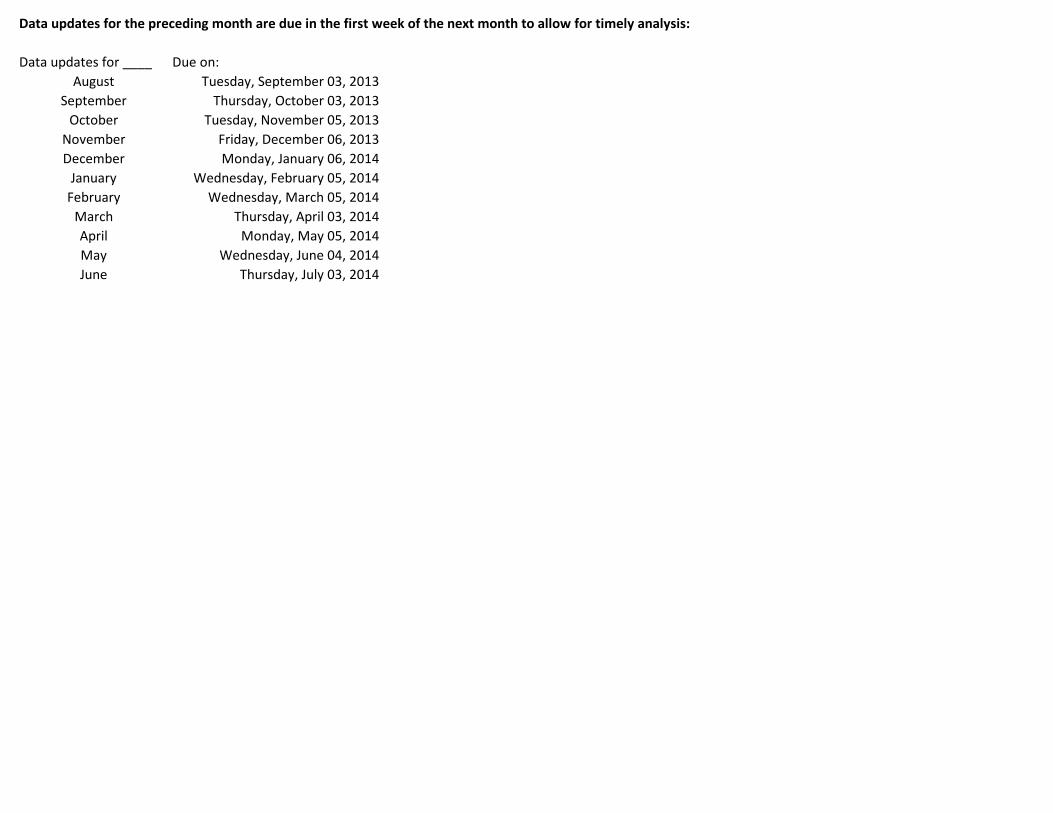
Data updates for the preceding month are due in the first week of the next month to allow for timely analysis:
Data updates for ____ Due on:August Tuesday, September 03, 2013
September Thursday, October 03, 2013October Tuesday, November 05, 2013
November Friday, December 06, 2013December Monday, January 06, 2014
January Wednesday, February 05, 2014February Wednesday, March 05, 2014
March Thursday, April 03, 2014April Monday, May 05, 2014May Wednesday, June 04, 2014June Thursday, July 03, 2014

Dashboard Data Entry Instructions
Thank you for your time and support with helping to monitor key indicators of progress toward our goals with our new network dashboard.This tool is designed to help school leaders, regional vice presidents, and LHA network leaders review key metrics and address any problems regularly during the year, while there is still time to find solutions.This is the first year we are trying this, and we expect there may be a few hiccups and adjustments needed along the way. Please help us by sharing any questions or feedback with your VP to share with the RDS team.
1. Data should be entered on the due date each month by the principal of each building. School staff can and should assist with gathering the data/pulling reports.
2. Please use the "check-out" function on the Prism when updating your school's data. Please have all your numbers ready to go before checking the file out and then check it back in promptly. This way, you will need to check it out for only a few minutes and others will have the opportunity to enter their data.
3. Enter data only in cells shaded yellow and only in the column for your school. After entering/updating data, please change the cell color from yellow to blue to indicate it has been updated.
4. Text explaining where to find the relevant data should pop up in most data -entry cells when you click on them. But if you have questions about what something means, please ask.
5. When done entering/updating data for the month, please enter your initials and the date in row #9.
6. Within one week after all schools have entered their data, other tabs in the dashboard file will be updated with charts to graphically display key results.

80.0%
82.0%
84.0%
86.0%
88.0%
90.0%
92.0%
94.0%
96.0%
98.0%
100.0%
November
Attendance rate by School for Month of August

90%
95%
100%
105%
110%
115%
120%
November
Percent of Weekly Classroom Observations and Feedback Meetings Completed during Month of August, by School
Percent of observation sessions completed IN current month: Percent of in-person feedback meetings completed IN current month:

Metric
Percent of observation
sessions completed
Percent of feedback meetings
completed
Total coaching sessions
completed (obs + feedback)
Bronx(K-7 only) 100.0% 100.0% 52Potomac(pre-K-8) 150.0% 96.9% 79
Jacksonville(Main; K-6) 70.0% 60.0% 52Jacksonville CPA(7-10) 125.0% 100.0% 36
Flightline(5-8) 62.5% 70.8% 32Pine Bluff(K-6) 80.0% 100.0% 27Tulsa(pre-K-5) 95.0% 80.0% 54
Indianapolis(K-7) 90.4% 55.8% 152Indianapolis CPA(8-12) 86.8% 86.8% 132
Monument(K-8) 58.6% 59.5% 180Monument CPA(9-11) 150.0% 75.0% 63
East Chicago(K-7) 139.5% 27.2% 135Gary Primary(K-2) 100.0% 80.0% 46
Gary Intermediate(3-7) 92.1% 62.9% 138
BLCS PLPCS
JLCS
JLCPA
JLCS-FL
PBLCS
TLCS
ILCS
ILCPA
MLCS
MLCPA
ECLCS
Gary K-2
Gary 3-7
0%
20%
40%
60%
80%
100%
120%
0% 20% 40% 60% 80% 100% 120% 140% 160% 180%
Perc
ent o
f req
uire
d w
eekl
y fe
edba
ck m
eetin
gs c
ompl
eted
Percent of required weekly classroom observations completed
LHA Coaching Model Implementation during August 2013 (Bubble size reflects total number of observations and feedback sessions completed in each school)
Lighthouse Academies®
1661 Worcester Rd, Suite 207 ∙ Framingham, MA 01701 ∙ Tel 508.626.0901 ∙ Fax 508.626.0905 www.lighthouse-academies.org
Challenge + Arts Infusion = Transformative Opportunities
MetLCS RVP Report (February 2014)
1. NYCDOE Public Hearing and Renewal Visit: The Public Hearing regarding MetLCS’ charter renewal on January 15th was well-attended by MetLCS parents, students, and staff. All public comments were very supportive of the work that Ms. Russell and her staff have done to serve the community during the expiring charter term. In addition, the MetLCS renewal visit (January 16th-17th) went well based upon the final debriefing session with the NYCDOE at the end of their visit. The authorizers however, did identify an area in the renewal narrative that that may require a revision.
2. Service Agreement: A meeting with Mike Ronan regarding the service agreement renewal can be scheduled at a time that is convenient for the BOT. I will gladly assist the BOT in setting up the meeting.

Lighthouse Academies®
FINANCIAL REPORT
OF METROPOLITAN LIGHTHOUSE CHARTER SCHOOL
JANUARY 2013 January 31, 2014 To The Board of Trustees of Metropolitan Lighthouse Charter School (MET) From: Linda Ahronian, Controller – NY, WI, DC, IL Lighthouse Academies, Inc (LHA) Cc: Otty Westenfield, CFO Lighthouse Academies, Inc. (LHA) Enclosures:
- Financial statements for the seven months ended January 31, 2014. Statement of Financial Position Statement of Activities
Executive Summary: Dec 13 Jan 14 Dec 13 Jan 14EOM Net Assets 2,674,136 2,740,482 FY14 Enrollment Target 306 306 YTD Net Income / (Loss) 455,814 497,412 EOM Enrollment 309.5 317 FY14 Forecast Net Income / (Loss)
221,581 221,581 Total Wait List 158 158
Highlights:
Statement of Financial Position
Cash o Total cash on January 31, 2014 is $3.1M. Deposits are held in TD Bank, Citibank
(escrow), Ridgewood Savings Bank, Chase Bank and Bank of America. All deposits are either insured by FDIC or as public funds.
Grants Receivables include $22.3K in federal grants, Title I, II and Race to the Top for FY14, $2.2K for ERATE.
The $150K check to the Church of St.Puis for the base rent at the FY14 temporary facility as well as the $195K to Signature Construction for renovations are being amortized 1/12th each month until fully expensed at yearend. A $67K credit was received towards rent expense and is amortized monthly as well. Gross amount getting amortized is $279K.
Accrued Expenses includes 10 days accrued payroll through January 31, 2014.

Statement of Activities
Per Pupil Revenue is recorded at 1/12th of the budgeted amount and is adjusted during the year as needed.
Some expenses need a budget increase such as Teacher Leader Fellow, Staff Recruitment, Educational Consultant and Bank Charges
Other variances are explained in the comments section of the Statement of Activities in anticipation of Board inquiries.
Other
Work has begun on the FY15 budget. The data being collected will be compiled into a draft budget which will undergo several levels of review. The current plan is to have a first draft ready for Board review at the April 2014 Board meeting.

Metropolitan Lighthouse Charter SchoolStatement of Financial Position
1/31/14 12/31/13 9/30/13 6/30/13Assets
Cash 3,088,542$ 3,303,375$ 2,902,562$ 2,031,705$ Grants/Accounts Receivable 42,788 17,552 66,758 53,078 Prepaid Expenses 149,422 200,993 280,032 153,130 Restricted Cash-Escrow upon Dissolution 70,120 70,120 70,076 70,076 Fixed Assets net of Depreciation 1,387 1,387 1,387 1,757 Security Deposit 64,301 64,301 64,301 64,301
Total Assets 3,416,559$ 3,657,728$ 3,385,116$ 2,374,046$
Current LiabilitiesAccounts Payable and Accrued Expenses 212,246$ 174,624$ 402,748$ 136,786$ Deferred Revenue / Advances 463,831 808,968 417,338 -
Total Current Liabilities 676,077 983,592 820,086 136,786
Total Liabilities 676,077 983,592 820,086 136,786
Unrestricted Net Assets 2,740,482 2,674,136 2,565,030 2,237,260
Total Liabilities and Net Assets 3,416,559$ 3,657,728$ 3,385,116$ 2,374,046$

METROPOLITAN LIGHTHOUSE CHARTER SCHOOL
1234
567891011121314151617
18192021222324252627282930313233343536373839404142434445464748
A C D E F G H I J K L M N OMetropolitan Lighthouse Charter SchoolStatement of Activities
COMMENTS One Month - Actual One Month - Budget Variance Seven Months -
Actual Seven Months -
Budget Remaining FY14 Budget - amended
10-2013 Amount Remaining
RevenuePer Pupil Revenue recorded at 1/12th the budgeted amount 344,668 344,668 -$ 2,412,676$ 2,412,676$ -$ 4,136,016$ (1,723,340)$ Special Ed Revenue recorded at 1/12th the budgeted amount 16,787 16,787 0 117,509 117,508 1 201,443 (83,934) Title I Revenue claim to be filed 23,837 17,727 6,111 64,660 124,086 (59,425) 212,718 (148,058) Title II(a) Revenue claim to be filed 981 2,414 (1,433) 4,446 7,243 (2,796) 26,556 (22,110) IDEA grant Received at end of year - - - - 19,500 (19,500) Race to the Top $7,961 allocated 981 - 981 4,446 - 4,446 - 4,446 Lunch Collected from Students - 482 (482) 1,075 3,376 (2,302) 5,788 (4,713) Erate - - - - 29,776 (29,776) Other Revenue / In-Kind Books from City - - - - 33,913 (33,913) Other Revenue - - - - - - -
other revenue - interest incomeneed to add a budget - earning more interest than bank fees - - - 2,197 - 2,197 - 2,197
Interest Income - Restricted - - - - - - Uniform Collected from Students - 2,000 (2,000) 152 14,000 (13,848) 24,000 (23,848)
Total Revenue 387,254 384,078 3,176 2,607,161 2,678,889 (71,728) 4,689,710 (2,082,549)
ExpensesPayroll-Administrative
Principal 11,731 11,731 0 79,507 78,547 (960) 132,612 53,105 Director of Teacher Leadership 14,596 14,596 0 92,222 97,731 5,509 165,000 72,778 Dean of Students 3,096 3,096 0 17,500 20,731 3,231 35,000 17,500 Director of Student Services position vacant in January - 7,519 7,519 40,873 50,346 9,473 85,000 44,127 Director of Family and Community Partnerships position open - 6,812 6,812 26,919 45,608 18,688 77,000 50,081 Associate of Family & Community Partnerships 3,538 3,964 425 19,615 26,540 6,924 44,807 25,192 School Operations Manager position vacant - - - 10,000 10,000 (0) 62,000 52,000 Administrative Assistant 3,840 3,096 (744) 19,768 20,731 963 35,000 15,232 Office Manager 4,423 4,423 (0) 31,801 29,615 (2,186) 50,000 18,199
Total Payroll-Administrative 41,225 55,237 14,012 338,206 379,848 41,642 686,419 348,213
Basic EducationClassroom Teacher Salaries 54,644 54,994 350 329,154 332,355 3,201 621,672 292,518 Associate Teachers 6 budgeted - 5 on staff 20,581 25,477 4,896 123,981 153,969 29,989 288,000 164,019 Stipends-Teacher Leader Fellows budget needs to be increased 2,814 885 (1,929) 17,803 5,346 (12,457) 10,000 (7,803) Specialists 13,485 13,485 (0) 79,371 81,497 2,126 152,440 73,069 Substitutes 200 1,284 1,085 3,584 7,763 4,179 14,520 10,936 Instructional Support (on staff) - - 32 32 0 32 0 School Aides 2,464 2,831 367 17,762 17,108 (654) 32,000 14,238
Total Teaching Salaries 94,188 98,956 4,768 571,687 598,070 26,383 1,118,664 546,977
Title ITitle 1 Academic Interventionist Specialist 10,792 10,173 (619) 54,900 61,481 6,581 115,000 60,100
Total Title I 10,792 10,173 (619) 54,900 61,481 6,581 115,000 60,100
One Month Ended 1/31/2014 Year-to-Date 1/31/2014amended 8/1/13
page 1 of 4 income statement

METROPOLITAN LIGHTHOUSE CHARTER SCHOOL
34
5
A C D E F G H I J K L M N O
COMMENTS One Month - Actual One Month - Budget Variance Seven Months -
Actual Seven Months -
Budget Remaining FY14 Budget - amended
10-2013 Amount Remaining
One Month Ended 1/31/2014 Year-to-Date 1/31/2014amended 8/1/13
4950515253545556575859606162636465666768697071727374757677787980818283
Student Support ServicesSpecial Education Teachers 9,166 8,521 (646) 48,005 51,494 3,490 96,320 48,315 ELL Teacher 5,662 4,742 (920) 14,522 28,655 14,133 53,600 39,078
Total Student Support Services 14,828 13,262 (1,566) 62,527 80,150 17,623 149,920 87,393
Service Providers-Other StaffCounselor - - - - - - Custodians 2,725 3,096 371 18,197 20,731 2,534 35,000 16,803
Total Service Providers-Other Staff 2,725 3,096 371 18,197 20,731 2,534 35,000 16,803 163,758 180,724 16,967 1,045,517 1,140,279 94,763 2,105,003 1,059,486
Taxes & BenefitsPayroll Taxes 16,518 17,205 687 82,665 111,680 29,014 188,550 105,885 Health Insurance 25,264 22,231 (3,032) 118,092 155,619 37,527 266,775 148,683 Dental/Vision/Disability 561 3,143 2,582 8,199 21,998 13,799 37,710 29,511 401(k) Match 2,310 5,238 2,928 16,170 36,663 20,493 62,850 46,680 Bonuses 1,000 12,000 11,000 13,000 12,000 (1,000) 78,000 65,000 Raises & HET Merit Pay Increase - - - - - - - - Workers Comp - 1,734 1,734 19,557 20,810 1,253 20,810 1,253
Total Taxes & Benefits 45,653 61,550 15,898 257,683 358,768 101,085 654,695 397,012
Supplementary Educational StipendsRemedial After-School Program - - - - - - 5,000 5,000 Teacher Stipends - - - - - - - - Summer School - - - 5,000 5,000 5,000 5,000 Detention - - - - 2,000 2,000
Total Supplementary Programs - - - - 5,000 5,000 12,000 12,000
Staff Development & RecruitmentStaff Development 14 4,928 4,914 12,693 11,500 (1,193) 59,130 46,437 Consultants-Visiting Artists - 1,500 1,500 3,130 8,750 5,620 15,000 11,870 Staff Recruitment need to add a budget 93 - (93) 10,682 - (10,682) - (10,682)
Total Staff Development & Recruitment 106 6,428 6,321 26,505 20,250 (6,255) 74,130 47,625
page 2 of 4 income statement

METROPOLITAN LIGHTHOUSE CHARTER SCHOOL
34
5
A C D E F G H I J K L M N O
COMMENTS One Month - Actual One Month - Budget Variance Seven Months -
Actual Seven Months -
Budget Remaining FY14 Budget - amended
10-2013 Amount Remaining
One Month Ended 1/31/2014 Year-to-Date 1/31/2014amended 8/1/13
84858687888990919293949596979899100101102103104105106107108109110111112113114115116117118119120121
122123124125
Professional FeesAcademic Services-LHA 14,583 14,583 0 102,083 102,083 0 175,000 72,917 Reimbursements to LHA for travel 72 1,000 928 5,286 7,000 1,714 12,000 6,714 Bonus to LHA - - - 17,500 17,500 - 35,000 17,500 Legal - 208 208 2,037 1,458 (578) 2,500 463 Accounting & Auditing - - - 585 (585) 14,688 14,103 Computer Support - 2,000 2,000 1,979 14,000 12,021 24,000 22,021 HRB 604 1,061 457 6,306 7,426 1,120 12,731 6,425 Benefit Administration - 86 86 398 599 201 1,026 628 Marketing Expense holiday cards 79 417 338 576 2,917 2,341 5,000 4,424 Reading Partner Program Reading Partners - annual billing 15,000 15,000 - 15,000 15,000 - 15,000 - Summer Intern - - 1,167 1,167 2,000 2,000 TFA Service Fee need to increase budget - - 28,500 14,000 (14,500) 14,000 (14,500) Translations 280 1,130 850 2,540 7,913 5,373 13,565 11,025 Special Education Consultants - - - - - Educational Consultant Brickman - Title I support - - - 4,316 - (4,316) - (4,316) Outside Evaluator - - - - - - - - Assessment and Data Service - 2,035 2,035 398 14,243 13,846 24,417 24,019
Total Professional Fees 30,618 37,520 6,902 187,503 205,306 17,803 350,927 163,424
SuppliesClassroom Supplies 1,366 4,946 3,579 18,891 34,620 15,729 59,348 40,457 Textbooks, Libraries & Consumables 6,109 11,667 5,558 18,700 20,417 1,717 35,000 16,300 In Kind Textbooks from the City - - - - - 33,913 33,913 Office Supplies 691 1,127 436 7,517 7,889 372 13,524 6,007 Custodial Supplies 47 1,667 1,620 5,875 11,667 5,791 20,000 14,125 Uniforms - 2,250 2,250 - 15,750 15,750 27,000 27,000
Total Supplies 8,213 21,656 13,443 50,984 90,342 39,358 188,785 137,801
FFEFFE- Furn, Equip, Computers - 21,500 21,500 48,379 75,833 27,454 130,000 81,621
Total FFE - 21,500 21,500 48,379 75,833 27,454 130,000 81,621
Occupancy - - - - Facility Search and Development monthly progress billing on new facility 2,173 16,667 14,493 108,454 116,667 8,212 200,000 91,546 Facility Management Monthly payment to CFM - 2,083 2,083 12,815 14,583 1,769 25,000 12,185 Security Deposit Security deposit received back - - - (61,419) (61,301) 118 (61,301) 118
Facility Repair & Maintenanceleaks, boiler room and cafeteria pipes replacement and air quality monitoring 4,115 1,667 (2,448) 61,080 11,667 (49,413) 20,000 (41,080)
Erate Internal Connections - - - - - - - - Rent Amortized Prepaid rent and improvements 23,281 25,000 1,719 162,968 175,000 12,032 300,000 137,032 Insurance 2,026 2,864 838 18,398 20,047 1,649 34,366 15,968
page 3 of 4 income statement

METROPOLITAN LIGHTHOUSE CHARTER SCHOOL
34
5
A C D E F G H I J K L M N O
COMMENTS One Month - Actual One Month - Budget Variance Seven Months -
Actual Seven Months -
Budget Remaining FY14 Budget - amended
10-2013 Amount Remaining
One Month Ended 1/31/2014 Year-to-Date 1/31/2014amended 8/1/13
126127128129130131132133134
135
136137138139140141142
143144145146147148149150151152153
Cleaning Contract 6,825 6,833 8 50,646 47,833 (2,812) 82,000 31,354 Moving, Inventory and Storage - - 15,877 17,500 1,623 17,500 1,623 Utilities Accrued estimated budget amt 6,250 6,250 - 43,750 43,750 - 75,000 31,250 Waste Removal not needed - - - - - Security Monitoring contract $199/month accrued 206 200 (6) 1,400 1,400 - 2,400 1,000 Telecommunication 805 2,757 1,952 10,552 19,300 8,748 33,085 22,533
Total Occupancy 45,682 64,321 18,639 424,521 406,445 (18,075) 728,050 303,529
Other Expenses
Miscellaneous
food for staff breakfast, scholar dollars incentive program, Valentine's Day party, Box top winners 796 583 (213) 7,079 4,083 (2,996) 7,000 (79)
Bank Chargesbudget needs to be increased - offset with interest income - 42 42 1,421 500 (921) 500 (921)
Dues & Subscriptions - 1,696 1,696 2,900 11,870 8,970 20,348 17,448 Field Trips over budget - needs to be increased 186 1,000 814 4,192 3,000 (1,192) 3,000 (1,192) Student Transportation - - 26,000 26,000 - 61,043 35,043 Staff Parking 17 staff using parking - may need to adjust 1,125 1,250 125 10,750 8,750 (2,000) 15,000 4,250 Scholar Culture - - - 59 - (59) - (59) Travel - 583 583 624 4,083 3,459 7,000 6,376
Copying & Printingadded copier lease in FY14 budget needs increasing 1,156 1,250 94 11,218 8,750 (2,468) 15,000 3,782
Parent Resources - - - - - - - - Postage & Shipping 272 595 323 1,709 4,165 2,456 7,140 5,431 Lunch Program - parent $ paid over 1,145 579 (566) 2,707 2,315 (392) 5,788 3,081 Contingency - - - - 82,720 82,720
Total Other Expenses 4,680 7,578 2,898 68,658 73,517 4,858 224,539 155,881
Total Expenses 298,710 401,277 102,568 2,109,750 2,375,741 265,991 4,468,129 2,358,379
Operating Income [Annual Surplus] 88,544$ (17,199)$ 105,743$ 497,412 303,148 194,264 221,581 275,831
page 4 of 4 income statement