metrics for research productivity - web...
TRANSCRIPT

DRAFT
Metrics for Research Productivity
Prepared for the University of Florida Health Sciences Center Strategic Plan (2015-2020)
Robert A. Burne
University of Florida College of Dentistry

DRAFT
Executive Summary
The purpose of this document is to provide an overview of the current status of metrics for
research at the University of Florida, with an emphasis on metrics for the HSC, and to provide a
brief roadmap to guide the development of a suite of meaningful, uniform and reliable metrics
that can be utilized by a large and diverse group of stakeholders to improve the quality, breadth,
depth and impact of research conducted in the HSC.
From a strategic planning perspective, the metrics that are most needed are those that allow the
organization to create a vision that recognizes the reality of the present and to create and
monitor achievable short and long-term goals for the strategic plan.
HSC Colleges currently gather a variety of ranking and performance metrics that provide
quantification of research activities and, to a lesser extent, research productivity. However, there
is substantial heterogeneity among the HSC Colleges in the methods for collection of data, the
quantity and quality of the data collected, the degree to which the data are normalized, and how
the metrics are utilized in planning and operations. Central administration of the University,
principally the Division of Sponsored Programs in the Office of the Vice President for Research,
is also heavily engaged in evaluation of research processes and productivity. As part of this
evaluation, consultants have been enlisted and a major initiative to improve the efficiency of the
research enterprise has been initiated.
The metrics developed by individual Colleges and the efforts of central administration are both
complementary and redundant. Recommendations for careful analysis of these efforts and
development of a cogent plan to streamline metrics collection and utilization are presented.

DRAFT
Introduction and Aims
The University of Florida Health Sciences Center (HSC) has initiated a strategic planning
process for its six Colleges. To assist in the development of this plan, the Executive Vice
President for Research and Education of the HSC enlisted the assistance of the Associate
Deans for Research and the Associate Deans for Education of each of the HSC Colleges to
coordinate the preparation of white papers on topics considered to be critical to the
development of goals and outcome measures that address research and education. Areas to be
covered in the research-oriented white papers included Space, Metrics, Infrastructure, Global
Initiatives, Training, and Public-Private Partnerships.
The focus of this document is Metrics for Research Productivity at Individual, Department and
College Levels. The purpose of this document is to provide an overview of the current status of
metrics for research at the University of Florida, with an emphasis on metrics for the HSC, and
to provide a brief roadmap to guide the development of a suite of meaningful, uniform and
reliable metrics that can be utilized by a large and diverse group of stakeholders to improve the
quality, breadth, depth and impact of research conducted in the HSC.
All Colleges in the HSC currently maintain - in various states of accuracy, utility and accessibility
- a set of metrics that are archived for different reasons. One driver for collecting research-
related metrics are the accrediting bodies of specific Colleges or educational programs. For
example, the Council on Dental Accreditation mandates that the College of Dentistry has, as
part of its Strategic Plan, clearly stated goals and outcome measures for our research mission.
For all units, these metrics typically consist of ranking metrics, which contrast our Colleges or
Departments with those of other institutions, and performance metrics, which provide
quantitative information on various inputs and outputs for individuals, Departments and
Colleges. While accreditation is one motivator for keeping metrics, the primary purpose for

DRAFT
maintaining ranking and decision metrics appears, in practice, to be for various stakeholders
(primarily administrators) to glean a general sense of the relative quality and quantity of
research performed by the individuals, Departments or Colleges for which they are responsible.
In the context of strategic planning, ranking and performance metrics are essential for distillation
of complex, often-heterogeneous research operations into quantifiable and tractable packets.
Once developed, the metrics generally feed into a strategic plan in the form of “improving one’s
ranking” (e.g. achieve a rank in the Top Quartile for NIH funding) or increasing of “numerator to
denominator ratios” (e.g. indirect cost dollars (IDC) per square foot or IDC per Principal
Investigator) to some level that is believed to reflect improvements in the quality and/or quantity
of research.
While one cannot discount the value of ranking and performance metrics and their ability to
guide the tracking and sustenance of a research program, there is often no normalization of the
data, the data are sometimes not scalable, and the individuals, Departments and Colleges to
which the comparisons are applied are frequently so heterogeneous that certain metrics are of
almost no value for decision-making and planning purposes.
Arguably, more valuable for the purposes of developing meaningful metrics for strategic
planning would be a focus on “Decision Metrics”, which have been defined as “standards of
measurement by which efficiency, effectiveness, performance, progress or quality can be
assessed” (Appendix I). In thinking about Decision Metrics, the primary consideration is who, or
what groups of individuals, will be making the decisions. Consequently, Decision Metrics are
generally complex sets of data that are specifically tailored to the decision maker. For example,
a Dean or Director trying to determine how to allocate resources on a College-wide or

DRAFT
programmatic level would need access to a different dataset than a Department Chair that is
making decisions about faculty assignments, promotion and tenure, or faculty hiring.
From a strategic planning perspective, the metrics that are most needed are those that allow the
organization to create a vision that recognizes the reality of the present and to create goals that
are achievable in time frames typically allotted to the short and long-term goals of a strategic
plan.
The Aims of this document are to:
1. provide an overview of the concept of metrics, types of metrics, current metrics utilized
at UF and how these metrics are applied;
2. discuss specific ongoing efforts that may influence the quantity and quality of metrics
available to administrators at UF and in the HSC;
3. establish recommendations related to research metrics for the UF-HSC to fulfill the goals
and outcome measures of the 2015-2020 Strategic Plan
Methods:
The primary author obtained background data and information; held discussions with faculty,
administrators, and staff; and constructed a draft document. The draft was circulated to an ad
hoc committee consisting of the Associate Deans for Research of the HSC Colleges, two Basic
Science Chairs in COM (Bert Flanegan, Henry Baker), a Distinguished Professor in UFCD (Ann
Progulske-Fox, a Professor of Biochemistry and Molecular Biology (Art Edison), Wayne
McCormack (Dept. of Pathology and Laboratory Medicine, COM), Amy Blue (Associate Dean
for Educational Affairs – PHHP and Director of Interprofessional Education) and Stephanie Gray
(Director – Division of Sponsored Projects) to provide them the opportunity to give feedback,
help refine the document and to contribute text and serve as co-authors. For some of the basic

DRAFT
information related to research metrics, the primary author relied heavily on a recent report
(Appendix I) of the Research Metrics Working Group of the US Research Universities Futures
Consortium (http://www.researchuniversitiesfutures.org/ ;heretofore referred to as the
Workgroup*).

DRAFT
Metrics, Strategic Planning and Academia
One succinct definition of metrics is “Parameters or measures of quantitative assessment used
for measurement, comparison or to track performance or production” (Investopedia.com). When
we develop metrics in academia, the focus is generally on Performance Metrics, which can be
loosely defined as mathematical measures that track an organization’s behavior and
performance. Often times, these metrics are those that are easily and immediately measurable,
and as a result, they are not always the most valuable for strategic planning and decision
making. In the context of strategic planning, metrics are critical for providing decision makers
with data that can assist them in aligning present realities with short- and long-term goals of the
strategic plan. In this regard, it is important to distinguish between “standard metrics” that
measure normal core activities and “transformational metrics” that assess “activities that should
move the research profile to the next level” (Appendix I).
First, a brief comment about metrics based on rankings, since many academic institutions use
rankings compiled by outside agencies. The general consensus on many of the rankings
developed by outside agencies is that they are riddled with subjectivity, often inaccurate, and in
many cases utilize weighting methodologies that are flawed and/or that have skewed the data to
the point where they are invalid or lose credibility. While these types of metrics are sometimes
invoked when comparing UF with other institutions (e.g. US News and World Report Rankings)
or for comparisons of training or educational programs (rankings of graduate or professional
programs), they do not appear to be utilized to a great degree within the HSC to influence
important strategic decisions. In contrast, ranking metrics that use objective and verifiable data
(such as NIH funding to a College or Department) are of considerable value - when properly
normalized and placed in the correct context - for creating relatively unbiased comparisons of
performance, even at the individual faculty member level.

DRAFT
Regardless of the type of metrics, metrics in general are essential for management in academia,
and academic administration requires a large and diverse set of metrics to provide the spectrum
of stakeholders with the information needed to make informed decisions. The key is to develop
a series of metrics that are standardized, normalized and well-suited to the management of
Research and Scholarship, which are fundamentally different enterprises than the activities
conducted in business, applied engineering or many other fields. Thus, there is a need to define
and focus resources on the collection and analysis of high-value metrics (Appendix I).
Ultimately, then, what would be most desirable, is to have a comprehensive suite of Decision
Metrics (Appendix I), rather than a simple collection of those activities that are easily measured.
However, there is an inherent difficulty in creating Decision Metrics for academia and for an
academic health science center because true measures of productivity (performance) relate
inputs to outputs. As noted by the Workgroup* (Appendix I), “in academia inputs and outputs are
unconnected and often reported and evaluated separately”. As a consequence, there is an
overwhelming focus on monitoring inputs - like amount of grant funding, new faculty hired,
investments in infrastructure – with almost no understanding of the impact on productivity and
quality. Since inputs and outputs are disconnected, it is difficult to measure effectiveness and
efficiency. This is a problem, but not one that is insoluble.
What metrics are we currently collecting in the HSC?
As part of the process in the development of this document, the Associate Deans for Research
of the 6 Health Science Center Colleges were asked to provide either a) a list of the metrics that
their College used as outcome measures in their College’s strategic plan and/or b) a standard
packet of metrics that they may collect for their Dean or for managing their research portfolios.
Actual data were not requested (e.g. IDC per square foot), just a list of the metrics. For the

DRAFT
purpose of illustration, the metrics currently evaluated on an annual basis as part of the UFCD
Strategic Plan are:
• NIH/NIDCR rank for dental schools • NIH/NIDCR rank for academic institutions • Annual startup funds allocated • Percent of fully-funded research effort by tenured/tenure-accruing faculty • Direct and Indirect grant dollars/square foot of research space by
investigator, dept., center • Research dollars per faculty FTE assigned to research versus unfunded
research FTE • Faculty survey of research administrative support needs • Total publications in peer-reviewed journals annually • Number of UFCD faculty participating in research projects with PI’s from
other departments, colleges or universities, or vice versa • New grants submitted/funded by quarter and fiscal year • Total extramural funding (federal, non-federal, other)
A compilation, by College, of the information received is presented in Appendix II. Notable are
the use of both ranking and performance metrics, along with the paucity of metrics that directly
relate outputs to inputs.
Metrics Generated Outside of the HSC
The University of Florida and its Colleges have access to a large collection of metrics that are
generated by outside organizations. Many of these are ranking measures and, because they are
often subjective or the data sets are incomplete (e.g. US News and World Report), they are of
limited value. On the other hand, there are public and private sources of metrics to which UF
Faculty and Administration have ready access that can be used reliably to assess ranking and
performance measures in ways that can inform the strategic planning process. Examples of
widely accessible ranking and performance metrics include data held on web sites by federal
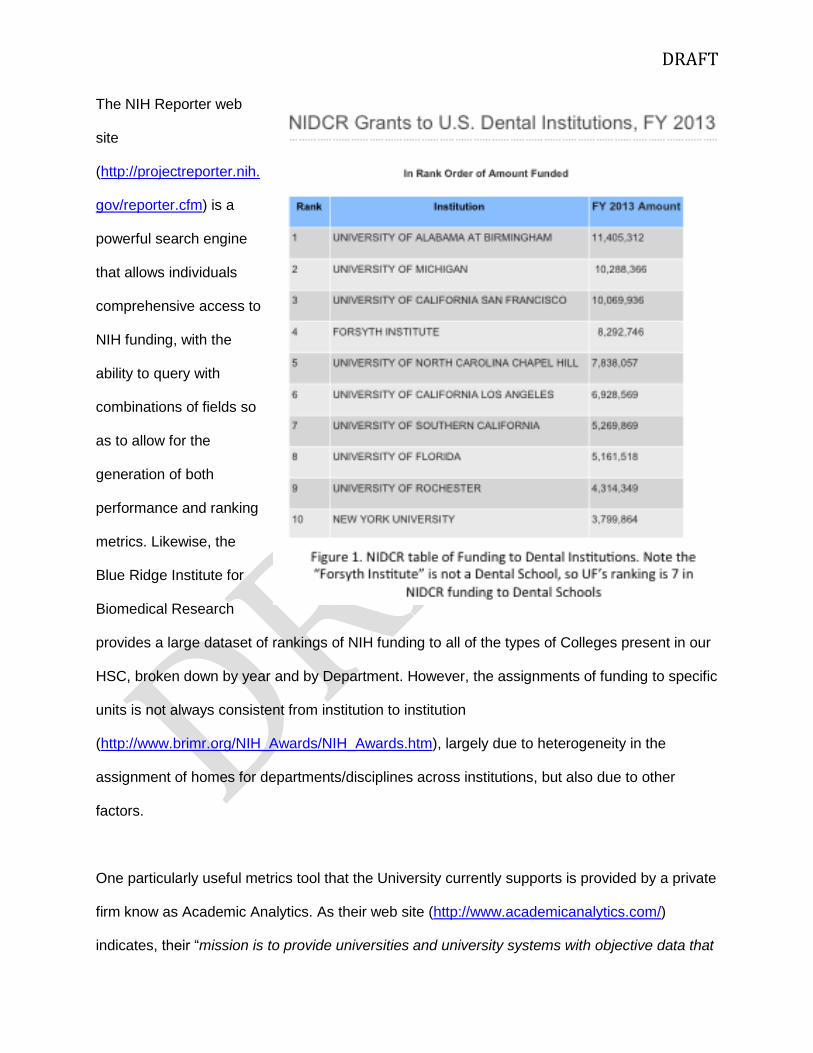
funding agencies. For example, the National Institute for Dental and Craniofacial Research
(NIDCR) web site has a convenient ranking page for funding to academic institutions and dental
schools (http://www.nidcr.nih.gov/GrantsAndFunding/NIDCR_Funding_to_US_Schools/). An
example of the output is presented in Figure 1.
DRAFT
The NIH Reporter web
site
(http://projectreporter.nih.
gov/reporter.cfm) is a
powerful search engine
that allows individuals
comprehensive access to
NIH funding, with the
ability to query with
combinations of fields so
as to allow for the
generation of both
performance and ranking
metrics. Likewise, the
Blue Ridge Institute for
Biomedical Research
provides a large dataset of rankings of NIH funding to all of the types of Colleges present in our
HSC, broken down by year and by Department. However, the assignments of funding to specific
units is not always consistent from institution to institution
(http://www.brimr.org/NIH_Awards/NIH_Awards.htm), largely due to heterogeneity in the
assignment of homes for departments/disciplines across institutions, but also due to other
factors.
One particularly useful metrics tool that the University currently supports is provided by a private
firm know as Academic Analytics. As their web site (http://www.academicanalytics.com/)
indicates, their “mission is to provide universities and university systems with objective data that

DRAFT
administrators can use to support the strategic decision-making process as well as a method for
benchmarking in comparison to other institutions. Rooted in academia, we help universities
identify their strengths and areas where improvements can be made.” One of the more useful
visual summary tools provided by this organization is the radar chart, which can be generated
for individual Departments and Colleges. A de-identified example of an Academic Analytics
radar chart generated is shown in Figure 2 . Presenting data in this format not only provides
percentiling for totals of
funding, publications, and
other information, but has
the advantage that there
are fields that present the
data on a per-faculty-
member basis, allowing for
scaling across units and
institutions. The information
in this type of radar chart is
particularly useful for
Deans and Department
Chairs as it allows for
assessment of the relative
productivity of similar types
of faculty or units.
Finally, without an adequate infrastructure to support research, major inefficiencies lead to a
decline in productivity, lack of competitiveness (particularly for large awards and training grants),
diminished enthusiasm of faculty to pursue funding, an inability to recruit and retain good

DRAFT
researchers (including students and post-docs), frustration at all levels and low morale across
the pool of stakeholders. A general assessment of Research Infrastructure is being provided in
a separate white paper authored by Ammon Peck and colleagues. However, it is important to
note a recent investment by the University’s Office of Research in assessing the infrastructure
and processes related to research administration at the University level. In particular, Huron
consulting (http://www.huronconsultinggroup.com/) was enlisted by UF to perform a
comprehensive evaluation of current processes for research administration at UF and to assist
in the development of a series of metrics that can be utilized across the University to assess our
performance in certain key areas related to research administration. A copy of a PowerPoint
presentation
generated by Huron
is provided as
Appendix III, but a
brief summary of
what they assessed
and how they are
segmenting and
structuring their work
for UF is presented in
Figure 3.
Clearly, the work of Huron was focused more on research administration at the University level,
but their recommendations and ultimately the investments to be made by UF - particularly in the
areas of computing infrastructure, training and staffing - could greatly impact research
administration and efficiencies in the HSC. While research administration metrics (proposal
processing time, cost transfers, etc.) all impact the life of researchers and research

DRAFT
administrators in the HSC, we have only anecdotal and unreliable information on the efficiencies
of our processes in the HSC. Thus, one of the recommendations of this white paper will be to
determine how much effort and energy should be expended to monitor HSC-specific research
administration activities.
It is also notable that Huron recognized the fragmented nature of metrics collection at UF and
recommended centralization of certain data into systems that can be maintained in an accurate
state and can generate key metrics over user-selected time frames. Importantly and relevant to
this document, embedded within Huron's recommendations are a number of specific examples
of metrics that they recommend be collected by UF that would, in fact, be of significant value to
the HSC. For example, see Figure 3 (below), which is taken directly from page 37 of Appendix
III.
The UFIRST Initiative
As noted above, we are vulnerable to the criticism of the way we handle metrics across our
HSC Colleges. As evinced by the metrics collected by Colleges (Appendix II), there is little
uniformity or standardization of methodology for data collection, the data are often incomplete
and possibly not entirely accurate, there is a limited effort devoted to normalization and,
although we often incorporate these measures into our daily lives and strategic plans, these
metrics are seldom the true drivers of decisions to allocate or to withdraw funding, personnel or

DRAFT
space. However, the University has initiated a major effort to address, at least in part, some of
the deficiencies that plague the HSC and other units in the realm of research metrics.
The UFIRST Initiative (https://research.ufl.edu/faculty-and-staff/initiatives/ufirst.html) is
described as follows: “The Office of Research (UF-OR) is undertaking a review of the way we
perform the business of research at UF. The ultimate goal is to outline processes that most
efficiently and compliantly route proposals and related documents, collect information, present
information to stakeholders who must provide approval, and allow for tracking and
reporting. With these improvements, we hope to provide space for our faculty to devote more
time to their research and other sponsored activity and less time to chasing forms and
paperwork. Importantly, the UF-OR has engaged broad representation from across campus,
with key individuals from the HSC (https://research.ufl.edu/faculty-and-
staff/initiatives/ufirst/project-teams.html) to achieve their goals.
Of particular relevance to this document are the metrics that UF-OR will be collecting (See
Appendix IV). By way of example, some of the metrics to be included in the UFIRST database
and made available via a “convenient dashboard” include:
PERFORMANCE MEASUREMENT
Research Performance/Spending
93 Proposal: Award Acceptance Rate
PERFORMANCE MEASUREMENT
Research Performance/Spending
94 Sponsored Project Growth Percentages
PERFORMANCE MEASUREMENT
Research Performance/Spending
96 IDC Dollars per Total Research Facility Square Footage
PERFORMANCE MEASUREMENT
Research Performance/Spending
97 Number and Dollar Value (Operating Costs) of Established Recharge Centers / Service Center
PERFORMANCE MEASUREMENT
Research Performance/Spending
98 Research Productivity by PI (Publications, Citations)
PERFORMANCE MEASUREMENT
Research Performance/Spending
99 ROI on Start-up Packages

DRAFT
It is also noteworthy that the UFIRST team will be establishing metrics on processes and
compliance matters that can inform the strategic planning process in areas of infrastructure,
productivity and efficiency. Thus, the HSC Strategic Planning group needs to give full
consideration to the fact that UFIRST is likely to facilitate access to accurate metrics that can
help guide decision makers in resource allocation, assessment of programs and visioning.
What does the HSC need?
The previous sections have summarized the current state of metrics collection in the HSC and
have highlighted, with supporting materials in the Appendix, some ongoing efforts in the HSC
and University to improve the quality of, and access to, key metrics needed to run a major
research operation. From a Strategic Planning point of view for the HSC it is critical to define
what it is that the Faculty, Leadership and Staff of the HSC require in terms of research metrics
a) to develop a cogent and realistic strategic plan and b) to implement the plan in a fashion that
allows us to achieve or exceed key goals related to our Research Mission.
First and foremost, a reliable data and reporting system should be established to capture and
present metrics in a comprehensible and uniform format. Without such a system, one can
anticipate that metrics and data will be readily dismissed as inaccurate or irrelevant. If one can
achieve transparency in the data and methodologies for data collection, then the system will
gain acceptance and it will be more broadly utilized by stakeholders who can influence the
success of our research mission (Appendix I).
The Workgroup* (Appendix I) has identified core characteristics of metrics systems that are
desirable in an academic setting. These include
Reliable data
Standard definitions

DRAFT
Transparent analysis
Predictable results
Proper normalization
Focus on efficiency/effectiveness
The final two bullet points highlight key concepts that we sometimes lose sight of in our present
environment. First, there is an aversion, because of lack of data and/or transparency, to focus
on true productivity and return on investment (ROI). What does a unit cost, what is the value
added – including teaching, clinical service, other – versus research productivity alone? How do
we quantify some of the less tangible investments and the value added by the various units of
the institution? A brief discussion of ROI calculations in the context of training programs is
presented on page 10 of Appendix V, but these can easily be extrapolated to investments in
junior faculty, research programs, Preeminence hires and other factors that require assessment
by metrics. The second is to reemphasize the importance of proper normalization of data as
noted by the Workgroup* (Appendix I) and echoed by many individuals who commented on the
content of this white paper: one example they provide is publications over a lifetime versus
publications per year or as a function of the stage in their career of the individual. Thus, the
following recommendations for establishing a core suite of metrics and utilizing metrics to
achieve strategic goals are presented in the final section.

DRAFT
Recommendations
Action Items
1. Create a set of Performance Metrics that can be easily accessed; that are, to the extent
possible, uniformly applicable to all UF-HSC Colleges; and that can be reliably used to
evaluate current and future states of our research missions. The process of creating this
set of metrics should include a review of the NCATS workgroup report (Appendix VI and
summarized in Appendix VII. Appendix VII was prepared by Claire Baralt and included
with permission) and alignment of metrics for the Strategic Plan with those of the IOM
and NIH goals for CTSAs.
2. Evaluate to what extent Academic Analytics and UFIRST metrics will satisfy the needs of
the HSC. Based on this analysis, devote appropriate IT infrastructure to generate and
house HSC and College-specific metrics data to eliminate redundancies while satisfying
the accreditation requirements for individual Colleges and educational programs. If
necessary, develop a dashboard for metrics that can be utilized by stakeholders, ranging
from unit-level grants administrators and Chairs to VP-HSC and UF central
administration.
3. Create a workgroup of Chairs from the HSC to develop quality assessment metrics for
evaluating individual faculty performance. These quality assessments should align with
SMART goals (Specific, Measurable, Attainable, Realistic, Timely) and should be
amenable to integration with the suite of metrics established across the HSC. Further,
they should be consistent with metrics used for annual faculty evaluations,
compensation plans, and promotion and tenure criteria.

DRAFT
4. Once the main metrics considered to be of value are agreed upon by a set of
stakeholders, a retrospective analysis of the performance metrics should be conducted:
i.e. identify key metrics and run an assessment of how effective we have been in the
strategic deployment of resources across the HSC based on those metrics (inputs
versus outputs).
5. Conduct an evaluation of the effectiveness of research administration in the HSC that
parallels - where useful and applicable - the Huron consulting recommendations for UF
performance metrics for research workflow and processes. Measures would include
inter- and intra-College variability in efficiencies in proposal processing, award
administration and compliance. The evaluation should include performance measures
related to IRB and IACUC: e.g. metrics that assess the efficiencies of IRB and IACUC,
but also performance measures by faculty who utilize these services.
6. In the context of the Performance Metrics, assess the effectiveness of Centers and
Institutes, including the extent to which they foster inter-College collaborations and
competition for large interdisciplinary awards. Consistent and uniform use of VIVO or a
similar resource could help to facilitate collection of accurate metrics in this area.
7. Determine the degree to which metrics for infrastructure and for education/training
should be integrated with those that are established for the research portfolio. Some
DRAFT
information on key metrics for education and training in doctoral and professional
programs can be found in Appendix V.
8. Establish a database for accurate tracking of FTE assignments to research, which is
critical for data normalization. Determine an acceptable level of unfunded research effort
for specific Departments and Colleges. All Colleges should have compensation plans
that are transparent and accommodate the current realities of research funding.
Establish thresholds - temporal and monetary - for reassignment of faculty effort based
on accepted performance metrics.
Questions remaining
1. The developers of Strategic Plans in academia typically identify peer institutions that are
compositionally and structurally similar and/or that the developers wish to emulate. While
UF is, in certain ways unique, defining peer institutions for thoughtful comparisons is
critical. Should metrics be a driver for the development of selection of appropriate peer-
institutions? If so, which metrics? Should the emphasis be on performance or ranking?
2. Is there a need for discipline-specific metrics that can be selectively applied for
comparisons of different types of research: i) wet-lab research, ii) hybrid wet-lab +
clinical or wet-lab + bioinformatic, iii) behavioral sciences and epidemiology, iv) clinical
research, and v) clinical trials? This questions is raised because, for example,
comparisons of NIH grant dollars per square foot for a molecular biology wet-lab
researcher with those of a biostatistician are of little value. Can such data then be used
DRAFT
to establish baselines and formulae for allocation of space and other resources? Note
that proper normalization of data is again a critical issue.
3. US STAR Metrics. US Science and Technology for America’s Reinvestment: Measuring
the Effects of Research on Innovation, Competitiveness and Science
(https://www.starmetrics.nih.gov/) was initiated in 2010 as a joint effort of the NSF and
White House Office of Technology and Policy to document the outcomes of science
investment to the public. To what degree should the HSC engage in collection of metrics
that highlight the socio-economic impact of our research programs. STAR metrics have
value in addressing the question of state or federal investments in research? (Appendix
I)

DRAFT
ACKNOWLEDGEMENTS
The author(s) would like to thank Stephanie Gray, Wayne McCormack and Clare Baralt for
providing some of the Appendix material related to UF metrics and training. The Associate
Deans for Research provided information on metrics for their Colleges. Every effort was made
to cite the Workgroup* (Appendix I) when appropriate as the paper provided a very useful
framework, particularly for the introductory material.
APPENDIX MATERIAL
I. http://www.researchuniversitiesfutures.org/us-research-metrics-working-group-
current-state-and-recommendations-oct2013.pdf
II. Compilation of metrics by UF-HSC Colleges
III. Selected excerpted material from Huron Consulting Presentation to UF on Research
Metrics and Performance.
IV. Excel file of Metrics to be Developed as part of the UFIRST initiative
V. Clinical and Translational Scientist Career Success: Metrics for Evaluation (Clin.
Transl. Sci. 2012 5:400)
VI. NCATS Advisory Council Working Group on the IOM Report: The CTSA Program at
NIH
VII. Summary of IOM findings and metrics for CTSAs (Source: UF-CTSI, Clare Baralt)
THE CURRENT STATE AND RECOMMENDATIONS FOR MEANINGFUL ACADEMIC
RESEARCH METRICS AMONG AMERICAN RESEARCH
UNIVERSITIES
A Report of the Research Metrics Working Group
US Research Universities Futures Consortium

The Current State and Recommendations for Meaningful Academic Research Metrics Among
American Research Universities
A Report of the Research Metrics Working Group
US Research Universities Futures Consortium
October 2013
Charles F. Louis and Greg Reed
Charles F. Louis D.Phil. Vice Chancellor for Research Emeritus
University of California Riverside Riverside, CA
Greg Reed PhD Professor and Associate Vice Chancellor for Research
University of Tennessee Knoxville, TN
Research Metrics Working GroupArizona State University
Emory UniversityMD Anderson Cancer Center
Ohio State UniversityPennsylvania State University
Rice UniversityUniversity of GeorgiaUniversity of Kansas
University of Maryland College ParkUniversity of MinnesotaUniversity of RochesterUniversity of Tennessee
University of Texas at AustinUniversity of Utah
Sponsored by Elsevier

3
Authors
Dr. Charles F. Louis who most recently served as Vice Chancellor for Research at the University of California, Riverside, received his Bachelor of Arts degree in Chemistry from Trinity College, Dublin, Ire-land, his D.Phil. in Biochemistry from Oxford Univer-sity, and received post-doctoral training at Stanford University. Dr. Louis holds the concurrent appointment of Professor of Cell Biology & Neuroscience Emeritus at the University of California Riverside. Dr. Louis chaired the Board of the Council of Research Policy and Graduate Education of the Association of Public & Land-grant Universities and served on the Board of Directors of the Council on Government Relations, chairing the subcommittee on Contracts & Intellec-tual Property. He has served on many federal and foundation peer-review grant committees as well as the boards of biotech industry associations in both Minnesota and Georgia, and has spoken on the issues of intellectual property nationally.
Dr. Greg Reed is a Professor and Associate Vice Chancellor for Research at The University of Tennes-see, Knoxville. He holds a Ph.D. in Environmental Engineering from the University of Arkansas. He has conducted 60 research projects that resulted in 117 publications. He has direct administrative responsi-bility for a staff of 45 organized into the following teams: sponsored programs (pre- and post-awards), research compliance, research communications, proposal/faculty development, faculty and staff de-velopment training, data analysis and reporting, and a business office to manage internal investments and operations. Since coming to this current position, he has either significantly reorganized, or started new, 18 major business practices aimed at better serving the needs of the research and creative community. He has served in officer positions in seven profes-sional societies and has served as a consultant to 25 industries.
Acknowledgements
We want to thank the members of the Research Metrics Working Group for their contributions and reviews of this report. We also wish to acknowledge and thank Elsevier for facilitating the December meeting and enabling the publication of this report, and particularly Brad Fenwick, Senior Vice President Global Strategic Alliances.
4
Table of Contents ................................................................Page
Executive Summary .................................................................................................. 5
1. Value of Research Metrics ................................................................................. 7
1.1 What are Metrics? ................................................................................ 7
1.2 Research Metrics................................................................................... 8
1.3 Challenges Regarding Currently Used Metrics .......................................... 9
2. Attributes of Useful Research Metrics ........................................................... 11
2.1 Definition of Research and Scholarship .................................................. 11
2.2 Metrics and Universities ....................................................................... 11
2.3 Useful Research Metrics ....................................................................... 11
2.4 Data and Reporting Systems ................................................................. 12
3. Current Research Metrics Initiatives .............................................................. 13
3.1 Snowball Metrics ................................................................................ 13
3.2 US Research Universities Futures Consortium ......................................... 14
3.3 STAR METRICS ................................................................................... 16
3.4 National Science Foundation - National Center for Science and Engineering Statistics ...........................................................................16
3.5 National Research Council - Doctoral Programs Ranking .......................... 17
3.6 UK Research Excellence Framework ..................................................... 17
3.7 Commercial Suppliers.......................................................................... 18
4. Challenges ......................................................................................................... 19
4.1 Voluntary vs. Compulsory Data Submission ............................................ 19
4.2 Standard Data Definitions .................................................................... 20
5. Next Steps ........................................................................................................ 22
Appendix

5
Executive Summary
It is critically important for the advancement of our society that researchers pursue long-term exploratory goals. Research feeds into the innovation/ devel-opment pipeline and if research is not supported, ultimately there will be nothing to develop/ produce. However, the pressure of public expectations for accountability and transparency of all governmental expenditures is now being driven by both economic and demographic pressures. In addition, the “oppor-tunity costs” associated with funding of universities in general, and research in particular versus other governmental functions, when coupled with electron-ic communications and the “big data” movement, mean that universities are being expected to mea-sure themselves or face the very real possibility of be-ing measured by others. For all their faults, the rapid growth in global university rankings as indicators of success point to the public and political appetite to distinguish one university from another.
Sustained growth of federal funding for research is being seriously questioned by many in the United States Congress. The open public access movement requiring researchers to surrender the copyrights of their publications resulting from public funding of their research, as well as the required sharing of their research data, are early indications of the nexus between government funded and government managed, if not government owned, research. It has to be recognized, however, that the step from open access publishing to government mandated research remains a large one.
In the current and future economic environment, the key to university success increasingly turns from a future dependent on only additional funding to one of organizational efficiency that maximizes produc-tivity. This is a situation that higher education has not faced before, at least on the current scale and duration, and as such, lacks a framework by which to thoughtfully respond. Universities are looking for the means to become more productive but lack the evidenced-based best-in-practice comparative
performance and operational data that they need to alter their current policies and procedures (including organizational structure and management systems).
There are now many experiments and innovations underway in educational delivery methods that aim to increase educational efficiency and outcomes without a reduction in quality. While many universi-ties have established new interdisciplinary research centers and institutes to bring focus to their research agenda, their ability to be transformative for the research enterprise is still in many cases limited by organizational structure and management of our universities. The case can be made that the weak link is the absence of reliable comparative research productivity metrics based on standardized data that have been normalized so that meaningful compari-sons are possible. In the absence of such information that allows meaningful comparisons, institutions that are especially efficient and effective in turning inputs into noteworthy research discoveries go unrecog-nized and unrewarded (even by themselves), and the reasons for their success are not shared.
The thesis of the authors is that the current sys-tem for evaluating research performance is heavily biased in favor of institutional size, regardless of productivity. This type of evaluation is not sustain-able, and undermines public and political support for higher education and research; it advantages size over quality and efficiency. The current report extends and updates the previous report, “The Current Health and Future Wellbeing of the Ameri-can Research University”. It provides the basis for shaping a pathway by which US universities can cooperatively develop systems that produce reliable and actionable performance data to guide strategic planning. Such data would allow evidence-based resource allocation decisions that can be made and justified, and ensure that universities that are especially efficient and effective in turning inputs into noteworthy research discoveries are widely recog-nized. It is a bottom-up collaborative approach that allows universities to control their own destiny rather than a top-down government-mandated approach.

6
For such research metrics projects to realize their full potential, clusters of research universities in multiple countries need to first recognize the value and importance of this collaborative approach, and then make a similar level of commitment. Research is a global enterprise and assessing the productivity of its contributing parts requires standardized data and normalized analytical methods. If the universities themselves take the lead in developing the research metrics that they see will be most effective for en-hancing their effectiveness and efficiency, this will hopefully ensure that their research enterprises are measured in ways that they see as being the most meaningful. Research metrics developed by govern-ment or funding-body mandates are more likely to serve those agencies’ goals, producing little of value for universities as they seek to enhance their organi-zational performance.
Recommendations
(1) Establish an initial pilot by the Working Group (WG) to develop meaningful research metrics.
(2) WG agrees on the appropriate measures to create the most useful efficiency and effectiveness parameters.
(3) WG agrees which input, process and output data should be collected for the development of research metrics.
(4) WG agrees which definitions should be used for each of the data terms.
(5) Pilot the data collection, review outcomes, revise metrics, and proceed to full data collection by WG institutions.
(6) Build support infrastructure for data visualization and sharing across WG universities.
(7) Engage with appropriate entities to develop automated reporting tools.
(8) Solicit broader engagement in the project by US universities.
(9) Establish a global partnership of universities committed to the use of research metrics.
“Control Your Own Destiny or Someone Else Will”
Jack Welch
7
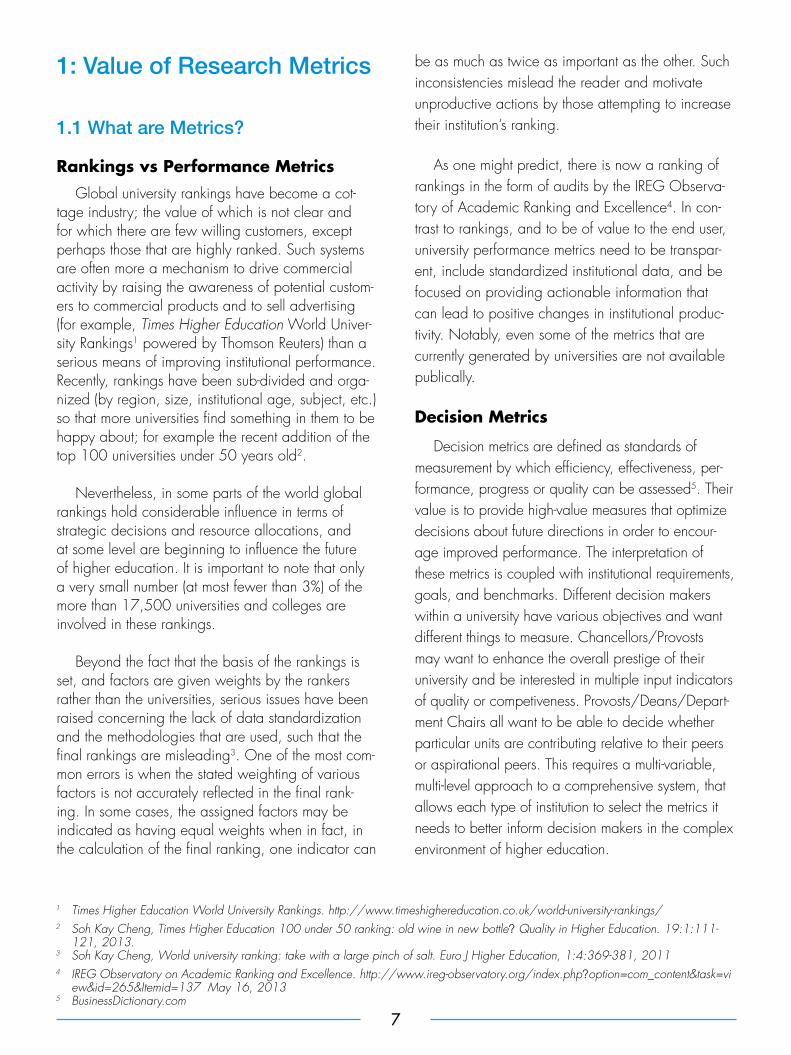
1: Value of Research Metrics
1.1 What are Metrics?
Rankings vs Performance MetricsGlobal university rankings have become a cot-
tage industry; the value of which is not clear and for which there are few willing customers, except perhaps those that are highly ranked. Such systems are often more a mechanism to drive commercial activity by raising the awareness of potential custom-ers to commercial products and to sell advertising (for example, Times Higher Education World Univer-sity Rankings1 powered by Thomson Reuters) than a serious means of improving institutional performance. Recently, rankings have been sub-divided and orga-nized (by region, size, institutional age, subject, etc.) so that more universities find something in them to be happy about; for example the recent addition of the top 100 universities under 50 years old2.
Nevertheless, in some parts of the world global rankings hold considerable influence in terms of strategic decisions and resource allocations, and at some level are beginning to influence the future of higher education. It is important to note that only a very small number (at most fewer than 3%) of the more than 17,500 universities and colleges are involved in these rankings.
Beyond the fact that the basis of the rankings is set, and factors are given weights by the rankers rather than the universities, serious issues have been raised concerning the lack of data standardization and the methodologies that are used, such that the final rankings are misleading3. One of the most com-mon errors is when the stated weighting of various factors is not accurately reflected in the final rank-ing. In some cases, the assigned factors may be indicated as having equal weights when in fact, in the calculation of the final ranking, one indicator can
be as much as twice as important as the other. Such inconsistencies mislead the reader and motivate unproductive actions by those attempting to increase their institution’s ranking.
As one might predict, there is now a ranking of rankings in the form of audits by the IREG Observa-tory of Academic Ranking and Excellence4. In con-trast to rankings, and to be of value to the end user, university performance metrics need to be transpar-ent, include standardized institutional data, and be focused on providing actionable information that can lead to positive changes in institutional produc-tivity. Notably, even some of the metrics that are currently generated by universities are not available publically.
Decision Metrics
Decision metrics are defined as standards of measurement by which efficiency, effectiveness, per-formance, progress or quality can be assessed5. Their value is to provide high-value measures that optimize decisions about future directions in order to encour-age improved performance. The interpretation of these metrics is coupled with institutional requirements, goals, and benchmarks. Different decision makers within a university have various objectives and want different things to measure. Chancellors/Provosts may want to enhance the overall prestige of their university and be interested in multiple input indicators of quality or competiveness. Provosts/Deans/Depart-ment Chairs all want to be able to decide whether particular units are contributing relative to their peers or aspirational peers. This requires a multi-variable, multi-level approach to a comprehensive system, that allows each type of institution to select the metrics it needs to better inform decision makers in the complex environment of higher education.
1 Times Higher Education World University Rankings. http://www.timeshighereducation.co.uk/world-university-rankings/2 Soh Kay Cheng, Times Higher Education 100 under 50 ranking: old wine in new bottle? Quality in Higher Education. 19:1:111-
121, 2013.3 Soh Kay Cheng, World university ranking: take with a large pinch of salt. Euro J Higher Education, 1:4:369-381, 20114 IREG Observatory on Academic Ranking and Excellence. http://www.ireg-observatory.org/index.php?option=com_content&task=vi
ew&id=265&Itemid=137 May 16, 20135 BusinessDictionary.com

8
An example of such an approach is the University of California/Department of Energy6 approach to performance metrics, which has been summarized by the acronym SMART:
❍❍ Specific – clear and specific to avoid misinterpretation;
❍❍ Measureable – can be quantified and compared to other data;
❍❍ Attainable – achievable, reasonable, and credible;
❍❍ Realistic – fits into the organization’s constraints;
❍❍ Timely – doable within the timeframe.
The challenge is to comprehensively define the measures that will meet these criteria, and optimize effectiveness and efficiency objectives.
1.2 Research Metrics
Everything is measured and assessed in our society, and while in the US the assessment focus in education was initially on K-12, this is now being increasingly expected of higher education and our nation’s research universities. Academic decisions that rely on metrics range from decisions regarding tenure, to the ranking of universities (however dubi-ous the measures used), to the funding of universities by the states and indirectly, the federal government7. While resource constraints are a common challenge for all organizations, this has been exacerbated recently for public research universities. As public funding for higher education and research has been cut, this has increased awareness by universities and colleges of the need to make strategic and resource allocation decisions based on solid data and mean-ingful comparative metrics.
Research administrators have to make hundreds, if not thousands of decisions every year in the course of sustaining and building stronger institutional research portfolios, but current evaluation measure-ments of research are inadequate. A set of mean-
ingful research metrics uniformly defined across US universities would provide an invaluable tool for this decision making. As such, decisions are often based largely on qualitative “one off” intuitive assessments, personal perspectives or past experiences, and internal/external political pressures from research-ers, board members, or government officials that are devoid of meaningful comparative research perfor-mance metrics.
Generally those involved in the research enter-prise recognize data as an essential element in strategic planning and decision-making. As enunci-ated in the UK Snowball research metrics project, “research intelligence and performance manage-ment frameworks can focus institutional strategies on research quality, raise the profile of an institution’s research, manage talent, and build a high-quality research environment.”8 One could hope that with the availability of such meaningful research metrics, funding agencies, state governments and students could derive a more accurate assessment of the research environment of different US universities.
A recent American Academy of Arts and Sci-ences report9 , which contains a call for action to increase the outcomes of research, recognized that sustained slow economic growth, federal debt problems, and competing public demands such as health care constrain what can be supported. The report concluded that many changes would need to occur and “academia will have to evolve new ways to define success.”
One aspect of the need to be more effective is the availability of information to make smarter decisions about how to invest available resources. “Benefits include: motivate teams to achieve desired outcomes; define business processes and responsibil-ities; manage stakeholder expectations; monitor the impact of new processes; improve decision making and prioritization; and evaluate performance. Met-rics can trigger positive culture change and improve outcomes.”10
6 University of California Approach. http://www.orau.gov/pbm/documents/overview/uc.html 20057 Lane, Julia, Let’s Make Science Metrics More Scientific, Nature, 464, 488 (2010) 8 Willems, Linda and Colledge, Lisa. Snowball Metrics help universities assess and compare their research. Elsevier Connect.
http://www.elsevier.com/connect/snowball-metrics-help-universities-assess-and-compare-their-research January 29, 20139 ARISE 2: Unleashing America’s Research & Innovation Enterprise, American Academy of Arts and Sciences, 201310 Haines, Nathan, Metrics for Research Administrative Offices, J. of Clinical Research Best Practices, 8,6 (2012)

9
1.3 Challenges Regarding Currently Used Metrics
Commonly used research metrics have well-known flaws as they do not capture the range of activities and measures of effectiveness, especially at large, comprehensive universities with hundreds of disciplines. Some of the metrics currently used, like citation-based evaluation, have been subject to manipulation to skew the results. The recent “San Francisco Declaration on Research Assessment” published by a group of science journal editors chal-lenges the validity of the widespread use of Journal Impact Factor as a measure for assessing the quality of individual publications11.
The lack of standardization of the metrics used for the assessment of research effectiveness and efficiency is a significant problem that frustrates at-tempts to make effective analyses and assessments. So the challenge today is to find ways to make the decisions more efficient and effective using analyti-cal tools that are informed by standardized and agreed-on definitions of the data to be used (data standards), rather than making decisions based on intuition.
Quantity measures have been preferred, particu-larly by ranking systems, because they are relatively easy to obtain, or at least the measures used were selected because they were easy to obtain. Howev-er, the desired outcome is quality. Quantity is not the same as quality and there has not been a convinc-ing demonstration that one predictably produces the other. In some ways, quality is like beauty – in the eye of the beholder. Long-term significance is difficult to predict from short-term performance; one objec-tive must be to support and reward good science throughout the continuum. The goal is to find a way to reveal or predict quality so that decisions are based on highly informative metrics.
Evaluation should be designed to reveal the comprehensive nature of the researchers and the research programs.
Evaluation has principally two functions: 1) to assess the research organization in which
researchers function and 2) t o assess the researchers themselves.
Evaluation of the research organization may raise questions about the adequacy of the instrumentation, technological support teams, peer accessibility, university support, and also the lack of support as unnecessary “red tape.” “Evaluation processes determine if a university is fulfilling its role to the researchers and stakeholders who fund the process.”12
The value of metrics is to help decision makers be effective at scoping the right vision based on the current reality versus the aspirational goals that are recognized as achievable. The results of the metrics analyses are often designed to meet the expectations of their funding sources, their stakeholders, or the public about the wisdom of how research dollars are being spent.
Standard metrics (assessing normal core activities) and transformational metrics (assessing activities that should move the research profile to the next level) are central to effective and efficient decision-making. A comprehensive array of metrics is needed to ad-dress challenges such as the administrative burden, rapidly increasing expectations and the erosion of public support for academic research. Finally, to provide specific information for improved decision-making, the metrics need to be normalized to avoid larger organizations looking more productive just because of size rather than efficiency.
Unlike many complex industries, higher education in general and academic research most notably lack multifactor productivity measures, which relate output per unit of a combined set of inputs. Such measures allow growth to be viewed in relation to increases in productivity, i.e. the rate of increase in inputs relative to the growth in outputs.
Rather, as is the case in higher education, inputs and outputs are largely unconnected and often reported separately; they are almost never presented
11 San Francisco Declaration on Research Assessment. http://am.ascb.org/dora/ 201312 Tash, William R., Evaluating Research Centers and Institutes for Success, WT & Associates, Fredericksburg, VA (2006)

10
on a comparison basis. Thus, organizational ef-ficiency and effectiveness are largely ignored, and the focus is squarely on growing the level of inputs. Indeed, in the absences of reliable comparative performance metrics, as inputs increase the rate of outputs could unknowingly decline. The singular obsession for more funding, larger endowments, more faculty and infrastructure by higher education suggests declining efficiency. No one really knows to what degree the concept of “economies of scale” holds true in academic research where researchers function largely as actors who are independent of central institutional control; in this case, the relation-ship between inputs and outputs would be a better approach.
“Productivity isn’t everything, but in the long run it is almost everything…”13
Paul Krugman
13 What is productivity? The Ledger. Federal Reserve Bank of Boston. http://www.bostonfed.org/education/ledger/ledger04/ winter/ Winter 2004

11
2. Attributes of Useful Research Metrics
2.1 Definition of Research and Scholarship
Research is defined as a careful and diligent search, a studious inquiry or examination, or inves-tigation or experimentation aimed at the discovery and interpretation of facts, revisions of accepted theories or laws in the light of new facts, or practi-cal application of such new or revised theories or laws14. Scholarship is defined as the fund of knowledge and learning produced by the character, qualities or attainment of scholars (researchers). Re-search metrics should provide universities with ways to proactively support research and scholarship by faculty (the primary unit of production).
The academic research enterprise plays a differ-ent role from that of government or industry. Aca-demia is the natural home of exploratory and specu-lative research, whereas government and industry play a role more toward the developmental and mission-directed end of the research spectrum. Unlike government and industrial researchers, academic researchers act independently of central institutional control. Therefore, it is important to have perfor-mance metrics that reflect the particular features of academic research.
2.2 Metrics and Universities
The ability to make better decisions related to the development and sustainability of increasingly costly university research infrastructure -- people, space, equipment, and operational funding -- was always important, and is now critically important. However, as mentioned previously, few universities have the predictive and program-based comparative input and output performance data required to make well-informed, coordinated decisions. The research data that would provide a more comprehensive picture
of institutional performance are limited by not being deeply integrated into other information and institu-tional management systems, such that input data are not linked with output data15. As such, they do not consider effectiveness and efficiency.
Universities have a difficult time objectively assess-ing their comparative research strengths and weak-nesses in relation to their peers on both a program level as well as an institutional basis. This is not to say they do not collect data and construct positive narratives about how well they are doing, mostly as a means of self-promotion. The result is that rather than having the ability to conduct objective analysis of their comparative productivity internally, institutions turn to external consultants to provide guidance on strategic planning decisions. Consultants often only have access to public information about other uni-versities, as biased as that might be, but they have the time and experience in evaluating performance between universities17.
2.3 Useful Research Metrics
Useful research metrics are designated and structured to allow institutions to gain insights from data. They are most valuable if constructed in a standardized way, enabling the creation of bench-marks based on data that is defined identically across participating institutions, allowing meaningful “apples-to-apples” comparisons.
The challenge is to find a way of doing this that will be easily understood by all users of the metrics. The hope is that institutions can then use this under-standing of their research strengths and weaknesses, and relative productivity, to reinforce their existing strategic decision-making processes.
Standardized processes are not available to connect, evaluate and share credible research performance data between universities. Standard definitions and information management systems are often available at the institutional level but tend to be unique to the individual university and of value
14 The Merriam-Webster Dictionary. Merriam Webster Mass Market Publishers 200415 The Current Health and Future Well-Being of the American Research University, www.researchuniversitiesfutures.org, 2012

12
And of greater importance, such growth is rarely if ever related to outputs. Did the growth in research funding produce a similar (or more or less) growth in outputs? Did other universities find ways (process) to increase their outputs to a greater degree with the same or even fewer inputs?
2.4 Data and Reporting Systems
Valid data reporting and its use in metrics com-parisons requires mutual agreement on a standard definition of all data elements by those institutions participating in such comparisons. Normalizing num-bers in various ways provides a clearer assessment of performance; for example, adjusting significance of publication record for the years in the profession so gross numbers over many years don’t become the ultimate goal. This provides a balanced evalua-tion of those in the early stages of their career versus those who have been in their career for decades. It is also important to control for differences between disciplines and the availability of time and resources.
The data and reporting systems must be reliable if they are to gain acceptance and become action-
able. A lack of credible productivity data limits uni-versities’ ability to act proactively in the recruitment, development, and retention of faculty; the develop-ment of strategic relations with other institutions; and the ability to recognize and promote institutional suc-cess and capacity to potential sponsors and the pub-lic17. Measures of research quantity or quality should be immune to external manipulation. For example, the Impact Factor in publications could be manipu-lated by using excessive self-citations; the size of research entities could be manipulated by artificially combining units for reporting purposes only.
While some modest improvements have been made, the credibility and validity of ranking systems is not strong because they fail to recognize and account for differences between how universities are structured, and how critical data elements are defined differently between institutions. In addition, differences between universities (particularly related to whether or not they have research-focused medi-cal schools, agriculture, or large endowments) are not taken into account17.
Finally, it cannot be emphasized enough, the data should be normalized to promote efficiency as well as effectiveness. Larger organizations should not automatically appear “better” because gross num-bers are used. Per unit performance is a more useful indicator of the strength of an activity and is trans-portable from like organization to like organization. Acceptance is also gained by transparency of the methods used, as well as the data themselves used to calculate all metrics. However the metrics system is administered, it must be clear that inappropriate manipulation of metrics will not be supported.
The core characteristics of useful research are therefore:
❍❍ Reliable Data
❍❍ Standard Definitions
❍❍ Transparent Analysis
❍❍ Predictable Results
❍❍ Focus on Efficiency and Effectiveness (Productivity)
Effectiveness
➱➱Process
Efficiency
Universities are not Businesses but they are Economic EnterprisesReturn on Investment (ROI) = investment of a resource to yield an outcome
Used to evaluate the efficiency of one investment compared to the efficiency of another ... “Opportunity Cost”
Inputs Outcomes➱ OutputsResources
Productivity = Outputs/Inputs
only in evaluating changes in performance over time. When comparative benchmarking takes place it is often as a snapshot of a point in time and is not performed on an ongoing basis, so the university then returns to internal comparisons of progress on a yearly basis. It is common to see universities noting growth in research funding over five to ten years but failing to indicate whether their rate of progress is more or less than comparable institutions and whether this is merely a reflection of a growth in overall availability of external funding17.

13
3. Current Research Metrics Initiatives
There has been an increasing interest in the devel-opment of research data and research metrics for a variety of different purposes. These range from efforts to quantify the effectiveness of the federal invest-ment in science to the US economy; the production of standardized data that can be used by others to “rank” and “compare” institutions; a national effort in the UK to measure university research performance that is used to determine the basis of their govern-ment funding; a number of commercial products that address deficiencies of current surveys; to a recent effort by a group of UK universities to create a tool to determine the effectiveness and efficiency of their programs (Snowball Metrics)8. While the types of data used in these different efforts have significant commonalities, how they are structured, especially to generate metrics that allow meaningful comparisons between units, centers, disciplines and other such groupings of researchers both within and between institutions, differ significantly. This section compares and contrasts these different efforts.
Commissioned by the Association of American Medical Colleges, RAND Europe recently undertook a detailed review of approaches currently used to evaluate academic research16. The motivation for the review was the growing desire by research fund-ing bodies to insure that their investments are being wisely used. “There is need to show that policymak-ing is evidence-based and, in the current economic climate, to demonstrate accountability for investment of public funds in research.”
RAND correctly notes that the purpose and intended use of the evaluation system must inform the design of the assessment system and there are neces-sary trade-offs that are inherent in any system. The report includes the review of 14 research evaluation frameworks and details the strengths and weakness
of six of these using SWOT analysis. In most cases the assessments are government directed or funded, with only a few being voluntary. Of the tools used to conduct the evaluations, bibliometrics and data min-ing were the most frequent. Concerns about the data influencing the analysis were noted: “All evaluations are necessarily limited by the quality and range of available data. Sources can differ in reliability, validity and accuracy and this inevitably affects the outcomes and reliability of the evaluation process.” The RAND report also provides a framework “check-list” for the development of new research evaluation systems.
3.1 Snowball Metrics
The Snowball Metrics17 project was launched in the UK in late 2010 to develop a set of metrics for effective and long-term institutional research informa-tion management. In agreeing to a set of consistent definitions for Snowball Metrics across all research activities, a group of higher education institutions agreed to establish a reliable basis for benchmark-ing and evidence-based strategic decision-making. The goals were to define the sources of the data elements for such metrics calculations, develop a three-year roadmap, and facilitate cross-institutional benchmarking. This initiative was informed and perhaps driven by the data submission requirements of the Research Excellence Framework, scheduled for 2014, which plays an important role in the funding of UK research universities.
The Snowball label relates the view that a re-search metrics system that was voluntarily designed by universities could produce such value and return on investment that other institutions would be motivat-ed to join and from there the system would continue to grow (as when a snowball rolls downhill)18. Eight UK universities are currently participating in the Snowball Metrics project, and interest is growing as demonstrated by a series of workshops that included universities, funders, government agencies, and sup-pliers of research information tools19.
16 Guthrie, Susan; Wamae, Watu; Diepeveen, Stephanie; Wooding, Steven; Grant, Jonathan. Measuring research: A guide to re-search evaluation frameworks and tools. RAND Corporation. http://www.rand.org/pubs/monographs/MG1217.html 2013
17 Snowball Metrics. http://www.snowballmetrics.com/ 201318 Agreeing metrics for research information management: The Snowball Project. http://www.snowballmetrics.com/wp-content/up-
loads/The-Snowball-Project3.pdf 201119 Moving towards the ideal way to manage research information in the United Kingdom, Cross-Sector Workshops, Dec, 2012

14
The Snowball Metrics team identified a set of approximately 50 metrics and a set of denomina-tors. Initially, the team tested the viability of data and metrics calculations by developing these for a small number of researchers at each partner institution who agreed to collect and contribute data on ten ano-nymized researchers in a single science discipline within a three-week period. Notably, such data on even ten researchers within this period proved to be a huge challenge as none of the partner institutions were able to provide all the agreed data, and all found this method of data collection time consuming and labor intensive; indeed, one institution could not provide any data in the required timeframe. Signifi-cant data cleansing was necessary before any form of cross comparison could be made.
Challenges institutions faced when they attempted to collect the agreed data included the lack of avail-ability of the data; the facts that the collection of data had to be completed manually; that data were spread across multiple systems with different owner-ships within the institution so access was not easy; that the time period to gather the data was too short; and that there were issues of confidentiality espe-cially in relation to intellectual property, commercial activity, and engagement of institutions with industry.
Having learned much from their pilot, by 2012 consensus by the partners was reached on the “recipes” for the first set of Snowball Metrics20. To accomplish this, the definitions of these Snowball Metrics were initially agreed upon by technical spe-cialists from each of the institutional project partners. The feasibility of these definitions was subsequently tested by some of the institutional project partners to ensure that they could be generated with a reason-able amount of effort that would not be manually intensive. The timeline of this project is such that data collection and the implementation of a new visual-ization tool for reviewing the metrics by the eight uni-versities should be completed by late 2013, with full implementation and application the following year.
3.2 US Research Universities Futures Consortium
With the success of the UK Snowball Metrics ini-tiative, in early 2012 a group of research adminis-trators at 25 US research-intensive public and private universities participated in a year-long, campus-by-campus study. They investigated the approaches institutions are adopting to maintain high-performing programs amid increasing economic and political pressures, especially so for public research universi-ties. This independent study was conducted by the Research Universities Futures Consortium.
The study reported that “declining funding, increasing competition from academic institutions worldwide, intensifying compliance requirements from the federal government, and the loss of politi-cal and public confidence in the value of academic research have placed great strains on American research universities. The situation has been exac-erbated at the public universities that have had to manage major reductions in their state funding while public and political pressure to minimize tuition increases. At the same time, the expectations for sci-entific research to produce solutions to today’s global challenges have never been higher.”21
The report identified six core challenges22.
1. A hypercompetitive environment, due to scarce resources, has increased the difficulty of managing academic research activities.
2. Increased government regulations and reporting requirements, without funding support, exacerbate pressure on administrators and divert valuable faculty time from research.
3. Assessment and impact analysis relies on departments or colleges rather than being done in a systematic fashion at the institutional level.
4. Enabling research with the highest impact requires current and predictive data to assess programs and evaluate key opportunities in a resource-constrained environment. While
20 Snowball Metrics Recipe Book. http://issuu.com/elsevier_marketing/docs/snowball_metrics?e=6626520/2586700 November 2012
21 Elan, Susan. Study tackles challenges of US research universities: Facing increasing pressures and declining funding, institutions seek solutions for sustainability. Elsevier Connect. http://www.elsevier.com/connect/study-tackles-challenges-of-us-research-universities September 11, 2012
22 The Current Health and Future Well-Being of the American Research University. The Research Universities Futures Consortium. http://elsevierconnect.com/study-tackles-challenges-of-us-research-universities/ 2012

15
universities have developed a range of systems and processes to collect and evaluate research information, many of these efforts are inadequate or insufficiently credible to support well-informed strategic decisions.
5. Research universities need to better communicate how their work serves society, contributes to local economies and promotes national innovation and security.
6. The fragility of research administration and leadership is not fully understood in the university community or by sponsors and stakeholders. As the number and complexity of research programs increase, the capacity of systems and operational support often lags, putting the institution’s research enterprise at risk.
Opinions as to which of the six identified barriers to success deserved priority varied among Con-sortium members. However, among those barriers identified most frequently were the absence of data about the US research enterprise when it comes to making investments, and US universities’ need to get beyond just measuring the number of publications and grants awarded and look more at the effec-tiveness and efficiency of their research enterprise. This input was also influenced by the success of the Snowball project in the UK (see below).
Universities, especially the public research universi-ties, are increasingly being challenged to show how productive they are, but that is hard to quantify in the short term because productivity is incremental in the way it accrues. Indeed the true benefit of basic re-search done today may not be apparent for 10 to 20 years, a time span that ill fits today’s political climate.
The outcome was a decision to engage with a subset of the Research Universities Futures Consor-tium member institutions who agreed to form a work-ing group that would define a set of metrics needed for effective and long-term institutional research information management, reach a consensus on how these metrics should be calculated, and define all the possible sources of data for the metrics calcula-tions. The inaugural workshop of the US Research Metrics Working Group was held in Washington
D.C. on December 2012, with the universities being represented by staff holding senior roles in the man-agement of research.
Members of the US Research Metrics Working Group agreed on the need to come to a consensus on research metrics that would provide meaningful and useful input for the establishment and monitoring of their research strategies. There was agreement that what was needed was not only clarity regarding the nature of the metrics, but also precise definitions of the data required to generate them so that the methodology could be applied consistently across all US research universities. Only with such metrics could research universities make both meaningful internal and external comparisons, and use such information for “data-based” decisions as to where to invest and disinvest in their institutions.
The US Research Metrics Working Group dis-cussed which aspects of the research enterprise have common metrics. Similar to the findings of the Snowball project, metrics considered to be of value included research inputs, research processes, and research outputs, with further subdivision of these “buckets” into research, post-graduate education and economic impact.
The group also discussed a set of denominators that could be used to “slice and dice” the metrics that included individuals, organizational structure, and disciplinary themes. The outcome of these dis-cussions was an agreed-on set of approximately 60 measures of research inputs, processes and outputs, plus the denominators that would be essential for the development of meaningful research metrics that could be used to evaluate the effectiveness and ef-ficiency of their different programs.
Finally the group made a first pass at identifying the “low-hanging” data that would be the easiest to obtain, the moderately hard-to-obtain data, and the difficult-to-obtain data. It was agreed that moving for-ward the first task would be to collect the data that would be easiest to obtain, i.e. the “low-hanging” data (Appendix: Table 1).
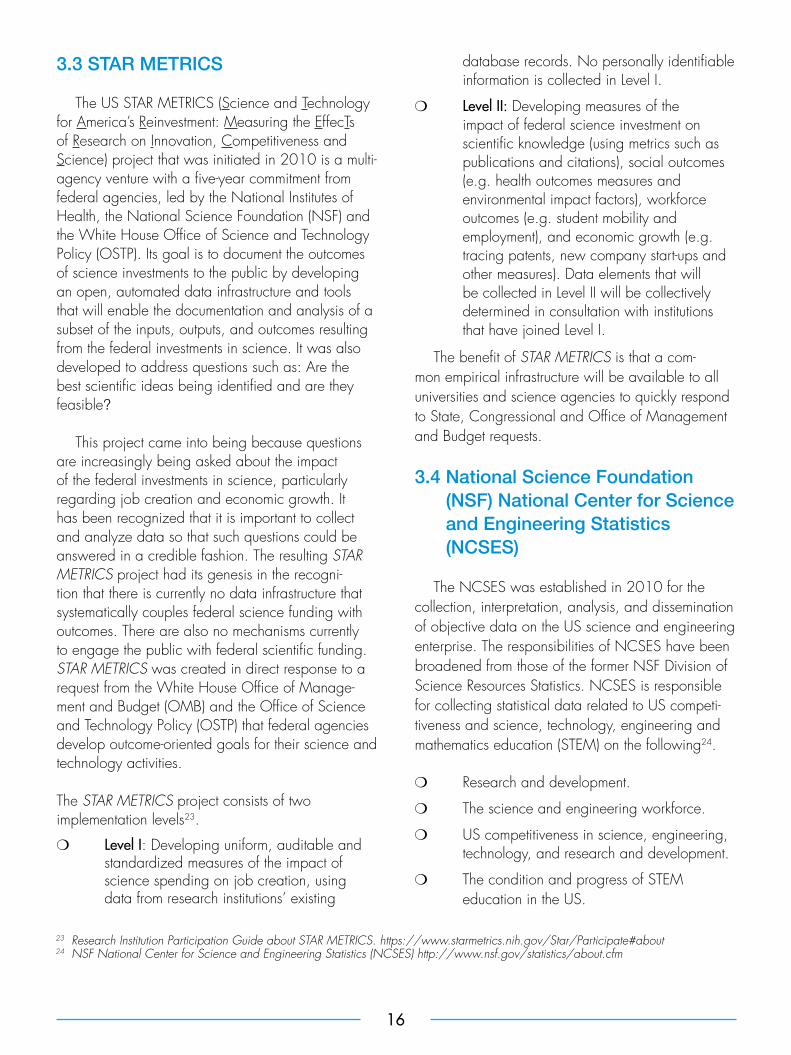
16
3.3 STAR METRICS
The US STAR METRICS (Science and Technology for America’s Reinvestment: Measuring the EffecTs of Research on Innovation, Competitiveness and Science) project that was initiated in 2010 is a multi-agency venture with a five-year commitment from federal agencies, led by the National Institutes of Health, the National Science Foundation (NSF) and the White House Office of Science and Technology Policy (OSTP). Its goal is to document the outcomes of science investments to the public by developing an open, automated data infrastructure and tools that will enable the documentation and analysis of a subset of the inputs, outputs, and outcomes resulting from the federal investments in science. It was also developed to address questions such as: Are the best scientific ideas being identified and are they feasible?
This project came into being because questions are increasingly being asked about the impact of the federal investments in science, particularly regarding job creation and economic growth. It has been recognized that it is important to collect and analyze data so that such questions could be answered in a credible fashion. The resulting STAR METRICS project had its genesis in the recogni-tion that there is currently no data infrastructure that systematically couples federal science funding with outcomes. There are also no mechanisms currently to engage the public with federal scientific funding. STAR METRICS was created in direct response to a request from the White House Office of Manage-ment and Budget (OMB) and the Office of Science and Technology Policy (OSTP) that federal agencies develop outcome-oriented goals for their science and technology activities.
The STAR METRICS project consists of two implementation levels23.
❍❍ Level I: Developing uniform, auditable and standardized measures of the impact of science spending on job creation, using data from research institutions’ existing
database records. No personally identifiable information is collected in Level I.
❍❍ Level II: Developing measures of the impact of federal science investment on scientific knowledge (using metrics such as publications and citations), social outcomes (e.g. health outcomes measures and environmental impact factors), workforce outcomes (e.g. student mobility and employment), and economic growth (e.g. tracing patents, new company start-ups and other measures). Data elements that will be collected in Level II will be collectively determined in consultation with institutions that have joined Level I.
The benefit of STAR METRICS is that a com-mon empirical infrastructure will be available to all universities and science agencies to quickly respond to State, Congressional and Office of Management and Budget requests.
3.4 National Science Foundation (NSF) National Center for Science and Engineering Statistics (NCSES)
The NCSES was established in 2010 for the collection, interpretation, analysis, and dissemination of objective data on the US science and engineering enterprise. The responsibilities of NCSES have been broadened from those of the former NSF Division of Science Resources Statistics. NCSES is responsible for collecting statistical data related to US competi-tiveness and science, technology, engineering and mathematics education (STEM) on the following24.
❍❍ Research and development.
❍❍ The science and engineering workforce.
❍❍ US competitiveness in science, engineering, technology, and research and development.
❍❍ The condition and progress of STEM education in the US.
23 Research Institution Participation Guide about STAR METRICS. https://www.starmetrics.nih.gov/Star/Participate#about24 NSF National Center for Science and Engineering Statistics (NCSES) http://www.nsf.gov/statistics/about.cfm

17
NCSES is responsible for:
❍❍ The collection, acquisition, analysis, reporting, and dissemination of statistical data related to the US and other nations.
❍❍ Support of research that uses NCSES data.
❍❍ Methodological research in areas related to its work.
❍❍ Education and training of researchers in the use of large-scale nationally representative data sets.
As part of its mandate to provide information useful to practitioners, researchers, policymakers and the public, NCSES prepares about 30 reports a year, including Science and Engineering Indica-tors25 for the National Science Board and Women, Minorities, and Persons with Disabilities in Science and Engineering26. NCSES also makes data avail-able to the public through data tools and other data resources. While this is the only comprehensive set of public research data available in the US that has been exhaustively evaluated for commonality of definitions, it is not a set of research metrics in that it does not provide any normalization of its data (using denominators) that would provide the metrics for any comparative analysis of research programs.
3.5 National Research Council (NRC) Doctoral Programs Ranking
Every 10 years the National Research Council of the National Academies of Science has collected quantitative data about doctoral education in the US. The most recent report, released in 2011, was based on data collected for the academic year 2005-2006 from more than 5,000 doctoral pro-grams at 212 universities. It measured the charac-teristics of doctoral programs that are of importance to students, faculty, administrators and others who care about the quality and effectiveness of doctoral programs. It provided comparisons among programs in a field of study to provide a basis for self-improve-ment within the disciplines.
This report includes illustrations of how the da-taset can be used to produce rankings of doctoral programs, based on the importance to users of individual measures. The report provided examples of rankings that were illustrative of constructing data-based ranges of rankings that reflect values to assess program quality determined by the faculty who teach in these programs. Other ranges of rankings could also be produced reflecting the values of the users. While these rankings provided insights that are useful for stakeholders using the dataset and the illustrations to draw conclusions for their own pur-poses, they were not designed to generate metrics that could be readily integrated with other research metrics for evaluating the effectiveness and efficiency of institutional research performance.
3.6 UK Research Excellence Framework
One of the best examples of assessments of re-search quality and productivity at a national level has been in the UK which has systematically conducted an exhaustive assessment of the quality of its higher education institutions every five to six years since 1992. The Research Excellence Framework27 is the latest iteration of this process for assessing the quality of research in UK higher education institutions and will be completed in 2014. It replaces the Research As-sessment Exercise that had been used since 1992.
The primary purpose of the Research Excellence Framework is to produce assessment outcomes for each submission made by institutions:
❍❍ The funding bodies intend to use the assessment outcomes to inform the selective allocation of their research funding to higher education institutions, with effect from 2015-16.
❍❍ The assessment provides accountability for public investment in research and produces evidence of the benefits of this investment.
❍❍ The assessment outcomes provide benchmarking information and establish reputational yardsticks.
25 National Science Board’s Science and Engineering Indicator. http://www.nsf.gov/statistics/seind12/c0/c0i.htm26 National Science Board’s Women, Minorities, and Persons with Disabilities in Science and Engineering. http://www.nsf.gov/
statistics/wmpd/2013/start.cfm27 Research Excellence Framework. http://www.ref.ac.uk/#content

18
The Research Excellence Framework is a process of expert review. Higher education institutions are invited to make submissions in 36 units of assess-ment (broad sets of disciplinary groupings). Submis-sions are then assessed by an expert sub-panel for each unit of assessment, working under the guidance of four main panels. Sub-panels then apply a set of generic assessment criteria and level definitions to produce an overall quality profile for each submis-sion; overall it is a comprehensive but quite expen-sive exercise.
However, this is an assessment exercise conduct-ed to make government funding allocation decisions rather than being designed by the individual institu-tions to make intelligent investment and management decisions regarding their programs, i.e. it is more akin to the accreditation process for a professional school versus an external review of a department or graduate program conducted by that institution to get an objective view and advice regarding one of their programs. Thus, in the same way that accredita-tion reviews are not a substitute for external depart-ment or graduate program reviews, the Research Excellence Framework exercise is not a substitute for the types of data and analyses provided by Snow-ball, SciVal®, Academic Analytics, InCites or other such research data analytics projects and tools.
3.7 Commercial Suppliers
Academic Analytics, a provider of data for managers in research universities, was founded in 2005. It currently includes information on faculty associated with more 385 universities in the US and abroad. The data are structured so that they can be used to enable discipline-by-discipline comparisons as well as overall university performance levels. The data include the primary areas of scholarly research accomplishment28:
1. The publication of scholarly work as books and journal articles.
2. Citations to published journal articles.
3. Research funding by federal agencies.
4. Honorific awards bestowed upon faculty members.
Academic Analytics recently added Faculty Counts, which provides a numerical summary of productivity on a person-by-person basis providing a numeric tally of each faculty member’s total scholarly productivity in each of the five areas of scholarly research (journal articles, citations, books, research grants and honorific awards) measured by Academ-ic Analytics.
Elsevier’s SciVal®29 helps institutions assess their research activities in the context of peer organiza-tions and the global R&D landscape. SciVal delivers research performance and funding data, analytics and insights enabling academic leaders to make evidence-based decisions to guide their research strategy and maximize the productivity and impact of researchers, teams and the institution. SciVal integrates institutional and external data sources with information from Elsevier’s Scopus® to offer a range of tools and services including among others, SciVal Spotlight, which helps institutions or countries evalu-ate their research strengths, define and execute their research strategy and explore opportunities for col-laboration with peer institutions, SciVal Strata, which enables institutions to measure the research perfor-mance of individuals and teams, and SciVal Analyt-ics, which delivers tailored research performance analysis, reports and data integration services.
Thomson Reuters InCites30 like SciVal is a cus-tomized, web-based research evaluation tool that analyses institutional productivity and benchmarks an institution’s output against peers worldwide based on bibliometric analyses. Since publication records for an institution are aggregated, the results are benchmarked against world metrics to show how the product, the service, or the person holds up on a variety of levels. InCites metrics are based on Web of Science® data and the tool provides standard analytics and benchmark data. It identifies institution-al strengths and potential areas for growth, monitors collaboration activity, and tracks new research col-laboration opportunities.
28 Academic Analytics. http://www.academicanalytics.com/29 Elsevier’s SciVal. http://info.scival.com30 Thomson Reuters InCites. http://researchanalytics.thomsonreuters.com/incites/

19
4. Challenges
4.1 Voluntary vs. Compulsory Data Submission
In contrast to the US, the UK and many European countries with central government-managed systems of higher education have highly systematized ap-proaches to the collection of data about their higher education institutions. Thus in the UK, the Higher Education Statistics Agency (HESA)31 is the official agency for the collection, analysis and dissemination of quantitative information about higher education. All data is coded and defined such that there is complete uniformity of the same data items submitted by different institutions; the counts for each institu-tion are collected annually assuring accuracy of this denominator.
In contrast, the US has a very distributed system of higher education compared to the UK and most universities in other countries. While the distributed system permits a wide variety of higher education institutions as exemplified by private versus public, research intensive versus teaching intensive, four-year baccalaureate versus comprehensive PhD granting, for profit versus non-profit, such diversity makes it much more challenging to systematize the collection of data from these very different types of institutions at the national level.
In spite of these challenges, subsets of higher education institutions do systematize the collection of certain types of data about themselves. These in-clude the 62 member institutions of the American As-sociation of Universities (AAU) and the Association of American Medical Colleges (AAMC), a not-for-profit association representing all 141 accredited US and 17 accredited Canadian medical schools, and near-ly 400 major teaching hospitals and health systems. Like the AAU, the AAMC collects a significant body of data about the member institutions. In a similar fashion, many professional schools such as engineer-ing and business collect a significant amount of data
about their member institutions. These data collected by professional schools are primarily collected for accreditation purposes so they do not necessarily ad-dress all those data important for measuring research effectiveness and efficiency. The challenge is that there is no uniformity as to the definitions of the data collected by these different organizations, and the data is not all publicly available. And of course, it is all housed in different databases that operate from different systems that are independently managed and controlled.
A number of enterprise-level data management systems are being used by the larger universities but because these are often adapted from systems designed for private companies, they fail to meet the complete needs of a research university. In some cases, universities have modified these systems or have undertaken the significant task of creating their own customized data management systems. More recently, Current Research Information Systems (CRIS), such as Pure32, have been developed. These systems draw and integrate data from the various databases and systems in order to provide a com-prehensive view of the interacting and co-dependent factors necessary to successfully manage a research university.
By providing a single source of data, CRIS systems can facilitate an evidence-based approach to organization-level decisions, strategy and perfor-mance assessment while helping researchers easily manage their data and operational information. The key to leveraging the capacity of these systems more broadly is to have cross-institutional agreement on standard data definitions and attributes.
Given this lack of uniformity of research-related data collection by higher education institutions, public universities in particular have come under increasing scrutiny over the past few years by their state governments. Having first turned their attention to the efficiency and effectiveness of K-12 education, many state governments are now pursuing a similar approach to their state-funded higher education
31 Higher Education Statistics Agency. http://www.hesa.ac.uk/32 Elsevier’s Pure http://info.scival.com/pure

20
institutions. Ironically, this interest by state government in their public universities coincides with a period of disinvestment by state governments in these very same higher education institutions.
Several states have now become much more active in this sphere, tying their funding to specific undergraduate education performance measures. Furthermore, the University of Texas System has de-veloped a Productivity Dashboard that shows exactly how many dollars each faculty member generates for the institution through tuition-generated or spon-sored research funding awarded. Such increased attention by states to the performance of their higher education institutions has led to the proposal that the federal government should play a more active role in supporting the research infrastructure of our public research universities, as state governments see them as existing primarily as producers of undergradu-ates to fill the 21st century jobs needed for their state economies. However, given the current status of the federal budget, there is little likelihood that the fed-eral government will provide this funding that states are now questioning.
4.2 Standard Data Definitions
The greatest challenge in developing meaningful metrics that can be used across institutions is the de-velopment of standard definitions for each data term.
While the sources of primary data for the devel-opment of metrics can be obtained from institutional repositories or commercial sources such as Scopus, Web of Science, or Google Scholar, it is critical to have consistency in data sources between institutions for meaningful institutional planning purposes. For example, it would be misleading for an institution to draw conclusions based on a comparison of its scholarly output generated using Scopus with that of a peer institution generated using Google Scholar.
As just one example, when an item of data has more than one denominator associated with it, the method of counting will be important. For example, the data may have multiple affiliations and research-
ers associated with it. Take a publication with three co-authors; Brown, Gray and Green, who have appointments at the same institution. If Brown and Gray are defined as being associated with the same discipline that will be used as a denominator, and if Green is a member of a separate discipline denomi-nator, then it has to be decided whether the pub-lication is counted as one or a partial publication for each discipline denominator at that institution, if credit is to be given to each discipline. The data will then have to be deduplicated in aggregated denom-inators to avoid double counting.
Probably the most challenging denominator that has the most critical impact on any resulting metric is the definition of “researcher.” In the UK, HESA is the official agency for the collection, analysis and dissemination of quantitative information about higher education. Data are returned annually to this agency by all UK higher educational institutions according to definitions that have been specified by HESA and are clear to those providing the data. In the UK, a researcher is defined as any employee whose contract of employment as classified by the HESA Academic “Employment Function” is either “Research Only”, “Teaching Only”, or “Teaching and Research.”
In contrast, in the US there is a highly decentral-ized system of higher education that is not centrally funded. Thus, there is no systematized collection of data about the research performance of higher edu-cation institutions besides the data collected by the NSF National Center for Science and Engineering Statistics, which can be faulted as much of this data is self-reported by institutions and lacks normaliza-tion, so it advantages institutional size over research quality and efficiency. Certainly when one gets to the level of denominators it became apparent in the initial discussions of the US Research Universities Futures Consortium Working Group that every institu-tion has a different definition for what it considers its “faculty.” And when one gets to defining “research-ers,” recognizing that most of the research in US higher education institutions is conducted by gradu-ate students and post-PhD staff, there are multiple

21
job titles and definitions even within a single institu-tion; there is almost no commonality of these latter appointment titles and definitions across US higher education institutions.
The only entities that collect such data currently are the commercial vendors such as SciVal, Aca-demic Analytics, and InCites; there is no federal agency in the US that collects the type of data that is needed for the development of research metrics in a systematic fashion where every institution reports according to an agreed on, and well understood, set of definitions. Yet it is an absolute requirement to develop such standardized data if one is to normal-ize desired measures across different sized institu-tions and thus make meaningful comparisons of the performance of a unit between universities.

22
5. Next Steps
The question is not whether universities and publi-cally funded research will be measured and ranked. The question is whether these measurement systems will provide the motivation and types of actionable data and insights that enable gains in institutional success through improvements in their efficiency, ef-fectiveness, and overall productivity. The first step is for the academic community to recognize the need to act cooperatively in controlling their own destiny before they face the unpredictable consequences of externally imposed evaluation mandates and ranking systems of dubious credibility and value.
For the development of a successful US research metrics project the US Research Metrics Working Group recognized the wisdom and sustained value of an organically-created bottom-up approach that is 1) motivated by a heightened level of institutional self-interest, 2) informed by a deep understanding of the academic research enterprise, and 3) enabled through cross-university cooperation and partnership with information providers and integrators. Given the success and flexible nature of the Snowball Metrics approach it makes sense for the US Research Met-rics Working Group to benefit from the work already done and lessons learned by the UK Snowball Met-rics universities. Specifically, what data have they found to have the highest value for the development of research metrics that these institutions then can use to inform their decision making? The challenge will be to do this in the US context where there is no US version of the UK Higher Education Statistics Agency (HESA) to standardize many of the data terms and taxonomy used for the Snowball Metrics project.
In this respect it would make sense to benefit from the lessons learned by the STAR METRICS project that has been addressing the taxonomy of many of the same data elements used in Snowball and identified by the US Research Metrics Working Group (Appendix: Table 1). For example, the STAR METRICS taxonomy has seven “researcher” classifi-cations and since a large number of US universities are already participating in this project it would be
important to see if this same classification would work for the US Research Metrics Working Group project (in contrast the HESA definition of researcher used in Snowball is defined as any employee classi-fied as “Research-only” or “Teaching and Research”). Indeed, it could enhance the value of STAR METRICS by adopting some of their categorizations where there is not an easy parallel with the Snowball Met-rics recipe book taxonomy.
To accomplish this goal, this means the formation of a core group of deeply committed universities who are willing to undertake the task of cooperat-ing at a level that builds the necessary degree of trust, that will produce a foundation for evidence-based performance benchmarking. To be successful requires a willingness of the involved universities to produce, transform, and share institutional data that can be difficult to obtain or has been traditionally viewed as guarded, if not confidential. The group of committed universities should represent the vari-ous types and sizes of research universities. It also requires deep involvement and cooperation from external data suppliers and integrators. As appropri-ate and at the right time, other stakeholders might also become involved.
Given the inherently competitive and highly dis-tributed nature of the academic research enterprise in the US, developing a set of meaningful research metrics for US research universities will not be an easy task; if it were easy it would have already been accomplished! However, the stark reality of the cur-rent and foreseeable economic and political environ-ment in the US provides a compelling self-interested motivation for universities to take on this task. The ef-forts and good work of the several research analytics projects including Snowball Metrics, STAR METRICS, national government agency projects, and com-mercial providers provide an excellent foundation for the US Research Metrics Working Group to now establish a roadmap for the development of research metrics constructed in a standardized way. This in turn will enable the creation of benchmarks based on data that are defined identically across partici-pating institutions, allowing meaningful “apples-to-apples” comparisons.

NUMERATOR DATA DENOMINATOR DATAData avail Data avail Data avail Data avail
Research Inputs Inst SPL Research Process Inst SPL Research Outputs Inst SPL Types of Denominators Inst SPL
Proposals ($, #) x Research Expenditures x Doctoral Degrees Conferred x (CGS, NSF) Size of endowment ($) x
Sponsored Awards ($, #) x x F&A recovery (% of Direct avg) x Pdocs trained x Direct costs or F&A costs ($) x
Gifts ($, #) x Salary recovery ($,#) x Invention disclosures x (AUTM) Award mechanism/Type of award x
Research Space (sq ft) x Effort Allocation x US Patents Apps x (AUTM) Time (FY, AY, GY, mo, yr, person mos) x
Indirect cost return - F&A Requested ($)
x Library resource usage (scholarly works)
x x US Patents Issued x (AUTM) Internal investment (e.g., cost share; $, #) x
Income from endowment/funds/gifts ($)
x Level of ops service to faculty x Licenses & Options Executed ($, #) x (AUTM) Organizational unit (schools, depts, ctrs/institutes, programs)
x x
Agreements (MOU, MTA, CDA) x Partnerships (intra- inter-organi-zational)
x IP Income ($) x (AUTM) Number of People (faculty, staff, students, users, patients, etc)
x
Library budget ($) x Collaboration (intra- inter-institutional)
x Start-up Cos. (#) x (AUTM) Type of People (faculty, staff, students, users, patients, etc)
x
Capital equipment ($, #) x Disciplinarity (uni/multi/inter/transdisciplines)
x x Jobs x Themes / Schemes (energy, sustainability, emerging disease)
x x
Specialized facilities x Promotion/tenure process x Economic Impact x Field/disciplines (NSF categories, …) x (NSF) x
Cyberinfrastructure x Quality of teaching x Subawards/Subcontracts x Sponsor (fed, state, industry, fdn, foreign) x
Physical infrastructure x Scholarly Awards (Nobel prize, Nat’l Academies)
x Sources of budget (tuition, endowment, spons awards, state, fed)
x
Research subjects recruited (#) x Scholarly Output (blogs, journal articles, books, performance works, altmetrics)
x x Sector (academia, industry, gov’t, fdn) x
Citation Count x Geography (local, state, nat’l, int’l) x
h-index x
Field-Weighted Citation Impact x
Publication Co-authorship (intrainstitutional) x
Publication Co-authorship (interinstitutional) x
Journal impact factor ratings (IF, SJR, SNIP) x
Sponsored Awards Co-authorship (intra- or interinstitutional)
NIH, NSF x
Service activities x
Collaboration x
Policy x
Societal impact x
For All Data Columns$ = Amount in dollars# = NumberGreen = Data considered easy to obtainBlue = Data considered harder to obtainRed = Data difficult or impossible to obtainInst = Institutions collectively (could be institutional or publicly
available source)SPL = External supplier of data
US Research Metrics Working Group Identification of Data Required for Developing Research Metrics
Appendix: Table 1

Sponsored by Elsevier
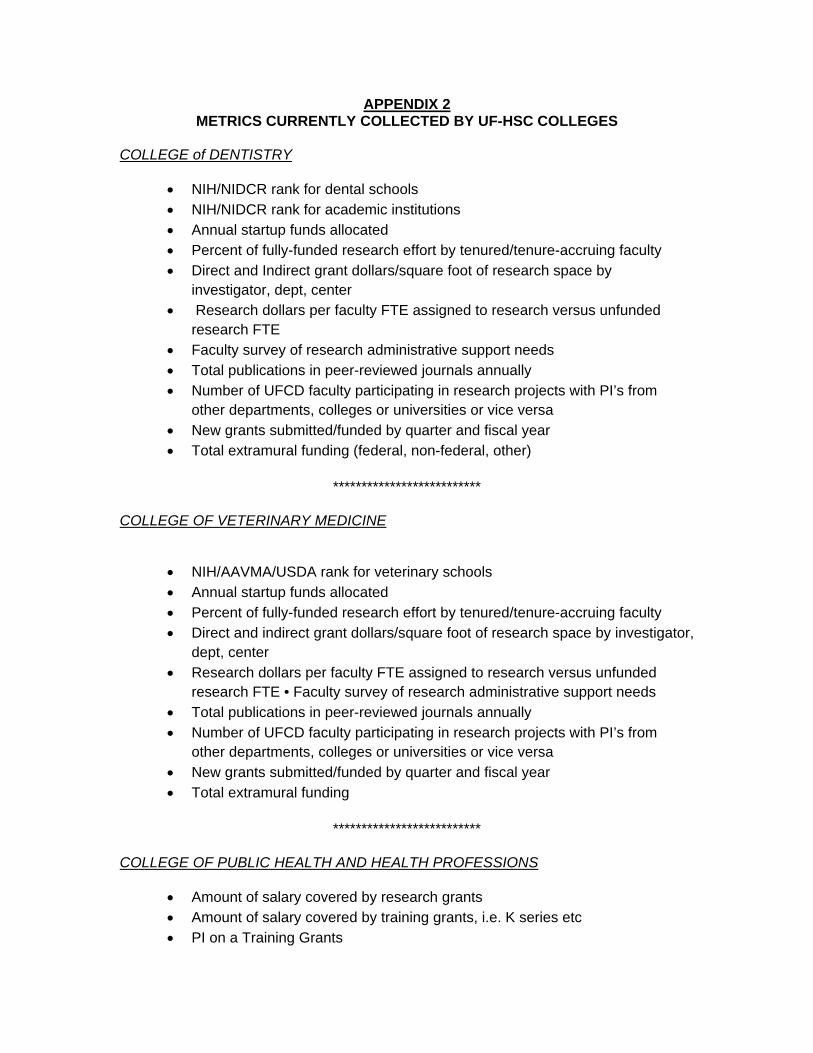
APPENDIX 2 METRICS CURRENTLY COLLECTED BY UF-HSC COLLEGES
COLLEGE of DENTISTRY
NIH/NIDCR rank for dental schools NIH/NIDCR rank for academic institutions Annual startup funds allocated Percent of fully-funded research effort by tenured/tenure-accruing faculty Direct and Indirect grant dollars/square foot of research space by
investigator, dept, center Research dollars per faculty FTE assigned to research versus unfunded
research FTE Faculty survey of research administrative support needs Total publications in peer-reviewed journals annually Number of UFCD faculty participating in research projects with PI’s from
other departments, colleges or universities or vice versa New grants submitted/funded by quarter and fiscal year Total extramural funding (federal, non-federal, other)
**************************
COLLEGE OF VETERINARY MEDICINE
NIH/AAVMA/USDA rank for veterinary schools Annual startup funds allocated Percent of fully-funded research effort by tenured/tenure-accruing faculty Direct and indirect grant dollars/square foot of research space by investigator,
dept, center Research dollars per faculty FTE assigned to research versus unfunded
research FTE • Faculty survey of research administrative support needs Total publications in peer-reviewed journals annually Number of UFCD faculty participating in research projects with PI’s from
other departments, colleges or universities or vice versa New grants submitted/funded by quarter and fiscal year Total extramural funding
**************************
COLLEGE OF PUBLIC HEALTH AND HEALTH PROFESSIONS
Amount of salary covered by research grants Amount of salary covered by training grants, i.e. K series etc PI on a Training Grants

Research awards (amounts from grants and contracts) for primary faculty Percent of tenured or tenure-track primary faculty who serve as investigators
on funded research grants or contracts Percent of funded research projects that involve collaborations across
colleges, centers, and institutes at UF Number of peer-reviewed articles per tenured or tenure track primary faculty Number of conference presentations per tenured or tenure track primary
faculty Percent of students involved in faculty research
**************************
COLLEGE of PHARMACY
# Proposals
COP Faculty as PI
COP Faculty a co-PI/I
Total Submisstions
$$ as COP PI
$$ as coPI/I
Total $$
Research Funding
AACP and Peers†
AACP NIH Support
AACP Rank (NIH Support)
Peers -total NIH (avg)
UF Rank in Peers (of 16)
AACP NIH+ Support
AACP Rank (NIH+ Support)
Peers -total NIH+ (avg)
UF Rank in Peers (of 16)
AACP non-NIH Support
AACP Rank (non-NIH Support)
Peers -non-NIH Support (avg)
UF Rank in Peers (of 16)
AACP Fdtn/Soc Support
AACP Rank (Fdtn/Soc Support)

Peers -Fdtn/Soc Support (avg)
UF Rank in Peers (of 16)
AACP Grand Total Support
AACP Rank (Grand TotalSupport)
Peers -Grand Total Support (avg)
UF Rank in Peers (of 16)
AACP NIH Support/funded PI
UF - FTE PhD
AACP Rank (NIH/funded PI)
Peers - NIH/Funded PI (avg)
Peers - funded PI (avg)
UF Rank in Peers (of 16)
AACP NIH+ Support/funded PI
UF - funded PI
AACP Rank (NIH+/funded PI)
Peers - NIH+/funded PI (avg)
Peers - funded PI (avg)
UF Rank in Peers (of 16)
AACP Grand Total/funded PI
UF - funded PI
AACP Rank (Grand Total/funded PI)
Peers - Grand Total/funded PI (avg)
Peers - funded PI (avg)
UF Rank in Peers
UF data
COP
Extramural Research Dollars
Total Extramural Support
# research faculty
# faculty funded
% faculty funded
$$$/total faculty
$$$/funded faculty
UF
# faculty funded
% faculty funded
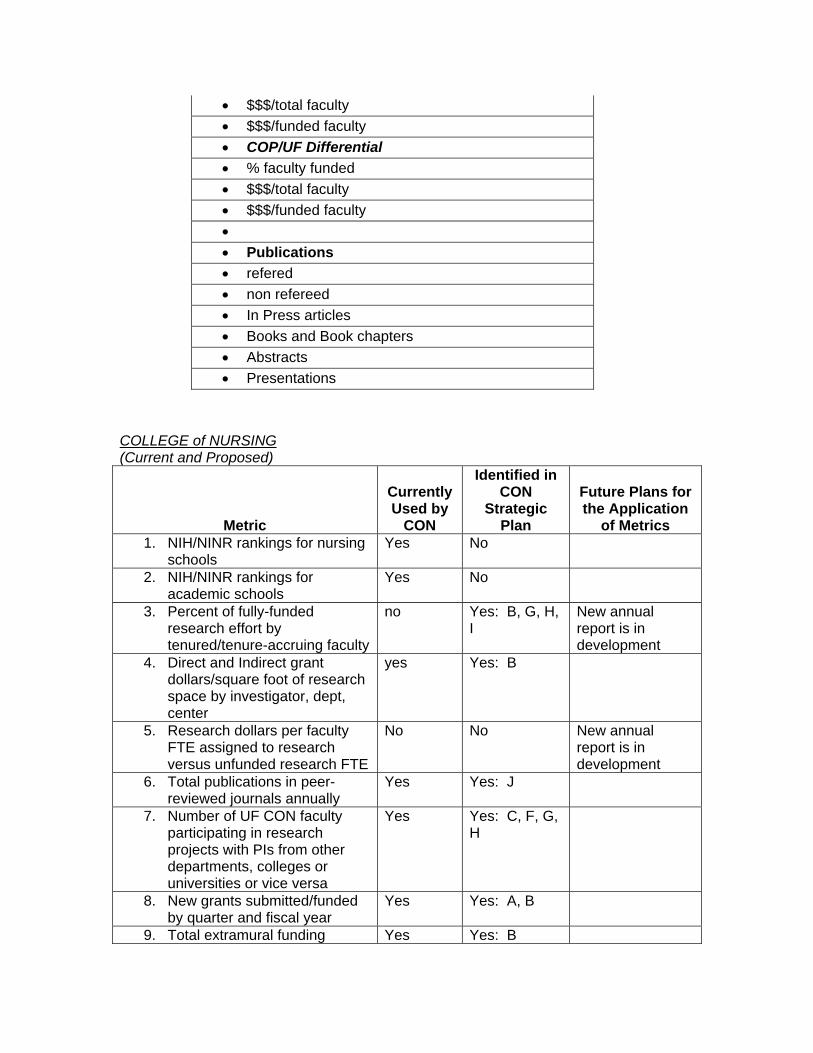
COLLEGE of NURSING (Current and Proposed)
Metric
Currently Used by
CON
Identified in CON
Strategic Plan
Future Plans for the Application
of Metrics 1. NIH/NINR rankings for nursing
schools Yes No
2. NIH/NINR rankings for academic schools
Yes No
3. Percent of fully-funded research effort by tenured/tenure-accruing faculty
no Yes: B, G, H, I
New annual report is in development
4. Direct and Indirect grant dollars/square foot of research space by investigator, dept, center
yes Yes: B
5. Research dollars per faculty FTE assigned to research versus unfunded research FTE
No No New annual report is in development
6. Total publications in peer-reviewed journals annually
Yes Yes: J
7. Number of UF CON faculty participating in research projects with PIs from other departments, colleges or universities or vice versa
Yes Yes: C, F, G, H
8. New grants submitted/funded by quarter and fiscal year
Yes Yes: A, B
9. Total extramural funding Yes Yes: B
$$$/total faculty
$$$/funded faculty
COP/UF Differential
% faculty funded
$$$/total faculty
$$$/funded faculty
Publications
refered
non refereed
In Press articles
Books and Book chapters
Abstracts
Presentations
(federal, non-federal, other) Current Metrics Identified in the CON Strategic Plan:
A. Increase volume of grant submission by 50% per year (2014-2017) B. Increase funding by 25% per year
a. FY14-15: $2 million b. FY15-16: $2.5 million c. FY16-17: $3.12 million
C. Expand number of new collaborative research teams by 25% each year (2014-2017)
D. Obtain T32 funding to support pre and post-doctoral trainees (2016-2017) E. Increase volume of grant submission and funding by faculty from alternative
streams by 20% per year (2015-2017) F. Increase number of inter-campus research collaborations by 1 per year (2014-
2017) G. Increase number of joint research appointments by n=1 per year (2014-2017) H. Increase number of collaborative research/practice ventures n=1 per year (2014-
2017) I. Participation of all clinical track faculty in development activities to promote
clinical scholarship and the scholarship of teaching/learning (minimum of one per year, 2014-2017)
J. Increase dissemination of scholarly products (national presentations and peer-reviewed publications) by 20% per year (2014 -2017)

© Huron Consulting Group Inc. All Rights Reserved. Huron is a management consulting firm and not a CPA firm, and does not provide attest services, audits, or other engagements in accordance with the AICPA's Statements on Auditing Standards.
Huron is not a law firm; it does not offer, and is not authorized to provide, legal advice or counseling in any jurisdiction.
YOUR MISSION | OUR SOLUTIONS
Performance Metrics Assessment
April 2014

Table of Contents
I. Executive Summary
II. Project Background and Overview
III. Recommended Performance Metrics
IV. Application of Performance Metrics
• UF Investments
• Considerations for Additional Enhancements
V. Implementation Plan
VI. Appendices
2
Executive Summary

Executive Summary CURRENT STATE: ACCOMPLISHMENTS AND CHALLENGES
4
In recent years UF has made investments in key areas and processes to enhance the research infrastructure and support to PIs and departments, including: • Creation of distinct leadership roles over DSP and Compliance • Investment in systems to support certain grant management operations • Development of tools providing PIs with key award information via web application • Implementation of a shared services support model in two colleges that previously
lacked dedicated research administration support • Assessment of key compliance risk areas leading to standardized policies and
processes
While great strides have been made, there are still challenges in certain areas, preventing optimal research administration and management: • Highly paper-based and manual processing of proposals • Multiple systems containing proposal information • Heavy reliance on shadow systems across DSP, C&G, Compliance and colleges • Reports and tools that are retrospective rather than prospective • Need for greater grant management and oversight training to complement
compliance training both centrally and locally • Lack of reports and metrics to enable day-to-day processing efficiency and
management oversight across research administration and compliance
These challenges make it difficult for UF to fully measure the current performance of its research operations.

Executive Summary METRICS RECOMMENDATIONS
5
Huron has identified key performance metrics in three critical areas for UF’s research and research administration aimed at identifying areas of strength as well as providing early warning signs for potential problems. • The recommended metrics have been developed based on best practices seen at other top public
research institutions, as well as information gained during interviews with UF research leadership, department chairs, Principal Investigators and staff.
• These metrics have been prioritized based on: • Compliance, customer service and financial implications to UF, and • Ease of implementation and accessibility of the data in the existing UF systems
• Metrics to analyze the strengths and weaknesses of the existing structure to determine how best to realign individuals and teams.
Organizational Structure & Management
• Metrics to assess individual productivity and competence; institution must first identify if the appropriate people and skills are in place to enable business processing.
People
• Metrics to monitor process efficiency, productivity and trends; however, must be supported by sound business processes. Process
See Slides 18-34 for all Priority 1 metrics, and Slides 35-39 for a sample of other metrics

Executive Summary NEXT STEPS: IMPLEMENTATION PLAN
6
In order to successfully implement performance metrics in the research units at UF, additional enhancements should be made to existing business processes as well as technology systems. Additionally, the success of a metric is not only contingent upon sound process but also a strategic implementation plan, which should include:
Step 1
• Identify resource requirements and set implementation date • Functional and
technical resources • Time allocation
Step 2
• Verify the intended use with stakeholders and end users • Metric usage and
frequency • Measurement and
decision making
Step 3
• Map metric parameters to system data points • Availability of data
and accuracy • Ease of extraction
Step 4
• Develop metrics • Extract data from
system(s) and join information
• Verify data through unit and end user testing
Step 5
• Roll-out metrics and share results • Develop process
for metric application and training, where needed
• Communicate findings

Project Background and Overview

Current State of UF Research Administration RESEARCH TRENDS
• UF’s dedication to research across health sciences, engineering, agriculture and physical and natural sciences places it among the top public research institutions.
• Over the last 20 years, annual research funding has grown more than 300%* and UF
continues to strive to become a Top 10 research institution. • The UF Preeminence Plan is one such initiative that will expand the research domain**
• State legislature will allocate $15M in funding over five years, UF will match the $15M to invest in as many as 100 researchers across the areas of life sciences, massive data, cybersecurity, Latin American development and other fields
8
* http://research.ufl.edu/or/about.html ** http://news.ufl.edu/2013/11/21/bog-preeminence/ ***http://www.nsf.gov/statistics/infbrief/nsf14303/nsf14303.pdf
$682
$740
$697
640 660 680 700 720 740 760
2010 2011 2012
Dolla
rs in
Milli
ons
Fiscal Year
Sponsored Research Expenditures*** With the expanding research
portfolio comes added scrutiny from sponsors and increased responsibility for
compliance. UF must continue to assess its research
operations to meet these requirements

Current State of UF Research Administration RESEARCH INITIATIVES
UF has begun several initiatives to enhance research administration operations.
9
University of Florida’s Integrated Research Support Tool (UFirst)
• Internal assessment completed in 2013 to identify pre-award areas of improvement in order to minimize the administration burden on faculty
• Key focus areas identified: • Increased
administrative capacity • Reduced institutional
risk, increased compliance
• Improved resource allocation
• Increased transparency • Improved reporting
tools and data access for reporting needs
One.UF
• Contracted Mobiquity to develop a platform for mobile dissemination of information
• This effort will include proposals, awards, compliance protocol status and PeopleSoft workflow approvals enabling PIs to approve information via the mobile application
• The application is scheduled to be deployed in Fall 2014
Master Data Management
• Contracted Gartner Consulting to guide the University in identifying the master source of data and establish a governance plan to manage data integrity
• Gartner is to provide a final report to UF in April
MyInvestiGATOR
• Developed a web-based tool for faculty and department administrators to manage one’s sponsored research portfolio, transactions and spending, shifting accountability from C&G to the PI
• Phase II went live January 24th, 2014
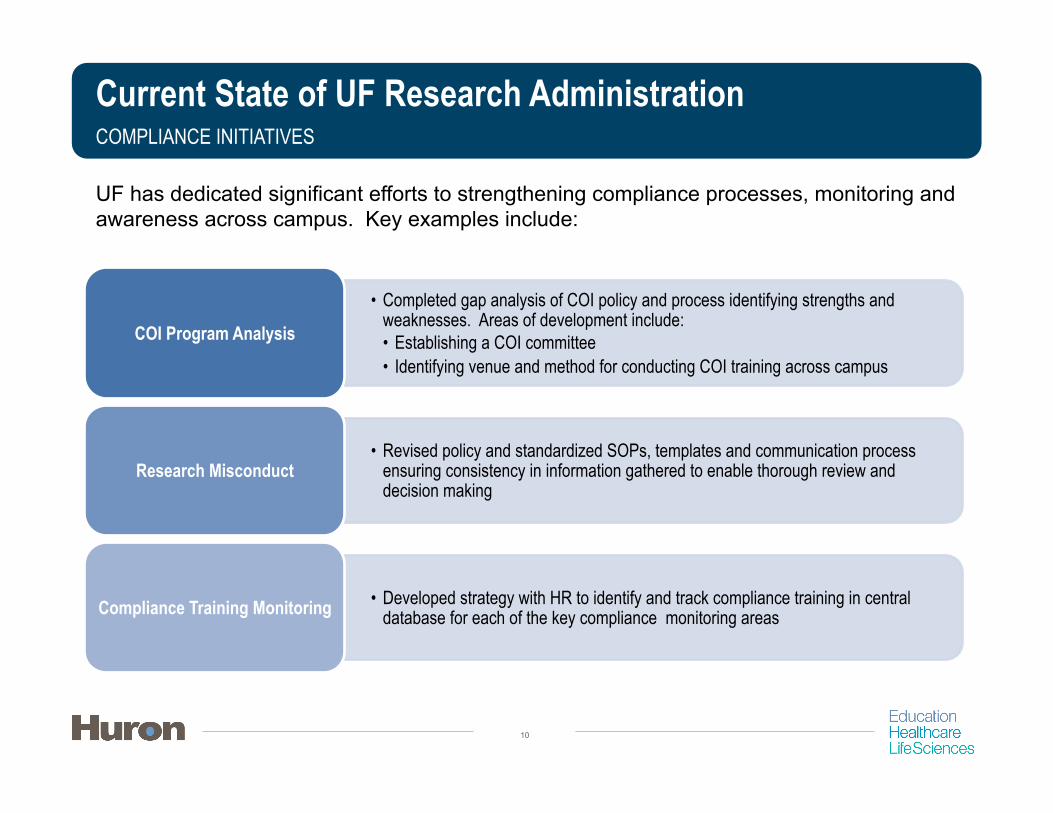
Current State of UF Research Administration COMPLIANCE INITIATIVES
UF has dedicated significant efforts to strengthening compliance processes, monitoring and awareness across campus. Key examples include:
10
• Completed gap analysis of COI policy and process identifying strengths and weaknesses. Areas of development include: • Establishing a COI committee • Identifying venue and method for conducting COI training across campus
COI Program Analysis
• Revised policy and standardized SOPs, templates and communication process ensuring consistency in information gathered to enable thorough review and decision making
Research Misconduct
• Developed strategy with HR to identify and track compliance training in central database for each of the key compliance monitoring areas Compliance Training Monitoring

Project Overview OBJECTIVES AND APPROACH – ASSESSMENT GOALS
• UF engaged Huron to develop key performance metrics that would enable UF to monitor and enhance research administration processes by focusing on:
1. Internal operating efficiencies 2. Research productivity 3. Compliance management
• The research administration functions involved in this review include:
• Division of Sponsored Projects (DSP) • Contract and Grants (C&G) • Division of Research Compliance • Research Program Development • Academic units and centers conducting sponsored research
11

Project Overview OBJECTIVES AND APPROACH – METHODOLOGY
12
• DSP, C&G and Research Compliance provided policies, procedures, and research administration data, which was reviewed to understand the state of UF’s research enterprise operations.
• Refer to Appendix A for list of documents received • Huron interviewed key stakeholders, central and local administrators, department and
college leadership, and faculty to assess existing and needed metrics. • Refer to Appendix B for interview list
• Key research administration processes and systems were evaluated to determine:
• How metrics can complement the day-to-day tasks, or • Where processes and systems may first require updates in order for effective metrics to be
utilized

Recommended Performance Metrics

Recommended Performance Metrics APPROACH
Effective performance metrics highlight areas of strength, provide early warning signs for problems and allow individuals to make qualified operational decisions.
• Our approach for defining research performance metrics is based on best practices seen at other top research institutions, our knowledge of the current research environment, as well as conversations with leadership and staff from both the central and local units at UF.
• The recommended metrics focus on the following key areas of research enterprise effectiveness with example topics outlined below:
14
Organizational Structure &
Management • Staffing Levels • Research
Performance Spending
People • Customer
Service & Satisfaction
• Training & Professional Development
Process • Pre-Award • Post-Award • Compliance
(IRB, IACUC, IBC, COI)

Recommended Performance Metrics APPROACH
15
The following slides detail sample metrics for UF to utilize in managing its research and research administration, now and over the next several years. A comprehensive listing of performance metrics is provided separately. • Additionally, several existing management reports that are used to track metrics are
summarized and potential enhancements are provided to support the implementation of metrics.
Each metric has several components that must be considered during implementation: • Purpose • Audience • Parameters/Data Elements • Source System • Implementation Considerations

Recommended Performance Metrics APPROACH
Recommended research performance metrics have been categorized into priority areas dependent on: • Compliance, customer service and financial implications to UF, and • Ease of implementation and accessibility of the data in the existing UF systems
16
Priority Area 1 A
• High Priority Metrics, Immediate Need and Value Add • Currently Available in UF Systems
Priority Area 1 B
• High Priority Metrics, Secondary Need • Currently Available in UF Systems
Priority Area 2
• High Priority Metrics • Currently Unavailable in UF Systems, should be available soon
Priority Area 3
• High Priority Metrics • Currently Unavailable in UF Systems, not available soon
Priority Area 4
• Medium Priority Metrics • Currently Unavailable in UF Systems, not available soon
Recommended Performance Metrics PRIORITY AREA 1 A: METRICS
There are 37 metrics categorized as Priority Area 1 A and considered high priority metrics that would provide significant value to the research enterprise in the near term. Additionally, these are metrics that UF can currently implement with existing systems in the pre-award, post-award, and compliances offices as well as at a management level. The following details for each metric are provided in the attached slides: • Topic Area • Sample Metric • Purpose • Parameters Note: Additional details on these metrics are provided in the supporting worksheet.
17
Priority Area 1 A
• High Priority Metrics, Immediate Need and Value Add • Currently Available in UF Systems

Recommended Performance Metrics PRIORITY AREA 1 A: PROCESS METRICS – PRE AWARD
18
Topic Area Sample Metric Purpose Parameters
Temporary Projects (Pre Award Accounts)
Number and Dollar Value of Temporary Projects
Indication of usage of Temporary Projects along with oversight of pre award spending to ensure reimbursement
FY, Projects without executed award, Sponsor, College, Department, PI, Range ($0-50k, 50-100k, $100-200, $200-500, $500)
Award Setup Number of Awards Set Up and Set up Turnaround Time , NEW AWARDS
Assess award volume and receipt trends year to year. Evaluate the efficiency of the award setup team
FY, Sponsor, College, Department, PI, Award Receipt Date, Account Setup Date, Project Start & End, Budget Start and End, Reason for Delay
Number of Award Setup in Backlog , NEW AWARDS
Actively track backlog and evaluate reason for backlog, developing solutions to minimize population
FY, Sponsor, College, Department, PI, Award Receipt Date, Account Setup Date, Project Start & End, Budget Period, Reason for Delay
Number of Issues/Outstanding Items Delaying Award Setup
Identify issues outside of Pre Award that impact the creation of the account
FY, Sponsor, College, Department, PI, Award Receipt Date, Project Start & End Date, Budget Periods, Reason for Delay
Proposal Review & Approval
Number of Proposals Submitted Assess proposal trends year to year and distribution of workload by PI
FY, Direct/F&A, Sponsor, College, Department, PI, Due Date, Date Submitted, Project Start & End Date, Budget Periods, Assigned Pre Award FTE
Contract Negotiation
Negotiation Turnaround Time
Ensure defined goals and targets are being met, assess individual performance, track/ manage sponsors with recurring contracting issues /time lags
FY, Sponsor, College, Department, PI, FTE, Date Award Received, Date Negotiations Begun, Date Fully Executed

Recommended Performance Metrics PRIORITY AREA 1 A: PROCESS METRICS – POST AWARD
19
Topic Area Sample Metric Purpose Parameters
Award Management
Active Awards (Unit Breakdown) Assess award volume, type and dollar trends year to year
FY, Sponsor, College, Dept, PI, C&G FTE, Award level, Project level, Subproject level, Number of Outgoing Sub Awards, Award Type: New, Continuation, Renewal, etc., Proposal Number, $0-50k, 50-100k, $100-500, $500-$1M, $1M-$5M, $5M+
Subaward & Monitoring
Active Subawards Assess award volume and dollar trends year to year
FY, Sponsor, College, Dept, PI, Subcontractor
Cash Management
Outstanding AR Track outstanding AR and establish appropriate resolution plan to recover funds
FY, Sponsor (excluding LOC), College, Dept, $ Outstanding, Payment Method, Invoice Frequency, 0-30 days, 30-90, 90-120, 120-180, 180-365, 365+, Average Days Outstanding
Invoices Generated versus Invoice Due Ensure timely issuance of invoices to properly manage cash flow
FY, Sponsor, College, Dept, Month, $ Invoice Submitted, Invoices Due/Month, Invoices Submitted/Month, Reason for Delay
Number of Accounts in Overdraft Monitor accounts in overdrafts and resolution timeframe
FY, Sponsor, College, Dept, PI, Overdraft Amount, # Days Account in Overdraft, C&G FTE

Recommended Performance Metrics PRIORITY AREA 1 A: PROCESS METRICS – POST AWARD
20
Topic Area Sample Metric Purpose Parameters
Closeout Processing
Outstanding Closeouts Monitor outstanding closeout population and assess reasons for holdup and solution for resolution
FY, Sponsor, Department, Account open X days past project end date, Total Expenditures less Budget, Reason account remains open, C&G FTE Assigned
Write-offs Processed Monitor write-off frequency and evaluate cause of write-off to minimize future instances
FY, Sponsor, College, Department, Expenditures, Write-off date, Account closeout date
Number of Closeouts Processed Monitor outstanding closeout population FY, Sponsor, College, Department, Post Award FTE

Recommended Performance Metrics PRIORITY AREA 1 A: PROCESS METRICS – POST AWARD
21
Topic Area Sample Metric Purpose Parameters
Cost Transfers Number of Cost Transfers Monitor number and value of cost transfers
FY, Sponsor, College, Department, Labor vs. Non-Labor, 0-$100, 100-$500, $500-1000, $1000-$2000, $2000, Grant to Grant, Grant to non-Grant, Non-Grant to grant, etc., Cost Transfer justification
Number and Dollar Value of Labor Cost Redistributions, On Time and Late
Evaluate validity of cost transfers FY, Sponsor, College, Department, Transfer Date minus Effective Date > 90 days, Transferred to: Grant, Non Grant, Dept fund, Justification
Average Age of Cost Transfers Evaluate the age and justification to determine potential compliance risks
FY, Sponsor, College, Department, Labor vs Non Labor, Transfer Date minus Original Date Incurred, Transferred to: Grant, Non-Grant, Dept Fund, Justification, 0-$100, 100-$500, $500-1000, $1000-$2000, $2000+

Recommended Performance Metrics PRIORITY AREA 1 A: PROCESS METRICS – POST AWARD
22
Topic Area Sample Metric Purpose Parameters
Effort Reporting
Effort Certifications (per Cycle, per Year) Track completion and progress to defined goals
Per cycle, Per FY, Department, Due Date, Date Certified
On-time versus Late Effort Certifications Identify issues with particular departments or individuals
Per cycle, Per FY, Department, Due Date, Date Certified, # Outstanding
Outstanding Effort Certifications Monitor volume and associated impact to payroll
Per cycle, Per FY, Department, PI, Due Date, Unsubstantiated Salary $
Cost Transfers resulting from Effort Certifications
Track inaccuracies in effort certification and repeat offenders
Per cycle, Per FY, Department, PI
Recertifications by Year Track inaccuracies in effort certification and repeat offender
Per cycle, Per FY, Department, PI, Date open for recertification, Date recertification completed
Certification by someone other than the responsible/required individuals
Identify and resolve instances of individuals certifying on behalf of PI.
Per cycle, Per FY, Department, PI, Certifier, Date Certified
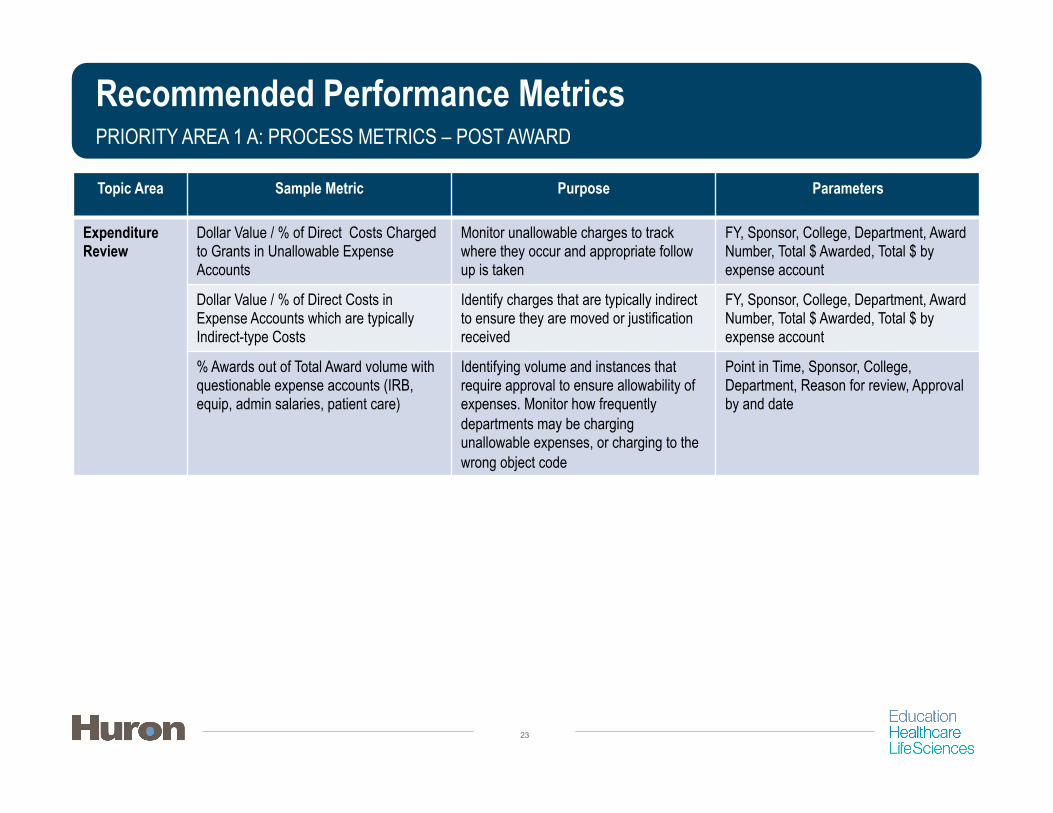
Recommended Performance Metrics PRIORITY AREA 1 A: PROCESS METRICS – POST AWARD
23
Topic Area Sample Metric Purpose Parameters
Expenditure Review
Dollar Value / % of Direct Costs Charged to Grants in Unallowable Expense Accounts
Monitor unallowable charges to track where they occur and appropriate follow up is taken
FY, Sponsor, College, Department, Award Number, Total $ Awarded, Total $ by expense account
Dollar Value / % of Direct Costs in Expense Accounts which are typically Indirect-type Costs
Identify charges that are typically indirect to ensure they are moved or justification received
FY, Sponsor, College, Department, Award Number, Total $ Awarded, Total $ by expense account
% Awards out of Total Award volume with questionable expense accounts (IRB, equip, admin salaries, patient care)
Identifying volume and instances that require approval to ensure allowability of expenses. Monitor how frequently departments may be charging unallowable expenses, or charging to the wrong object code
Point in Time, Sponsor, College, Department, Reason for review, Approval by and date

Recommended Performance Metrics PRIORITY AREA 1 A: PROCESS METRICS – COMPLIANCE
24
Topic Area Sample Metric Purpose Parameters
Animal Subjects
Number of Grants w/ IACUC protocols Identify animal subject research on sponsored projects to ensure compliance and post award expense review
FY, Sponsor, College, Department, Protocol Start and Expiration Date, Award Start and End Date
Number of Active Protocols Track IACUC protocol trend year to year FY, Funded vs Non Funded, Sponsor, College, Department, Protocol Start and Expiration Date, Award Start and End Date, Award Type
Number of IACUC Protocol Backlog Actively monitor the backlog and prioritize as needed to minimize risk of research delays
FY, Funded vs Non Funded, Sponsor, College, Department, Protocol Start and Expiration Date, Award Start and End Date, Reason for Delay
Number of Suspended Protocols Identify instances of potential or actual compliance risks and establish resolution plan or revised process
FY, Funded vs Non Funded, Sponsor, College, Department, Protocol Start and Expiration Date, Award Start and End Date, Suspension Reason
Full Committee Review vs. Designated Member NEW Studies
Track the protocol review process FY, Funded vs Non Funded, Sponsor, College, Department, Protocol Start and Expiration Date, Award Start and End Date, Committee or Reviewer, Status
Full Committee Review vs. Designated Member RENEWALS
Track the protocol review process Same as above

Recommended Performance Metrics PRIORITY AREA 1 A: PROCESS METRICS – COMPLIANCE
25
Topic Area Sample Metric Purpose Parameters
Human Subjects
Number of Grants w/ IRB protocols Identify human subject research on sponsored projects to ensure compliance and post award expense review
FY, Sponsor, College, Department, PI, Protocol Start and Expiration Date, Award Start and End Date
Number of Active Protocols Track IRB protocol trend year to year FY, Funded vs Non Funded, Sponsor, College, Department, Protocol Start and Expiration Date, Award Start and End Date, Award Type
Number of Suspended Protocols Identify instances of potential or actual compliance risks and establish resolution plan or revised process
FY, Sponsor, College, Department, Protocol Start/Expiration Date, Award Start/End Date, Suspension Reason
Number of IRB Protocol Review Backlog Actively monitor the backlog and prioritize as needed to minimize risk research delays
FY, Funded vs Non Funded, Sponsor, College, Department, Protocol Start and Expiration Date, Award Start and End Date, Reason for Delay

Recommended Performance Metrics PRIORITY AREA 1 A: ORGANIZATIONAL STRUCTURE AND MANAGEMENT
26
Topic Area Sample Metric Purpose Parameters
Research Performance / Spending
F&A Recovery vs. F&A Rate Monitor actual recovery versus projected recovery and the distribution to various units/departments
FY, Indirect/MTDC vs Negotiated Rate or Awarded Rate, F&A Amount, Department/Unit, PI, Sponsor

Recommended Performance Metrics PRIORITY AREA 1 B: METRICS
There are 35 metrics categorized as Priority Area 1 B. All are considered high priority metrics but secondary to 1 A. Additionally, these are metrics that UF can currently implement with existing systems in the pre-award, post-award, and compliances offices as well as at a management level. • Once all 1 A metrics have been implemented, reassess 1 B metrics based on current or
upcoming system implementations/enhancements to prioritize accordingly. The following details for each metric are provided in the attached slides: • Topic Area • Sample Metric • Purpose • Parameters Note: Additional details on these metrics are provided in the supporting worksheet.
27
Priority Area 1 B
• High Priority Metrics, Secondary need. • Currently available in UF Systems.

Recommended Performance Metrics PRIORITY AREA 1 B: PROCESS METRICS – PRE AWARD
28
Topic Area Sample Metric Purpose Parameters
Temporary Projects (Pre Award Accounts)
Date Created & Aging of Temporary Projects
Track and manage existing Temporary Projects and when they convert to award
FY, Aging Date, Sponsor, College, Department, PI
Dollar Value of Temporary Projects Not Awarded (Write-Offs)
Identify gaps in process and proactively monitor accounts
FY, $, Anticipated Budget $, Sponsor, College, Department, PI, Write off account
Outgoing Subawards
Number of Outgoing Subaward Population Year to Year
Assess outgoing subaward trends year to year and portion subcontracted out
FY, Sponsor, College, Department, PI, Subcontractor, Subcontractor $, Total Awarded Amt, Project Start and End Date, Budget Start and End Date, Dated Submitted, Date Executed, FTE
Outgoing Subaward Execution Turnaround & Negotiation Time
Ensure defined goals and targets are being met
FY, Sponsor, College, Department, PI, Subcontractor, FTE, Award Start, Date Submitted, Date Fully Executed, Agreement vs Modification
Number of Outgoing Subaward Backlog
Actively track backlog and evaluate reason for backlog, developing solutions to minimize population
FY, Sponsor, College, Department, PI, Subcontractor, Award Start Date, Date Submitted to Sub, Agreement vs Mod, FTE, Reason for Delay

Recommended Performance Metrics PRIORITY AREA 1 B: PROCESS METRICS – POST AWARD
29
Topic Area Sample Metric Purpose Parameters
Subaward & Monitoring
% of Subaward Spend Identify and track instances of significant pass-through funding and assess risk
FY, Sponsor, College, Department, PI, Subcontractor, Subaward Spend, Subaward Budget
A-133 Audit Certifications of Subrecipients (Completion versus Outstanding) or related check if A-133
Ensure A-133 or equivalent is received and reviewed for each Subrecipient
FY, Subrecipient, A-133 Request Date, A-133 Receipt Date, A-133 Outstanding, Subaward Execution Date
Cash Management
Unbilled Expenses Identify instances of billing delays and associated dollars
FY, Sponsor, College, Department, $ Unbilled, Payment Method, Invoice Frequency, Month, Days since last invoice generated
Average amount in holding account to be applied to grant
Oversight of account to ensure $ does not exceed performance target/application of cash occurs at regular intervals
FY, Month, Sponsor, College, Department, LOC versus other (check, wire), Amount

Recommended Performance Metrics PRIORITY AREA 1 B: PROCESS METRICS – POST AWARD
30
Topic Area Sample Metric Purpose Parameters
Closeouts Number of Refund Checks and Associated Dollars
Monitor refund frequency FY, Sponsor, College, Department, Expenditures Budget (Refund amount)
Underspend Accounts, Funds moved to Internal accounts
Monitor frequency and instances by department/sponsor to gage appropriateness
FY, Sponsor, College, Department, Budget 0 Expenditures > $0, Account funds moved to
Cost Transfers Labor Cost Transfers % out of Total Labor Spending
Track labor cost transfer trends and spending
FY, Sponsor, College, Department, $ Labor CT/$ Total Labor Expenses, Award versus Total Award Population
Effort Reporting
Senior-Level PIs with 90% Research Salary
Address instances of individuals who exceed 90% research salary
FY, Per Cycle, Department, PI/Researcher, Appointment
Financial Reporting
FFRs Submitted (On-time vs Late) Assess reporting volume and trends year to year. Evaluate the efficiency of the post award team and possible bottlenecks.
FY/Month, Sponsor, College, Department, Frequency Annual, Quarterly, etc., FFR Due Date, FFR Submission Date, C&G FTE assigned
FFR Backlog Actively monitor the backlog and prioritize as needed to minimize risk to future funding
FY/Month, Sponsor, College, Department, Frequency Annual, Quarterly, etc., FFR Due Date, Reason for delay, C&G FTE assigned

Recommended Performance Metrics PRIORITY AREA 1 B: PROCESS METRICS – COMPLIANCE
31
Topic Area Sample Metric Purpose Parameters
Animal Subjects
Number of Expired Protocols in Database
Identify compliance risks due to lag in protocol
FY, Funded vs Non Funded, Sponsor, College, Department, Protocol Start and Expiration Date, Award Start and End Date
Human Subjects
Number of Renewals vs Expirations
Identify number of renewals and lags in renewal processing with potential impact on research completion
FY, Funded vs Non Funded, Sponsor, College, Department, PI, Protocol Start and Expiration Date, Award Start and End Date, Renewal Application Submission Date, Renewal Application Approval Date
Number of Expired Protocols in Database
Identify compliance risks due to lag in protocol
FY, Funded vs Non Funded, Sponsor, College, Department, PI, Protocol Start and Expiration Date, Award Start and End Date
Full Review Protocols Reviewed by Year
Track number of protocol types and efficiency of processing
FY, Funded vs Non Funded, Sponsor, College, Department, PI, Protocol Start and Expiration Date, Award Start and End Date, Committee, Status
Expedited Protocols Reviewed by Year
Track number of protocol types and efficiency of processing
FY, Funded vs Non Funded, Sponsor, College, Department, PI, Protocol Start and Expiration Date, Award Start and End Date, Committee, Status
Exempt Determinations Made per Year
Track number of protocol types and efficiency of processing
FY, Funded vs Non Funded, Sponsor, College, Department, PI, Protocol Start and Expiration Date, Award Start and End Date, Committee, Status
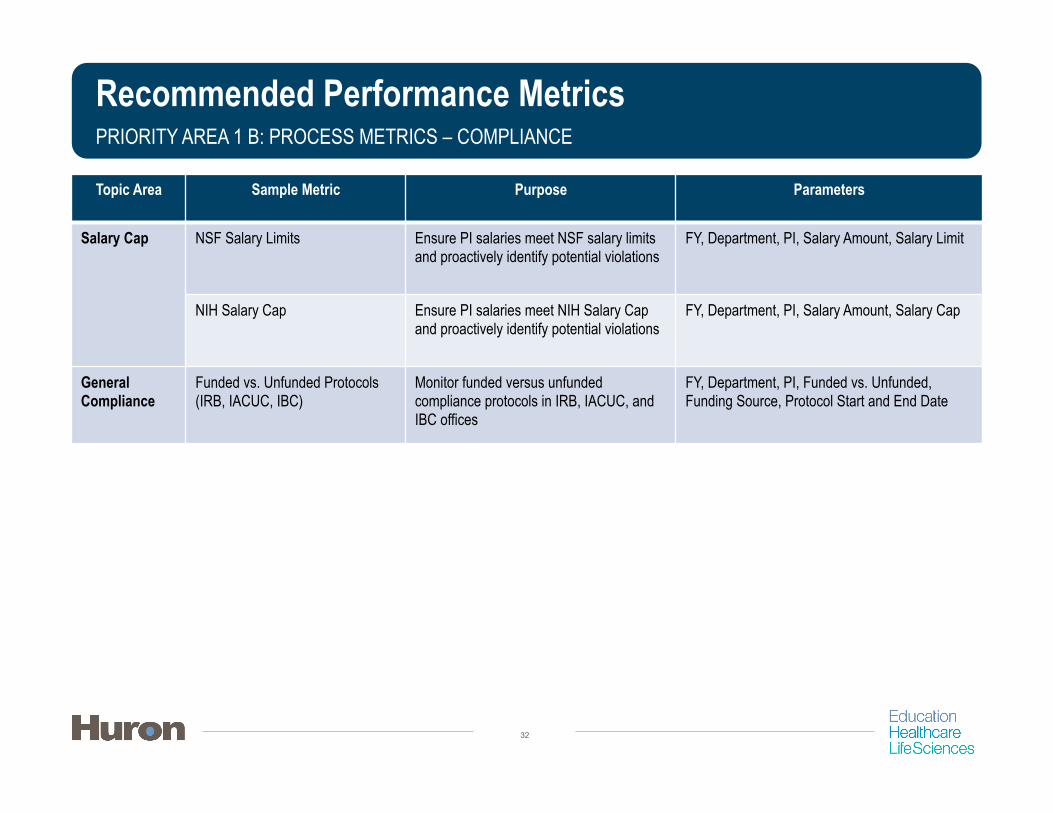
Recommended Performance Metrics PRIORITY AREA 1 B: PROCESS METRICS – COMPLIANCE
32
Topic Area Sample Metric Purpose Parameters
Salary Cap NSF Salary Limits Ensure PI salaries meet NSF salary limits and proactively identify potential violations
FY, Department, PI, Salary Amount, Salary Limit
NIH Salary Cap Ensure PI salaries meet NIH Salary Cap and proactively identify potential violations
FY, Department, PI, Salary Amount, Salary Cap
General Compliance
Funded vs. Unfunded Protocols (IRB, IACUC, IBC)
Monitor funded versus unfunded compliance protocols in IRB, IACUC, and IBC offices
FY, Department, PI, Funded vs. Unfunded, Funding Source, Protocol Start and End Date

Recommended Performance Metrics PRIORITY AREA 1 B: ORGANIZATIONAL STRUCTURE AND MANAGEMENT
33
Topic Area Sample Metric Purpose Parameters
Staffing Levels Turnover Percentage by Function Assess whether turnover rate is on par with standards or relates to other issues
FY, Central Unit, Level (Staff, Mgr., Director, VP)
FTE Vacancies Assess impact of vacancies on operations and end user support
Pre, Post, Compliance- Process Area
Research Performance/ Spending
Research spending by Cost Pool tied to the OR Base
Track components of the OR base and impact to IDC rate
FY, Sponsor, College, Department, Sponsored Project Expenditures by Cost Pool, Total OR Base
F&A Distribution Monitor distribution to various units / departments to assist with future planning and tracking of research enterprise
FY, College, Department, PI, Sponsor, Distribution $/%
Total Research Facility Square Footage
Monitor research space usage and impact to IDC Rate
FY, Unit/Department, PI/faculty assigned to space, usage/assignment
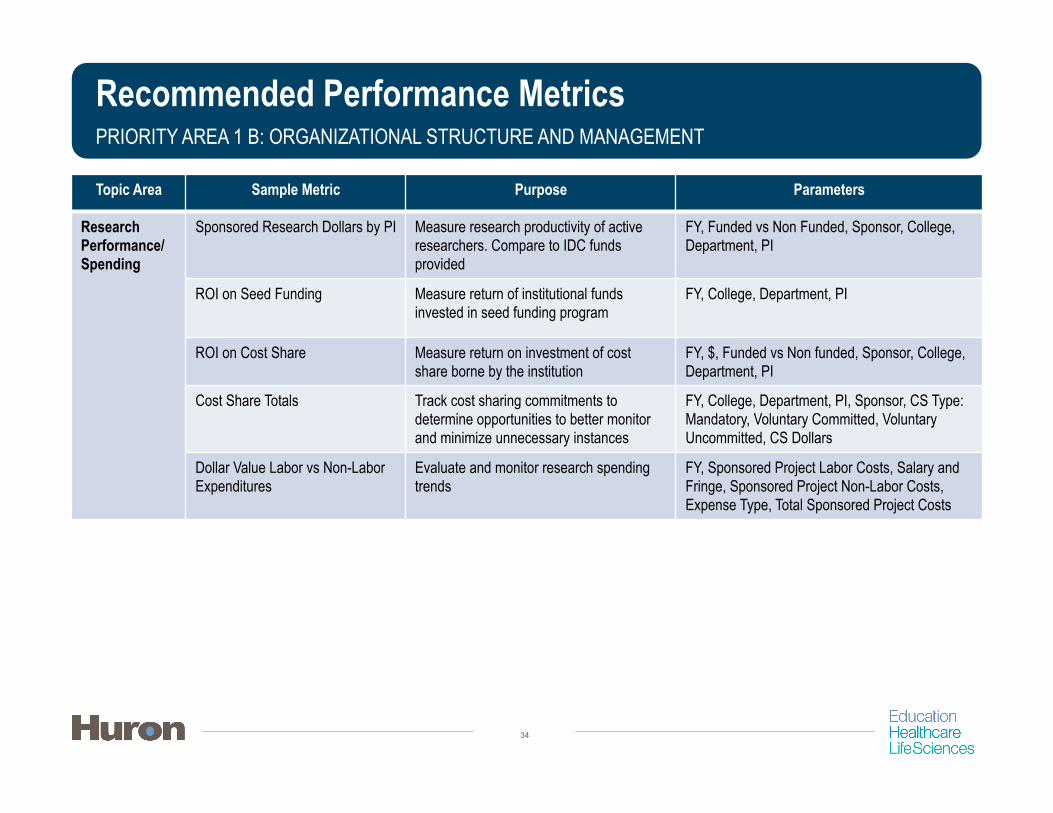
Recommended Performance Metrics PRIORITY AREA 1 B: ORGANIZATIONAL STRUCTURE AND MANAGEMENT
34
Topic Area Sample Metric Purpose Parameters
Research Performance/ Spending
Sponsored Research Dollars by PI Measure research productivity of active researchers. Compare to IDC funds provided
FY, Funded vs Non Funded, Sponsor, College, Department, PI
ROI on Seed Funding Measure return of institutional funds invested in seed funding program
FY, College, Department, PI
ROI on Cost Share Measure return on investment of cost share borne by the institution
FY, $, Funded vs Non funded, Sponsor, College, Department, PI
Cost Share Totals Track cost sharing commitments to determine opportunities to better monitor and minimize unnecessary instances
FY, College, Department, PI, Sponsor, CS Type: Mandatory, Voluntary Committed, Voluntary Uncommitted, CS Dollars
Dollar Value Labor vs Non-Labor Expenditures
Evaluate and monitor research spending trends
FY, Sponsored Project Labor Costs, Salary and Fringe, Sponsored Project Non-Labor Costs, Expense Type, Total Sponsored Project Costs

Recommended Performance Metrics PRIORITY AREAS 2 & 3: METRICS
There are 51 metrics categorized as Priority Areas 2 & 3 and considered high priority metrics that would provide significant value to the research enterprise in the near term. However, these metrics are not supported by existing UF systems. • Priority Area 2 metrics are currently unavailable in UF Systems but should be available
soon with the planned implementation of Click Grants or with enhancements/upgrades to existing UF tools, such as Kayako and My InvestiGator.
• Priority Area 3 metrics are currently unavailable in UF Systems and there do not appear to be immediate plans in place to obtain system solutions to support these metrics.
The following details for each metric are provided in the attached slides: • Priority Area • System / System Enhancement Needed
Note: Additional details on these metrics are provided in the supporting worksheet.
35
Priority Area 2
• High Priority Metrics • Currently Unavailable in UF Systems, should be available soon
Priority Area 3
• High Priority Metrics • Currently Unavailable in UF Systems, not available soon
• Sample Metric • Purpose & Implementation Considerations

Recommended Performance Metrics PRIORITY AREA 2: METRICS
36
Priority Area
System / System Enhancement
Needed
Sample Metrics To Be Generated Once System Exists
Purpose & Implementation Considerations Anticipated Timing of
Implementation
2 Priority
High Available
Soon
Pre-Award System (Click Grants)
• Proposal to Award Acceptance Rate • Average Days Proposal Received
before Submission Deadline • Number and Dollar Value of
Proposals Submitted
Track proposal submission and assess proposal and funding trends year to year. Implementation of Click Grants campus-wide will ensure completeness of pre-award data points that are currently lacking or unavailable.
Fall 2014
Enhanced Electronic Cost Transfer System (PeopleSoft)
• Cost Transfer Review/Process Backlog
Enhance PeopleSoft’s functionality to actively track cost transfer review process and evaluate reason for backlog, while developing solutions to minimize population or enhance process.
No Date Set, System Need Discussed
Shared Service Center Management System (Kayako)
• Number and Dollar Value (Operating Costs) of Established Shared Service Center
• FTE efficiency and processing
Kayako tool tracks number, type and dollar value of transactions processed in CLAS Shared Service Center. Other Shared Service Centers on campus (i.e. IFAS) would need to determine feasibility of implementing this system in their colleges.
No Date Set, System Need Discussed
Upgraded IRB / IACUC System (Click IRB & IACUC)
• IRB / IACUC Protocol Review and Approval Turnaround Time
• Number of IRB / IACUC Instances of Protocol Noncompliance
Upgrades to existing Click systems will better evaluate workload and staff performance while tracking compliance breaches and monitoring progress of resolution plans in place.
Fall 2014 / Winter 2015
* Refer to spreadsheet deliverable for complete listing of Priority 2 Metrics.
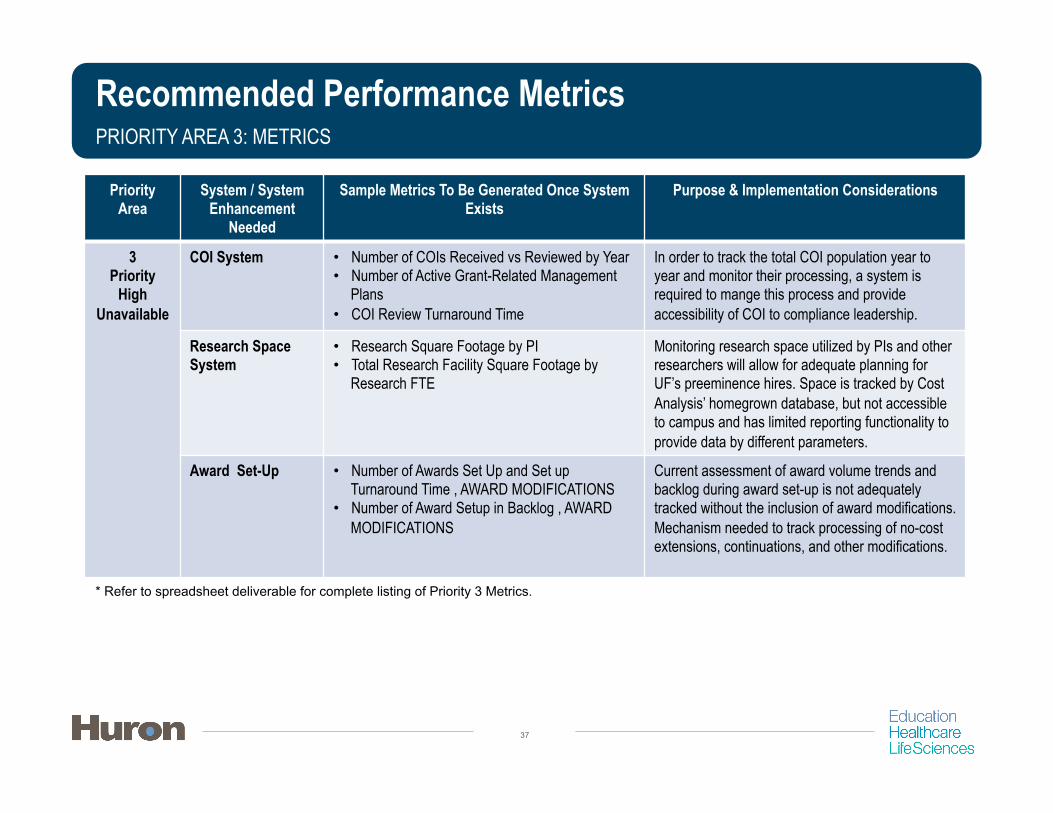
Recommended Performance Metrics PRIORITY AREA 3: METRICS
37
Priority Area
System / System Enhancement
Needed
Sample Metrics To Be Generated Once System Exists
Purpose & Implementation Considerations
3 Priority
High Unavailable
COI System • Number of COIs Received vs Reviewed by Year • Number of Active Grant-Related Management
Plans • COI Review Turnaround Time
In order to track the total COI population year to year and monitor their processing, a system is required to mange this process and provide accessibility of COI to compliance leadership.
Research Space System
• Research Square Footage by PI • Total Research Facility Square Footage by
Research FTE
Monitoring research space utilized by PIs and other researchers will allow for adequate planning for UF’s preeminence hires. Space is tracked by Cost Analysis’ homegrown database, but not accessible to campus and has limited reporting functionality to provide data by different parameters.
Award Set-Up • Number of Awards Set Up and Set up Turnaround Time , AWARD MODIFICATIONS
• Number of Award Setup in Backlog , AWARD MODIFICATIONS
Current assessment of award volume trends and backlog during award set-up is not adequately tracked without the inclusion of award modifications. Mechanism needed to track processing of no-cost extensions, continuations, and other modifications.
* Refer to spreadsheet deliverable for complete listing of Priority 3 Metrics.

Recommended Performance Metrics PRIORITY AREA 4: METRICS
The 10 metrics categorized as Priority Area 4 are medium priority metrics that are not vital in the near term but would be a beneficial to review and monitor once available. These metrics are currently unavailable in UF Systems and there are no immediate plans in place to obtain system solutions to support these metrics at this time. The following details for each metric are provided in the attached slides: • Metric Area • Sample Metric • Purpose • Implementation Considerations
38
Priority Area 4
• Medium Priority Metrics • Currently Unavailable in UF Systems, not available soon

Recommended Performance Metrics PRIORITY AREA 4: METRICS
39
Metric Area Sample Metric Purpose Implementation Considerations
Process Metrics
Number of Proposals not Routed through DSP (but Awarded)
Assess understanding of institutional policy and roles and responsibilities of units. Ensure successful implementation of Click Grants tool.
Utilize Click Grants tool to develop list comparing awards funded/set-up in C&G to proposals reviewed and submitted through DSP. Require manual review.
Organizational Structure &
Management Metrics
Policies & Procedures
Evaluate and track average timespan since last policy review.
Develop system or tool to track policy review and updates by date, area and reviewer. Utilize tool to ensure policies are up to date and applicable to topic.
Research Productivity by PI (Publications, Citations)
Measure research productivity of active researchers in terms of number of publications, citations, etc.
Determine feasibility of developing customized workflow in Click Grants to track publication and citations of researchers. Explore functionality of Vivo tool used in the Health Science Colleges.
People Metrics Staff Performance Management
Monitor professional development of staff and promote goal setting.
Develop a performance management process and system to track individual targets and goals.
* Refer to spreadsheet deliverable for complete listing of Priority 4 Metrics.
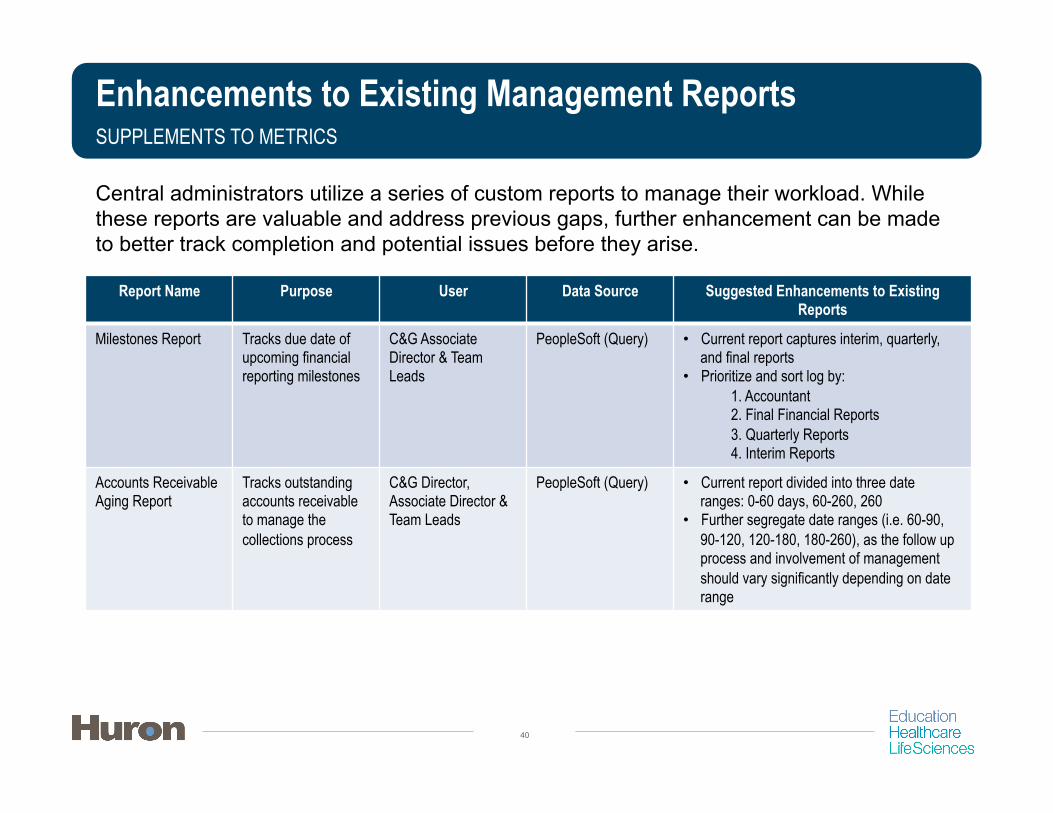
Enhancements to Existing Management Reports SUPPLEMENTS TO METRICS
Central administrators utilize a series of custom reports to manage their workload. While these reports are valuable and address previous gaps, further enhancement can be made to better track completion and potential issues before they arise.
40
Report Name Purpose User Data Source Suggested Enhancements to Existing Reports
Milestones Report Tracks due date of upcoming financial reporting milestones
C&G Associate Director & Team Leads
PeopleSoft (Query) • Current report captures interim, quarterly, and final reports
• Prioritize and sort log by: 1. Accountant 2. Final Financial Reports 3. Quarterly Reports 4. Interim Reports
Accounts Receivable Aging Report
Tracks outstanding accounts receivable to manage the collections process
C&G Director, Associate Director & Team Leads
PeopleSoft (Query)
• Current report divided into three date ranges: 0-60 days, 60-260, 260
• Further segregate date ranges (i.e. 60-90, 90-120, 120-180, 180-260), as the follow up process and involvement of management should vary significantly depending on date range

Application of Performance Metrics

Application of Performance Metrics KEY TO METRIC SUCCESS
Metrics must be supported by four key components, which will enable effective analysis and decision making.
42
Metrics
Technology
Organizational Structure
People
Processes
UF has made significant investments in these four areas. However, in order to successfully implement performance metrics, additional enhancements should be made. • The following slides outline both the investments that UF has made, and several draft
recommendations for additional enhancements that could enable UF to effectively and fully utilize performance metrics for research and research administration.
Application of Performance Metrics: UF Investments

Application of Performance Metrics – UF Investments TECHNOLOGY
Office of Research UF has made great strides in beginning to integrate research components through the introduction of new technologies to improve the business functions related to research
44
Research Administration Technology
Past Investment in Systems: • PeopleSoft • Click IRB • Click IACUC
Selection of Pre Award System: • Click Grants
Identification of Systems to Support Operations: • COI • IBC
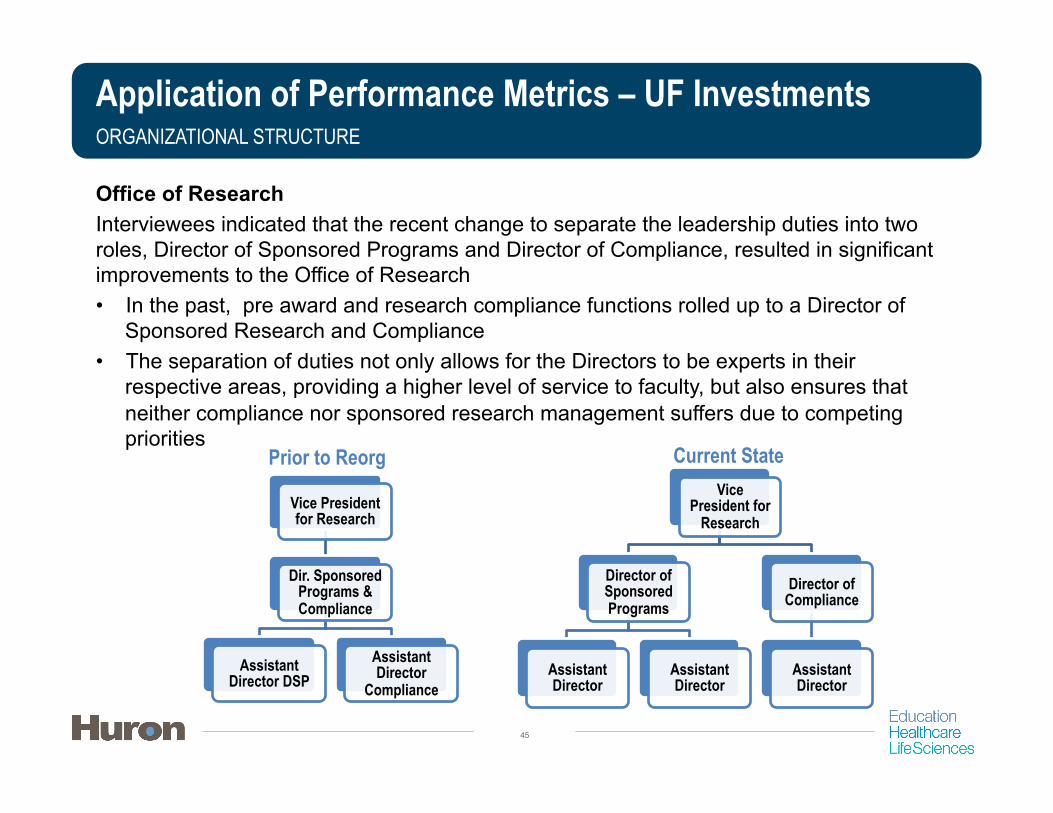
Application of Performance Metrics – UF Investments ORGANIZATIONAL STRUCTURE
Office of Research Interviewees indicated that the recent change to separate the leadership duties into two roles, Director of Sponsored Programs and Director of Compliance, resulted in significant improvements to the Office of Research • In the past, pre award and research compliance functions rolled up to a Director of
Sponsored Research and Compliance • The separation of duties not only allows for the Directors to be experts in their
respective areas, providing a higher level of service to faculty, but also ensures that neither compliance nor sponsored research management suffers due to competing priorities
45
Current State Vice
President for Research
Director of Sponsored Programs
Assistant Director
Assistant Director
Director of Compliance
Assistant Director
Prior to Reorg
Vice President for Research
Dir. Sponsored Programs & Compliance
Assistant Director DSP
Assistant Director
Compliance

Application of Performance Metrics – UF Investments ORGANIZATIONAL STRUCTURE
Research Program Development The creation of a division dedicated to performing personalized funding searches, assisting with large grant proposal development and coordinating internal competition and limited submission programs has been a success according to interviewees • PIs and administrators that have utilized these services have expressed positive
experiences and have returned for continued assistance • As the institution places greater emphasis on cross collaboration and complex awards,
there will be a greater reliance on the unit to provide consulting and proposal management services
46

Application of Performance Metrics – UF Investments PEOPLE
Faculty and Department Administrators Training UF has mandated specific compliance training to address inconsistencies in practices which have a direct impact on compliance
Office of Research – Business Intelligence UF is planning to hire two business intelligence experts to analyze key performance indicators and develop tools to address needs across DSP, C&G, compliance and program development. • This investment will enable UF to translate recommended metrics into reality and
identify gaps between process and compliance to provide oversight.
47
Training Required Attendees Cost Principles PIs and anyone who facilitates the development of budgets, charging of costs, distribution of
payroll, or any financial activity of sponsored research
Effort Reporting
University faculty and support staff engaged in sponsored research much complete: • Effort Fundamentals • Effort Management – Staff Only
Position Title Position Description Assistant Director, Business Intelligence
Evaluate and analyze current measures and guide the development of tools to support the research enterprise
Application Developer Analyst 3 Provide the technical expertise to assist the AD

Application of Performance Metrics – UF Investments PROCESSES
Office of Research and C&G – Business Processes and Monitoring UF has made several investments in tools to track process completion, efficiency and risk. Some examples of recent accomplishments include: • Developed a comprehensive award checklist to identify potential compliance risks
before spending can begin • Joint initiative between DSP and Compliance • In process of creating electronic form and training for accountant
• Implemented an AR Aging report • Established tools to prioritize financial reporting and invoice deadlines • Developed key detailed desk references to assist post award processing • Standardized a budget guidance that ensures DSP identifies the needed information to
minimize award setup effort once information passed along to C&G
48

Application of Performance Metrics: Considerations for Additional Enhancements
Slides noted as Draft, since additional recommendations were not included in the original scope of this project

Considerations for Additional Enhancements ORGANIZATIONAL STRUCTURE
Research Program Development – Organizational Structure and Services Establish venues and vehicles to inform campus of Research Program Development’s purpose and value related to proposal development • Develop a long-term strategy to ensure cross-communication and seamless proposal
tracking and submission between Research Program Development and DSP • Assess the number of FTEs needed to support the growing requests of the Division
• Currently, the Division is not able to provide assistance with budget development • Long-term, it may be valuable to invest in a resource with expertise in grant and contract
budgeting to assist up front with budget development; this would help expedite proposal submission
50

Considerations for Additional Enhancements ORGANIZATIONAL STRUCTURE
DSP – Organizational Structure Consider reorganizing both Proposal Processing and Pre Award Service and Award Administration by College • The current structure of first-come, first serve has been sufficient but is likely not
sustainable long-term with a growing research portfolio that requires specialization, particularly with state, foundation and industry sponsors
• Mirroring the structure of C&G could enhance communication and dissemination of information between both units, building relationships at all levels across both offices
• This alignment will help PIs and department administrators by providing them with a constant, core central team who understands their needs
• DSP could better position itself to use metrics to assess workload against targeted goals as individual and team assignments can be tracked and trends forecasted based on the specialization
• Note: Assessment of skillsets and each college portfolio should be completed before a
successful organizational change can be made
51
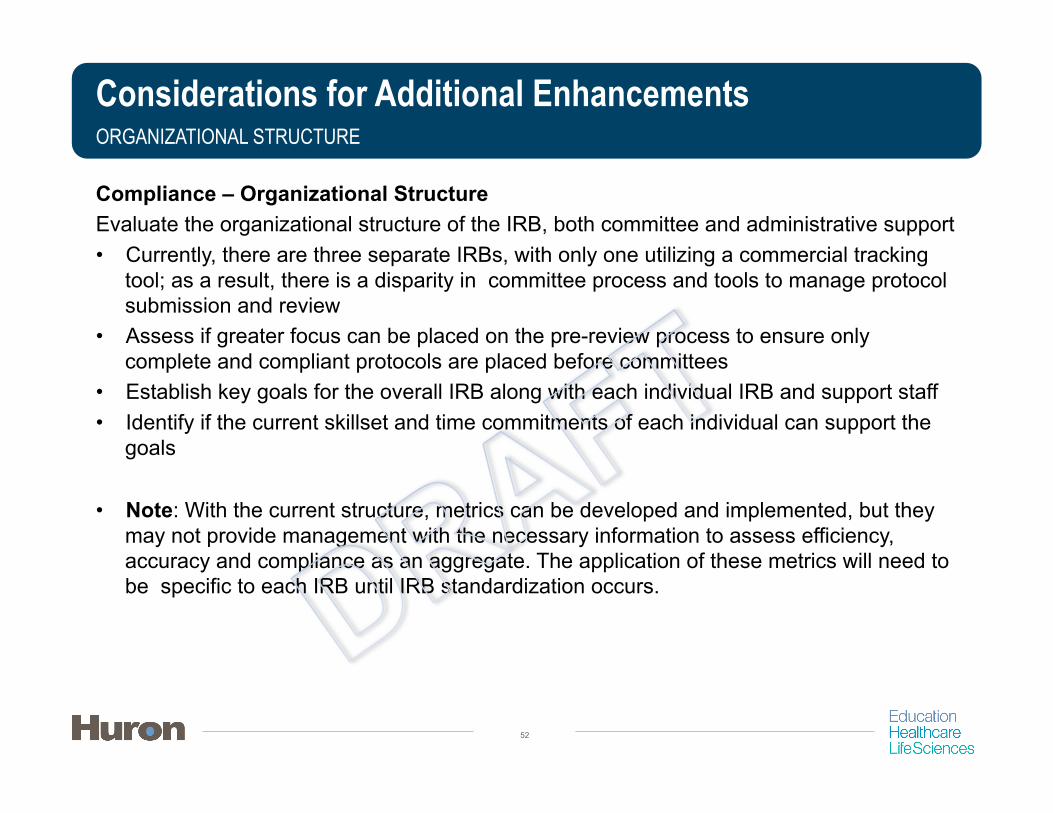
Considerations for Additional Enhancements ORGANIZATIONAL STRUCTURE
Compliance – Organizational Structure Evaluate the organizational structure of the IRB, both committee and administrative support • Currently, there are three separate IRBs, with only one utilizing a commercial tracking
tool; as a result, there is a disparity in committee process and tools to manage protocol submission and review
• Assess if greater focus can be placed on the pre-review process to ensure only complete and compliant protocols are placed before committees
• Establish key goals for the overall IRB along with each individual IRB and support staff • Identify if the current skillset and time commitments of each individual can support the
goals • Note: With the current structure, metrics can be developed and implemented, but they
may not provide management with the necessary information to assess efficiency, accuracy and compliance as an aggregate. The application of these metrics will need to be specific to each IRB until IRB standardization occurs.
52
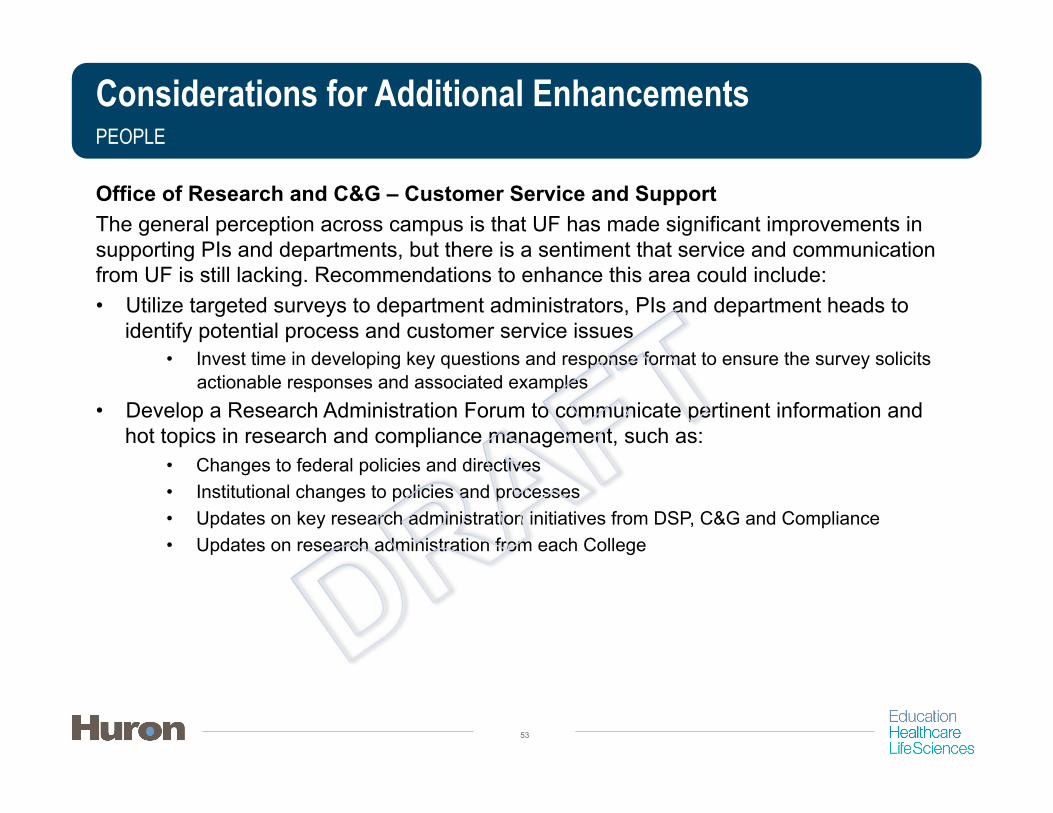
Considerations for Additional Enhancements PEOPLE
Office of Research and C&G – Customer Service and Support The general perception across campus is that UF has made significant improvements in supporting PIs and departments, but there is a sentiment that service and communication from UF is still lacking. Recommendations to enhance this area could include: • Utilize targeted surveys to department administrators, PIs and department heads to
identify potential process and customer service issues • Invest time in developing key questions and response format to ensure the survey solicits
actionable responses and associated examples • Develop a Research Administration Forum to communicate pertinent information and
hot topics in research and compliance management, such as: • Changes to federal policies and directives • Institutional changes to policies and processes • Updates on key research administration initiatives from DSP, C&G and Compliance • Updates on research administration from each College
53

Considerations for Additional Enhancements PEOPLE
Faculty and Department Administrators – Training In addition to the existing and planned compliance training, there was a need expressed by several Colleges for training on grant management fundamentals • Through the UFirst initiative, DSP, C&G and Compliance have determined a need to
develop applied research administration courses that address award lifecycle principles. • If not already planned, these courses should include real-life examples and cases for
attendees to apply concepts to daily tasks and supplement compliance training. Some examples may include:
• Elements of strong proposal • Budgeting • Expenditure review and reconciliation • Key to developing a strong protocol
• Greater emphasis on research management training should directly correlate to increased compliance as individuals can identify and address the symptoms before they become issues or breaches in compliance
54

Considerations for Additional Enhancements PEOPLE
Office of Research and C&G – Performance Management Implement a performance management system that tracks staff accomplishments against defined goals • Establish targets for all each level and stretch goals for each individual • Goals should measure task completion, accuracy, and customer service
Office of Research and C&G – Training Establish a core training curriculum for each division of OR – DSP, C&G and Compliance. Benefits would include: • Reducing instances of incorrect or conflicting information communicated to department
administrators and PIs • Assisting with onboarding of new staff ensuring all individuals are trained consistently • Further staff professional development by cross-training within each division • Providing opportunities to highlight staff skillset and knowledge by enlisting them in the
development and facilitation of training • Note: Implementing metrics to track completion of training will not only allow
management to ensure individuals are receiving needed information to be successful in their job, but also assess the value of each training by analyzing accuracy of task completion over time
55
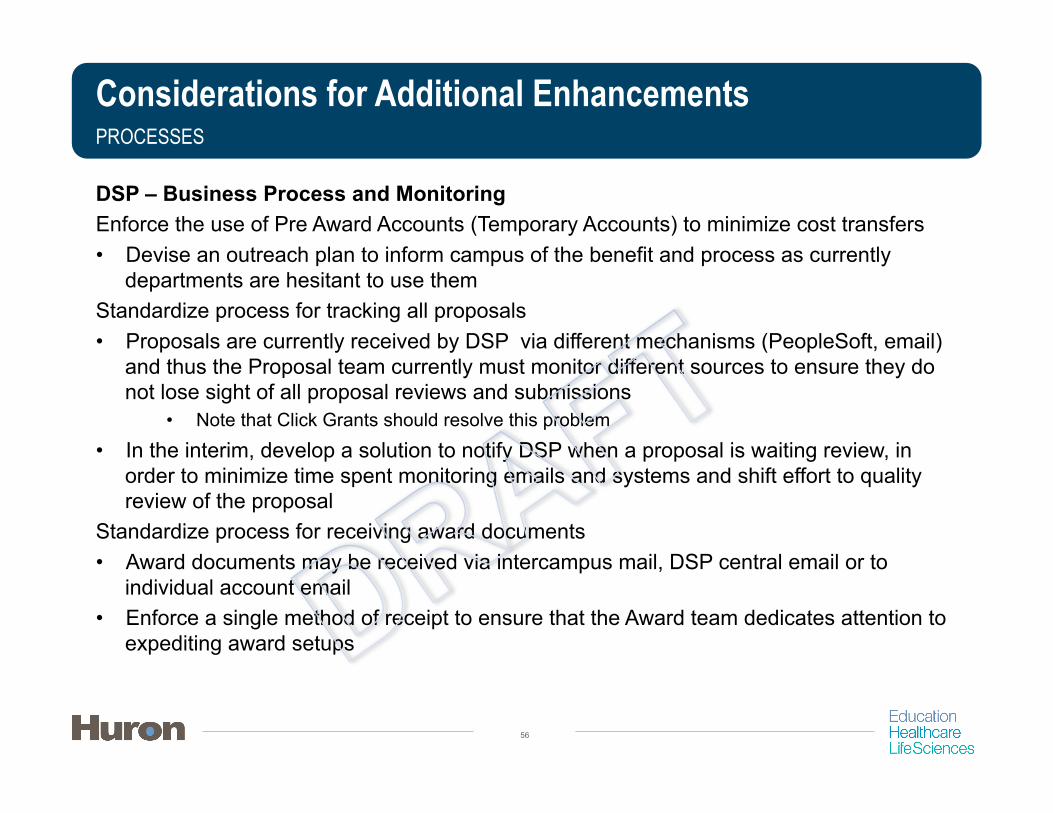
Considerations for Additional Enhancements PROCESSES
DSP – Business Process and Monitoring Enforce the use of Pre Award Accounts (Temporary Accounts) to minimize cost transfers • Devise an outreach plan to inform campus of the benefit and process as currently
departments are hesitant to use them Standardize process for tracking all proposals • Proposals are currently received by DSP via different mechanisms (PeopleSoft, email)
and thus the Proposal team currently must monitor different sources to ensure they do not lose sight of all proposal reviews and submissions
• Note that Click Grants should resolve this problem
• In the interim, develop a solution to notify DSP when a proposal is waiting review, in order to minimize time spent monitoring emails and systems and shift effort to quality review of the proposal
Standardize process for receiving award documents • Award documents may be received via intercampus mail, DSP central email or to
individual account email • Enforce a single method of receipt to ensure that the Award team dedicates attention to
expediting award setups
56

Considerations for Additional Enhancements PROCESSES
C&G – Business Process and Monitoring Track and prioritize closeout population to actively reduce backlog • Assess the backlog of closeouts and devise strategy to close accounts • Prioritize based on various methods:
• Accountant authority to transfer balance • Age of balance and associated process – write-off, transfer, escalation • Sponsor • Bill Type
C&G – Policies and Procedures Policies and procedures exist for some research administration functions, but others should be created or further enhanced • Create:
• AR review and escalation
• Enhance: • Bad debt write-off
• Ensure procedures enable prospective rather than retrospective monitoring
57

Implementation Plan for Performance Metrics

An implementation strategy must be devised to facilitate the creation and successful roll-out of performance metrics, ideally in conjunction with the roll-out of additional enhancements.
Step 1
• Identify resource requirements and set implementation date • Functional and
technical resources • Time allocation
Step 2
• Verify the intended use with stakeholders and end users • Metric usage and
frequency • Measurement and
decision making
Step 3
• Map metric parameters to system data points • Availability of data
and accuracy • Ease of extraction
Step 4
• Develop metrics • Extract data from
system(s) and join information
• Verify data through unit and end user testing
Step 5
• Roll-out metrics and share results • Develop process
for metric application and training, where needed
• Communicate findings
Implementation Plan for Performance Metrics APPROACH
59
The process does not end at Step 5, continual review must occur to measure the value of each
metric and need for revision or elimination.
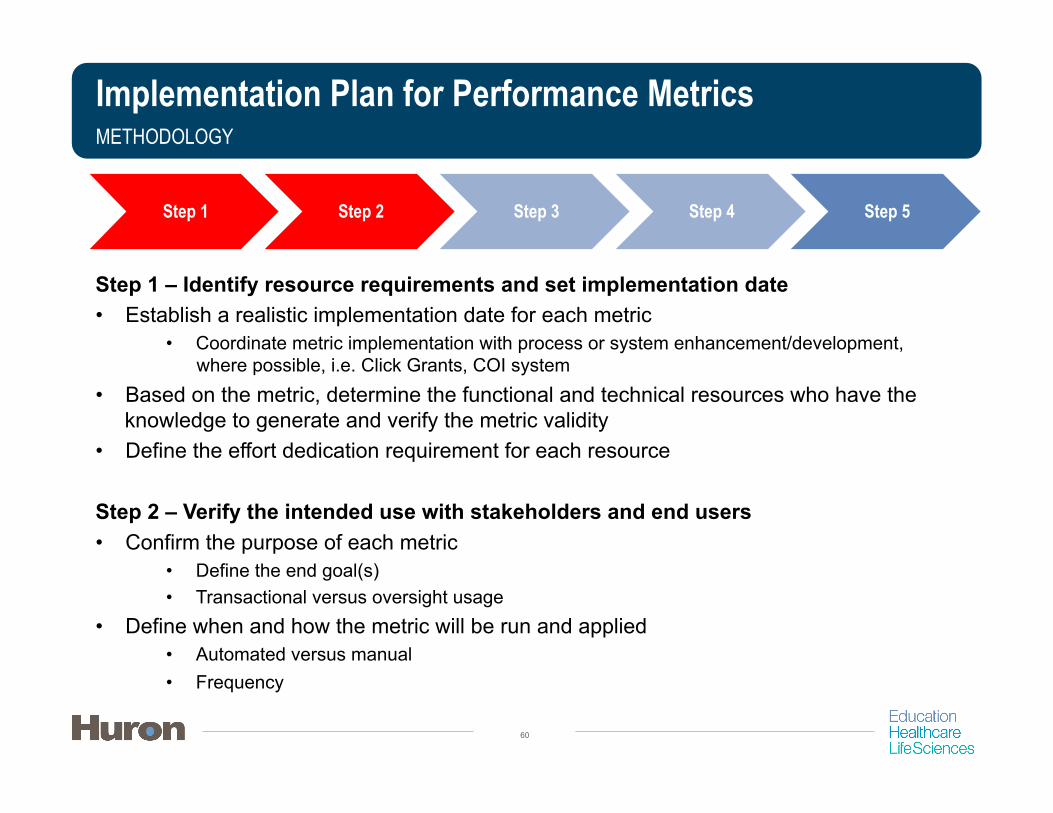
Implementation Plan for Performance Metrics METHODOLOGY
Step 1 – Identify resource requirements and set implementation date • Establish a realistic implementation date for each metric
• Coordinate metric implementation with process or system enhancement/development, where possible, i.e. Click Grants, COI system
• Based on the metric, determine the functional and technical resources who have the knowledge to generate and verify the metric validity
• Define the effort dedication requirement for each resource
Step 2 – Verify the intended use with stakeholders and end users • Confirm the purpose of each metric
• Define the end goal(s) • Transactional versus oversight usage
• Define when and how the metric will be run and applied • Automated versus manual • Frequency
60
Step 1 Step 2 Step 3 Step 4 Step 5

Implementation Plan for Performance Metrics METHODOLOGY
Step 3 – Map metric parameters to system data points • Define needed parameters to develop metric • Determine where each parameter is housed – system, shadow system, nonexistent
• If nonexistent, determine if another vehicle will be developed to capture the information – Many of the Pre Award specific metrics cannot be developed until Click Grants is live or an
intermediary solution is in place – Multiple Pre Award systems further complicate the ability to gather needed data points – Post Award metrics will require assistance from Enterprise Systems to extract information from
PeopleSoft
• Evaluate the accuracy of the data • Identify level of effort required to extract data
• Hours • Resources • Queries and processes
61
Step 1 Step 2 Step 3 Step 4 Step 5

Implementation Plan for Performance Metrics METHODOLOGY
Step 4 – Develop Metrics • Extract data points from the system(s) and/or data warehouse • Where possible, run parallel processes to ensure metric mirrors system information • Involve functional users to ensure metric can support daily task completion • Quantify data extraction and metric production effort to provide management with an
understanding of the resource allocation needed to develop metric (i.e. hour, overnight processes)
Step 5 – Roll-out metrics and share results • Determine appropriate method for communicating metric and its usage • Establish targets and goals based on the metric purpose and usage • Evaluate findings over time to determine trends and challenges • Reevaluate processes based on metric analysis • Standardize process for communicating findings and OR next steps to improve research
administration functions via campus forums and central administration meetings
62
Step 1 Step 2 Step 3 Step 4 Step 5
Appendices

Appendix A DOCUMENTS RECEIVED
64
Data Element Number
Data Element
1 Position Descriptions 2 Organizational Charts 3 Departmental Staffing Background 4 Existing Performance Measures 5 Policies, Procedures, & Training 6 Active Awards, FY 2010 – FY 2014 7 Proposal Submitted, FY 2013 – 2014 8 IRB, IRB & IBC Protocol Submitted, FY 2011 – 2013 9 COIs Reviewed Approved, FY 2011 – 2013
10 F&A Rate 11 Research IT Systems Background & Report Queries 12 Customer Service Survey Results (Research Program Development)

Appendix B INTERVIEW LIST
65
Research Admin. Area Name* Title Central Leadership Brad Staats Assistant VP and Director, Contracts & Grants
Dr. David Nelson Assistant VP for Research Dr. David Norton VP for Research Matt Fajack Chief Financial Officer Dr. Sobha Jaishankar Assistant VP and Director, Research Program Development Stephanie Gray Director, Division of Sponsored Programs
Compliance Dr. Irene Cooke Assistant VP and Director, Research Compliance Michael Mahoney Director, Research Operations & Services
Information Services & Technology
Nick Dunham Director, Information Services, Office of Research Nigel Chong-You Business Relationship Manager, Enterprise Systems
Cost Analysis Brenda Harrell Assistant Controller, Effort Administration & Reporting
*Alphabetized by first name

Appendix B INTERVIEW LIST
66
Research Admin. Area Name* Title Division of Sponsored
Programs Anthe Hoffman Assistant Director Brian Miller Assistant Director Brian Prindle Associate Director Judy Harris Team Lead, Proposal Processing/Pre-Award Services Roz Heath Associate Director Tina Bottini Assistant Director Vera Teel Team Lead, Award Administration
Contracts & Grants Bill Gair Quality Control, C&G Cathy Thompson Associate Director, C&G Billing & Accounting Team Jonathan Evans Team Lead, C&G Research Administration Team Kat Carter-Finn Team Lead, C&G Research Administration Team Kim Welsh Team Lead, C&G Research Administration Team Lisa Yates Team Lead, C&G Research Administration Team Stephanie Lafferty Team Lead, C&G Research Administration Team Tiffany Schmidt Associate Director, C&G Research Administration Team
*Alphabetized by first name

Appendix B INTERVIEW LIST
67
Research Admin. Area Name* Title PIs, Dept. Administrators,
Chairs, and Deans
Adrienne Fagan Business Administration Specialist, Fifield Shared Services
Alethea Geiger Grants Business Administrative Specialist, College of Liberal Arts & Sciences Shared Services
Alicia Turner Assistant Director, Clinical & Translational Science Institute
Angela Gifford Administrative Service Coordinator, School of Forest Resources & Conservation
Barbara Janowitz Coordinator of Research Programs, College of Public Health & Health Professions
Dr. Barry Byrne Professor & Associate Chair, Pediatrics and Director, Powell Gene Therapy Center
Conroy Smith CRIS Coordinator, Institute of Food & Agricultural Sciences Research
Darlene Novak Assistant Director, Florida Museum of Natural History Donna Durgin Accountant, North Florida Research & Education Center Dorothea Roebuck Grants Manager, College of Health & Human Performance
Dr. Bill Millard Associate Dean for Administration & Research Affairs, College of Pharmacy
Dr. Chuck Peloquin Professor, Pharmacotherapy & Translational Research
*Alphabetized by first name

Appendix B INTERVIEW LIST
68
Research Admin. Area Name* Title PIs, Dept. Administrators,
Chairs, and Deans
Dr. Douglas Archer Associate Dean for Research, Institute of Food & Agricultural Sciences Dr. Forrest Masters Associate Professor, Civil and Coastal Engineering Dr. Henry Baker Hazel Kitzman Professor of Genetics and Chair, Surgery Dr. Hugh Fan Professor, Mechanical Aerospace and Engineering Dr. Jennifer Curtis Associate Dean, College of Engineering Dr. Jim Jawitz Associate Chair, Soil and Water Science Dr. John Davis Professor, School of Forest Resources and Conservation Dr. Margaret Fields Associate Dean, College of Liberal Arts & Sciences Dr. Mary Ellen Davey Associate Professor, Oral Biology Dr. Rich Segal Professor, Pharmaceutical Outcomes & Policy
Dr. Rob Gilbert Professor, Agronomy and Director, Everglades Research & Education Center
Dr. Robert Burne Associate Dean for Research, College of Dentistry
*Alphabetized by first name

Appendix B INTERVIEW LIST
69
Research Admin. Area Name* Title PIs, Dept. Administrators,
Chairs, and Deans
Dr. Shannon Wallet Associate Professor, Periodontology and of Oral Biology
Dr. Thomas Pearson Executive Vice President for Research & Education, Health Science Center
Dr. Tony Romeo Professor, Microbiology and Cell Science
Elizabeth Amdur Associate Director, Finance & Accounting, Controller's Office, Shared Services
Ericka Solano Grants Manager, Medicine Gary Hamlin Senior Grant Specialist, College of Pharmacy Jan Machnick Senior Grants Specialist, Mechanical & Aerospace Engineering Jorg Bungert Professor, Biochemistry & Molecular Biology Joyce Hudson Research Administrator, Anesthesiology Kathy Galloway Assistant Director for Research Administration, College of Dentistry
Keith Gouin Coordinator/Administrative Services, Institute of Food & Agricultural Sciences Extension
Kimberly Snyder Research Programs and Services Coordinator, Surgery
*Alphabetized by first name

Appendix B INTERVIEW LIST
70
Research Admin. Area Name* Title PIs, Dept. Administrators,
Chairs, and Deans
Dr. Lyle Moldawer Professor, Surgery Maria ‘Angela’ Medyk Fiscal Officer, Electrical & Computer Engineering
Max Williams Coordinator/Administrative Services, Agricultural & Biological Engineering
Nancy Wilkinson Director of Finance & Business Operations, Institute of Food & Agricultural Sciences Research
Nicole Darrow Grants Manager & Project Coordinator, Emerging Pathogens Institute Dr. Steve Sugrue Senior Associate Dean of Research Affairs, College of Medicine Susan Griffith Office Manager, Pharmacotherapy and Translational Research Tammy Siegel Administrative Assistant, Citrus Research & Education Center
Terry Moore Fiscal Officer, Materials Science & Engineering Theresa Martin Administrative Assistant, Agronomy
*Alphabetized by first name

Appendix C SAMPLE PI PORTAL UCLA (1 OF 3)
71
The UCLA PI Portal is a one-stop location for all PI needs: Proposal, Awards, Protocols, COI disclosures, Inventions and MTAs. Additionally, key non-financial deliverables are displayed on a tab to keep the PI abreast of all current and upcoming actions

Appendix C SAMPLE PI PORTAL UCLA (2 OF 3)
72
The UCLA PI Portal My Proposals module contains all proposals submitted by a PI (at UCLA) and gives investigators the ability to access full proposal packages, view the current status of proposals submitted to central office and allows administrators to create Other Support pages for NIH and NSF with the push of a button.
Ability to create automated, editable NIH and NSF Other
Support Forms
Provides complete, final proposal package for
easy access at any time
Provides real-time status of proposal submitted to
central office
Push button e-mail capability for easy contact with central
admin.

Appendix C SAMPLE PI PORTAL UCLA (3 OF 3)
Overnight Feed from General Ledger
providing near real-time data
Expenses projected based upon payroll
distribution and other encumbrances
Ability to enter manual adjustments for projection
purposes
PI portal is self service for PIs and access can be delegated to admin.
Ability to drill into expenses for more detail
The UCLA PI Portal My Funds module contains the current financial snapshot of each of the PI’s active research contracts/grant, detailed transaction data for each expense, and projected expenses through the end of the contract/grant budget period.
73
Burn rate chart comparing spending
rate against time remaining in project
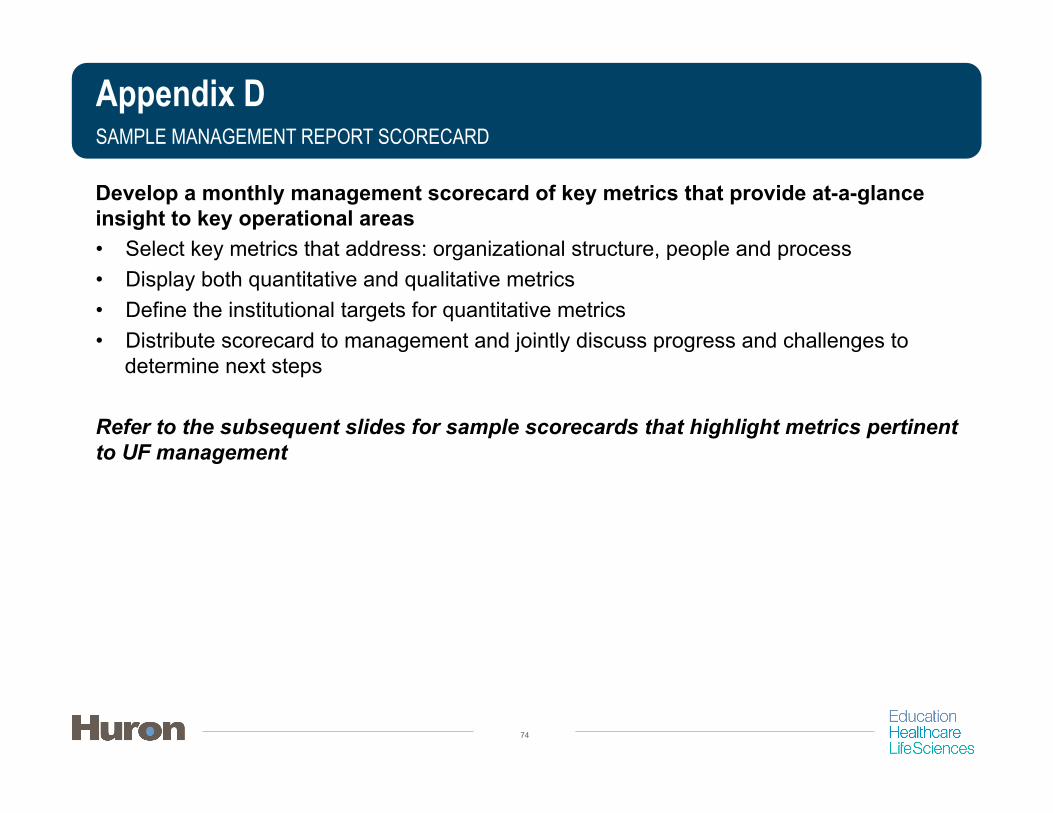
Appendix D SAMPLE MANAGEMENT REPORT SCORECARD
74
Develop a monthly management scorecard of key metrics that provide at-a-glance insight to key operational areas • Select key metrics that address: organizational structure, people and process • Display both quantitative and qualitative metrics • Define the institutional targets for quantitative metrics • Distribute scorecard to management and jointly discuss progress and challenges to
determine next steps
Refer to the subsequent slides for sample scorecards that highlight metrics pertinent to UF management
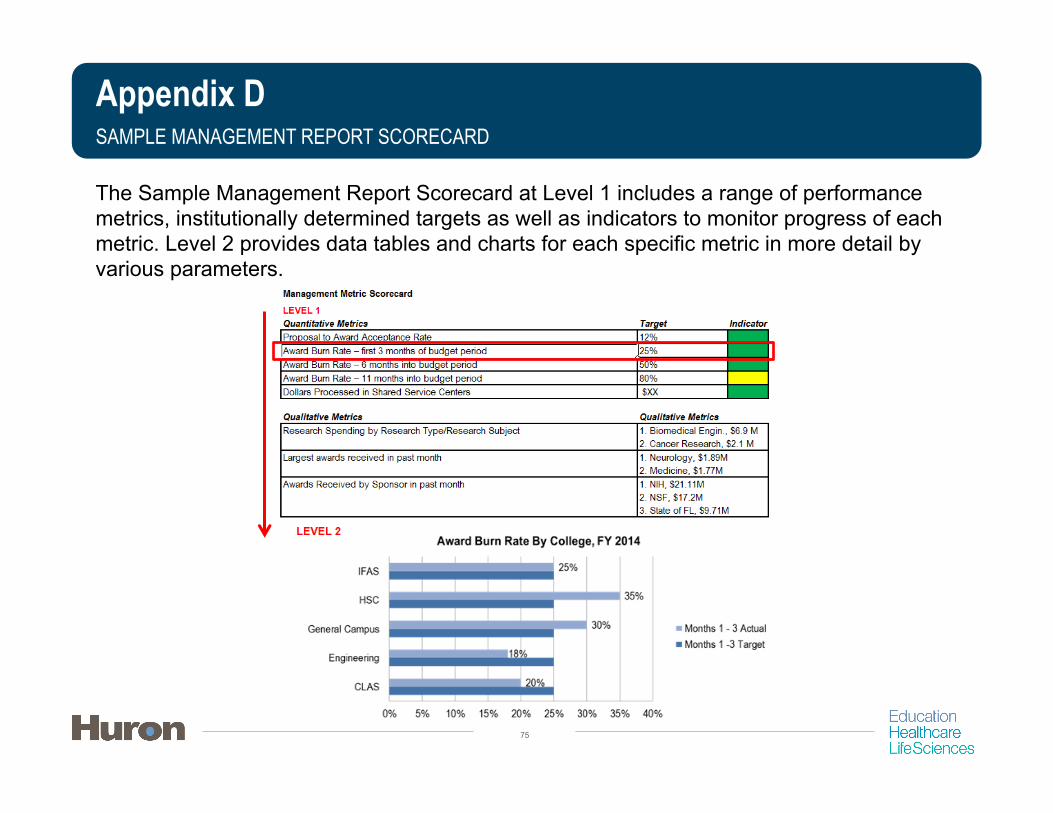
75
The Sample Management Report Scorecard at Level 1 includes a range of performance metrics, institutionally determined targets as well as indicators to monitor progress of each metric. Level 2 provides data tables and charts for each specific metric in more detail by various parameters.
Appendix D SAMPLE MANAGEMENT REPORT SCORECARD

SAMPLE MANAGEMENT REPORT SCORECARD – QUANTITATIVE METRIC FINDINGS
76
Management Metric Tracking Targets* To be Defined Indicator* Notes*
Proposal to Award Acceptance Rate 12%
Award Burn Rate – first 3 months of budget period
25%
Award Burn Rate – 6 months into budget period 50%
Award Burn Rate – 11 months into budget period 80% X% higher than anticipated spending
Dollars Processed in Shared Service Centers $XX
DSP Proposal Submission Turnaround Time 2 days Delays due to 2 FTE vacations
IRB Protocol Turnaround Time 3 days
IACUC Protocol Turnaround Time 3 days
*Information is for display purposes only, no analysis has been done to identify targets and success
Appendix D – Level 1
Near optimal contributing to an effective and efficient research administration operation Room for improvement Below Par – significant room for
improvement

Appendix D – Level 2 SAMPLE MANAGEMENT REPORT SCORECARD
77
Management Metric Tracking Targets* To be Defined Indicator* Notes*
Award Burn Rate – first 3 months of budget period
25%
20%
18%
30%
35%
25%
0% 5% 10% 15% 20% 25% 30% 35% 40%
CLAS
Engineering
General Campus
HSC
IFAS
Award Burn Rate By College, FY 2014
Months 1 - 3 Actual Months 1 -3 Target
Upon selection of Level 1 metric, Level 2 details display

Appendix D – Level 2 SAMPLE MANAGEMENT REPORT SCORECARD
78
Management Metric Tracking Targets* To be Defined Indicator* Notes*
Dollars Processed in Shared Service Centers $XX
$12,000,000
$8,000,000
Financial Transactions Processed in College A, FY 2014
Shared Service Center Department Support $-
$2
$4
$6
$8
$10
Quarter 1
Quarter 2
Quarter 3
Quarter 4
Millio
ns
Financial Transactions Processed in College A, FY 2014
Department Support
Shared Service Center
Upon selection of Level 1 metric, Level 2 details display

SAMPLE MANAGEMENT REPORT SCORECARD – QUANTITATIVE METRIC FINDINGS
79
Management Metric Tracking Targets* To be Defined Indicator* Notes*
Average Award Setup Turnaround Time 2 Delays due to missing compliance documents
Monthly unbilled balance $500,000
Average total accounts receivable balance $10,000,000
Average accounts receivable balance over 120 days
$XX
Average accounts receivable balance over 240 days
$XX
Average days outstanding for accounts receivable
85 days
Number of late financial reports 0
Number of closeouts (> 90 days past project period end)
20% of active awards
*Information is for display purposes only, no analysis has been done to identify targets and success
Appendix D – Level 1
Near optimal contributing to an effective and efficient research administration operation Room for improvement Below Par – significant room for
improvement

Appendix D – Level 1 SAMPLE MANAGEMENT REPORT SCORECARD – QUALITATIVE METRIC FINDINGS
80
Management Metric Tracking Display Criteria for Management
Research Spending by Research Type/Research Subject 1. Top 5-10 areas
2. Dollars
Largest awards received in past month 1. Department
2. Dollars
Awards Received by Sponsor in past month 1. Top 5 sponsors
2. Dollars
Cost in Red Flagged Object Codes 1. Top 5-10 object codes
2. Dollars
Sponsored Project Cost Transfers by Department 1. PI
2. Dollars
Cost Share Totals for month 1. Colleges
2. Department
3. Dollars


UF Performance Metrics Assessment Potential Metrics to Develop
7/17/14 1 of 34
Count1 - Higher Priority* + Available in Existing UF Systems 72 A - Implement/Invest in Metric Immediately 37 B - Implement/Invest in Metric Eventually 352 - Higher Priority* + Unavailable in Existing UF Systems (Available with Click or Enhancements to Existing Systems) 273 - Higher Priority* + Unavailable in Existing UF Systems 244 - Medium Priority* + Unavailable in Existing UF Systems 10* Initial priority metrics based on compliance and financial implications to UF customer service.
Table 1: List of Potential Metrics to Develop by Organizational Element
Organizational Element Evaluation Area Metric Number
Metric Metric Units Priority Area Priority Sub-Area
Parameters / Data Elements Purpose Intended Audience Requested By (If Applicable)
Priority Area 1: Priority Metric & currently available in UF systemsPROCESS - Pre Award
Pre Award Accounts Assess the controls in place to ensure proper oversight, minimizing the risk the institution while also ensuring no delays to researchPROCESS - Pre Award Temporary Projects (Pre Award
Accounts)1 Number and Dollar Value of Temporary Projects # (Projects), $ (Projects)
% (of total Projects)1 A - FY
- Active accounts without an executed award- Sponsor - College- Department- PI- $0-50k, 50-100k, $100-200, $200-500, $500+
Indication of usage of temporary projects along with oversight of pre award spending to ensure reimbursement
- Dir. Spon Prog- Pre Award Supervisors
Stephanie Gray, Pre-Award Supervisors
PROCESS - Pre Award Temporary Projects (Pre Award Accounts)
2 Dollar Value of Temporary Projects Not Awarded (Write-Offs)
# (Projects), % (of total Projects)
1 B - FY- $ - Anticipated Budget $- Sponsor - College- Department- PI- Write off account
Identify gaps in process and proactively monitor projects
- Dir. Spon Prog- Pre Award Supervisors
PROCESS - Pre Award Temporary Projects (Pre Award Accounts)
3 Date Created & Aging of Temporary Projects # (Days) 1 B - FY - Date Created less Today's Date - Sponsor - College- Department- PI
Track and manage existing temporary projects and when they convert to award
- Dir. Spon Prog- Pre Award Supervisors
Award Setup Evaluate the current award setup process and potential opportunities to increase efficiency and accuracyPROCESS - Pre Award Award Setup 4 Number of Awards Set Up and Set up Turnaround Time -
NEW AWARDS# (Accounts), # (days) 1 A - FY
- Sponsor - College- Department- PI- Award receipt date- Account setup date- Project Start and End Date- Budget Period Start and End- Reason for Delay
Assess award volume and receipt trends year to year. Evaluate the efficiency of the award setup team
- Dir. Spon Prog- Pre Award Supervisors- Pre Award Admin
Brad Staats, Tiffany Schmidt
PROCESS - Pre Award Award Setup 5 Number of Award Setup in Backlog - NEW AWARDS # (Accounts), $ (Set-Up Budgets)
1 A - FY - Sponsor - College- Department- PI- Award receipt date- Project Start and End Date- Budget Period Start and End- Reason for delay
Actively track backlog and evaluate reason for backlog, developing solutions to minimize population
- Dir. Spon Prog- Pre Award Supervisors- Pre Award Admin
Brad Staats, Tiffany Schmidt
PROCESS - Pre Award Award Setup 6 Number of Issues/Outstanding Items Delaying Award Setup
# Accounts Incomplete, or # Accounts on Hold
1 A - FY - Sponsor - College- Department- PI- Award receipt date- Project Start and End Date- Budget Period Start and End- Reason: Compliance, PI, General Counsel, etc.
Identify issues outside of Pre Award that impact the creation of the account
- Dir. Spon Prog- Pre Award Supervisors
Brad Staats, Tiffany Schmidt, C&G Team Leads, Dept
Contract Negotiation Assess the efficiency and effectiveness of contract negotiationsPROCESS - Pre Award Contract Negotiation 7 Negotiation Turnaround Time # (days) 1 A - FY
- Sponsor - College- Department- PI- Pre Award FTE- Date received (at institution)- Date negotiations begun- Date fully executed
Ensure defined goals and targets are being met, assess individual performance, track/ manage sponsors with recurring contracting issues /time lags
- Dir. Spon Prog- Pre Award Supervisors- Pre Award Admin
Stephanie Gray
Metric Data Reference
Metrics Priority Area KeyDescription

UF Performance Metrics Assessment Potential Metrics to Develop
7/17/14 2 of 34
Count1 - Higher Priority* + Available in Existing UF Systems 72 A - Implement/Invest in Metric Immediately 37 B - Implement/Invest in Metric Eventually 352 - Higher Priority* + Unavailable in Existing UF Systems (Available with Click or Enhancements to Existing Systems) 273 - Higher Priority* + Unavailable in Existing UF Systems 244 - Medium Priority* + Unavailable in Existing UF Systems 10* Initial priority metrics based on compliance and financial implications to UF customer service.
Table 1: List of Potential Metrics to Develop by Organizational Element
Organizational Element Evaluation Area Metric Number
Metric Metric Units Priority Area Priority Sub-Area
Parameters / Data Elements Purpose Intended Audience Requested By (If Applicable)
Metric Data Reference
Metrics Priority Area KeyDescription
Proposal Review & Approval Evaluate the efficiency of the pre award office and departments along with departments understanding of process and compliancePROCESS - Pre Award Proposal Review & Approval 8 Number of Proposals Submitted #, $ (Proposals
Submitted)1 A - FY
- Direct/F&A- Sponsor - College- Department- PI- Due Date- Date Submitted- Expected Project Start and End- Expected Budget Periods- Assigned Pre Award FTE
Assess proposal trends year to year and distribution of workload
- Dir. Spon Prog- Pre Award Supervisors- Pre Award Admin
Stephanie Gray, DSP Supervisors, VPs, Dept Chairs/Dean
Outgoing Subs Assess the efficiency and effectiveness of subcontract development, processing and trendsPROCESS - Pre Award Outgoing Subs 9 Number of Outgoing Subaward Population Year to Year # (Subs), $ (Subs) 1 B - FY
- Sponsor - College- Department- PI- Subcontractor - $ of subcontract- Total Awarded amount- Date submitted to sub- Date executed- Agreement vs Modification- Subcontractor (including affiliated institutions)- DSP FTE- Project Start and End- Budget Start and End
Assess outgoing subaward trends year to year and portion subcontracted out
- Dir. Spon Prog- Pre Award Supervisors- Pre Award Admin
PROCESS - Pre Award Outgoing Subs 10 Outgoing Sub Award Execution Turnaround & Negotiation Time
# (days) 1 B - FY - Sponsor - College- Department- PI- Subcontractor - DSP FTE Assigned- Award start date- Date submitted to sub- Date subk fully executed- Agreement vs Modification
Ensure defined goals and targets are being met
- Dir. Spon Prog- Pre Award Supervisors- Pre Award Admin
Stephanie Gray, Depts
PROCESS - Pre Award Outgoing Subs 11 Number of Outgoing Sub Award Backlog # (subawards), $ (Subs) 1 B - FY - Sponsor - College- Department- PI- Award start date- Date submitted to sub- Agreement vs Modification- DSP FTE Assigned- Reason for delay
Actively track backlog and evaluate reason for backlog, developing solutions to minimize population
- Dir. Spon Prog- Pre Award Supervisors- Pre Award Admin
PROCESS - Post AwardAward Management Ensure appropriate support in place to manage
accountsPROCESS - Post Award Award Management 12 Active Awards (Unit Breakdown) # (Awards), $ (Budget) 1 A - FY- Sponsor - College- Department- PI - $0-50k, 50-100k, $100-500, $500-$1M, $1M-$5M, $5M+- Post Award FTE assigned - Individual projects with award - Number of Outgoing Sub Awards- New vs. Renewal - Proposal Number (to reconcile with Award Number)
Assess award volume, type and dollar trends year to year.
- Dir. C&G- Post Award Sup- Post Award Admin
Brad Staats, Tiffany Schmidt, Deans/Dept Chairs

UF Performance Metrics Assessment Potential Metrics to Develop
7/17/14 3 of 34
Count1 - Higher Priority* + Available in Existing UF Systems 72 A - Implement/Invest in Metric Immediately 37 B - Implement/Invest in Metric Eventually 352 - Higher Priority* + Unavailable in Existing UF Systems (Available with Click or Enhancements to Existing Systems) 273 - Higher Priority* + Unavailable in Existing UF Systems 244 - Medium Priority* + Unavailable in Existing UF Systems 10* Initial priority metrics based on compliance and financial implications to UF customer service.
Table 1: List of Potential Metrics to Develop by Organizational Element
Organizational Element Evaluation Area Metric Number
Metric Metric Units Priority Area Priority Sub-Area
Parameters / Data Elements Purpose Intended Audience Requested By (If Applicable)
Metric Data Reference
Metrics Priority Area KeyDescription
Subawards and Monitoring Assess subaward trends. Ensure proper controls in place to mitigate riskPROCESS - Post Award Subawards and Monitoring 13 Active Subawards # (subawards), $ (Subs) 1 A - FY
- Sponsor - College- Department- PI - Subcontractor
Assess award volume and dollar trends year to year.
- Dir. C&G- Subk Supervisor- Subk Team- Post Award Admin
PROCESS - Post Award Subawards and Monitoring 14 % of Subaward Spend % (of Total Federal Spend)
1 B - FY - Sponsor - College- Department- Subcontractor- Subaward Spend/ Subaward Budget
Identify and track instances of significant pass-through funding and assess risk
- Dir. C&G- Post Award Sup- Post Award Admin
PROCESS - Post Award Subawards and Monitoring 15 A-133 Audit Certifications of Subrecipients (Completion versus Outstanding) or related check if A-133
% or # (of Total Subrecipients)
1 B - FY- Subrecipient- A-133 Request Date- A-133 Receipt Date- A-133 Outstanding- Subaward Execution Date
Ensure A-133 or equivalent is received and reviewed for each Subrecipient
- Dir. C&G- Subk Supervisor- Subk Team
Cash Management Establish tools to identify risks to reimbursement PROCESS - Post Award Cash Management 16 Outstanding AR # (days), $ 1 A - FY
- Sponsor (excluding LOC)- College - Department - $ Outstanding- Payment Method- Invoice Frequency- 0-30 days, 30-90, 90-120, 120-180, 180-365, 365+- Average Days Outstanding
Track outstanding AR and establish appropriate resolution plan to recover funds
- Dir. C&G- Cash Mgmt Sup- Cash Mgmt Team
Brad Staats, Tiffany Schmidt, C&G Leads
PROCESS - Post Award Cash Management 17 Invoices Generated versus Invoice Due # (invoices), $ 1 A - FY- Sponsor- College - Department - $ Invoice Submitted- Month- Invoices Due Month- Invoices Submitted Month- Reason for delay
Ensure timely issuance of invoices to properly manage cash flow
- Post Award Sup- Post Award Admin
Brad Staats, Tiffany Schmidt, C&G Leads
PROCESS - Post Award Cash Management 18 Number of Accounts in Overdraft # (Accounts) $ (Accounts)
1 A - FY- Sponsor- College - Department - PI - Overdraft Amount- # Days Account Remain in Overdraft- Post Award FTE
- Post Award Sup- Post Award Admin
Brad Staats, Tiffany Schmidt, C&G Leads
PROCESS - Post Award Cash Management 19 Unbilled Expenses $ 1 B - FY- Sponsor- College - Department - $ Unbilled - Payment Method- Invoice Frequency- Month- Days since last invoice generated
Identify instances of billing delays and associated dollars
- Post Award Sup- Post Award Admin
Brad Staats, Tiffany Schmidt, C&G Leads

UF Performance Metrics Assessment Potential Metrics to Develop
7/17/14 4 of 34
Count1 - Higher Priority* + Available in Existing UF Systems 72 A - Implement/Invest in Metric Immediately 37 B - Implement/Invest in Metric Eventually 352 - Higher Priority* + Unavailable in Existing UF Systems (Available with Click or Enhancements to Existing Systems) 273 - Higher Priority* + Unavailable in Existing UF Systems 244 - Medium Priority* + Unavailable in Existing UF Systems 10* Initial priority metrics based on compliance and financial implications to UF customer service.
Table 1: List of Potential Metrics to Develop by Organizational Element
Organizational Element Evaluation Area Metric Number
Metric Metric Units Priority Area Priority Sub-Area
Parameters / Data Elements Purpose Intended Audience Requested By (If Applicable)
Metric Data Reference
Metrics Priority Area KeyDescription
PROCESS - Post Award Cash Management 20 Average amount in holding account to be applied to grant $ 1 B - FY- Month - Sponsor - College - Department - LOC versus other (check, wire)- Amount
Oversight of account to ensure $ does not exceed performance target and application of cash occurs at regular intervals
- Cash Mgmt Sup- Cash Mgmt Team
Brad Staats, Tiffany Schmidt, C&G Leads, Depts
Closeout Ensure accounts reconciled and closed in a timely mannerPROCESS - Post Award Closeout 21 Outstanding Closeouts # (Accounts) $
(Accounts)1 A - FY
- Sponsor- Department- Account open X days past project end date- Expenditures < or > budget- Reason account remains open- C&G FTE
Monitor outstanding closeout population and assess reasons for holdup and solution for resolution
- Dir. C&G- Post Award Sup- Post Award Admin
Brad Staats, Tiffany Schmidt, C&G Leads
PROCESS - Post Award Closeout 22 Write-offs Processed # (write-offs), $ 1 A - FY- Sponsor- College - Department - Expenditures - Budget Transactions- Write-off date- Account closeout date
Monitor write-off frequency and evaluate cause of write-off to minimize future instances
- Dir. C&G
PROCESS - Post Award Closeout 23 Number of Closeouts Processed # (accounts) 1 A - FY- Sponsor- College - Department - Post Award FTE
Monitor closeout population - Dir. C&G Stephanie Gray
PROCESS - Post Award Closeout 24 Number of Refund Checks and Associated dollars # (accounts), $ 1 B - FY- Sponsor- College - Department - Expenditures - Budget (Refund amount)
Monitor refund frequency - Dir. C&G
PROCESS - Post Award Closeout 25 Underspend Accounts, Funds moved to Internal accounts # (Accounts), $ 1 B - FY- Sponsor- College - Department - Budget - Expenditures > $0- Account funds moved to
Monitor frequency and instances by department/sponsor to gage appropriateness
- Dir. C&G- Post Award Sup
Brad Staats, Tiffany Schmidt
Cost Transfers Ensure needed review and approvals exist, and cost transfers are processed in a timely mannerPROCESS - Post Award Cost Transfers 26 Number of Cost Transfers # (CTs), $ (Transferred) 1 A - FY
- Sponsor - College- Department- Labor vs. Non-Labor- 0-$100, 100-$500, $500-1000, $1000-$2000, $2000+- Grant to Grant, Grant to non-Grant, Non-Grant to grant, etc.- Cost Transfer justification
Monitor number of cost transfers and value
- Dir. C&G- Post Award Sup- Post Award Admin
Brad Staats, Tiffany Schmidt, Deans/Dept Chairs, QC Team
PROCESS - Post Award Cost Transfers 27 Number and Dollar Value of Labor Cost Redistributions, On Time and Late
# (Transfers), $ (Transferred)
1 A - FY - Sponsor - College- Department- (Transfer Date minus Effective Date > 90 days)- Grant to Grant, Grant to non-Grant, Non-Grant to grant, etc.- Justification
Evaluate validity of cost transfers - Dir. C&G- Post Award Sup- Post Award Admin
Brad Staats, Tiffany Schmidt, QC Team

UF Performance Metrics Assessment Potential Metrics to Develop
7/17/14 5 of 34
Count1 - Higher Priority* + Available in Existing UF Systems 72 A - Implement/Invest in Metric Immediately 37 B - Implement/Invest in Metric Eventually 352 - Higher Priority* + Unavailable in Existing UF Systems (Available with Click or Enhancements to Existing Systems) 273 - Higher Priority* + Unavailable in Existing UF Systems 244 - Medium Priority* + Unavailable in Existing UF Systems 10* Initial priority metrics based on compliance and financial implications to UF customer service.
Table 1: List of Potential Metrics to Develop by Organizational Element
Organizational Element Evaluation Area Metric Number
Metric Metric Units Priority Area Priority Sub-Area
Parameters / Data Elements Purpose Intended Audience Requested By (If Applicable)
Metric Data Reference
Metrics Priority Area KeyDescription
PROCESS - Post Award Cost Transfers 28 Average Age of Cost Transfers # (days) 1 A - FY - Department- Sponsor - Labor vs. Non-Labor- Transfer Date minus Original Date Cost Incurred- Grant to Grant, Grant to non-Grant, Non-Grant to grant, etc.- 0-$100, 100-$500, $500-1000, $1000-$2000, $2000+- Justification
Evaluate the age and justification to determine potential compliance risks
- Dir. C&G- Post Award Sup
PROCESS - Post Award Cost Transfers 29 Labor Cost Transfers - % out of Total Labor Spending % (Labor Spending on Research Grants)
1 B - FY- Sponsor - College- Department - $ Labor CT's/$ Total Labor Expenses- Award versus total award population
Track labor cost transfer trends and spending
- Dir. C&G
Effort Reporting Provide visibility to effort reporting trends and the potential impact to payroll, cost transfers and other issuesPROCESS - Post Award Effort Reporting 30 Effort Certifications (per Cycle, per Year) # (Certifications) 1 A - Per cycle
- Per FY- Department- Due Date- Date Certified
Track completion and progress to defined goals
- Effort reporting Sup- Effort reporting admin
Brenda Harrell
PROCESS - Post Award Effort Reporting 31 On-time versus Late effort certifications # (Certifications) 1 A - Per cycle- Per FY- Department- Due Date- Date Certified- # Outstanding
Identify issues with particular departments or individuals
- Effort reporting Sup- Effort reporting admin- Dir C&G- Chair/Dean
Brenda Harrell, Deans/Dept Chairs
PROCESS - Post Award Effort Reporting 32 Outstanding Effort Certifications # (Certifications), % 1 A - Per cycle- Per FY- Department- PI- Due Date- Unsubstantiated Salary $
Monitor volume and associated impact to payroll
- Effort reporting Sup- Effort reporting admin- Chair/Dean- Dir C&G
Brenda Harrell, Deans/Dept Chairs
PROCESS - Post Award Effort Reporting 33 Cost Transfers resulting from Effort Certifications # (Cost Transfers), $ (Transferred)
1 A - Per cycle- Per FY- Department- PI
Track inaccuracies in effort certification and repeat offenders.
- Effort reporting Sup- Effort reporting admin- Post Award Sup
Brenda Harrell, Deans/Dept Chairs, QC Team
PROCESS - Post Award Effort Reporting 34 Recertification's by Year # (Recertification's) 1 A - Per cycle- Per FY- Department- PI- Date open for recertification- Date recertification completed
Track inaccuracies in effort certification and repeat offenders.
- Effort reporting Sup- Effort reporting admin
Brenda Harrell
PROCESS - Post Award Effort Reporting 35 Certifications by someone other than the responsible/required individuals
# and Individual 1 A - Per cycle- Per FY- Department- PI- Certifier- Date Certified
Identify and resolve instances of individuals certifying on behalf of the PI.
- Effort reporting Sup- Effort reporting admin- Chair/Dean
Brenda Harrell
PROCESS - Post Award Effort Reporting 36 Senior-Level PIs with 90% Research Salary # (Investigators) 1 B - Per cycle- Per FY- Department- PI or Researcher- Faculty/Research Appointment
Address instances of individuals who exceed 90% research salary
- Effort reporting Sup- Effort reporting admin- Chair/Dean
Brenda Harrell, Deans/Dept Chairs
Expenditure Review Establish tools to continually monitor expenditures

UF Performance Metrics Assessment Potential Metrics to Develop
7/17/14 6 of 34
Count1 - Higher Priority* + Available in Existing UF Systems 72 A - Implement/Invest in Metric Immediately 37 B - Implement/Invest in Metric Eventually 352 - Higher Priority* + Unavailable in Existing UF Systems (Available with Click or Enhancements to Existing Systems) 273 - Higher Priority* + Unavailable in Existing UF Systems 244 - Medium Priority* + Unavailable in Existing UF Systems 10* Initial priority metrics based on compliance and financial implications to UF customer service.
Table 1: List of Potential Metrics to Develop by Organizational Element
Organizational Element Evaluation Area Metric Number
Metric Metric Units Priority Area Priority Sub-Area
Parameters / Data Elements Purpose Intended Audience Requested By (If Applicable)
Metric Data Reference
Metrics Priority Area KeyDescription
PROCESS - Post Award Expenditure Review 37 Dollar Value / % of Direct Costs Charged to Grants in Unallowable expense accounts
$ (expenses), % (of direct costs)
1 A - FY- Sponsor - College- Department- Award Number - Total $ Awarded - Total $ by expense account
Monitor unallowable charges to track where they occur and appropriate follow up is taken
- Post Award Sup- Post Award Admin
Brad Staats, Tiffany Schmidt, C&G Leads
PROCESS - Post Award Expenditure Review 38 Dollar Value / % of Direct Costs in expense accounts which are typically indirect-type costs
$ (expenses), % (of direct costs)
1 A - FY- Sponsor - College- Department- Award Number - Total $ Awarded - Total $ by expense account
Identify charges that are typically indirect to ensure they are moved or justification received
- Post Award Sup- Post Award Admin
Brad Staats, Tiffany Schmidt, C&G Leads
PROCESS - Post Award Expenditure Review 39 % Awards out of Total Award volume with questionable expense accounts - expense accounts requiring review and approval (IRB, equip, admin salaries, patient care, etc.)
# Accounts and associated expense account and $
1 A - Point in Time- Sponsor- College - Department - Reason for review- Approval by and date
Identifying volume and instances that require approval to ensure allowability of expenses. Monitor how frequently departments may be charging unallowable expenses, or charging to the wrong expense account
- Dir. C&G Brad Staats, Tiffany Schmidt, C&G Leads
Financial Reporting Track financial reporting workload and efficiencyPROCESS - Post Award Financial Reporting 40 FFRs Submitted (On-time vs Late) # (FFRs) 1 B - FY/Month
- Sponsor- College - Department - Frequency - Annual, Quarterly, etc.- FFR Due Date- FFR Submission Date- C&G FTE assigned
Assess reporting volume and trends year to year. Evaluate the efficiency of the post award team and possible bottlenecks.
- Dir. C&G- Post Award Sup- Post Award Admin
Brad Staats, Tiffany Schmidt, C&G Leads
PROCESS - Post Award Financial Reporting 41 FFR Backlog # (FFRs) 1 B - FY/Month- Sponsor- College - Department - Frequency - Annual, Quarterly, etc.- FFR Due Date- Reason for delay- C&G FTE assigned
Actively monitor the backlog and prioritize as needed to minimize risk to future funding
- Dir. C&G- Post Award Sup- Post Award Admin
Brad Staats, Tiffany Schmidt, C&G Leads
COMPLIANCEAnimal Subjects Ensure appropriate compliance controls are in place to facilitate and manage animal subject research
COMPLIANCE Animal Subjects 42 Number of Grants w/ IACUC protocols # (Awards) 1 A - FY- Sponsor- College - Department - Protocol Start/Expiration Date - Award Start/End Date
Identify animal subject research on sponsored projects to ensure compliance and post award expense review
- Dir. Compliance- Dir. C&G- Post Award Sup- IACUC admin
Irene Cook, Mike Mahoney, VPs, Deans/Dept Chairs
COMPLIANCE Animal Subjects 43 Number of Active Protocols # (Protocols) 1 A - FY - Funded vs Non Funded - Sponsor- College - Department - Protocol Start/Expiration Date - Award Start/End Date - Award Type (Sponsored, Non-Sponsored, etc.)
Track IACUC protocol trend year to year
- Dir. Compliance- IACUC admin
Irene Cook, Mike Mahoney, VPs, Deans/Dept Chairs

UF Performance Metrics Assessment Potential Metrics to Develop
7/17/14 7 of 34
Count1 - Higher Priority* + Available in Existing UF Systems 72 A - Implement/Invest in Metric Immediately 37 B - Implement/Invest in Metric Eventually 352 - Higher Priority* + Unavailable in Existing UF Systems (Available with Click or Enhancements to Existing Systems) 273 - Higher Priority* + Unavailable in Existing UF Systems 244 - Medium Priority* + Unavailable in Existing UF Systems 10* Initial priority metrics based on compliance and financial implications to UF customer service.
Table 1: List of Potential Metrics to Develop by Organizational Element
Organizational Element Evaluation Area Metric Number
Metric Metric Units Priority Area Priority Sub-Area
Parameters / Data Elements Purpose Intended Audience Requested By (If Applicable)
Metric Data Reference
Metrics Priority Area KeyDescription
COMPLIANCE Animal Subjects 44 Number of IACUC Protocol Backlog # (Protocols) 1 A - FY- Funded vs Non Funded- Sponsor- College - Department - Protocol Start/Expiration Date- Award Start/End Date- Reason for delay
Actively monitor the backlog and prioritize as needed to minimize risk of research delays
- Dir. Compliance- IACUC admin
Mike Mahoney
COMPLIANCE Animal Subjects 45 Number of Suspended Protocols # (Suspended) 1 A - FY- Funded vs Non Funded- Sponsor- College - Department - PI - Protocol Start/Expiration Date - Award Start/End Date- Suspension Reason
Identify instances of potential or actual compliance risks and establish resolution plan or revised process
- Dir. Compliance- Dean/Chair of Dept. associated with PI- Dir. C&G
Irene Cook
COMPLIANCE Animal Subjects 46 Full Committee Review vs. Designated Member - NEW Studies
# (Protocols) 1 A - FY- Funded vs Non Funded- Sponsor- College - Department - Protocol Start/Expiration Date - Award Start/End Date - Committee or Reviewer- Reviewer Name- Status
Track the protocol review process - Dir. Compliance- IRB admin
Mike Mahoney
COMPLIANCE Animal Subjects 47 Full Committee Review vs. Designated Member - RENEWALS
# (Protocols) 1 A - FY- Funded vs Non Funded- Sponsor- College - Department - Protocol Start/Expiration Date - Award Start/End Date - Committee or Reviewer- Reviewer Name- Status
Track the protocol review process - Dir. Compliance- IRB admin
Mike Mahoney
COMPLIANCE Animal Subjects 48 Number of Expired Protocols in Database # (Studies) 1 B - FY - Funded vs Non Funded - Sponsor- College - Department - Protocol Start/Expiration Date - Award Start/End Date
Identify compliance risks due to lag in protocol
- Dir. Compliance- Dir. C&G- IACUC admin
Human Subjects Ensure appropriate compliance controls are in place to facilitate and manage human subject researchCOMPLIANCE Human Subjects 49 Number of Grants w/ IRB protocols # (Awards) 1 A - FY
- Sponsor- College - Department- PI- Protocol Start/Expiration Date - Award Start/End Date
Identify human subject research on sponsored projects to ensure compliance and post award expense review
- Dir. Compliance- Dir. C&G- Post Award Sup- IRB admin
Irene Cook, Mike Mahoney, VPs, Deans/Dept Chairs
COMPLIANCE Human Subjects 50 Number of Active Protocols # (Protocols) 1 A - FY - Funded vs Non Funded - Sponsor- College - Department - Protocol Start/Expiration Date - Award Start/End Date - Award Type (Sponsored, Non-Sponsored, etc.)
Track IRB protocol trend year to year - Dir. Compliance- IRB admin
Irene Cook, Mike Mahoney, VPs, Deans/Dept Chairs

UF Performance Metrics Assessment Potential Metrics to Develop
7/17/14 8 of 34
Count1 - Higher Priority* + Available in Existing UF Systems 72 A - Implement/Invest in Metric Immediately 37 B - Implement/Invest in Metric Eventually 352 - Higher Priority* + Unavailable in Existing UF Systems (Available with Click or Enhancements to Existing Systems) 273 - Higher Priority* + Unavailable in Existing UF Systems 244 - Medium Priority* + Unavailable in Existing UF Systems 10* Initial priority metrics based on compliance and financial implications to UF customer service.
Table 1: List of Potential Metrics to Develop by Organizational Element
Organizational Element Evaluation Area Metric Number
Metric Metric Units Priority Area Priority Sub-Area
Parameters / Data Elements Purpose Intended Audience Requested By (If Applicable)
Metric Data Reference
Metrics Priority Area KeyDescription
COMPLIANCE Human Subjects 51 Number of Suspended Protocols # (Suspended) 1 A - FY- Funded vs Non Funded- Sponsor- College - Department - PI - Protocol Start/Expiration Date - Award Start/End Date- Suspension Reason
Identify instances of potential or actual compliance risks and establish resolution plan or revised process
- Dir. Compliance- Dean/Chair of Dept. associated with PI- Dir. C&G
Irene Cook, Mike Mahoney
COMPLIANCE Human Subjects 52 Number of IRB Protocol Review Backlog # (Protocols) 1 A - FY- Funded vs Non Funded- Sponsor- College - Department - Protocol Start/Expiration Date - Award Start/End Date- Reason for delay
Actively monitor the backlog and prioritize as needed to minimize risk research delays
- Dir. Compliance- IRB admin
Mike Mahoney
COMPLIANCE Human Subjects 53 Number of Renewals vs Expirations # (Studies) 1 B - FY- Funded vs Non Funded- Sponsor- College - Department - PI - Protocol Start/Expiration Date - Award Start/End Date- Renewal Application submission date- Renewal Application approval date
Identify number of renewals and lags in renewal processing with potential impact on research completion
- Dir. Compliance- Dean/Chair of Dept. associated with PI- Dir. C&G
Irene Cook, Mike Mahoney
COMPLIANCE Human Subjects 54 Number of Expired Protocols in Database # (Studies) 1 B - FY- Funded vs Non Funded- Sponsor- College - Department - PI - Protocol Start/Expiration Date - Award Start/End Date
Identify compliance risks due to lag in protocol
- Dir. Compliance- Dir. C&G- IRB admin
COMPLIANCE Human Subjects 55 Full Review Protocols Reviewed by Year # (Protocols) 1 B - FY- Funded vs Non Funded- Sponsor- College - Department - Protocol Start/Expiration Date - Award Start/End Date - Committee- Status
Track number of protocol types and efficiency of processing
- Dir. Compliance- IRB admin
Mike Mahoney
COMPLIANCE Human Subjects 56 Expedited Protocols Reviewed by Year # (Protocols) 1 B - FY- Funded vs Non Funded- Sponsor- College - Department - Protocol Start/Expiration Date - Award Start/End Date - Committee- Status
Track number of protocol types and efficiency of processing
- Dir. Compliance- IRB admin
Mike Mahoney
COMPLIANCE Human Subjects 57 Exempt Determinations Made per Year # (Determinations) 1 B - FY- Funded vs Non Funded- Sponsor- College - Department - Protocol Start/Expiration Date - Award Start/End Date - Committee- Status
Track number of protocol types and efficiency of processing
- Dir. Compliance- IRB admin
Mike Mahoney
Salary Caps Evaluate application of salary restrictions

UF Performance Metrics Assessment Potential Metrics to Develop
7/17/14 9 of 34
Count1 - Higher Priority* + Available in Existing UF Systems 72 A - Implement/Invest in Metric Immediately 37 B - Implement/Invest in Metric Eventually 352 - Higher Priority* + Unavailable in Existing UF Systems (Available with Click or Enhancements to Existing Systems) 273 - Higher Priority* + Unavailable in Existing UF Systems 244 - Medium Priority* + Unavailable in Existing UF Systems 10* Initial priority metrics based on compliance and financial implications to UF customer service.
Table 1: List of Potential Metrics to Develop by Organizational Element
Organizational Element Evaluation Area Metric Number
Metric Metric Units Priority Area Priority Sub-Area
Parameters / Data Elements Purpose Intended Audience Requested By (If Applicable)
Metric Data Reference
Metrics Priority Area KeyDescription
COMPLIANCE Salary Caps 58 NSF Salary Limits $ (Dollars) 1 B - FY- Department - PI
Ensure PI salaries meet NSF salary limits and proactively identify potential violations
- PI- Dean/Chairs - Dir. CG- Dir. Spon Prog
Stephanie Gray
COMPLIANCE Salary Caps 59 NIH Salary Caps $ (Dollars) 1 B - FY- Department - PI
Ensure PI salaries meet NIH Salary Cap and proactively identify potential violations
- PI- Dean/Chairs - Dir. CG- Dir. Spon Prog
Stephanie Gray
General Compliance ProtocolsCOMPLIANCE General Compliance Protocols 60 Funded vs. Unfunded Protocols (IRB, IACUC, IBC) # (Protocols) 1 B - FY
- Department - PI - Funded vs. Unfunded - Protocol Start and End Date
Monitor funded versus unfunded compliance protocols in IRB, IACUC, and IBC offices
- Dir. Compliance- IRB/IACUC/IBC admin
Mike Mahoney
ORGANIZATIONStaffing Levels Evaluate number of FTEs against workload
ORGANIZATION Staffing Levels 61 Turnover Percentage by Function % 1 B - FY- Central Unit- Level (Staff, Mgr., Director, VP)
Assess whether turnover rate is on par with standards or relates to other issues
- Unit Directors (pre, post, compliance)
ORGANIZATION Staffing Levels 62 FTE Vacancies # (Vacancies) 1 B - Pre, Post, Compliance- Process Area
Assess impact of vacancies on operations and end user support
- Unit Directors (pre, post, compliance)
PERFORMANCE MEASUREMENTResearch Performance/Spending Evaluate research spending and how that translates to future growth
PERFORMANCE MEASUREMENT Research Performance/Spending 63 F&A Recovery vs. F&A Rate % (recovered) 1 A - FY- Indirect/MTDC vs. Negotiated Rate or Awarded Rate - F&A Amount- Department/Unit- PI- Sponsor
Monitor actual recovery versus projected recovery and the distribution to various units/departments
- Dir. Spon Prog- Dir. C&G- VP Research- CFO
PERFORMANCE MEASUREMENT Research Performance/Spending 64 Research spending by Cost Pool tied to the OR Base $/% 1 B - FY- Sponsor - College- Department- Sponsored Project Expenditures Broken out cost pool- Total OR Base
Track components of the OR base and impact to IDC rate
- Dir. Spon Prog- Dir. C&G- VP Research- CFO
PERFORMANCE MEASUREMENT Research Performance/Spending 65 F&A Distribution % (distributed) 1 B - FY- Department- Distribution $ and %- PI- Sponsor
Monitor distribution to various units/departments to assist with future planning and tracking of research enterprise
- Dir. Spon Prog- Dir. C&G- VP Research- CFO
PERFORMANCE MEASUREMENT Research Performance/Spending 66 Total Research Facility Square Footage # (Feet) 1 B - FY- Unit/Department- PI/faculty assigned
Monitor research space usage and impact to IDC Rate
- VP Research- Dean/Chairs
Deans/Dept Chairs, Pis
PERFORMANCE MEASUREMENT Research Performance/Spending 67 Sponsored Research Dollars by PI $ (Dollars) # (Time)
1 B - FY- Funded vs Non Funded - Sponsor - College - Department - PI
Measure research productivity of active researchers. Compare to IDC funds provided.
- VP Research- Dean/Chairs
Stephanie Gray
PERFORMANCE MEASUREMENT Research Performance/Spending 68 ROI on Seed Funding $ (Dollars) 1 B - FY - College - Department - PI
Measure return of institutional funds invested in seed funding program
- VP Research- Dean/Chairs
Stephanie Gray
PERFORMANCE MEASUREMENT Research Performance/Spending 69 ROI on Cost Share $ (Dollars) 1 B - FY- $- Funded vs Non Funded- Sponsor - College - Department - PI
Measure return on investment of cost share borne by the institution
- VP Research- Dean/Chairs - Dir. CG- Dir. Spon Prog
Stephanie Gray

UF Performance Metrics Assessment Potential Metrics to Develop
7/17/14 10 of 34
Count1 - Higher Priority* + Available in Existing UF Systems 72 A - Implement/Invest in Metric Immediately 37 B - Implement/Invest in Metric Eventually 352 - Higher Priority* + Unavailable in Existing UF Systems (Available with Click or Enhancements to Existing Systems) 273 - Higher Priority* + Unavailable in Existing UF Systems 244 - Medium Priority* + Unavailable in Existing UF Systems 10* Initial priority metrics based on compliance and financial implications to UF customer service.
Table 1: List of Potential Metrics to Develop by Organizational Element
Organizational Element Evaluation Area Metric Number
Metric Metric Units Priority Area Priority Sub-Area
Parameters / Data Elements Purpose Intended Audience Requested By (If Applicable)
Metric Data Reference
Metrics Priority Area KeyDescription
PERFORMANCE MEASUREMENT Research Performance/Spending 70 Cost Share Totals $ 1 B - FY- Department- PI- Sponsor- CS Type: Mandatory, Voluntary Committed, Voluntary Uncommitted- CS Dollars
Track cost sharing commitments to determine opportunities to better monitor and minimize unnecessary instances
- Dir. C&G- VP Research
Deans/Dept Chairs, Pis
PERFORMANCE MEASUREMENT Research Performance/Spending 71 Dollar Value Labor vs Non-Labor Expenditures $ 1 B - FY- Sponsored Project Labor Costs - Salary and Fringe- Sponsored Project Non-Labor Costs - Expense Type- Total Sponsored Project Costs
Evaluate and monitor research spending trends
- Dir. C&G- VP Research- Dean/Chairs
Priority Area 2: Priority Metric & currently unavailable in UF systems (available soon with Click Grants or enhancements to existing systems)PROCESS - Pre Award
Contract Negotiation Assess the efficiency and effectiveness of contract negotiationsPROCESS - Pre Award Contract Negotiation 72 Number and Dollar Value of Contracts (Executed vs
Negotiations)# (Contracts), $ (Contracted)
2 - FY - Sponsor - College- Department- PI- Date received- Date fully executed- Project Period Start and End Date
Assess contract receipt trends year to year and evaluate backlog population
- Dir. Spon Prog- Pre Award Supervisors- Pre Award Admin
Stephanie Gray, Depts
Proposal Review & Approval Evaluate the efficiency of the pre award office and departments along with departments understanding of process and compliancePROCESS - Pre Award Proposal Review & Approval 73 Average days proposal received before deadline # (days) 2 - Date Received < Sponsor Deadline
- Sponsor - College- Department- PI- Sponsor deadline- Internal Deadline- Date proposal routed to reviewer
Determine if policy and process align and ensure pre award office is proactive in its proposal review and submission process
- Dir. Spon Prog- Pre Award Supervisors- Pre Award Admin
PROCESS - Pre Award Proposal Review & Approval 74 Proposals unable to be submitted % (of total) 2 - FY- Sponsor - College- Department- PI- Reason unable to submit
Assess whether proposals not submitted are due to institutional policy or conflicts, or PI decision. If in conflict with internal policies is there a training or process issue
- Dir. Spon Prog- Pre Award Supervisors
PROCESS - Pre Award Proposal Review & Approval 75 Dollar Value of Proposals Submitted #, $ (Proposals Submitted)
2 - FY - Direct/F&A- Sponsor - College- Department- PI- Due Date- Date Submitted- Expected Project Start and End- Expected Budget Periods- Assigned Pre Award FTE
Assess proposal trends year to year and distribution of workload
- Dir. Spon Prog- Pre Award Supervisors- Pre Award Admin
Stephanie Gray, DSP Supervisors, VPs, Dept Chairs/Dean
PROCESS - Pre Award Proposal Review & Approval 76 Average Number of times proposals returned to unit for significant adjustments
# (Returns) 2 - FY- Sponsor - College- Department- PI- Reason for return
Assess understanding of roles and responsibilities of units
- Dir. Spon Prog- Pre Award Supervisors- Pre Award Admin
Other Ensure appropriate oversight of key award types and award elementsPROCESS - Pre Award Other 77 # of accounts with anticipated Program Income $ 2 - FY
- Sponsor- Department
Ensure accounts flagged to enable proper oversight and audit
- Dir. Spon Prog- Pre Award
Export Controls Provide management high-level analysis of potential export control risks

UF Performance Metrics Assessment Potential Metrics to Develop
7/17/14 11 of 34
Count1 - Higher Priority* + Available in Existing UF Systems 72 A - Implement/Invest in Metric Immediately 37 B - Implement/Invest in Metric Eventually 352 - Higher Priority* + Unavailable in Existing UF Systems (Available with Click or Enhancements to Existing Systems) 273 - Higher Priority* + Unavailable in Existing UF Systems 244 - Medium Priority* + Unavailable in Existing UF Systems 10* Initial priority metrics based on compliance and financial implications to UF customer service.
Table 1: List of Potential Metrics to Develop by Organizational Element
Organizational Element Evaluation Area Metric Number
Metric Metric Units Priority Area Priority Sub-Area
Parameters / Data Elements Purpose Intended Audience Requested By (If Applicable)
Metric Data Reference
Metrics Priority Area KeyDescription
PROCESS - Pre Award Export Controls 78 Number of Grants/Contracts that Involve Foreign Travel, Shipping, etc.
# (Awards) 2 - FY - Type (Personnel, Data, etc.) - Sponsor - College- Department- PI
Monitoring of grants and contracts to ensure proprietary information is not transferred to a foreign entity
- CCO- Dir. Spon Prog
PIs (College of Engineering)
PROCESS - Pre Award Export Controls 79 Number of Projects with Technology Controls Plans # (Awards) 2 - FY- Sponsor- Project- Project Dates- College- Department- PI- Control Plan Start and End Date
Monitoring of grants and contracts with identified control plans
- CCO- VPR- Dir. Spon Prog- Dir C&G- Deans/Chairs
Stephanie Gray
PROCESS - Pre Award Export Controls 80 Number of Projects with Publication Restrictions # (Awards) 2 - FY- Sponsor- Project- Project Dates- College- Department- PI- Publication Restriction Dates
Monitoring of grants and contracts with publication restrictions to ensure information is not released
- CCO- VPR- Dir. Compliance- Dir. Spon Prog- Dir C&G- Deans/Chairs
Stephanie Gray
PROCESS - Pre Award Export Controls 81 Number of Projects with Export Control Flagged # (Awards) 2 - FY- Sponsor- Project Dates- College- Department- PI
Identify and review the proposals and awards marked as involving export controls via a question(s) in Click
- CCO- VPR- Dir. Compliance- Dir. Spon Prog
Irene Cook
Subawards and Monitoring Assess subaward trends. Ensure proper controls in place to mitigate riskPROCESS - Post Award Subawards and Monitoring 82 Subrecipient risk level # (subawards), $ (Subs) 2 - FY
- Sponsor - College- Department- High Risk Classification (institution foreign or domestics, $ value, prior engagement, etc.)- Subaward Execution
Classify risk of subcontracting to Subrecipient
- Dir. C&G- Subk Supervisor- Subk Team
Cash Management Establish tools to identify risks to reimbursement PROCESS - Post Award Cash Management 83 Average LOC Draw Trend # (draws) $ (draws) 2 - Quarter for last 3 FY
- Sponsor- College - Department - Frequency
Track LOC trend to ensure appropriate reimbursement
- Dir. C&G- Cash Mgmt Sup
Cost Transfers Ensure needed review and approvals exist, and cost transfers are processed in a timely mannerPROCESS - Post Award Cost Transfers 84 Cost Transfer Review/Process Backlog # (CTs), $ (Transferred) 2 - FY
- Sponsor - College- Department - PI- Original Date Cost Incurred- Date cost routed for review- Labor vs. Non-Labor- 0-$100, 100-$500, $500-1000, $1000-$2000, $2000+- Reason for Delay - Justification
Actively track backlog and evaluate reason for backlog, developing solutions to minimize population or enhance process
- Dir. C&G- Post Award Sup- Post Award Admin
Brad Staats, Tiffany Schmidt, QC Team
Program Income Ensure appropriate controls exist to track program incomePROCESS - Post Award Program Income 85 # of Program Income accounts and $ # (Accounts - Prog
Income), $2 - FY
- Sponsor- College - Department - # Program Income accounts- Program Income Type
Active monitoring of accounts and $ against award terms to ensure compliance with regulations
- Post Award Sup- Post Award Admin
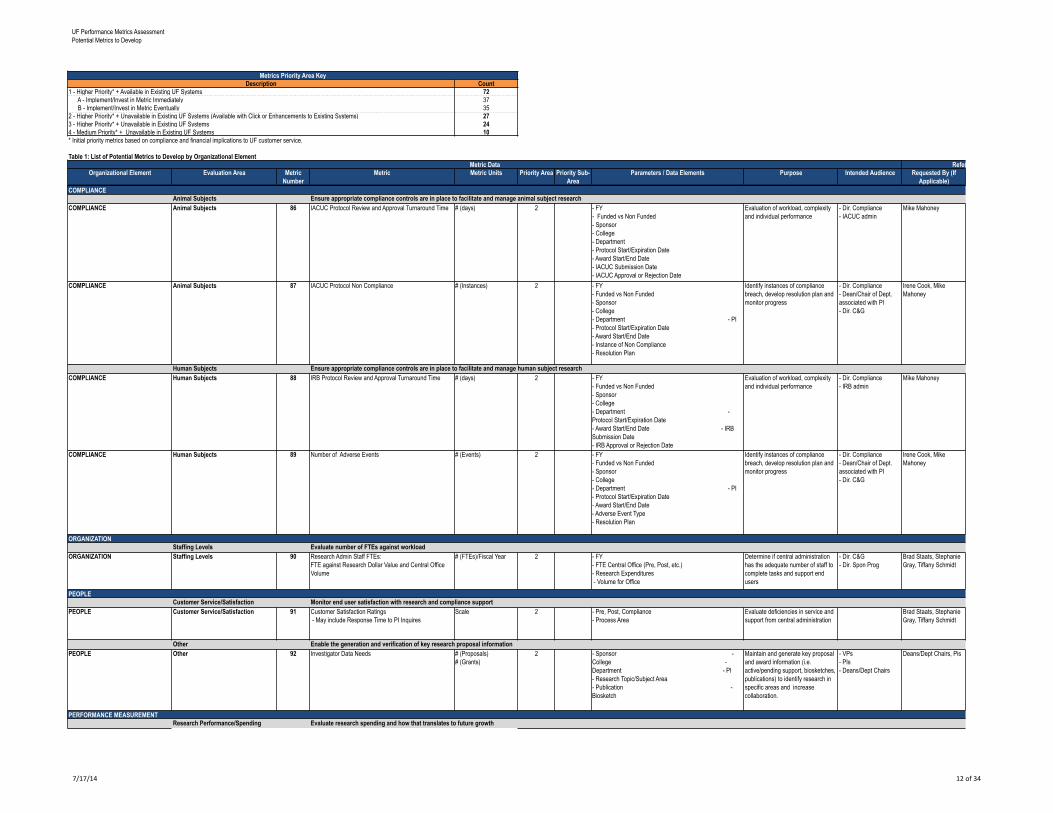
UF Performance Metrics Assessment Potential Metrics to Develop
7/17/14 12 of 34
Count1 - Higher Priority* + Available in Existing UF Systems 72 A - Implement/Invest in Metric Immediately 37 B - Implement/Invest in Metric Eventually 352 - Higher Priority* + Unavailable in Existing UF Systems (Available with Click or Enhancements to Existing Systems) 273 - Higher Priority* + Unavailable in Existing UF Systems 244 - Medium Priority* + Unavailable in Existing UF Systems 10* Initial priority metrics based on compliance and financial implications to UF customer service.
Table 1: List of Potential Metrics to Develop by Organizational Element
Organizational Element Evaluation Area Metric Number
Metric Metric Units Priority Area Priority Sub-Area
Parameters / Data Elements Purpose Intended Audience Requested By (If Applicable)
Metric Data Reference
Metrics Priority Area KeyDescription
COMPLIANCEAnimal Subjects Ensure appropriate compliance controls are in place to facilitate and manage animal subject research
COMPLIANCE Animal Subjects 86 IACUC Protocol Review and Approval Turnaround Time # (days) 2 - FY - Funded vs Non Funded - Sponsor- College - Department - Protocol Start/Expiration Date - Award Start/End Date- IACUC Submission Date - IACUC Approval or Rejection Date
Evaluation of workload, complexity and individual performance
- Dir. Compliance- IACUC admin
Mike Mahoney
COMPLIANCE Animal Subjects 87 IACUC Protocol Non Compliance # (Instances) 2 - FY- Funded vs Non Funded- Sponsor- College - Department - PI - Protocol Start/Expiration Date - Award Start/End Date- Instance of Non Compliance- Resolution Plan
Identify instances of compliance breach, develop resolution plan and monitor progress
- Dir. Compliance- Dean/Chair of Dept. associated with PI- Dir. C&G
Irene Cook, Mike Mahoney
Human Subjects Ensure appropriate compliance controls are in place to facilitate and manage human subject researchCOMPLIANCE Human Subjects 88 IRB Protocol Review and Approval Turnaround Time # (days) 2 - FY
- Funded vs Non Funded- Sponsor- College - Department - Protocol Start/Expiration Date - Award Start/End Date - IRB Submission Date - IRB Approval or Rejection Date
Evaluation of workload, complexity and individual performance
- Dir. Compliance- IRB admin
Mike Mahoney
COMPLIANCE Human Subjects 89 Number of Adverse Events # (Events) 2 - FY- Funded vs Non Funded- Sponsor- College - Department - PI - Protocol Start/Expiration Date - Award Start/End Date- Adverse Event Type- Resolution Plan
Identify instances of compliance breach, develop resolution plan and monitor progress
- Dir. Compliance- Dean/Chair of Dept. associated with PI- Dir. C&G
Irene Cook, Mike Mahoney
ORGANIZATIONStaffing Levels Evaluate number of FTEs against workload
ORGANIZATION Staffing Levels 90 Research Admin Staff FTEs:FTE against Research Dollar Value and Central Office Volume
# (FTEs)/Fiscal Year 2 - FY- FTE Central Office (Pre, Post, etc.)- Research Expenditures - Volume for Office
Determine if central administration has the adequate number of staff to complete tasks and support end users
- Dir. C&G- Dir. Spon Prog
Brad Staats, Stephanie Gray, Tiffany Schmidt
PEOPLECustomer Service/Satisfaction Monitor end user satisfaction with research and compliance support
PEOPLE Customer Service/Satisfaction 91 Customer Satisfaction Ratings - May include Response Time to PI Inquires
Scale 2 - Pre, Post, Compliance- Process Area
Evaluate deficiencies in service and support from central administration
Brad Staats, Stephanie Gray, Tiffany Schmidt
Other Enable the generation and verification of key research proposal informationPEOPLE Other 92 Investigator Data Needs # (Proposals)
# (Grants)2 - Sponsor -
College - Department - PI - Research Topic/Subject Area - Publication - Biosketch
Maintain and generate key proposal and award information (i.e. active/pending support, biosketches, publications) to identify research in specific areas and increase collaboration.
- VPs - PIs - Deans/Dept Chairs
Deans/Dept Chairs, Pis
PERFORMANCE MEASUREMENTResearch Performance/Spending Evaluate research spending and how that translates to future growth

UF Performance Metrics Assessment Potential Metrics to Develop
7/17/14 13 of 34
Count1 - Higher Priority* + Available in Existing UF Systems 72 A - Implement/Invest in Metric Immediately 37 B - Implement/Invest in Metric Eventually 352 - Higher Priority* + Unavailable in Existing UF Systems (Available with Click or Enhancements to Existing Systems) 273 - Higher Priority* + Unavailable in Existing UF Systems 244 - Medium Priority* + Unavailable in Existing UF Systems 10* Initial priority metrics based on compliance and financial implications to UF customer service.
Table 1: List of Potential Metrics to Develop by Organizational Element
Organizational Element Evaluation Area Metric Number
Metric Metric Units Priority Area Priority Sub-Area
Parameters / Data Elements Purpose Intended Audience Requested By (If Applicable)
Metric Data Reference
Metrics Priority Area KeyDescription
PERFORMANCE MEASUREMENT Research Performance/Spending 93 Proposal: Award Acceptance Rate % 2 - FY- Department- Sponsor- PI- Total Research Enterprise $- Proposal $- Awarded $
Determine how successful the institution is year to year in converting proposals to awards
- Dir. Spon Prog- Dir. C&G- VP Research- CFO
Stephanie Gray, VPs, Deans/Dept Chars
PERFORMANCE MEASUREMENT Research Performance/Spending 94 Sponsored Project Growth Percentages % 2 - Last 5 FY- Direct and Indirects- Dept- PI
Track sponsored research growth against targets
- Dir. Spon Prog- Dir. C&G- VP Research- CFO
VPs, Deans/Dept Chairs, Pis, CFO
PERFORMANCE MEASUREMENT Research Performance/Spending 95 Research Spending by Subject Matter / Research Topic # (Awards), $ (Expenditures)
2 - FY- $- Research Topic/Area- PI- Dept
Track research dollars and topic area to provide transparency on types of research and increase interdisciplinary research collaboration across colleges
- Dir. Spon Prog - Dir. C&G- VP Research- CFO - PIs - Deans/ Department Chairs
VPs, Deans/Dept Chairs, Pis
PERFORMANCE MEASUREMENT Research Performance/Spending 96 IDC Dollars per Total Research Facility Square Footage # (Feet) $ (Dollars)
2 - FY- Department - IDC Amount
Monitor IDC dollars supports research space
- VP Research- Dean/Chairs
Stephanie Gray
PERFORMANCE MEASUREMENT Research Performance/Spending 97 Number and Dollar Value (Operating Costs) of Established Recharge Centers / Service Center
# (Centers)/$ 2 - Recharge Center- $ subsidies- Department- Accounts charged - sponsored vs non-sponsored
Assess usage of recharge centers and value
- CFO- Center Dir.- Dir. C&G
CFO, Dept Chair (CLAS)
PERFORMANCE MEASUREMENT Research Performance/Spending 98 Research Productivity by PI (Publications, Citations) # (Publications) # Citations
2 - FY- Funded vs Non Funded - Sponsor - College - Department - PI
Measure research productivity of active researchers in terms of number of publications, citations, etc.
- VP Research- Dean/Chairs
Stephanie Gray
PERFORMANCE MEASUREMENT Research Performance/Spending 99 ROI on Start-up Packages $ 1 B - FY- Start-up Costs Allocated- College- Department- PI- Research Area- Sponsored Awards Received - $ and #- Sponsor- Publications
Measure the return on investment of start up costs allocated to faculty
- VP Research- CFO- Dean/Chairs
David Norton
Priority Area 3: Priority Metric & current unavailable in UF systems PROCESS - Pre Award
Pre Award Accounts Assess the controls in place to ensure proper oversight, minimizing the risk the institution while also ensuring no delays to researchPROCESS - Pre Award Temporary Projects (Pre Award
Accounts)100 Expenditures charged to award prior to Project Start
Date, but no pre award account established$ (expenditures) 3 - FY
- Accounts charges parked on/transferred from- Sponsor - College- Department- PI
Identify potential process and training issues on account usage
- Dir. Spon Prog
Award Setup Evaluate the current award setup process and potential opportunities to increase efficiency and accuracyPROCESS - Pre Award Award Setup 101 Number of Awards Set Up and Set up Turnaround Time -
AWARD MODIFICATIONS# (Accounts), # (days) 3 - FY
- Sponsor - College- Department- PI- Award receipt date- Account setup date- Project Start and End Date- Budget Period Start and End- Reason for Delay
Assess award volume and receipt trends year to year. Evaluate the efficiency of the award setup team
- Dir. Spon Prog- Pre Award Supervisors- Pre Award Admin
Brad Staats, Tiffany Schmidt

UF Performance Metrics Assessment Potential Metrics to Develop
7/17/14 14 of 34
Count1 - Higher Priority* + Available in Existing UF Systems 72 A - Implement/Invest in Metric Immediately 37 B - Implement/Invest in Metric Eventually 352 - Higher Priority* + Unavailable in Existing UF Systems (Available with Click or Enhancements to Existing Systems) 273 - Higher Priority* + Unavailable in Existing UF Systems 244 - Medium Priority* + Unavailable in Existing UF Systems 10* Initial priority metrics based on compliance and financial implications to UF customer service.
Table 1: List of Potential Metrics to Develop by Organizational Element
Organizational Element Evaluation Area Metric Number
Metric Metric Units Priority Area Priority Sub-Area
Parameters / Data Elements Purpose Intended Audience Requested By (If Applicable)
Metric Data Reference
Metrics Priority Area KeyDescription
PROCESS - Pre Award Award Setup 102 Number of Award Setup in Backlog - AWARD MODIFICATIONS
# (Accounts), $ (Set-Up Budgets)
3 - FY - Sponsor - College- Department- PI- Award receipt date- Project Start and End Date- Budget Period Start and End- Reason for delay
Actively track backlog and evaluate reason for backlog, developing solutions to minimize population
- Dir. Spon Prog- Pre Award Supervisors- Pre Award Admin
Brad Staats, Tiffany Schmidt
PROCESS - Pre Award Award Setup 103 Accuracy of award setup % Complete/Accurate 3 - Key Award Setup Fields Complete- Key Award Setup Fields Accurate
Ensure appropriate values are verified and management can assess accuracy and accountability of award setup team
- Dir. Spon Prog Brad Staats, Tiffany Schmidt
Proposal Review & Approval Evaluate the efficiency of the pre award office and departments along with departments understanding of process and compliancePROCESS - Pre Award Proposal Review & Approval 104 Average Proposal Review Turnaround Time # (days) 3 - FY (date submitted)
- Due Date- Date routed to reviewer- Date submitted
Ensure pre award office is responsive and managing proposal workload
- Dir. Spon Prog- Pre Award Supervisors- Pre Award Admin
Stephanie Gray
Export Controls Provide management high-level analysis of potential export control risksPROCESS - Pre Award Export Controls 105 Number of Grants/Contracts that Involve Foreign
Nationals# (Awards) 3 - FY -
Type (Personnel, Data, etc.) - Sponsor - College- Department- PI
Monitoring of grants and contracts to ensure foreign nationals do not transfer information, data, services, etc. to a foreign entity
- CCO- Dir. Spon Prog
PIs (College of Engineering)
PROCESS - Post AwardCash Management Establish tools to identify risks to reimbursement
PROCESS - Post Award Cash Management 106 Number and Dollar Value of Unapplied checks # (checks), $ 3 - Month for last FY- Sponsor - College - Department
Oversight of account to ensure $ does not exceed performance target and application of cash occurs at regular intervals
- Cash Mgmt Sup- Cash Mgmt Team
Brad Staats, Tiffany Schmidt, C&G Leads, Depts
PROCESS - Post Award Cash Management 107 Unbilled Aging Report $ (unbilled) 3 - Month- Sponsor- College- Dept- PI- Amount unbilled- Days unbilled- Bill Type (monthly, quarterly)- Reason no billed
Monitor invoices to ensure not delays or issues in reimubrsement as well as oversee the workload of the cash management team
- Cash Mgmt Sup- Cash Mgmt Team
Matt Fajack
Closeout Ensure accounts reconciled and closed in a timely mannerPROCESS - Post Award Closeout 108 Closeout Turnaround Time # (days) 3 - FY
- Closeout Date - Project End Date- Sponsor- College - Department - PI- Post-Award FTE Assigned
Ensure closeout timeframe aligns with policy. Monitoring of post award admin performance
- Dir. C&G- Post Award Sup- Post Award Admin
Brad Staats, Tiffany Schmidt
Financial Reporting Track financial reporting workload and efficiencyPROCESS - Post Award Financial Reporting 109 Average FFR completion time for Post Award # (hours) 3 - Sponsor
- Award TypeEvaluation of workload, complexity and individual performance
- Dir. C&G- Post Award Sup
Brad Staats, Tiffany Schmidt
Subawards and Monitoring Assess subaward trends. Ensure proper controls in place to mitigate riskPROCESS - Post Award Subawards and Monitoring 110 Subrecipients with A-133 Findings # (subawards) 3 - FY
- Subrecipient- Findings- Resolution/Risk Plan- Date plan updated and reevaluated
Determine whether findings jeopardize or place award outcomes at risk, and establish plan
- Dir. C&G- General Counsel- Subk Supervisor- Subk Team
COMPLIANCEBiosafety and Environmental Health & Safety - Ensure appropriate compliance controls are in place to facilitate and manage bio and health safety research

UF Performance Metrics Assessment Potential Metrics to Develop
7/17/14 15 of 34
Count1 - Higher Priority* + Available in Existing UF Systems 72 A - Implement/Invest in Metric Immediately 37 B - Implement/Invest in Metric Eventually 352 - Higher Priority* + Unavailable in Existing UF Systems (Available with Click or Enhancements to Existing Systems) 273 - Higher Priority* + Unavailable in Existing UF Systems 244 - Medium Priority* + Unavailable in Existing UF Systems 10* Initial priority metrics based on compliance and financial implications to UF customer service.
Table 1: List of Potential Metrics to Develop by Organizational Element
Organizational Element Evaluation Area Metric Number
Metric Metric Units Priority Area Priority Sub-Area
Parameters / Data Elements Purpose Intended Audience Requested By (If Applicable)
Metric Data Reference
Metrics Priority Area KeyDescription
COMPLIANCE Biosafety and Environmental Health & Safety
111 Number of Grants w/IBC protocols # (Awards) 3 - FY- Sponsor- College - Department - Protocol Start/Expiration Date - Award Start/End Date
Identify potential bio and health safety on sponsored projects to ensure compliance and appropriate oversight
- Dir. Compliance- IBC Admin.- Dir. C&G
Irene Cook
COMPLIANCE Biosafety and Environmental Health & Safety
112 Number of Active Biosafety Protocols # (Protocols) 3 - FY- Funded vs Non Funded- Sponsor- College - Department - Protocol Start/Expiration Date - Award Start/End Date - Grant and Non Grant
Track IBC protocol trend year to year - Dir. Compliance- IBC Admin.
Irene Cook, Mike Mahoney
COMPLIANCE Biosafety and Environmental Health & Safety
113 IBC Approval Turnaround Time # (days) 3 - FY- Funded vs Non Funded- Sponsor- College - Department - Protocol Start/Expiration Date - Award Start/End Date - IBC Submission Date - Full Approval or Rejection Date- Number of times application returned for questions/clarification
Evaluation of workload, complexity and individual performance
- Dir. Compliance- IBC Admin.
Irene Cook
COMPLIANCE Biosafety and Environmental Health & Safety
114 Number of Expired Protocols in Database # (Protocols) 3 - FY- Funded vs Non Funded- Sponsor- College - Department - Protocol Start/Expiration Date - Award Start/End Date
Identify compliance risks and delays in research due lag in protocol renewal
- Dir. Compliance- Dir. C&G- IBC admin
COMPLIANCE Biosafety and Environmental Health & Safety
115 Protocol Non Compliance # (Events) 3 - FY- Funded vs Non Funded- Grant vs Non Grants- Department- PI- Sponsor- Non Compliance Type- Resolution Plan
Identify instances of compliance breach, develop resolution plan and monitor progress
- Dir. Compliance- Dean/Chair of Dept. associated with PI- Dir. C&G
Irene Cook
COMPLIANCE Biosafety and Environmental Health & Safety
116 Number of Suspended IBC Protocols # (Protocols) 3 - FY - Funded vs Non Funded- Sponsor- College - Department - Protocol Start/Expiration Date - Award Start/End Date- Suspension Reason
Identify instances of potential or actual compliance risks and establish resolution plan, or revised process
- Dir. Compliance- Dean/Chair of Dept. associated with PI- Dir. C&G
Irene Cook
COMPLIANCE Biosafety and Environmental Health & Safety
117 Number of Labs and Inspections by Biosafety Level # (Labs) 3 - FY- Sponsor- College - Department - Protocol Start/Expiration Date - Award Start/End Date- Inspection Type - PI(s) associated with lab- Outcome/Ruling- Resolution Plan
Ensure appropriate frequency and level of inspection
- Dir. Compliance- IBC Inspection Officers
COI Ensure appropriate compliance controls are in place to manage potential and actual Conflicts of Interest
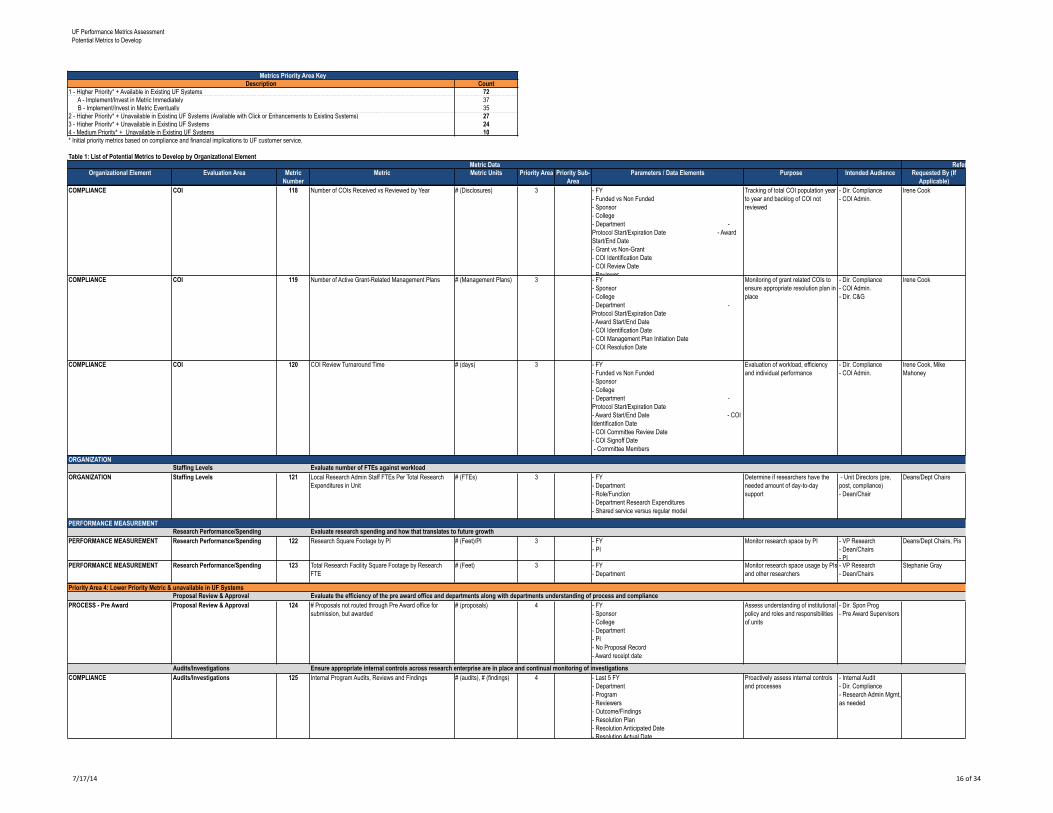
UF Performance Metrics Assessment Potential Metrics to Develop
7/17/14 16 of 34
Count1 - Higher Priority* + Available in Existing UF Systems 72 A - Implement/Invest in Metric Immediately 37 B - Implement/Invest in Metric Eventually 352 - Higher Priority* + Unavailable in Existing UF Systems (Available with Click or Enhancements to Existing Systems) 273 - Higher Priority* + Unavailable in Existing UF Systems 244 - Medium Priority* + Unavailable in Existing UF Systems 10* Initial priority metrics based on compliance and financial implications to UF customer service.
Table 1: List of Potential Metrics to Develop by Organizational Element
Organizational Element Evaluation Area Metric Number
Metric Metric Units Priority Area Priority Sub-Area
Parameters / Data Elements Purpose Intended Audience Requested By (If Applicable)
Metric Data Reference
Metrics Priority Area KeyDescription
COMPLIANCE COI 118 Number of COIs Received vs Reviewed by Year # (Disclosures) 3 - FY- Funded vs Non Funded- Sponsor- College - Department - Protocol Start/Expiration Date - Award Start/End Date- Grant vs Non-Grant- COI Identification Date- COI Review Date- Reviewer
Tracking of total COI population year to year and backlog of COI not reviewed
- Dir. Compliance- COI Admin.
Irene Cook
COMPLIANCE COI 119 Number of Active Grant-Related Management Plans # (Management Plans) 3 - FY- Sponsor- College - Department - Protocol Start/Expiration Date - Award Start/End Date- COI Identification Date- COI Management Plan Initiation Date- COI Resolution Date
Monitoring of grant related COIs to ensure appropriate resolution plan in place
- Dir. Compliance- COI Admin.- Dir. C&G
Irene Cook
COMPLIANCE COI 120 COI Review Turnaround Time # (days) 3 - FY- Funded vs Non Funded- Sponsor- College - Department - Protocol Start/Expiration Date - Award Start/End Date - COI Identification Date- COI Committee Review Date- COI Signoff Date - Committee Members
Evaluation of workload, efficiency and individual performance
- Dir. Compliance- COI Admin.
Irene Cook, Mike Mahoney
ORGANIZATIONStaffing Levels Evaluate number of FTEs against workload
ORGANIZATION Staffing Levels 121 Local Research Admin Staff FTEs Per Total Research Expenditures in Unit
# (FTEs) 3 - FY- Department- Role/Function- Department Research Expenditures- Shared service versus regular model
Determine if researchers have the needed amount of day-to-day support
- Unit Directors (pre, post, compliance)- Dean/Chair
Deans/Dept Chairs
PERFORMANCE MEASUREMENTResearch Performance/Spending Evaluate research spending and how that translates to future growth
PERFORMANCE MEASUREMENT Research Performance/Spending 122 Research Square Footage by PI # (Feet)/PI 3 - FY- PI
Monitor research space by PI - VP Research- Dean/Chairs- PI
Deans/Dept Chairs, Pis
PERFORMANCE MEASUREMENT Research Performance/Spending 123 Total Research Facility Square Footage by Research FTE
# (Feet) 3 - FY- Department
Monitor research space usage by PIs and other researchers
- VP Research- Dean/Chairs
Stephanie Gray
Priority Area 4: Lower Priority Metric & unavailable in UF Systems Proposal Review & Approval Evaluate the efficiency of the pre award office and departments along with departments understanding of process and compliance
PROCESS - Pre Award Proposal Review & Approval 124 # Proposals not routed through Pre Award office for submission, but awarded
# (proposals) 4 - FY- Sponsor - College- Department- PI- No Proposal Record- Award receipt date
Assess understanding of institutional policy and roles and responsibilities of units
- Dir. Spon Prog- Pre Award Supervisors
Audits/Investigations Ensure appropriate internal controls across research enterprise are in place and continual monitoring of investigationsCOMPLIANCE Audits/Investigations 125 Internal Program Audits, Reviews and Findings # (audits), # (findings) 4 - Last 5 FY
- Department- Program- Reviewers- Outcome/Findings- Resolution Plan- Resolution Anticipated Date- Resolution Actual Date
Proactively assess internal controls and processes
- Internal Audit- Dir. Compliance- Research Admin Mgmt, as needed
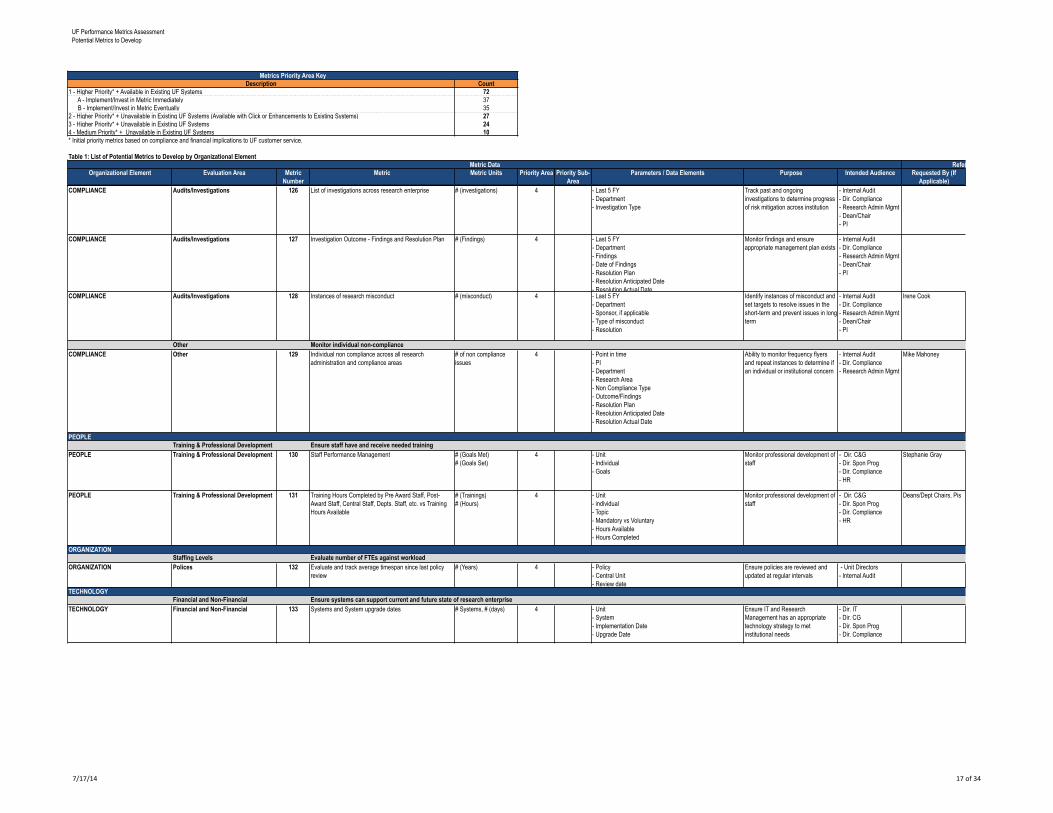
UF Performance Metrics Assessment Potential Metrics to Develop
7/17/14 17 of 34
Count1 - Higher Priority* + Available in Existing UF Systems 72 A - Implement/Invest in Metric Immediately 37 B - Implement/Invest in Metric Eventually 352 - Higher Priority* + Unavailable in Existing UF Systems (Available with Click or Enhancements to Existing Systems) 273 - Higher Priority* + Unavailable in Existing UF Systems 244 - Medium Priority* + Unavailable in Existing UF Systems 10* Initial priority metrics based on compliance and financial implications to UF customer service.
Table 1: List of Potential Metrics to Develop by Organizational Element
Organizational Element Evaluation Area Metric Number
Metric Metric Units Priority Area Priority Sub-Area
Parameters / Data Elements Purpose Intended Audience Requested By (If Applicable)
Metric Data Reference
Metrics Priority Area KeyDescription
COMPLIANCE Audits/Investigations 126 List of investigations across research enterprise # (investigations) 4 - Last 5 FY- Department- Investigation Type
Track past and ongoing investigations to determine progress of risk mitigation across institution
- Internal Audit- Dir. Compliance- Research Admin Mgmt- Dean/Chair- PI
COMPLIANCE Audits/Investigations 127 Investigation Outcome - Findings and Resolution Plan # (Findings) 4 - Last 5 FY- Department- Findings- Date of Findings- Resolution Plan- Resolution Anticipated Date- Resolution Actual Date
Monitor findings and ensure appropriate management plan exists
- Internal Audit- Dir. Compliance- Research Admin Mgmt- Dean/Chair- PI
COMPLIANCE Audits/Investigations 128 Instances of research misconduct # (misconduct) 4 - Last 5 FY- Department- Sponsor, if applicable- Type of misconduct- Resolution
Identify instances of misconduct and set targets to resolve issues in the short-term and prevent issues in long-term
- Internal Audit- Dir. Compliance- Research Admin Mgmt- Dean/Chair- PI
Irene Cook
Other Monitor individual non-compliance COMPLIANCE Other 129 Individual non compliance across all research
administration and compliance areas# of non compliance issues
4 - Point in time- PI- Department- Research Area- Non Compliance Type- Outcome/Findings- Resolution Plan- Resolution Anticipated Date- Resolution Actual Date
Ability to monitor frequency flyers and repeat instances to determine if an individual or institutional concern
- Internal Audit- Dir. Compliance- Research Admin Mgmt
Mike Mahoney
PEOPLETraining & Professional Development Ensure staff have and receive needed training
PEOPLE Training & Professional Development 130 Staff Performance Management # (Goals Met) # (Goals Set)
4 - Unit- Individual - Goals
Monitor professional development of staff
- Dir. C&G- Dir. Spon Prog- Dir. Compliance- HR
Stephanie Gray
PEOPLE Training & Professional Development 131 Training Hours Completed by Pre Award Staff, Post-Award Staff, Central Staff, Depts. Staff, etc. vs Training Hours Available
# (Trainings) # (Hours)
4 - Unit- individual - Topic- Mandatory vs Voluntary- Hours Available- Hours Completed
Monitor professional development of staff
- Dir. C&G- Dir. Spon Prog- Dir. Compliance- HR
Deans/Dept Chairs, Pis
ORGANIZATIONStaffing Levels Evaluate number of FTEs against workload
ORGANIZATION Polices 132 Evaluate and track average timespan since last policy review
# (Years) 4 - Policy- Central Unit- Review date
Ensure policies are reviewed and updated at regular intervals
- Unit Directors- Internal Audit
TECHNOLOGYFinancial and Non-Financial Ensure systems can support current and future state of research enterprise
TECHNOLOGY Financial and Non-Financial 133 Systems and System upgrade dates # Systems, # (days) 4 - Unit- System- Implementation Date- Upgrade Date
Ensure IT and Research Management has an appropriate technology strategy to met institutional needs
- Dir. IT- Dir. CG- Dir. Spon Prog- Dir. Compliance

UF Performance Metrics Assessment Potential Metrics to Develop
7/17/14 18 of 34
System for Data Elements
Pre Award System, PeopleSoft
Pre Award System, PeopleSoft
PeopleSoft (Only Provides Information on New Temp Accounts)
PeopleSoft
PeopleSoft, Pre-Award Logs
Award Mail Log, Click Grants
Click Grants (Current Use of Pre-Award Log)
Reference

UF Performance Metrics Assessment Potential Metrics to Develop
7/17/14 19 of 34
System for Data Elements
Reference
Click Grants (Current Use of Pre-Award Logs / PeopleSoft)
SubK Database, Click Grants
SubK Database, Click Grants (Current Use of Pre-Award Log)
SubK Database, Click Grants (Require Customized Workflow)
PeopleSoft

UF Performance Metrics Assessment Potential Metrics to Develop
7/17/14 20 of 34
System for Data Elements
Reference
Access Database
Access Database
Access Database
PeopleSoft
PeopleSoft
PeopleSoft
PeopleSoft

UF Performance Metrics Assessment Potential Metrics to Develop
7/17/14 21 of 34
System for Data Elements
Reference
PeopleSoft
PeopleSoft
PeopleSoft
PeopleSoft
PeopleSoft
PeopleSoft
PeopleSoft
PeopleSoft

UF Performance Metrics Assessment Potential Metrics to Develop
7/17/14 22 of 34
System for Data Elements
Reference
PeopleSoft
PeopleSoft
Effort System
Effort System
Effort System
Effort System
Effort System
Effort System
Effort System

UF Performance Metrics Assessment Potential Metrics to Develop
7/17/14 23 of 34
System for Data Elements
Reference
PeopleSoft
PeopleSoft
PeopleSoft
PeopleSoft
PeopleSoft
Click IACUC
Click IACUC

UF Performance Metrics Assessment Potential Metrics to Develop
7/17/14 24 of 34
System for Data Elements
Reference
Click IACUC
Click IACUC
Click IACUC
Click IACUC
Click IACUC
Click IRB, IRB2 and IRB 3 data to be pulled and joined with IRB1
Click IRB, IRB2 and IRB 3 data to be pulled and joined with IRB1

UF Performance Metrics Assessment Potential Metrics to Develop
7/17/14 25 of 34
System for Data Elements
Reference
Click IRB
Click IRB
Click IRB
Click IRB
Click IRB (Must Be Specified on Form)
Click IRB (Must Be Specified on Form)
Click IRB (Must Be Specified on Form)

UF Performance Metrics Assessment Potential Metrics to Develop
7/17/14 26 of 34
System for Data Elements
Reference
PeopleSoft, HR
PeopleSoft, HR
Click/Future IBC System
PeopleSoft HR
PeopleSoft HR
PeopleSoft
PeopleSoft
PeopleSoft
STARS
PeopleSoft/Effort System
Award Database
PeopleSoft

UF Performance Metrics Assessment Potential Metrics to Develop
7/17/14 27 of 34
System for Data Elements
Reference
PeopleSoft
PeopleSoft
Click Grants (Current Use of Pre-Award Log)
Click Grants
Click Grants
Click Grants (Current Use of Pre-Award Logs / PeopleSoft)
Click Grants (Require Customized Reporting)
PeopleSoft, Click Grants

UF Performance Metrics Assessment Potential Metrics to Develop
7/17/14 28 of 34
System for Data Elements
Reference
Click Grants
Access Database
Click Grants
Click Grants
Access Database
PeopleSoft
Electronic Cost Transfer System
PeopleSoft

UF Performance Metrics Assessment Potential Metrics to Develop
7/17/14 29 of 34
System for Data Elements
Reference
Click IACUC (Upgraded)
Click IACUC (Upgraded)
Click IRB (Upgraded)
Click IRB (Upgraded)
PeopleSoft (FTE Only, Not Award Data)
Qualtrics
Click Grants

UF Performance Metrics Assessment Potential Metrics to Develop
7/17/14 30 of 34
System for Data Elements
Reference
Click Grants (Current Use of Pre-Award Logs)
Click Grants
Click Grants
STARS
Kayako (CLAS only), Not tracked in IFAS
No System/Not Tracked
Multiple Systems Needed, some information not currently captured
PeopleSoft
PeopleSoft (Not tracked)

UF Performance Metrics Assessment Potential Metrics to Develop
7/17/14 31 of 34
System for Data Elements
Reference
PeopleSoft (Not tracked)
QCed by RA team (not automated)
Click Grants (Current Use of Pre-Award Log)
No System/Not Tracked
PeopleSoft (Not tracked)
PeopleSoft
PeopleSoft (Not tracked)
PeopleSoft (Not tracked)
Access Database

UF Performance Metrics Assessment Potential Metrics to Develop
7/17/14 32 of 34
System for Data Elements
Reference
No System/Not Tracked
No System/Not Tracked
No System/Not Tracked
No System/Not Tracked
No System/Not Tracked
No System/Not Tracked
No System/Not Tracked

UF Performance Metrics Assessment Potential Metrics to Develop
7/17/14 33 of 34
System for Data Elements
Reference
No System/Not Tracked
No System/Not Tracked
No System/Not Tracked
No System/Not Tracked
No System/Not TrackedAble to pull for COM
No System/Not Tracked
No System/Not Tracked
No System/Not Tracked

UF Performance Metrics Assessment Potential Metrics to Develop
7/17/14 34 of 34
System for Data Elements
Reference
No System/Not Tracked
No System/Not Tracked
No System/Not Tracked
No System/Not Tracked
No System/Not Tracked
HR Database - Confirm
No System/Not Tracked
No System/Not Tracked

Clinical and Translational Scientist Career Success: Metrics forEvaluation
Linda S. Lee, Ph.D.1, Susan N. Pusek, M.S.2, Wayne T. McCormack, Ph.D.3, Deborah L.Helitzer, Sc.D.4, Camille A. Martina, M.S., Ph.D.5, Ann Dozier, Ph.D.5, Jasjit S. Ahluwalia,M.D., M.P.H., M.S.6, Lisa Schwartz, Ed.D.7, Linda M. McManus, Ph.D.8, Brian Reynolds,Ph.D.9, Erin Haynes, Dr.P.H., M.S.10, and Doris M. Rubio, Ph.D.11
1Department of Biostatistics & Bioinformatics, School of Medicine, Duke University, Durham,North Carolina, USA2NC TraCS Institute, University of North Carolina at Chapel Hill, Chapel Hill, North Carolina, USA3Pathology, Immunology & Laboratory Medicine, College of Medicine, University of Florida,Gainesville, Florida, USA4Department of Family and Community Medicine, University of New Mexico School of Medicine,Albuquerque, New Mexico, USA5Department of Community and Preventive Medicine, University of Rochester, School of Medicineand Dentistry, Rochester, New York, USA6Department of Medicine and Center for Health Equity, Medical School, University of Minnesota,Minneapolis, Minnesota, USA7Department of Clinical Research and Leadership, The George Washington University School ofMedicine and Health Sciences, Washington, District of Columbia, USA8Departments of Pathology and Periodontics, University of Texas Health Science Center at SanAntonio, San Antonio, Texas, USA9Duke Translational Medicine Institute, School of Medicine, Duke University, Durham, NorthCarolina, USA10Department of Environmental Health, Division of Epidemiology and Biostatistics, College ofMedicine, University of Cincinnati, Cincinnati, Ohio, USA11Departments of Medicine, Biostatistics, Nursing, Institute for Clinical Research Education,School of Medicine, University of Pittsburgh, Pittsburgh, Pennsylvania, USA
AbstractDespite the increased emphasis on formal training in clinical and translational research and thegrowth in the number and scope of training programs over the past decade, the impact of trainingon research productivity and career success has yet to be fully evaluated at the institutional level.In this article, the Education Evaluation Working Group of the Clinical and Translational ScienceAward Consortium introduces selected metrics and methods associated with the assessment of keyfactors that affect research career success. The goals in providing this information are toencourage more consistent data collection across training sites, to foster more rigorous andsystematic exploration of factors associated with career success, and to help address previouslyidentified difficulties in program evaluation.
Correspondence: Linda S. Lee, Ph.D., 2424 Erwin Road, Suite G06; DUMC Box 2734, Durham, NC 27710, USA; phone919-681-8653; fax 919-681-4569; [email protected].
NIH Public AccessAuthor ManuscriptClin Transl Sci. Author manuscript; available in PMC 2013 October 01.
Published in final edited form as:Clin Transl Sci. 2012 October ; 5(5): 400–407. doi:10.1111/j.1752-8062.2012.00422.x.
NIH
-PA Author Manuscript
NIH
-PA Author Manuscript
NIH
-PA Author Manuscript

Keywordsclinical research; translational research; research careers; research success; evaluation; CTSA;graduate training; research training; mentoring; collaboration; team science
INTRODUCTIONThe provision of training and career development support in clinical and translationalresearch is a core element of every Clinical and Translational Science Award (CTSA)program of the National Institutes of Health (NIH).1 The training programs developed byCTSA recipients are intended to equip the next generation of clinical and translationalscientists with the tools not only to facilitate but also to accelerate the translation of basicscience discoveries into clinical care and improvements in public health. Because a trainingcomponent is required of all CTSA programs, a high priority is to evaluate the impact ofthese programs on the research productivity and success of trainees, both individually andcollectively.
Through the CTSA Education Evaluation Working Group, a number of difficulties inherentin the evaluation of physician-scientist and graduate training programs have been identified.These include redundancies in data collection among different reporting systems locally andnationally, problems in identifying appropriate metrics for both process and outcomemeasures, and problems in dealing with the emerging gap between traditional measures ofindividual career success and productivity and newer measures that relate success andproductivity to collaborative scientific endeavors. Over the past 18 months, this workinggroup turned its attention to identifying and sharing methods and tools for assessing theimpact of training on career success, using as a guiding framework the conceptual modelproposed at the University of Pittsburgh’s Clinical and Translational Science Institute byRubio and colleagues in their article entitled “A Comprehensive Career-Success Model forPhysician-Scientists.”2
Here, we begin by presenting an overview of the conceptual model that framed ourinvestigation of metrics and measures. We then describe selected tools and measures relatedto key components of the model, and we conclude with recommendations for further work inthis area.
OVERVIEW OF THE CAREER SUCCESS MODELIn light of the paucity of published information on factors related to the career success ofclinician-scientists, the Research on Careers Group at the University of Pittsburgh embarkedon an effort to evaluate the current literature and then create a comprehensive model ofcareer success that includes predictive factors identified in pertinent literature in relatedfields, such as business and the social sciences. Through its work,2 this group identified twocomponents of career success: extrinsic success (e.g., promotions, funded grants) andintrinsic success (e.g., career satisfaction). In addition, the group delineated two types ofhigher-order contextual factors that affect career success. The first type is personal factors,which include demographic characteristics (e.g., gender, race, ethnicity, age), educationalhistory (e.g., degrees, research experience), psychosocial factors (e.g., life events, family,dependent care, stress), and personality factors (e.g., motivation, passion, leadership). Thesecond type is organizational factors, which include institutional resources (e.g.,infrastructure, financial resources), training (e.g., didactics, research experience), conflictingdemands (e.g., clinical and service responsibilities), and relational factors (e.g., mentoring,networking).
Lee et al. Page 2
Clin Transl Sci. Author manuscript; available in PMC 2013 October 01.
NIH
-PA Author Manuscript
NIH
-PA Author Manuscript
NIH
-PA Author Manuscript

In the article describing the comprehensive model, Rubio and colleagues2 demonstrated howthe model can be used to test different relationships, such as moderating and mediatingfactors. For example, dependent care can moderate the relationship between gender andpromotion, whereas mentoring can mediate the relationship between dependent care andpromotion.
A key attribute of the comprehensive model is that it allows each institution to modify it inways that make it relevant to its own trainees and programs. The various CTSA programshave diversity in the type and intensity of training and in the level of trainees, who rangefrom high school students to faculty. There is likely to be some overlap in the factorsaffecting the careers of CTSA-funded TL1 trainees (who are typically predoctoral students)and KL2 scholars (who are generally junior faculty members). However, the degree towhich these factors vary or are affected by a specific training program is not known. Inaddition, there is diversity in the characteristics and priorities of the CTSA programs andtheir host institutions. Clearly, the environment in which a specific training program is basedcan influence the ultimate career success of its trainees. The model can be further refined toinclude such institutional factors as emphasis on multidisciplinary team science andutilization of CTSA resources.
MODEL DOMAINS AND ASSOCIATED METRICSEarly in their discussions, members of the CTSA Education Evaluation Working Groupacknowledged the tendency of individual programs, old and new, to “start from scratch,”work independently, and duplicate efforts when developing evaluation plans and metrics tomeet grant or institutional requirements. By identifying domains and determinants of careersuccess, the comprehensive model provides a starting framework to avoid potential misstepsand redundancies. It fosters more efficient development of program evaluations that aregrounded in the context of universally accepted metrics for career success while allowing forflexibility within the domains to incorporate metrics unique to specific programs. Briefdescriptions of some metrics and measures associated with the domains and components ofthe model follow.
Domains of Career SuccessExtrinsic career success factors—Extrinsic measures of career success are generallyviewed as “objective” and “material” indicators, such as financial success, promotions,leadership positions, grant funding, and publications. Curricula vitae (CVs) can be used toexamine these factors, and bibliometric tools enable more detailed analyses of publicationrecords. In addition, return-on-investment analysis (described later in this article) can helpinstitutional leaders and sponsors of training programs with strategic planning for futuretraining initiatives and measures to support the workforce.
Financial success: An individual’s interest in achieving financial success is one factor thatmay influence decisions made as his or her career progresses. An example of data that canbe collected to reflect financial success is actual income. The measure of financial success ischallenging because in academic medicine, as in other fields, salary is dependent on anindividual’s discipline, institution, and geographic region. The inclusion of financial successin the model is relevant, however, because it may provide further data to address theperception that there are financial disincentives to the pursuit of careers in research. Theextent to which individuals believe that financial success is possible in a particular careermay influence their choice of discipline and training program and, ultimately, influencewhether they are retained in the clinical and translational workforce.
Lee et al. Page 3
Clin Transl Sci. Author manuscript; available in PMC 2013 October 01.
NIH
-PA Author Manuscript
NIH
-PA Author Manuscript
NIH
-PA Author Manuscript
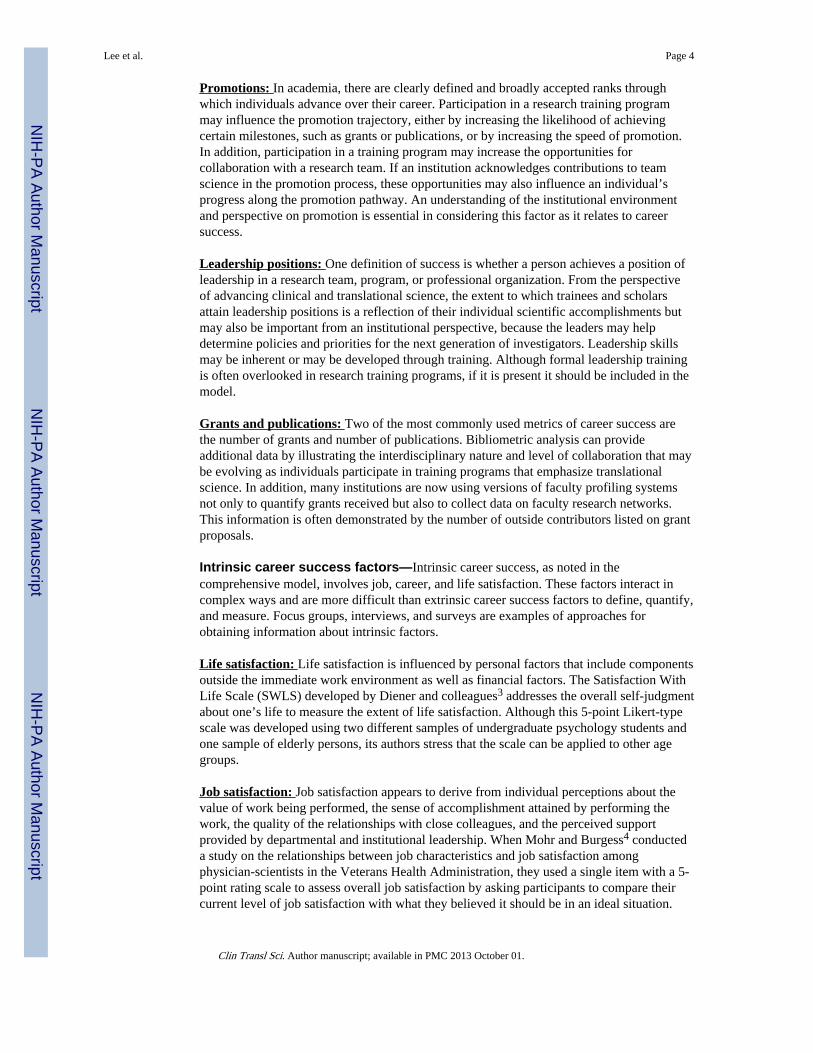
Promotions: In academia, there are clearly defined and broadly accepted ranks throughwhich individuals advance over their career. Participation in a research training programmay influence the promotion trajectory, either by increasing the likelihood of achievingcertain milestones, such as grants or publications, or by increasing the speed of promotion.In addition, participation in a training program may increase the opportunities forcollaboration with a research team. If an institution acknowledges contributions to teamscience in the promotion process, these opportunities may also influence an individual’sprogress along the promotion pathway. An understanding of the institutional environmentand perspective on promotion is essential in considering this factor as it relates to careersuccess.
Leadership positions: One definition of success is whether a person achieves a position ofleadership in a research team, program, or professional organization. From the perspectiveof advancing clinical and translational science, the extent to which trainees and scholarsattain leadership positions is a reflection of their individual scientific accomplishments butmay also be important from an institutional perspective, because the leaders may helpdetermine policies and priorities for the next generation of investigators. Leadership skillsmay be inherent or may be developed through training. Although formal leadership trainingis often overlooked in research training programs, if it is present it should be included in themodel.
Grants and publications: Two of the most commonly used metrics of career success arethe number of grants and number of publications. Bibliometric analysis can provideadditional data by illustrating the interdisciplinary nature and level of collaboration that maybe evolving as individuals participate in training programs that emphasize translationalscience. In addition, many institutions are now using versions of faculty profiling systemsnot only to quantify grants received but also to collect data on faculty research networks.This information is often demonstrated by the number of outside contributors listed on grantproposals.
Intrinsic career success factors—Intrinsic career success, as noted in thecomprehensive model, involves job, career, and life satisfaction. These factors interact incomplex ways and are more difficult than extrinsic career success factors to define, quantify,and measure. Focus groups, interviews, and surveys are examples of approaches forobtaining information about intrinsic factors.
Life satisfaction: Life satisfaction is influenced by personal factors that include componentsoutside the immediate work environment as well as financial factors. The Satisfaction WithLife Scale (SWLS) developed by Diener and colleagues3 addresses the overall self-judgmentabout one’s life to measure the extent of life satisfaction. Although this 5-point Likert-typescale was developed using two different samples of undergraduate psychology students andone sample of elderly persons, its authors stress that the scale can be applied to other agegroups.
Job satisfaction: Job satisfaction appears to derive from individual perceptions about thevalue of work being performed, the sense of accomplishment attained by performing thework, the quality of the relationships with close colleagues, and the perceived supportprovided by departmental and institutional leadership. When Mohr and Burgess4 conducteda study on the relationships between job characteristics and job satisfaction amongphysician-scientists in the Veterans Health Administration, they used a single item with a 5-point rating scale to assess overall job satisfaction by asking participants to compare theircurrent level of job satisfaction with what they believed it should be in an ideal situation.
Lee et al. Page 4
Clin Transl Sci. Author manuscript; available in PMC 2013 October 01.
NIH
-PA Author Manuscript
NIH
-PA Author Manuscript
NIH
-PA Author Manuscript

Another measure, the Job Satisfaction Survey (JSS),5 uses 36 items to measure nine relatedfactors and to generate 10 different scores, one of which is for overall job satisfaction. Theauthors of this 1985 survey tested the measure’s psychometric properties and developednorms for diverse samples. Considering the age of the survey and today’s population ofclinical and translational researchers, some items may need modification to produce strongerface validity, and some factors may not be applicable to this particular population.
Career satisfaction: Career satisfaction is closely related to life and job satisfaction. Highlevels of career satisfaction involve the ability to have input into the structure andfunctioning of the working environment. Career satisfaction extends to collegialrelationships, trust in colleagues to do the right thing, the ability to tap colleagues as sourcesof expertise, and other aspects of interpersonal relationships in the workplace. While muchhas been written about job satisfaction, there are few measures for career satisfaction.University of Pittsburgh evaluators created a single-item measure that asks trainees howsatisfied they are with the direction of their careers (Doris M. Rubio, PhD, e-mailcommunication, October 26, 2011). This single item is then scored on a scale of 1 to 5, with1 indicating not satisfied and 5 indicating very satisfied.
Determinants of Career SuccessPersonal factors—Among the factors that can affect an individual’s career success aredemographics, educational background, psychosocial factors, and even personality.Demographic data, for example, show differences in the number of men and women inleadership positions. If someone experiences certain life events or has significant familystress, these factors can negatively affect career success, at least in the short term. Somepersonal factors are easier to measure than others. Further, the ability of training programdirectors to intervene with regard to these factors may be limited. Here, we present somesuggestions for personal factors that are challenging to measure.
Leadership: Investigators have defined numerous competency sets for leadership, but mostare in the context of business rather than scientific research. Recently, however, leadershipcompetencies have been defined for public health professionals, nurses, and medicalprofessionals.6–8 Regardless of the context, the measures indicate that similar attributes andcompetence domains are essential for successful leadership. These include demonstratingintegrity, encouraging constructive dialogue, creating a shared vision, building partnerships,sharing leadership, empowering people, thinking globally, appreciating diversity,developing technological savvy, ensuring satisfaction of customers (which in the academicor research environment could consist of students, staff, faculty, or research participants),maintaining a competitive advantage (ensuring research success), achieving personalmastery, anticipating opportunities, and leading change. Within each of these broaddomains, there are four or five specific competencies addressed by items in most of theinstruments reviewed. One example is the Global Leader of the Future Inventory9 developedby Dr. Marshall Goldsmith, a 5-point Likert scale designed to be completed by an employerand colleagues that can be used to assess change over time.
The Turning Point National Program Office at the University of Washington School ofPublic Health and Community Medicine has identified six practices associated witheffective collaborative leadership, and the related self-assessments can be used in evaluatingleadership capacity or as educational tools.10
Motivation: Motivation to work affects career success. Whereas highly motivated facultyare likely to be resilient to negative feedback, grant rejections, or other challenges
Lee et al. Page 5
Clin Transl Sci. Author manuscript; available in PMC 2013 October 01.
NIH
-PA Author Manuscript
NIH
-PA Author Manuscript
NIH
-PA Author Manuscript

encountered during the research process, less motivated faculty may opt to terminate theirresearch career.
The Work Preference Inventory11 is a 30-item measure that assesses two factors: intrinsicmotivation and extrinsic motivation. These factors can be split into four secondary factors:the enjoyment, challenge, outward, and compensation scales. The inventory has been welltested with college students and working adults and has strong psychometric properties.
Passion and interest: Related to motivation are passion and interest in research. Manysuccessful scientists believe that passion is a necessary factor for achievement. For example,dedication to research requires long hours, often to the detriment of other interests orresponsibilities. The Grit scale12 is a four-item measure that assesses consistency of interestand perseverance of effort.
Self-efficacy: Mullikin and colleagues13 developed a measure to assess research self-efficacy for clinical researchers. This 92-item scale measures an individual’s self-efficacy orlevel of confidence in conducting 12 steps in research, from conceptualizing a study throughpresenting results from a study. Additional work is currently being done to shorten the scalewhile maintaining its psychometric properties.
Professionalism: Much has been written about professionalism for medical students andresidents, but research on how to measure professionalism among clinical and translationalscientists is limited. Researchers at Penn State University developed and validated a surveyinstrument that measures attitudes toward professionalism. The 20-item scale, called thePenn State College of Medicine Professionalism Questionnaire,14 assesses seven factors:accountability, enrichment, equity, honor and integrity, altruism, duty, and respect. Althoughit may not be necessary to measure all of these factors for clinical and translationalscientists, understanding the degree of professionalism and its impact on career success inresearch is certainly critical in the context of establishing and maintaining collaborations andsuccessfully executing team-oriented research.
Burnout: In a highly demanding field such as academic medicine, burnout is an importantissue to study. The challenges of developing a research career add to factors that maycontribute to burnout among developing investigators and even predoctoral trainees.Rohland and colleagues15 developed a single-item measure of burnout and validated itsresults with the Maslach Burnout Inventory. This single-item measure was shown to performwell for physicians and, by extension, is expected to perform well for clinical researchers.
Organizational factors—Career trajectories can be influenced by organizational factors,such as extent of institutional resources, and by relational factors, such as mentoring,training, and conflicting demands at work. These factors are relevant for predoctoral andpostdoctoral participants in training programs. While program leaders may not be able toaffect some of the personal factors that serve as barriers to success, they can often interveneto prevent organizational factors from interfering with success.
Financial resources and infrastructure: An individual’s ability to be successful can beaffected by his or her institution’s financial resources. For example, it can be affecteddramatically by whether faculty receive seed money for research as part of their hiringpackage, by whether departmental and institutional resources are focused on promotingtranslational research, and by whether an institute has funding through sources such as aCTSA. The resources and infrastructure required to be successful likely differ widely,depending on an individual’s training level and research approach. For instance, pilotprogram funding could positively impact the pace of an individual trainee’s research project,
Lee et al. Page 6
Clin Transl Sci. Author manuscript; available in PMC 2013 October 01.
NIH
-PA Author Manuscript
NIH
-PA Author Manuscript
NIH
-PA Author Manuscript
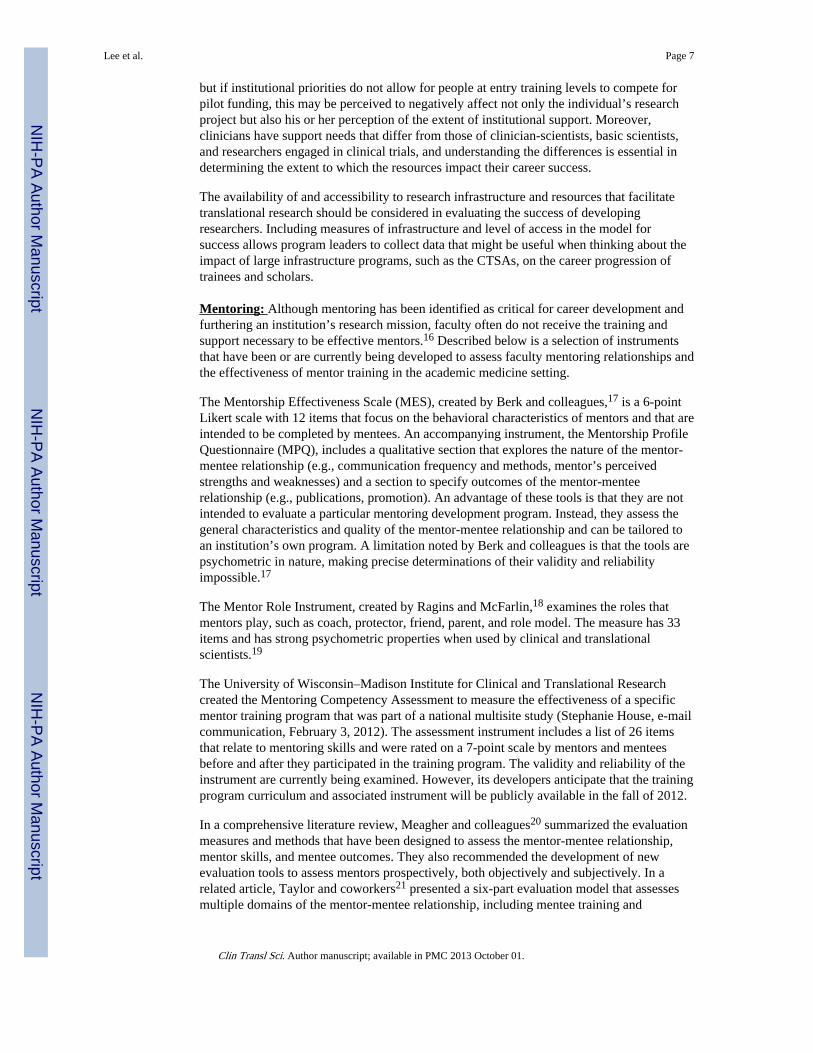
but if institutional priorities do not allow for people at entry training levels to compete forpilot funding, this may be perceived to negatively affect not only the individual’s researchproject but also his or her perception of the extent of institutional support. Moreover,clinicians have support needs that differ from those of clinician-scientists, basic scientists,and researchers engaged in clinical trials, and understanding the differences is essential indetermining the extent to which the resources impact their career success.
The availability of and accessibility to research infrastructure and resources that facilitatetranslational research should be considered in evaluating the success of developingresearchers. Including measures of infrastructure and level of access in the model forsuccess allows program leaders to collect data that might be useful when thinking about theimpact of large infrastructure programs, such as the CTSAs, on the career progression oftrainees and scholars.
Mentoring: Although mentoring has been identified as critical for career development andfurthering an institution’s research mission, faculty often do not receive the training andsupport necessary to be effective mentors.16 Described below is a selection of instrumentsthat have been or are currently being developed to assess faculty mentoring relationships andthe effectiveness of mentor training in the academic medicine setting.
The Mentorship Effectiveness Scale (MES), created by Berk and colleagues,17 is a 6-pointLikert scale with 12 items that focus on the behavioral characteristics of mentors and that areintended to be completed by mentees. An accompanying instrument, the Mentorship ProfileQuestionnaire (MPQ), includes a qualitative section that explores the nature of the mentor-mentee relationship (e.g., communication frequency and methods, mentor’s perceivedstrengths and weaknesses) and a section to specify outcomes of the mentor-menteerelationship (e.g., publications, promotion). An advantage of these tools is that they are notintended to evaluate a particular mentoring development program. Instead, they assess thegeneral characteristics and quality of the mentor-mentee relationship and can be tailored toan institution’s own program. A limitation noted by Berk and colleagues is that the tools arepsychometric in nature, making precise determinations of their validity and reliabilityimpossible.17
The Mentor Role Instrument, created by Ragins and McFarlin,18 examines the roles thatmentors play, such as coach, protector, friend, parent, and role model. The measure has 33items and has strong psychometric properties when used by clinical and translationalscientists.19
The University of Wisconsin–Madison Institute for Clinical and Translational Researchcreated the Mentoring Competency Assessment to measure the effectiveness of a specificmentor training program that was part of a national multisite study (Stephanie House, e-mailcommunication, February 3, 2012). The assessment instrument includes a list of 26 itemsthat relate to mentoring skills and were rated on a 7-point scale by mentors and menteesbefore and after they participated in the training program. The validity and reliability of theinstrument are currently being examined. However, its developers anticipate that the trainingprogram curriculum and associated instrument will be publicly available in the fall of 2012.
In a comprehensive literature review, Meagher and colleagues20 summarized the evaluationmeasures and methods that have been designed to assess the mentor-mentee relationship,mentor skills, and mentee outcomes. They also recommended the development of newevaluation tools to assess mentors prospectively, both objectively and subjectively. In arelated article, Taylor and coworkers21 presented a six-part evaluation model that assessesmultiple domains of the mentor-mentee relationship, including mentee training and
Lee et al. Page 7
Clin Transl Sci. Author manuscript; available in PMC 2013 October 01.
NIH
-PA Author Manuscript
NIH
-PA Author Manuscript
NIH
-PA Author Manuscript

empowerment, mentor training and peer learning, scholar advocacy, alignment ofexpectations, mentor self-reflection, and mentee evaluation of the mentor. In addition toproviding a list of characteristics and potential questions that could be included in aninstrument to address five mentoring domains, they also discussed potential barriers toevaluating the mentor-mentee relationship.
In an article describing a conceptual framework for mentorship at the institutional level,Keyser and colleagues22 outlined key domains necessary for effective research mentorship,including mentor selection criteria and incentives, facilitating the mentor-menteerelationship, strengthening the mentee’s capability to conduct responsible research, andprofessional development of both the mentor and mentee. They also provided a self-assessment tool to be used at the institutional or departmental level to conduct bothformative and summative evaluations of the policies and infrastructure of mentorshipprograms.
Collaboration and team science: Much attention has been devoted to encouragingbiomedical scientists to work in teams, both within and across disciplines. Given theemphasis of the CTSA program on consortium-based and collaborative initiatives, it isimportant to clarify attitudes toward collaboration and its perceived impact on career successin scholars and trainees participating in CTSA-based training programs.
The Cross-Disciplinary Collaborative Activities Scale23 is an instrument that has six itemsmeasuring the extent to which a respondent participates in cross-disciplinary collaborations.The scale was tested in an initial sample of 56 investigators participating in a NationalCancer Institute–funded study, the Transdisciplinary Research on Energetics and CancerInitiative. The scale demonstrated an internal reliability (alpha score) of 0.81.
A second tool that could be used to complement quantitative data on the number and type ofcollaborative activities is the Research Collaboration Scale used to evaluate collaborationwithin the Transdisciplinary Tobacco Use Research Center Program.24 This is a 23-item toolthat uses a 5-point Likert scale to measure respondents’ satisfaction with collaboration,perception of the impact of collaboration, and trust and respect for members of the researchteam. The scale was validated in a sample of 202 respondents, approximately half of whomwere investigators and the remainder of whom were students, staff, and others in theresearch center. The three factor structures were validated with Cronbach alpha scores of0.91 (satisfaction), 0.87 (impact), and 0.75 (trust and respect).
Used together, these tools may be valuable in comparing the extent of collaborativeactivities and the attitudes toward collaboration before and after participation in a specifictraining program.
Conflicting demands: It is not uncommon for clinical and translational scientists to havemultiple responsibilities that are juggled on a daily basis. In a highly demanding field suchas academic medicine, it is important to understand what these responsibilities are and theextent to which they ultimately affect career success. For example, noting what percentageof effort is dedicated to research versus other demands on time is an efficient way ofexploring what types of demands influence the progress of a scholar.
MULTIFACTOR MEASURES UNDER DEVELOPMENTInvestigators on national committees and at individual institutions are developing additionalmeasures and tools to gather data on factors associated with researchers’ training and
Lee et al. Page 8
Clin Transl Sci. Author manuscript; available in PMC 2013 October 01.
NIH
-PA Author Manuscript
NIH
-PA Author Manuscript
NIH
-PA Author Manuscript
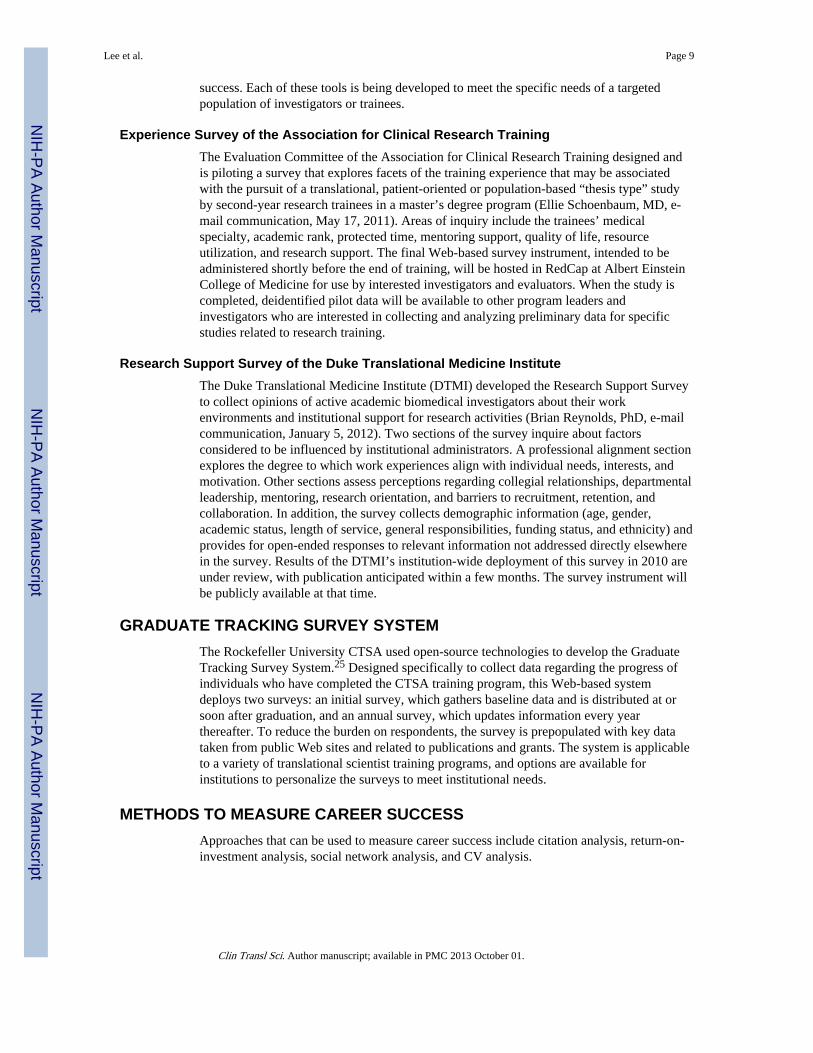
success. Each of these tools is being developed to meet the specific needs of a targetedpopulation of investigators or trainees.
Experience Survey of the Association for Clinical Research TrainingThe Evaluation Committee of the Association for Clinical Research Training designed andis piloting a survey that explores facets of the training experience that may be associatedwith the pursuit of a translational, patient-oriented or population-based “thesis type” studyby second-year research trainees in a master’s degree program (Ellie Schoenbaum, MD, e-mail communication, May 17, 2011). Areas of inquiry include the trainees’ medicalspecialty, academic rank, protected time, mentoring support, quality of life, resourceutilization, and research support. The final Web-based survey instrument, intended to beadministered shortly before the end of training, will be hosted in RedCap at Albert EinsteinCollege of Medicine for use by interested investigators and evaluators. When the study iscompleted, deidentified pilot data will be available to other program leaders andinvestigators who are interested in collecting and analyzing preliminary data for specificstudies related to research training.
Research Support Survey of the Duke Translational Medicine InstituteThe Duke Translational Medicine Institute (DTMI) developed the Research Support Surveyto collect opinions of active academic biomedical investigators about their workenvironments and institutional support for research activities (Brian Reynolds, PhD, e-mailcommunication, January 5, 2012). Two sections of the survey inquire about factorsconsidered to be influenced by institutional administrators. A professional alignment sectionexplores the degree to which work experiences align with individual needs, interests, andmotivation. Other sections assess perceptions regarding collegial relationships, departmentalleadership, mentoring, research orientation, and barriers to recruitment, retention, andcollaboration. In addition, the survey collects demographic information (age, gender,academic status, length of service, general responsibilities, funding status, and ethnicity) andprovides for open-ended responses to relevant information not addressed directly elsewherein the survey. Results of the DTMI’s institution-wide deployment of this survey in 2010 areunder review, with publication anticipated within a few months. The survey instrument willbe publicly available at that time.
GRADUATE TRACKING SURVEY SYSTEMThe Rockefeller University CTSA used open-source technologies to develop the GraduateTracking Survey System.25 Designed specifically to collect data regarding the progress ofindividuals who have completed the CTSA training program, this Web-based systemdeploys two surveys: an initial survey, which gathers baseline data and is distributed at orsoon after graduation, and an annual survey, which updates information every yearthereafter. To reduce the burden on respondents, the survey is prepopulated with key datataken from public Web sites and related to publications and grants. The system is applicableto a variety of translational scientist training programs, and options are available forinstitutions to personalize the surveys to meet institutional needs.
METHODS TO MEASURE CAREER SUCCESSApproaches that can be used to measure career success include citation analysis, return-on-investment analysis, social network analysis, and CV analysis.
Lee et al. Page 9
Clin Transl Sci. Author manuscript; available in PMC 2013 October 01.
NIH
-PA Author Manuscript
NIH
-PA Author Manuscript
NIH
-PA Author Manuscript

Citation AnalysisBibliometric tools can be used to facilitate evaluation of publication records as an indicatorof career success. For example, Hack and colleagues26 identified 737 leaders, innovators,pioneers, and role models in Canadian academic nursing programs from 33 institutions.They then used the search engine Scopus to retrieve each individual’s number of publishedarticles, number of first-authored published articles, and Scopus h-index score, as well as thenumber of citations to these articles that appeared to date in the literature. With this method,they were able to identify the top 20 nurses in Canada on the basis of the number of citationsthat all of their published articles and their first-authored articles received during theircareer.
Return-on-Investment AnalysisFor purposes of evaluation, return on investment (ROI) is generally referred to as the netgain from an investment and is typically calculated as: ROI = (Revenue − Cost) / Cost.
ROI can be calculated to answer different questions. For example, to determine the ROI ofCTSA education funding in terms of extramural funding received, evaluators start bytracking individual KL2 recipients by program type and determining who applied for andwho received funding. The evaluators then determine the amount of education funding, theduration of the appointment period (entry and end dates), and the total amount of direct costextramural funding that each individual received since entry into the KL2 program. Inaddition to determining the aggregate dollar amount, evaluators can determine the ROI ofthe program or the individual by comparing the total educational funding expended with theamount of extramural funding (direct costs only) received (i.e. extramural funding receivedminus educational funding expended, divided by educational funding). Alternatively, theycan determine the per dollar invested ROI by dividing the extramural funding by theeducational funding. The above methodologies can be applied to determine the impact ofpilot funding or to quantify all funding and services received by an individual (e.g., pilotfunding, consultation services) to calculate an aggregate amount of CTSA investment theyhave received. .
To better understand the results of ROI analysis, program evaluators should also track otherindicators of productivity of individual trainees over time. These data can be abstracted fromCVs obtained annually and may include current appointment, degrees received,presentations, publications, funding proposals, and receipt of awards. Along withdemographic data, these data should be entered into a database, then supplemented andverified with searches of PubMed, NIH Reporter, and internal grants management databases.To ensure a robust dataset, the same data should be collected from a comparison groupconsisting of other individuals who are early in their careers, such as those who applied forbut did not receive KL2 funding or those who matriculated into degree programs but did notreceive similar funding. The aggregated data can be used to compare the productivity ofindividual scholars or cohorts of scholars over time.
To ensure validity and to measure long-term outcomes, evaluators should use electronicdatabases to obtain and track individual data. Although this process is by nature labor-intensive, it may be the only reliable means to collect data once an individual has left theprogram or institution. Tracking external funding for predoctoral or dual-degree (e.g., MD/PhD) trainees may be challenging because the research careers of these trainees are delayedto allow for completion of degree and residency requirements. Thus, in the short term, itmay be more feasible to calculate the ROI for the KL2 trainees than for predoctoral andMD/PhD trainees. Unfortunately, some individuals from all programs may be lost to follow-up over time.
Lee et al. Page 10
Clin Transl Sci. Author manuscript; available in PMC 2013 October 01.
NIH
-PA Author Manuscript
NIH
-PA Author Manuscript
NIH
-PA Author Manuscript

Social Network AnalysisThe origins of social network analysis (SNA) lie in the study of whether and how anindividual’s actions are influenced by his or her place within a network.27 Originally appliedmainly to social sciences and the explanation of scientific questions, SNA is now beginningto be used to measure the activities of researchers and the changing interdisciplinarylandscape of biomedical research. SNA generates a description of the ways in which and theextent to which individuals, institutions, or other entities are connected. This information, incombination with other data such as academic productivity, may further elucidate factorscontributing to career success. Examples of how SNA has been applied in clinical andtranslational research include describing the collaboration patterns of researchers over time,the structure of interdisciplinary research teams, and the degree to which programs that aimto foster interdisciplinary research accomplish this goal.27
Curriculum Vitae AnalysisThe CV is a universally available record of professional accomplishment and is gainingincreased attention in research evaluation.28 Evaluators analyze CVs to study the careerpaths of scientists and engineers, researcher mobility, and faculty productivity andcollaboration.29–32 CV analysis yields rich data not otherwise obtainable; however,evaluators should be mindful of the labor-intensive nature of this method.
DISCUSSIONThis overview of metrics and evaluation tools associated with factors comprising thecomprehensive model for career success2 is intended to aid individual programs andinstitutions in assessing factors associated with the success of their research trainees and toinform the evaluation of the training programs themselves. The overview provides a clearconceptual and practical foundation for further identification and testing of measures andmethods related to the many factors that affect the career success of clinical and translationalscientists. Leaders and administrators of education and training programs often makeassumptions about the degree to which individual factors impact career success. Theycommonly assume, for example, that mentoring is critical to successful research careers. Yetempirical work examining the extent to which aspects of mentoring influence career successis limited. Measuring this factor and testing its relationship to specific elements of careersuccess can inform programs about the specific factors associated with mentoring thatshould be prioritized and incorporated into the education and training programs.
The model for career success can also be used to identify barriers to success. There isincreasing evidence, for example, for one phenomenon that many investigators have longbelieved to be true: that individuals from racial and ethnic minority groups have lesssuccessful academic careers. A commonly used indicator, promotion and tenure, hasconsistently shown that ethnic minorities—specifically, African Americans and Latinos—are considerably underrepresented in the tenured and full professor categories ofacademia.33–36 Recent findings published in Science by Ginther and colleagues37 indicatethat there are large racial disparities in the success rate for securing an NIH R01 award,which is the mark of an independent scientist and is often a necessary criterion forpromotion and tenure. There likely are multifactorial reasons, some extrinsic and someintrinsic, for these disparities. Use of the career success model and its associated measurescan be helpful in further exploring these factors and allowing training programs and theirhost institutions to identify and address specific barriers.
Application of the model and employment of selected measures can facilitate improvedinterpretation and understanding of program evaluations, particularly as they relate to
Lee et al. Page 11
Clin Transl Sci. Author manuscript; available in PMC 2013 October 01.
NIH
-PA Author Manuscript
NIH
-PA Author Manuscript
NIH
-PA Author Manuscript

different types of trainees. The clinical and translational research workforce consists ofinvestigators from various disciplines in the basic and clinical sciences. These investigatorscan be traced through three emphases within the scientific pipeline: PhD programs, dual-degree programs, and clinical degree programs (Figure).
Despite the fact that a substantial proportion of PhD faculty members in medical schoolshave primary appointments in clinical departments and are involved in clinical andtranslational research, PhD scientists have limited opportunities for clinically relevanttraining during their graduate and postdoctoral years. In contrast, clinician-scientists receiveextended education and training opportunities to acquire clinical knowledge, skills, andproficiency. Their predoctoral education may provide some research opportunities, but theysubsequently engage in a prolonged course of specialization in residency or fellowshiptraining to achieve certification and licensure as health care providers. While they may haveresearch opportunities during their advanced clinical training, their research experiences areoften time-limited and may not provide adequate preparation for success as an academicinvestigator. The challenges faced by individuals who pursue dual-degree programs aresimilar to those of the clinician-scientists and may be exacerbated by large periods of timewhen clinical training requirements prevent them from pursuing research.
Individuals in the three parts of the training pipeline generally share certain aspects oftraining, such as core courses, mentoring, and team science approaches, and have similarneeds related to career satisfaction and success. Yet research training programs vary in theextent of interaction with the different trainee types, and factors associated with success varywith the context, timeframe, and demands of particular trainees and situations.Understanding the similarities and differences in the training models may contribute to theinterpretation of evaluation results.
Our goals in providing information about the model and measures for evaluation are toencourage more consistent data collection across training sites, to foster more rigorous andsystematic exploration of factors associated with career success, and to help addresspreviously identified difficulties in program evaluation. It is our hope that future work willfocus on testing and adapting these measures to address specific questions and generateresults that are generalizable and will help inform future training programs.
AcknowledgmentsThis project has been funded in whole or in part with Federal funds from the National Center for ResearchResources and National Center for Advancing Translational Sciences (NCATS), National Institutes of Health(NIH), through the Clinical and Translational Science Awards Program (CTSA), part of the Roadmap Initiative,Re-Engineering the Clinical Research Enterprise. The manuscript was approved by the CTSA ConsortiumPublications Committee. The NCRR/NIH CTSA funding was awarded to Duke University School of Medicine(UL1RR024128), George Washington University/Children’s National (UL1RR031988/UL1TR000075), Universityof Cincinnati College of Medicine (UL1RR026314), University of Florida College of Medicine (UL1RR029890),University of Minnesota Medical School (UL1RR033183), University of New Mexico School of Medicine(UL1RR031977), University of North Carolina at Chapel Hill (UL1RR025747), University of Pittsburgh(UL1RR024153), University of Rochester (UL1RR024160), and University of Texas Health Science Center at SanAntonio (UL1RR025767). The contents of this article are solely the responsibility of the authors and do notnecessarily represent the official views of the NCRR, NCATS, or the NIH.
We thank all of the members of the Education/Career Development and Evaluation Key Function Committees ofthe CTSA Consortium and especially the members of the Education Evaluation Working Group who contributed tothis work. We are particularly grateful to Carol Merchant, M.D., of the NCRR, who initiated this working groupand provided continued support throughout the process.
Lee et al. Page 12
Clin Transl Sci. Author manuscript; available in PMC 2013 October 01.
NIH
-PA Author Manuscript
NIH
-PA Author Manuscript
NIH
-PA Author Manuscript

REFERENCES1. Clinical and Translational Science Awards Fact Sheet. [Accessed on January 4, 2012] https://
www.ctsacentral.org/documents/Communication_Toolkit/CTSA_FactSheet.pdf.
2. Rubio DM, Primack BA, Switzer GE, Bryce CL, Seltzer DL, Kapoor WN. A ComprehensiveCareer-Success Model for Physician-Scientists. Acad Med. 2011; 86(12):1571–1576. [PubMed:22030759]
3. Diener E, Emmons RA, Larsen RJ, Griffin S. The Satisfaction With Life Scale. J Pers Assess. 1985;49(1):71–75. [PubMed: 16367493]
4. Mohr DC, Burgess JF Jr. Job characteristics and job satisfaction among physicians involved withresearch in the Veterans Health Administration. Acad Med. 2011; 86(8):938–945. [PubMed:21694559]
5. Spector PE. Measurement of human service staff satisfaction: development of the Job SatisfactionSurvey. Am J Community Psychol. 1985; 13(6):693–713. [PubMed: 4083275]
6. Wright K, Rowitz L, Merkle A, Reid,WM, Robinson G, Herzog B, Weber D, Carmichael D,Balderson TR, Baker E. Competency development in public health leadership. Am J Public Health.2000; 90(8):1202–1207. [PubMed: 10936996]
7. Ammons-Stephens S, Cole HJ, Jenkins-Gibbs K, Riehle CF, Weare WH Jr. The development ofcore leadership competencies for the profession. Library Leadership & Management. 2009; 23(2):63–74.
8. Center for Creative Leadership. White Paper: Addressing the Leadership Gap in Health Care: whatis needed when it comes to leader talent?. Greensboro, NC:
9. Assessment Plus Inc.. Global Leader of the Future Inventory. Stone Mountain: AndersonConsulting, Georgia; 1999.
10. Turning Point National Program. Seattle, WA: University of Washington School of Public Healthand Community Medicine; Collaborative Leadership Self Assessment Questionnaires. Availableat: http://www.turningpointprogram.org/Pages/pdfs/lead_dev/CL_self-assessments_lores.pdf.
11. Amabile TM, Hill KG, Hennessey BA, Tighe EM. The Work Preference Inventory: Assessingintrinsic and extrinsic motivational orientations. J Pers Soc Psychol. 1994; 66(5):950–967.[PubMed: 8014837]
12. Duckworth AL, Peterson C, Matthews MD, Kelly DR. Grit: Perseverance and passion for long-term goals. J Pers Soc Psychol. 2007; 92(6):1087–1101. [PubMed: 17547490]
13. Mullikin EA, Bakken LL, Betz NE. Assessing research self-efficacy in physician-scientists: TheClinical Research Appraisal Inventory. J Career Assessment. 2007; 15(3):367–387.
14. Blackall GF, Melnick SA, Shoop GH, George J, Lerner SM, Wilson PK, Pees RC, Kreher M.Professionalism in medical education: the development and validation of a survey instrument toassess attitudes toward professionalism. Med Teach. 2007; 29(2–3):e58–e62. [PubMed: 17701611]
15. Rohland BM, Kruse GR, Rohrer JE. Validation of a single-item measure of burnout against theMaslach Burnout Inventory among physicians. Stress Health. 2004; 20(2):75–79.
16. Johnson MO, Subak LL, Brown JS, Lee KA, Feldman MD. An innovative program to train healthsciences researchers to be effective clinical and translational research mentors. Acad Med. 2010;85(3):484–489. [PubMed: 20182122]
17. Berk RA, Berg J, Mortimer R, Walton-Moss B, Yeo TP. Measuring the effectiveness of facultymentoring relationships. Acad Med. 2005; 80(1):66–71. [PubMed: 15618097]
18. Ragins BR, McFarlin DB. Perceptions of mentor roles in cross-gender mentoring relationships. JVocat Behav. 1990; 37(3):321–339.
19. Dilmore TC, Rubio DM, Cohen E, Seltzer D, Switzer GE, Bryce C, Primack B, Fine MJ, KapoorWN. Psychometric properties of the Mentor Role Instrument when used in an academic medicinesetting. Clin Transl Sci. 2010; 3(3):104–108. [PubMed: 20590679]
20. Meagher E, Taylor L, Probsfield J, Fleming M. Evaluating research mentors working in the area ofclinical translational science: a review of the literature. Clin Transl Sci. 2011; 4(5):353–358.[PubMed: 22029808]
21. Anderson L, Silet K, Fleming M. Evaluating and giving feedback to mentors: New evidence-basedapproaches. Clin Transl Sci. 2012; 5(1):71–77. [PubMed: 22376261]
Lee et al. Page 13
Clin Transl Sci. Author manuscript; available in PMC 2013 October 01.
NIH
-PA Author Manuscript
NIH
-PA Author Manuscript
NIH
-PA Author Manuscript

22. Keyser DJ, Lakoski JM, Lara-Cinisomo DJ, Schultz DJ, Williams VL, Zellers DF, Pincus HA.Advancing institutional efforts to support research mentorship: a conceptual framework and self-assessment tool. Acad Med. 2008; 83(3):217–225. [PubMed: 18316865]
23. Hall KL, Stokols D, Moser RP, Taylor BK, Thornquist MD, Nebeling LC, Ehret CC, Barnett MJ,McTiernan A, Berger NA, Goran MI, Jeffery RW. The collaboration readiness of transdisciplinaryresearch teams and centers: Findings from the National Cancer Institute's TREC Year-Oneevaluation study. Am J Prev Med. 2008; 35(2 Suppl):S161–S172. [PubMed: 18619396]
24. Masse LC, Moser RP, Stokols D, Taylor BK, Marcus SE, Morgan GD, Hall KL, Croyle RT,Trochim WM. Measuring collaboration and transdisciplinary integration in team science. Am JPrev Med. 2008; 35(2 Suppl):S151–S160. [PubMed: 18619395]
25. Romanick, M.; Lee, G.; Ng, K.; Coller, B. The Rockefeller University CTSA Graduate TrackingSystem Survey. Abstract to be presented at Translational Science 2012: Improving HealthThrough Research and Training; April 18–20, 2012; Washington, DC.
26. Hack TF, Crooks D, Plohman J, Kepron E. Research citation analysis of nursing academics inCanada: identifying success indicators. J Adv Nurs. 2010; 66(11):2542–2549. [PubMed:20735498]
27. Borgatti SP, Mehra A, Brass DJ, Labianca G. Network analysis in the social sciences. Science.2009; 323(5916):892–895. [PubMed: 19213908]
28. Canibano C, Bozeman B. Curriculum vitae method in science policy and research evaluation: thestate-of-the-art. Res Evaluat. 2009; 18(2):86–94.
29. Dietz JS, Chompalov I, Bozeman B, Lane EO, Park J. Using the curriculum vitae to study thecareer paths of scientists and engineers: An exploratory assessment. Scientometrics. 2000; 49(3):419–442.
30. Gaughan M, Bozeman B. Using curricula vitae to compare some impacts of NSF research grantswith research center funding. Res Eval. 2002; 11(1):17–26.
31. Gaughan M, Ponomariov B. Faculty publication productivity, collaboration, and grants velocity:using curricula vitae to compare center-affiliated and unaffiliated scientists. Res Eval. 2008; 17(2):103–110.
32. Woolley R, Turpin T. CV analysis as a complementary methodological approach: investigating themobility of Australian scientists. Res Eval. 2009; 18(2):143–151.
33. Blackwell LV, Snyder LA, Mavriplis C. Diverse faculty in STEM fields: Attitudes, performance,and fair treatment. J Divers High Educ. 2009; 2(4):195–205.
34. Daley S, Wingard DL, Reznik V. Improving the retention of underrepresented minority faculty inacademic medicine. J Natl Med Assoc. 2006; 98(9):1435–1440. [PubMed: 17019910]
35. Fang D, Moy E, Colburn L, Hurley J. Racial and ethnic disparities in faculty promotion inacademic medicine. JAMA. 2000; 284(9):1085–1092. [PubMed: 10974686]
36. Turner CSV, Gonzalez JC, Wood JL. Faculty of color in academe: What 20 years of literature tellsus. J Divers High Educ. 2008; 1(3):139–168.
37. Ginther DK, Schaffer WT, Schnell J, Masimore B, Liu F, Haak LL, Kington R. Race, ethnicity,and NIH research awards. Science. 2011; 333(6045):1015–1019. [PubMed: 21852498]
Lee et al. Page 14
Clin Transl Sci. Author manuscript; available in PMC 2013 October 01.
NIH
-PA Author Manuscript
NIH
-PA Author Manuscript
NIH
-PA Author Manuscript

Figure 1.Pipeline for junior clinical and translational scientists. Clinical and Translational ScienceAwards (CTSAs) support PhD training (TL1 programs) and junior faculty development(KL2 programs), highlighted in this diagram.
Lee et al. Page 15
Clin Transl Sci. Author manuscript; available in PMC 2013 October 01.
NIH
-PA Author Manuscript
NIH
-PA Author Manuscript
NIH
-PA Author Manuscript

NCATS Advisory Council
Working Group on the IOM Report:
The CTSA Program at NIH A Working Group of the NCATS Advisory Council to the Director
DRAFT REPORT
May 16, 2014


NCATS Advisory Council Working Group on the IOM Report: The CTSA Program at NIH
Draft Report Page i
WORKING GROUP MEMBERS Ronald J. Bartek, President/Director/Co-Founder, Friedreich’s Ataxia Research Alliance, Co-Chair
Mary L. (Nora) Disis, M.D., Professor, Department of Medicine, Division of Oncology, University of Washington School of Medicine, Co-Chair
Scott J. Weir, Pharm.D., Ph.D., Director, Institute for Advancing Medical Innovation, University of Kansas Cancer Center, Co-Chair
Ann C. Bonham, Ph.D., Chief Scientific Officer, Association of American Medical Colleges
Matthew Davis, M.D., M.P.P., Professor of Pediatrics and Communicable Diseases and Professor of Internal Medicine, Medical School, University of Michigan; Professor of Public Policy, Gerald R. Ford School of Public Policy, University of Michigan; Chief Medical Executive, Michigan Department of Community Health
David L. DeMets, Ph.D., Professor, Department of Biostatistics and Medical Informatics, University of Wisconsin
Gary H. Gibbons, M.D., Director, National Heart, Lung and Blood Institute, National Institutes of Health
Robert A. Harrington, M.D., Arthur L. Bloomfield Professor of Medicine and Chair, Department of Medicine, Stanford University
Philip L. Lee, J.D., M.P.M., President, Results Leadership Group
Lynn Marks, M.D., Senior Vice President, Projects, Clinical Platforms and Sciences, GlaxoSmithKline; Corporate Secretary and Chair of the Operations Committee, TransCelerate Biopharma
Sharon Milgram, Ph.D., Director, Office of Intramural Training and Education, National Institutes of Health
Louis J. Muglia, M.D., Ph.D., Co-Director, Perinatal Institute, Division of Neonatology; Director, Center for Prevention of Preterm Birth; Professor, University of Cincinnati Department of Pediatrics, Cincinnati Children’s Hospital
Fernando Pineda-Reyes, CEO and Founder, Community Research Education Awareness Results
Robert I. Tepper, M.D., Partner, Third Rock Ventures, LLC

NCATS Advisory Council Working Group on the IOM Report: The CTSA Program at NIH
Page ii Draft Report
ACKNOWLEDGMENTS This report has been prepared with input from many sources. We are deeply grateful to all who helped shape it.
First, to our colleagues and members of the Working Group, we express appreciation for the breadth and depth you brought to the project. Your range of experience and perspectives were indispensable to addressing the Institute of Medicine (IOM) Report recommendations.
An essential part of our deliberations flowed from the exceptional, in-depth review of the Clinical and Translational Science Awards program by the IOM committee. The superb work of the members and the many who participated in that process provided a rock-solid foundation for the Working Group deliberations.
This report draws on the experiences and insights of many, and we owe them our thanks for sharing their ideas, particularly the National Center for Advancing Translational Sciences (NCATS) leadership and staff, and members of the translational science community.
We want to especially thank all those who read this report in various drafts and gave us the benefit of their considered opinion and editorial judgments.
There are several people who played a special role in helping this report come to be.
We acknowledge Working Group member Phil Lee’s very special role in providing our introduction to the results-based accountability tool that guided our deliberations and in steering us through the process. His kind but forthright critiques and probing questions repeatedly improved this report.
We could not have had finer coordination and support. Thanks to Christine Cutillo for her unfailing competence, moral support and firm yet gracious reminders.
Elaine Collier provided her insight and counsel. Her efforts helped sustain the project’s progress from its inception to completion.
The project was managed under the caring and steadfast guidance of Cherie Nichols. Her creative ideas for content and process design, commitment of energy and sense of purpose expertly guided this process through its life cycles.
We also acknowledge our debt to NCATS leadership for encouraging the Working Group to make its own assessments, draw independent conclusions and express them in a report of its own creation.
Finally, to the men and women who have achieved remarkable progress to date and who are poised to advance translational science toward the goals outlined in this report, we extend our sincere thanks.
Ron Bartek, Nora Disis, Scott Weir Co-Chairs, NCATS Advisory Council Working Group on the IOM Report
NCATS Advisory Council Working Group on the IOM Report: The CTSA Program at NIH
Draft Report Page iii
CONTENTS Working Group Members ........................................................................................................................................ i
Acknowledgments .................................................................................................................................................. ii
Introduction ........................................................................................................................................................... 1
Strategic Goals ....................................................................................................................................................... 4
Workforce Development .................................................................................................................................... 4
Collaboration/Engagement ................................................................................................................................. 7
Integration ....................................................................................................................................................... 11
Methods/Processes .......................................................................................................................................... 14
Appendix A: Results-Based Accountability............................................................................................................. 17
Appendix B: Consolidated List of Positive/Negative Factors ................................................................................... 19
Appendix C: Working Group Timeline ................................................................................................................... 22


NCATS Advisory Council Working Group on the IOM Report: The CTSA Program at NIH
Draft Report Page 1
INTRODUCTION In the 21st century, scientists are poised to transform our understanding of the factors that contribute to exceptional health — or its decline — by turning discoveries made in the laboratory, the patient’s bedside and the community into effective health interventions through a process known as translation. Translational science is the field of investigation focused on understanding and addressing the scientific and organizational challenges underlying each step of the translational process. Basic scientists have made breathtaking advances in our understanding of the human body’s biology and physiology. Along the long and complex road from promise to impact, translational science works to improve the health of individuals and the public — from therapeutics to medical technologies to medical procedures to behavioral changes.
A top priority for the National Center for Advancing Translational Sciences (NCATS) is to accelerate the process of transforming discovery to application and to increase the rate of adoption. NCATS‘ Clinical and Translational Science Awards (CTSA) program is key to achieving that goal. This program supports a national consortium of medical research institutions that work together to improve how clinical and translational science is conducted nationwide. The institutions that participate in this program study the translational science process in great detail to iteratively develop and test methods that enhance bench-to-bedside and bedside-to-practice research. Each institutional CTSA functions as a living laboratory for the study of the translational science process. The CTSA program members create new knowledge, technologies, methods and policies to benefit the conduct of translational science across the nation. By redesigning and accelerating the process of translational science, as well as addressing present and potential future gaps in the translational continuum [Institute of Medicine (IOM) Report, page 20], new discoveries will reach patients and communities faster. Moreover, improving the quality of the translational science process will result in tangible health benefits for our nation and beyond.
NCATS is continuing to develop the CTSA program to meet the needs of clinical and translational investigators and the communities they serve. In June 2013, IOM issued a report of its findings following an in-depth review of the CTSA program. Its recommendations included formalizing and standardizing the evaluation processes for individual CTSA institutions and the program as a whole, advancing innovation in education and training programs, and ensuring community engagement in all phases of translation.
In November 2013, NCATS assembled a Working Group of council and non-council stakeholders who have extensive expertise in the subject areas addressed in the IOM Report, to provide guidance on programmatic changes needed to implement the report’s recommendations. The Advisory Council Working Group on the IOM Report on the CTSA program was charged to develop meaningful, measurable goals and outcomes for the CTSA program that speak to critical issues and opportunities across the full spectrum of clinical and translational sciences. [See operational phases of translational research (T1-T4) IOM Report, page 20] The Working Group deliberations took place from November 2013 to May 2014. The group met four times, including two face-to-face meetings in Bethesda. Their findings and conclusions comprise the content of this report.
To achieve the goals stated in this document, it clearly will be necessary to “strengthen NCATS’ leadership of the CTSA program,” as recommended in the IOM Report. [IOM Report, page 6] This strengthened leadership will be essential to the Center’s ability to evolve the CTSA program further into a fully collaborative, integrated network so as to catalyze the next generation of genuinely innovative technologies and methods. To succeed, NCATS will need flexibility in executing the vision for the CTSA program as well as enhanced collaboration within NIH and with translational science stakeholders outside the institutes.

NCATS Advisory Council Working Group on the IOM Report: The CTSA Program at NIH
Page 2 Draft Report
This report serves as a reference for developing strategies to strengthen the CTSA program and as a guide for measuring and reporting progress. Further, the report sets forth a framework within which translational science stakeholders can address some of the most perplexing challenges and emerging opportunities that hinder the translation of basic science discoveries into interventions that improve human health.
Overview of Process The IOM committee was asked to assess the CTSA program and its mission and strategic goals and to provide input on implementation of the program by NCATS to improve the efficiency and effectiveness of the CTSA program. [IOM Report, page 17] The committee’s report, released in June 2013, identified seven recommendations, of which the Working Group was charged to consider the following four:
• Formalize and standardize evaluation processes. • Advance innovation in education and training programs. • Ensure community engagement in all phases of research. • Strengthen clinical and translational science relevant to child health.
The remaining three IOM committee recommendations — strengthen leadership of the CTSA program, reconfigure and streamline the CTSA consortium, and build on the strengths of the individual CTSAs across the spectrum of research — are being addressed internally by NCATS staff.
Figure 1. Process for implementing IOM recommendations. Shown in the blue squares is the Working Group (WG) process. Purple boxes represent the future work of NCATS in considering the recommendations and the way forward.
Figure 1 outlines the approach NCATS took in considering the IOM recommendations. The following discussion topics were addressed at the first Working Group face-to-face meeting:
• Training and education • Collaboration and partnerships • Community engagement of all stakeholders • Academic environment for translational sciences • Translational sciences across the lifespan and unique populations • Resources • Pilot projects
The Working Group decided that the last two topics, resources and pilot projects, were program-level concerns and should be addressed by NCATS. However, both the Working Group and NCATS leadership acknowledged that much of the work done by the Working Group will influence subsequent development in these topic areas.

NCATS Advisory Council Working Group on the IOM Report: The CTSA Program at NIH
Draft Report Page 3
The five topic areas of focus for the Working Group were further refined into four Strategic Goals that broadly capture the selected IOM Report recommendations. These Strategic Goals were considered in detail by the Working Group.
Workforce Development Goal: The translational science workforce has the skills and knowledge necessary to advance translation of discoveries. This goal focuses on:
• Building an environment that supports and values translational science as “the place to go” for those who want to pursue high-impact careers in health sciences.
• Training and educating a world-leading, continuously learning workforce. • Developing a translational science workforce that can meet the needs of today and tomorrow.
Collaboration/Engagement Goal: Stakeholders are engaged in collaborations to advance translation. This goal focuses on:
• Engaging stakeholder communities so they contribute meaningfully across the translational sciences spectrum.
• Enabling team science to become a major academic model. • Ensuring that all translational science is performed in the context of collaborative team science and that
shared leadership roles are the norm throughout the entire translational science process.
Integration Goal: Translational science is integrated across its multiple phases and disciplines within complex populations and across the individual lifespan. This goal focuses on:
• Integrating translational science across the entire lifespan to attain improvements in health for all. • Launching efforts to study special population differences in the progress and treatment of disease processes. • Developing a seamless integrated approach to translational science across all phases of research.
Methods/Processes Goal: The scientific study of the process of conducting translational science itself enables significant advances in translation. This goal focuses on:
• Enabling CTSA programs to function individually and together as a research engine transforming the way translational science is conducted across the nation to make tangible improvements in the health of individuals and the population.
• Rapidly translating CTSA-generated new knowledge and technologies into health interventions in real world settings.
• Developing technologies, methods, data, analytics and resources that change the way translational scientists approach their work.
• Generating and curating comprehensive data sets or other resources that catalyze science.
These overarching and overlapping Strategic Goals provided the foundation for deliberation at the second face-to-face meeting. Using the Results-Based Accountability process (see Appendix A for a description of this process), the Working Group determined the factors that impede or advance progress toward achieving each Strategic Goal. Based on these factors, the Working Group identified measurable objectives that could be undertaken by NCATS.

NCATS Advisory Council Working Group on the IOM Report: The CTSA Program at NIH
Page 4 Draft Report
STRATEGIC GOAL
Workforce Development: The translational science workforce has the skills and knowledge necessary to advance translation of discoveries.
Introduction The IOM Report notes: “The health needs of the nation call for a generation of scientists trained in ‘interdisciplinary, transformative translational research’ and in the leadership and team skills to engage in effective collaborative partnerships.” [IOM Report, page 105]
There have already been great strides in translational science workforce development. The field of translational science is growing worldwide and the demand for trained professionals who specialize in translational science is high, not only in industry, but also in academia, government and disease philanthropy organizations. Seasoned and newly educated professionals are seeking translational science educational opportunities, and there is growing recognition of translational sciences as a legitimate, highly valued career path.
The development of components of training and education, such as core competencies and standards, needs to be balanced with flexibility for individual needs and a focus on innovative learning approaches. The traditional benchmarks for academic promotion and advancement — publications, peer-reviewed research funding and teaching — need to be revised and harmonized with new benchmarks that value team-based efforts and collaborative approaches to translational science. Success in translational science will require multidisciplinary and, in many cases, multiorganizational teams. Industry recognized this importance decades ago. Educational opportunities must be provided to all members of the team to advance translational science goals. Thus, in addition to sustaining and building on graduate and postdoctoral education, further work is needed to expand training and continuing education opportunities for faculty, professional staff and community partners.
Where We Are Now (Positive/Negative Factors)
Workforce Development
Positive Factors Negative Factors
A significant number of interested young people want to engage in translational science (TS).
There is no clear funding strategy for TS workforce development.
The worldwide demand is increasing for TS professionals with many career opportunities in academia, government, industry, non-profits, etc.
There is no collective strategy for developing a TS workforce.
Potential partners and collaborators are ready, willing and able to be engaged in TS projects.
There is a fear of putting one’s career at risk; that is, that one would not grow as an academician in a TS career pathway.
Industry has demonstrated the value of multidisciplinary teams in driving TS within their organizations. This knowledge can be utilized.
TS workforce team members other than the principal investigator (PI) or M.D. (e.g., nurses, community members) do not feel their role or value is considered as legitimate as that of the PI or M.D.

NCATS Advisory Council Working Group on the IOM Report: The CTSA Program at NIH
Draft Report Page 5
New disciplines are forming such as “regulatory science” or “team science,” which offer novel career pathways.
TS is an early science with many moving parts; curriculum is still too general, which makes it harder to be a legitimate discipline.
The diversity of career pathways in TS is appealing and offers unique opportunities for cutting edge research.
Career pathways are not as clear as with other more established disciplines.
There is an increasing demand among researchers for building skills/competencies in TS.
Skills and competency models are not defined.
There has been a great deal of progress in CTSAs to develop TS training programs and career paths.
Creation and implementation of TS workforce development strategies do not usually involve key stakeholders outside of academia (e.g., community health workers).
Technology can enable global networks of educational resources.
Traditional methods of learning, such as classroom didactics, may not fit all educational needs of TS.
The time is right and demand is high for novel curriculum development for TS.
Academic institutions lack the necessary leadership to establish the importance of TS.
Where We Need To Be — What Does Success Look Like? If a successful translational science workforce is developed, we will have demonstrable evidence of numerous discoveries being translated to patients and the community. Worldwide, translational science will be viewed as “the place to go” by those who want to pursue high-impact careers in health sciences. The U.S. and global community will value translational science and provide a supportive environment for its conduct. A well-qualified translational science workforce will meet the recognized needs of today and the emerging needs of tomorrow, and will shape the vision for the future. Achieving success will require that:
• The translational science “workforce” is broadly defined and includes researchers, clinicians, practitioners, patients, patient advocacy organizations, industry and community members.
• Curriculum is developed to train a world-leading, globally connected, continually learning workforce with the skills needed to excel in translational science.
• Translational science training draws from sources outside the academic arena (e.g., from industry and non-profit sectors).
• The subdisciplines within translational science are well defined. • The steps to advancement within each translational science subdiscipline are well defined. • Resources are available for the research and development of needed educational competency models in
each translational science subdiscipline, as well as the tools and methods needed to develop those competencies so that education constantly evolves.
• The needs of the translational science workforce are identified and forecast.
Measurable Objectives 1. Core competencies for a translational science workforce and the methods for evaluating those
competencies are defined.
• Skills and competency models are created. • Information on skills and competencies are broadly and readily available. • Effective practices are shared and adopted in a continuously learning environment. • Core competencies are developed for, and with the involvement of, all stakeholders.

NCATS Advisory Council Working Group on the IOM Report: The CTSA Program at NIH
Page 6 Draft Report
2. Translational science is a fully developed, highly valued and rewarding discipline with formal career pathways.
• Translational science organizational units are established at academic health centers. These translational science organizational units hold the same stature as traditional biomedical research departments (e.g., anatomy) yet engage all disciplines in team science.
• There is a national strategy for developing a translational science workforce that has been developed collaboratively with the involvement of all stakeholders.
• There is a defined educational pathway for translational science specialties that enables focused preparation to begin at the undergraduate level.
• The workforce is broadly trained across the full spectrum of translational science, regardless of the specific specialization of an individual translational scientist.
• The systems for staff development and faculty promotion at academic health centers recognize and reward the collaborative nature of translational science.
• Mentoring programs are established, evaluated and made widely available.
3. Translational science is conducted by interdisciplinary teams for optimal impact.
• There are means to define, recognize and reward the contributions of all team members regardless of role or degree.
• Sustainable partnerships are the norm. • Reward systems are built around team science metrics. • Individual team members are valued and have clear career paths. • The translational workforce is trained in the core competencies of collaboration/engagement.
4. Core competencies are available to all members of the workforce through vehicles for learning that are readily accessible and flexible.
• Degree programs in translational science are widely available. • Certificate programs in subdisciplines of translational science are widely available. • Ongoing continuing translational science educational programs exist at sites where translational
science is performed. • Criteria for translational science competence have been defined and evaluation of that
competence can be documented. • Quality programs for translational science are operating at all institutions involved in the
discipline.
5. Training curricula on effective teams, high-performing organizations and productive collaborations are developed, made broadly available and viewed as a core element of success. For example, training is available on how to create effective and streamlined collaborative processes.

NCATS Advisory Council Working Group on the IOM Report: The CTSA Program at NIH
Draft Report Page 7
STRATEGIC GOAL
Collaboration/Engagement: Stakeholders are engaged in collaborations to advance translation.
Introduction Translational science is complex and multifaceted. Discovering the means to accelerate it will require a collaborative approach to projects and the ability to build effective teams. The benefits of collaboration and engagement are numerous and can lead to a more robust translational science enterprise, stronger community support and funding, and the attraction of young people to careers in translational research. [IOM Report, page 117] In addition, diverse collaborations can lead to greater innovation. Finding solutions and demonstrating the ability to adopt those solutions widely requires multidisciplinary teams representing multiple partners. Further, the extent and strength of the partnerships and collaborations that are formed will determine the speed with which benefits to the nation’s health can be realized.
Within the CTSA program, collaborative partnerships are often limited to academic and industry collaborators with select interactions from the community. This is not sufficient. There is a need for extensive integration with collaborators outside academic institutions. There are a host of individuals, teams and networks of volunteers (citizen scientists) who are eager to help. These stakeholders provide unique and valuable viewpoints — regardless of whether those individuals are patients or members of foundations, community programs, governmental agencies, community health practices, non-profit organizations or other entities. These invaluable community participants must be thoughtfully included in key partnerships to accelerate health discovery.
Despite the recognized need and strong support for collaboration as a concept, effective collaborations and partnerships are often hard to come by. The resources and infrastructure to support them are frequently lacking. There is a great need for scientific approaches to the definition and maintenance of successful collaborations.
Translational science is a team-based endeavor. To accelerate the field, we must know how to build effective teams, form effective partnerships and overcome barriers. We need to address issues related to trust and respect, and clearly define the benefits and value of collaborative partners and meaningful roles. We must overcome the challenges to collaboration that exist within academic cultures, and provide clear expectations for protocols of engagements, training and education for partners and collaborators, and assessment measures. Successful collaboration models need to be actively disseminated. The creation of new knowledge often does not on its own lead to widespread implementation or impacts on health. Collaboration and partnerships with key stakeholders are essential to transforming research findings into changes in health care practice and policy.

NCATS Advisory Council Working Group on the IOM Report: The CTSA Program at NIH
Page 8 Draft Report
Where We Are Now (Positive/Negative Factors)
Collaboration/Engagement
Positive Factors Negative Factors
There has already been progress in collaborations with industry, other CTSAs, non-CTSAs, and the community. The “glass is half full.” TS scientists have a common end goal: to cure human disease, enhance health, lengthen life and reduce illness and disability.
Many ideas and research interests are tangential rather than central to the health and research interests of the community.
Scientists already are forming interdisciplinary research teams and collaborations with community, industry and other partners as strategies for more efficient and effective research.
The current system (structure, hierarchy) is not built for the “science of engagement.” Rather, engagement is viewed as a service to the community instead of a part of the research activity.
Collaboration combines and leverages the resources that each partner brings to the table, including funds, ideas and talent. There are examples of academic institutions developing criteria to reward collaboration.
The current structure facilitates grant-initiated research; the grant recipient calls the shots and little is generated by the community.
Some successful models for collaborative TS exist, including practice-based research networks and community-based participatory research partnerships.
In general, the rewards system is not aligned with TS, whether it is money, promotion, tenure, a sense of belonging, or a sense of respect.
There are excellent examples of different scientific approaches to the study of collaboration in industry, academia and transformative scientific endeavors (e.g., space missions).
TS capacity building and infrastructure support is needed to enable patient advocates and community members to participate fully as partners.
The CTSA program has attempted in a systemic way to engage the public in the process of translational sciences.
We do not teach collaboration as well as we could, and many collaborations fail.
Diversity of skills, experiences and backgrounds enhances performance of teams and organizations.
We encourage competition rather than collaboration, from science fairs to graduate school; it is part of the culture.
High performing teams are based on trust, diversity and collaboration.
There is a lack of understanding about what each party can bring to the table.
Diverse teams are often the most innovative. Collaborations take a lot of time and must begin with creating a trusting partnership.
There is a growing group of patient advocates and community members who are eager to participate as partners in TS. Many people embrace the concept of “citizen scientist.”
The practice of community engagement in TS is often limited to community outreach for recruitment of study participants, particularly minority populations.
There are many roadblocks to collaboration across sectors and across the entire TS spectrum.

NCATS Advisory Council Working Group on the IOM Report: The CTSA Program at NIH
Draft Report Page 9
Where We Need To Be — What Does Success Look Like? If collaborative team science becomes the norm rather than the exception, we will see diverse stakeholders engaged as full partners in translational science and involved in shared leadership roles throughout the entire research process. Team science rather than the “single principal investigator” will become the major academic model. Translational science will serve as the model for research collaboration and engagement. Community engagement will be acknowledged as an essential ingredient of translational science. With stable, functioning, diverse teams in place, the CTSA programs could study the impact of collaboration models on the acceleration of translational research. Achieving success will require that:
• Translational scientists are aligned toward a common goal: to cure human disease, enhance health, lengthen life and reduce illness and disability.
• The role and function of the CTSA program is clear to all potential collaborators. • Communities involved in all aspects of the translational science spectrum contribute to the development
of all aspects of translational sciences. • Translational science is governed by collaborations and partnerships that reward all stakeholders,
including researchers, patients and the community. • Government funding agencies, such as NIH, routinely collaborate in translational science initiatives and
effectively engage other federal agencies, industry, academia and philanthropic organizations as partners. • The value of collaboration is enhanced while the cost and difficulties of collaboration are reduced by
methodologies and approaches emanating from CTSA programs. • Collaboration to accelerate translational science extends beyond U.S. borders. • Patient advocates, community members and citizen scientists have the capacity and infrastructure in
place to participate fully as partners in all phases of translational science. • All stakeholders are respected, valued and rewarded for their time and expertise. • We can measure the impact of the collaborative culture change on translational science.
Measureable Objectives 1. Methods, processes and systems are developed and utilized to identify and effectively engage relevant
and diverse stakeholders across the translation spectrum.
• Developed methods are adopted broadly. • Approaches studied rigorously add valuable insights and information, regardless of whether they
succeed or fail. • Both positive and negative results are widely disseminated through suitable means of
communication.
2. Methods, processes and systems for collaborating are innovative and evolve to meet the needs of the translational science field.
• Novel methodologies, study design and technologies are developed and tested. • The existing barriers to effective collaborations are reduced.
3. Each partner within a diverse translational science team has the capacity and infrastructure support to be both a collaborator and to lead collaborations as complex translational science projects evolve.
• Project roles are clearly defined. • Leadership values diverse expertise. • Institutions demonstrate their support for establishing, maintaining and expanding
collaborations and partnerships.
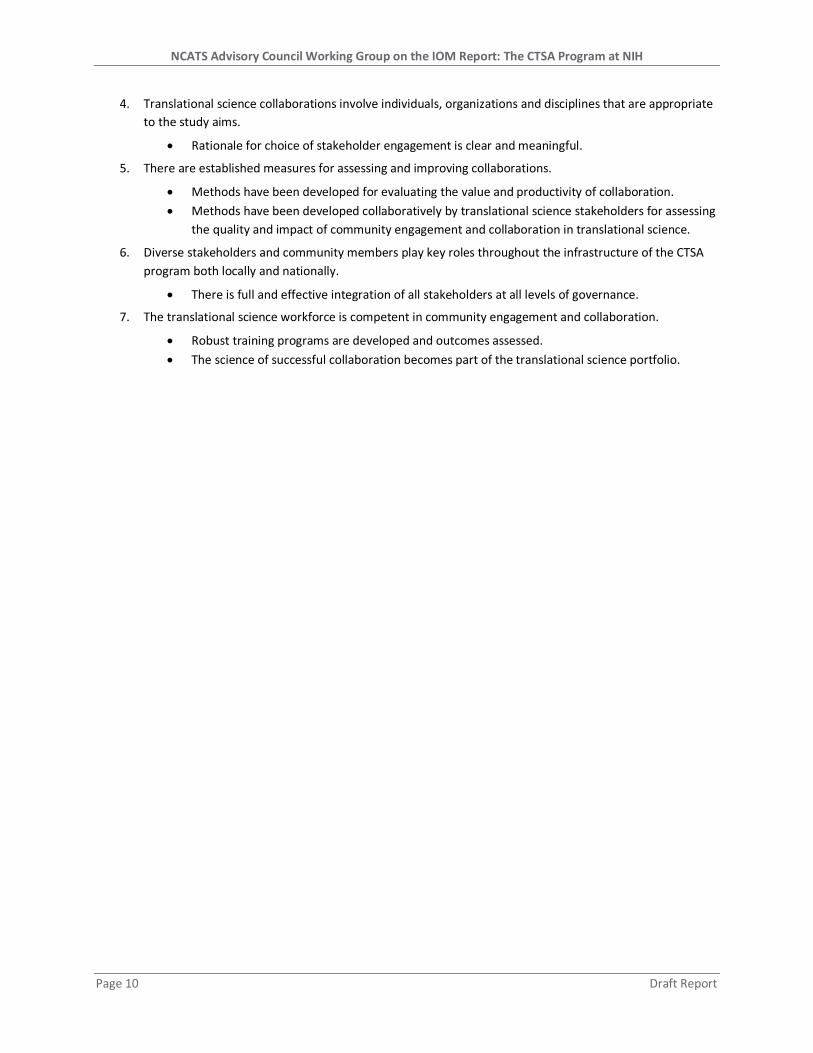
NCATS Advisory Council Working Group on the IOM Report: The CTSA Program at NIH
Page 10 Draft Report
4. Translational science collaborations involve individuals, organizations and disciplines that are appropriate to the study aims.
• Rationale for choice of stakeholder engagement is clear and meaningful.
5. There are established measures for assessing and improving collaborations.
• Methods have been developed for evaluating the value and productivity of collaboration. • Methods have been developed collaboratively by translational science stakeholders for assessing
the quality and impact of community engagement and collaboration in translational science.
6. Diverse stakeholders and community members play key roles throughout the infrastructure of the CTSA program both locally and nationally.
• There is full and effective integration of all stakeholders at all levels of governance.
7. The translational science workforce is competent in community engagement and collaboration.
• Robust training programs are developed and outcomes assessed. • The science of successful collaboration becomes part of the translational science portfolio.

NCATS Advisory Council Working Group on the IOM Report: The CTSA Program at NIH
Draft Report Page 11
STRATEGIC GOAL
Integration: Translational science is integrated across its multiple phases and disciplines within complex populations and across the individual lifespan.
Introduction Focusing on “science that works” will refine our understanding of the interplay of biological processes, lifestyle changes, environmental exposures, disease prevention, and behavior modifications so that the greatest health impact can be achieved with the greatest efficiency. Translational science will be needed to directly impact the integration of evidence-based interventions into practice settings. A systems approach will capture critical interrelationships that fragmented or narrower approaches miss.
Ensuring that breakthroughs in science become breakthroughs for people depends on our ability to explore and adapt to the changing landscape — both inside and outside the lab. In the 21st century, health will be determined by societal trends as it never has before. People are living longer, providing unprecedented opportunities to study interventions across the lifespan from many angles. For example, the number of adult survivors of childhood illness will rise dramatically, underscoring the need for research that specifically assesses the impact on adults with chronic health conditions that originated in childhood. We need proactive identification of better strategies during childhood for prevention of the disease or the complications of disease treatments. Consider sickle cell disease. Thirty or 40 years ago, the majority of patients died during childhood. Now, thanks to advances in care, patients with sickle cell disease live long enough to reach older adulthood. Although researchers and doctors have come a long way in understanding the disease and providing screening and treatment for children, adults with the condition still face many challenges, including misperceptions and a lack of access to proper care. In another example, acute lymphocytic leukemia (ALL) now has a 5-year survival rate of more than 90 percent. As pediatric ALL patients become adults, they experience new health issues in adulthood that are tied to cancer treatment. A good model of the iterative cycles of the improvement that can result from lifespan research is the collection of these emerging health issues in adulthood, coupled with development of effective new therapies in childhood that are less debilitating in the long term.
Furthermore, within the next 5 years, the number of adults aged 65 and older will outnumber children under the age of 5. By 2050, these older adults will outnumber all children under the age of 14. By the same year, the number of adults aged 80 and older will quadruple. [World Health Organization] This longer lifespan has implications for the progression of chronic diseases. Translational studies will be needed to uncover the interrelationships of disease with environmental exposures, health-related behaviors, and social factors across the lifespan. Heightened attention is needed for preventive strategies during pregnancy, childhood and early adulthood to improve health in older adults. In addition to differences for individuals across the lifespan, huge differences among populations also can affect health outcomes. These special populations (e.g., racial, ethnic, and gender-specific) are poised to benefit most from translational science, yet are rarely ever a focus of study. The role of translational science is critical to understanding the causes of these disparities; how they relate to social, economic and health system factors; and how evidenced-based interventions can be implemented.
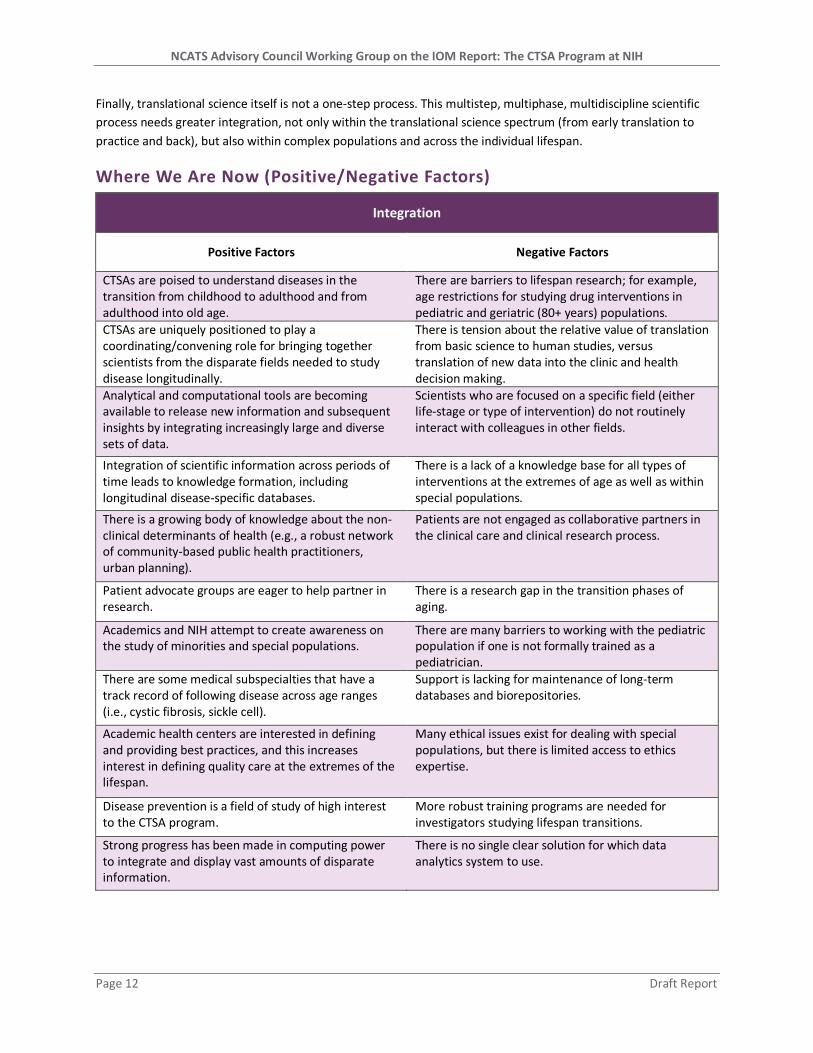
NCATS Advisory Council Working Group on the IOM Report: The CTSA Program at NIH
Page 12 Draft Report
Finally, translational science itself is not a one-step process. This multistep, multiphase, multidiscipline scientific process needs greater integration, not only within the translational science spectrum (from early translation to practice and back), but also within complex populations and across the individual lifespan.
Where We Are Now (Positive/Negative Factors)
Integration
Positive Factors Negative Factors
CTSAs are poised to understand diseases in the transition from childhood to adulthood and from adulthood into old age.
There are barriers to lifespan research; for example, age restrictions for studying drug interventions in pediatric and geriatric (80+ years) populations.
CTSAs are uniquely positioned to play a coordinating/convening role for bringing together scientists from the disparate fields needed to study disease longitudinally.
There is tension about the relative value of translation from basic science to human studies, versus translation of new data into the clinic and health decision making.
Analytical and computational tools are becoming available to release new information and subsequent insights by integrating increasingly large and diverse sets of data.
Scientists who are focused on a specific field (either life-stage or type of intervention) do not routinely interact with colleagues in other fields.
Integration of scientific information across periods of time leads to knowledge formation, including longitudinal disease-specific databases.
There is a lack of a knowledge base for all types of interventions at the extremes of age as well as within special populations.
There is a growing body of knowledge about the non-clinical determinants of health (e.g., a robust network of community-based public health practitioners, urban planning).
Patients are not engaged as collaborative partners in the clinical care and clinical research process.
Patient advocate groups are eager to help partner in research.
There is a research gap in the transition phases of aging.
Academics and NIH attempt to create awareness on the study of minorities and special populations.
There are many barriers to working with the pediatric population if one is not formally trained as a pediatrician.
There are some medical subspecialties that have a track record of following disease across age ranges (i.e., cystic fibrosis, sickle cell).
Support is lacking for maintenance of long-term databases and biorepositories.
Academic health centers are interested in defining and providing best practices, and this increases interest in defining quality care at the extremes of the lifespan.
Many ethical issues exist for dealing with special populations, but there is limited access to ethics expertise.
Disease prevention is a field of study of high interest to the CTSA program.
More robust training programs are needed for investigators studying lifespan transitions.
Strong progress has been made in computing power to integrate and display vast amounts of disparate information.
There is no single clear solution for which data analytics system to use.
NCATS Advisory Council Working Group on the IOM Report: The CTSA Program at NIH
Draft Report Page 13
Where We Need To Be — What Does Success Look Like? If successful, translational science always will include integration across the entire lifespan; the highest level of health for all people, regardless of age, will be attainable. If translational science always includes efforts to study special populations, differences in the progress and treatments of disease processes will be identified. We will have a seamless, integrated approach to translational science across all phases of research. Success is achieved when:
• Translational science efforts lead to quantifiable improvements to the health, health care outcomes and quality of life for people living with chronic disease and for racial, ethnic and underserved populations.
• Laboratory and clinical advances are translated rapidly into lifesaving and life-prolonging interventions in both the young and elderly, without unnecessary delay.
• Expertise, scientific data and technologies are shared to broaden the impact and enhance productivity of translational science across the lifespan.
• New models (including regulatory, ethical or policy considerations) exist that include all patients in biomedical research.
• Opportunities to prevent, postpone the onset or otherwise alter the natural history of acute and chronic conditions through interventions early in the life course are examined by translational scientists.
• Data across the full lifespan are integrated, analyzed, displayed and exploited as relating to translational science.
• Translational research on health conditions that are specific to different life stages (childhood, adolescence, early adulthood, reproductive ages, pregnancy, and older adulthood) are emphasized.
• Mechanisms are in place to ensure that interventions reach the patients who need them the most.
Measureable Objectives 1. Translational science addresses special populations (e.g., children, the elderly, Latinos, African-Americans)
and all transitions across the lifespan.
• Interventions and devices are developed for population-specific needs. • Participant risk in translational sciences is managed appropriately for all populations (e.g.,
pediatrics, geriatrics). • All populations are welcome to participate in translational science.
2. Translational science addresses all types of interventions (e.g., devices, medical procedures, behavioral changes, non-clinical determinants of health) in all populations.
3. Translational science is integrated from basic research to clinical to care implementation and to populations across the spectrum of the lifespan.
• Clinical research objectives are aligned with clinical care. • Academic medical centers embrace translational research as a critical part of their clinical care
mission. • Translational science enhances patient outcomes by understanding and improving medical care
compliance and adherence to treatment plans.
4. Translational scientists integrate the entire translational science spectrum into how they conceptualize and implement their research for patients throughout the lifespan.
5. The methods that influence the integration of evidence-based interventions into practice settings (i.e., implementation science) become fully realized across the lifespan and for all populations, especially those experiencing health disparities.

NCATS Advisory Council Working Group on the IOM Report: The CTSA Program at NIH
Page 14 Draft Report
STRATEGIC GOAL
Methods/Processes: The scientific study of the process of conducting translational science itself enables significant advances in translation.
Introduction The rapid pace of breakthrough discoveries is transforming our world — from developing new tools for genome surgery, to making organs from stem cells and designing electronic sensors to work inside the body. Technological advances and unprecedented scientific opportunities that exist right now are prompting a cascade of new insights that will change not only the way we do translation but also the way we think about it.
In almost one decade, we have gone from completion of the first human genome sequence to being able to sequence more than 1,000 human genomes for a single study. In the span of a few years, we have developed increasingly faster sequencing techniques to help identify the genes that cause diseases and, in turn, generated discoveries leading to better interventions. Personalized medicine now makes it possible for people to find out, with just a cheek swab, their own genetic risk for disease.
International collaborations are creating the most complete inventory ever assembled of the millions of variations among people’s DNA sequences. And just months ago, in a defining moment for science and technology, researchers built a synthetic genome and used it to transform the identity of a bacterium’s DNA so that it produced a new set of proteins. In the future, researchers envision synthetic genomes that are custom-built to generate biofuels, pharmaceuticals or other useful chemicals.
Some of the most promising medical advances come from the field of stem cell research. For example, scientists can grow human stem cells into tiny “organoids” — such as pituitary glands, livers and even rudimentary human eyes — in the lab. A research team has grown a brain organoid that develops various discrete, although interdependent, brain regions. These so-called “cerebral organoids” have the tissue and structure that mimic the anatomy of the early developing human brain. They offer researchers an unprecedented view of human brain anatomy that, in turn, could help scientists better understand conditions such as autism and schizophrenia, which have been linked to problems in brain development.
Given these young and relatively uncharted territories, scientists often must develop every step of the process — from testing in animals to manufacturing the cells to meet the required clinical grade standard. They must obtain ethical and regulatory approval and evaluate safety and efficacy. In the drive to rapidly move discoveries such as the genomics and stem cell examples described above to patients and the community, we must reimagine the way we do translational science. This is the role of the CTSA program.
The translational science process is complex, dynamic and frequently non-linear — just like the factors that influence health or its decline. The usual sequential step-by-step style of academic research often is not a good fit. To advance, translational science must evolve from the sequential to the parallel; from linear to bidirectional; from single discipline to multidiscipline; from single institutions to collaborative, integrated networks of institutions; and from investigator-initiated to stakeholder-driven processes. Translational science must adhere to high quality methods and processes, and must use and advocate for models that are clearly reliable, reproducible, and ultimately validated in humans. Translational science must be conducted in structures that are much flatter, more cooperative and more process-oriented, with a focus on teams and collaborations. New technologies, approaches, methods and policies must be developed to speed tangible improvements to human health.

NCATS Advisory Council Working Group on the IOM Report: The CTSA Program at NIH
Draft Report Page 15
To accomplish this, the CTSA program must focus on redesigning the way translational science is conducted. Such a redesign will require “a more centralized approach to leadership, one in which NCATS plays a much more active role.” [IOM Report, page 5] To be effective in the strengthened leadership role recommended in the IOM Report, NCATS will need sufficient flexibility in applying its resources and increased prerogative in identifying and supporting genuinely innovative, transformative translational science projects at CTSA sites. The Center also will need enhanced collaboration and partnership with the translational science programs of the NIH Institutes as well as with stakeholders outside NIH.
Where We Are Now (Positive/Negative Factors)
Methods/Processes
Positive Factors Negative Factors
Standardization of methods and processes frees investigators to focus on innovation.
There are no established standards in TS for performance measures to gauge, for example, the achievement of research objectives or the efficiency and timeliness of the research process.
Effective processes enhance productivity while minimizing waste.
There is no standardization or harmonization of information among CTSA sites.
Reproducibility and validation of science is enhanced by high-quality methods and processes.
Regulatory science competencies of researchers are not standardized, are inconsistent, or are not strong.
There is recognition of the need to change methodologies to advance TS.
A regulatory pathway for emerging technologies does not exist (e.g., for regenerative medicine).
There are examples of applications of business methodology to address TS.
There is no clear funding strategy for studying method development or process improvement in TS.
There is interest in driving new technologies to the clinic.
TS processes are slow and cumbersome and often were designed without the investigator or the patient in mind.
CTSAs have access to the diverse expertise needed to redesign the TS enterprise.
Historically, CTSAs have not had a strong focus on the “science of translational science.” This should be a main goal.
Novel methodologies and processes have come from the CTSA program.
“Out of the box” thinking or solutions often are met with skepticism.
CTSAs now have the flexibility to focus on new areas of science.
Effective methods for dissemination of novel technologies, methods or practices are not readily available.
Academia is often the birthplace of new disciplines, and CTSAs can be involved at the onset in determining what is needed to move emerging fields forward.
Many major improvements to the TS structure will require redesign of resources outside the control of CTSAs (i.e., technology transfer or institutional review board offices).

NCATS Advisory Council Working Group on the IOM Report: The CTSA Program at NIH
Page 16 Draft Report
Where We Need To Be — What Does Success Look Like? We will have achieved success when the CTSA programs function individually and together as a research engine that transforms the way translational science is conducted across the nation. The programs will routinely establish new scientific fields or paradigms, develop technologies and methods that change the way scientists approach their work, and generate and curate comprehensive data sets or other resources that catalyze science. CTSA-generated new knowledge and technologies will result in the rapid translation of scientific discoveries into health interventions. We will have achieved this goal when:
• Key roadblocks that impede the translation of science into improved impacts on human health have been identified and eliminated.
• New tools, technologies, data sets and models are widely available to enable translation across organizations, accelerate translation of science, and test new approaches that foster innovation in real world settings.
• Translational science uses digital technologies to create scientific information and to communicate, replicate and reuse scientific knowledge and data.
• Data sets are integrated; data sharing and access to secondary data is the norm across the translational spectrum.
• By changing methods and processes, translational science dramatically improves translation of discoveries into tangible effects on health in real world settings.
• Successful translational science practices and effective solutions are adopted across the nation. • Outcomes from implemented solutions are correlated with expected changes. • Common processes exist to strengthen clinical study, implementation and impact.
Measureable Objectives 1. Methods and processes are developed or optimized for carrying out translational sciences within different
stakeholder environments. 2. Emerging areas in science proceed more quickly due to CTSA-driven innovations. 3. The business of translational science is managed with accountability and data-driven decision making:
• There are established performance measures for the conduct of translational sciences (including achievement of research objectives).
• Using performance measures, management practices are analyzed for effectiveness and efficiency. Strategies are developed and implemented to enhance effectiveness.
• Processes among and between translational science stakeholders are harmonized (e.g., data elements, medical records, institutional review board approval process, procurement)
4. Methods and processes are optimized for the development of both regulated and non-regulated interventions so requirements are transparent and consistently applied.
5. Analytical and computational tools are developed and deployed to manage the explosion of data and enable optimal utilization of those data to make tangible improvements to human health. For example, new sets of data are visualized, integrated and made broadly available for a diverse range of translational science uses.
6. Tangible improvements are made in the timeliness, quality and ethical standards of research design (e.g., institutional review boards, human subject protections). For example, a multisite clinical proof-of-concept trial is carried out in a timely manner.
NCATS Advisory Council Working Group on the IOM Report: The CTSA Program at NIH
Draft Report Page 17
APPENDIX A: RESULTS-BASED ACCOUNTABILITY Results-Based Accountability™ (RBA)1
is used by organizations to improve the performance of their programs. RBA starts with “ends” and works backward, toward “means.” It is a simple, common sense framework that all stakeholders can understand. The NCATS Advisory Council Working Group applied the following RBA principles in its deliberations.
RBA Principle Distinguish accountability for the well-being of populations from accountability for program performance. RBA distinguishes between (1) results for whole populations (e.g., all children, all seniors, all citizens in a geographic area) and (2) results for the customers or clients of a particular program, agency or service system. The most important reason for this distinction is the difference in who is accountable. Performance accountability can be assigned to the managers who run the various programs, agencies or service systems. Population accountability cannot be assigned to any one individual, organization or level of government. The whole community, public and private sectors, must share responsibility for results. To illustrate this point, Dr. Michael Lauer of the National Heart, Lung and Blood Institute, in a commentary on RBA in the journal Circulation Research, used the analogy of a job-training program and asked, “Should a job training program be held accountable for a city’s employment rate?”2
Application to the CTSA program.In its deliberations, the Working Group focused on identifying the appropriate program accountability to assign to the CTSA program. The Working Group distinguished such program accountability from accountability for the health of whole populations (e.g., rates of death and suffering due to diseases), for which the CTSA program should not and cannot be held solely accountable.
RBA Principle Performance accountability includes asking not just “how much did we do?” and “how well did we do it?” but also, and most importantly, “is anyone better off?” In RBA, the managers of a program ask: What is the desired impact of our services on our customers or clients? The most important performance measures gauge the extent to which the desired impact is being achieved.
Application to the CTSA program. In focusing on the performance accountability of the CTSA program, the Working Group began with the desired impact of the CTSA program on the translational workforce, outlined in terms of the four Strategic Goals:
The translational workforce has the skills and knowledge necessary to advance translation of discoveries. 1. Stakeholders are engaged in collaborations to advance translation. 2. Translational science is integrated across its multiple phases and disciplines within complex populations 3. and across the individual lifespan. The scientific study of the process of conducting translational science itself enables significant advances in translation.
RBA Principle In decision making, work from ends to means: What do we want? How will we recognize it? What will it take to get there? In RBA, whether focusing on the conditions of well-being that we want for populations or the performance of an agency or program, decision making starts with clearly identifying ends, determining how to gauge the achievement of those ends, and then systematically working backwards to determine the best means to achieve those ends.

NCATS Advisory Council Working Group on the IOM Report: The CTSA Program at NIH
Page 18 Draft Report
Application to the CTSA program. For each Strategic Goal, the Working Group developed (1) a description of what the achievement of each Strategic Goal would look like; (2) an analysis identifying the most important factors (positive and negative, internal and external to the CTSA program) impacting the success of the CTSA program in achieving that Strategic Goal; and (3) a set of Measurable Objectives to guide the CTSA program’s development and implementation of strategies to improve the achievement of the Strategic Goals.
RBA Principle Engage stakeholders collaboratively by making the decision-making process transparent. RBA enhances stakeholder engagement and collaboration by making the decision making process systematic and transparent.
Application to the CTSA program. In developing its recommendations for the CTSA program, the Working Group has purposely made transparent its deliberations — the ends to which the CTSA program should be assigned accountability, the Working Group’s analysis of the factors impacting the achievement of those ends, and the recommended measurable objectives to inform the development and implementation of strategies to improve performance.
1 Results-Based Accountability™ was developed by Mark Friedman, author of Trying Hard is Not Good Enough: How to Produce Measurable Improvements for Customers and Communities. Victoria, B.C., Canada: Trafford Press, 2005. Available at: http://resultsaccountability.com and http://raguide.org. 2 Lauer, M.S. Thought Exercise on Accountability and Performance Measures at the National Heart, Lung, and Blood Institute: An Invited Commentary for Circulation Research. Circ Res 108:405-409, 2011. Available at: http://circres.ahajournals.org/cgi/content/full/108/4/405.
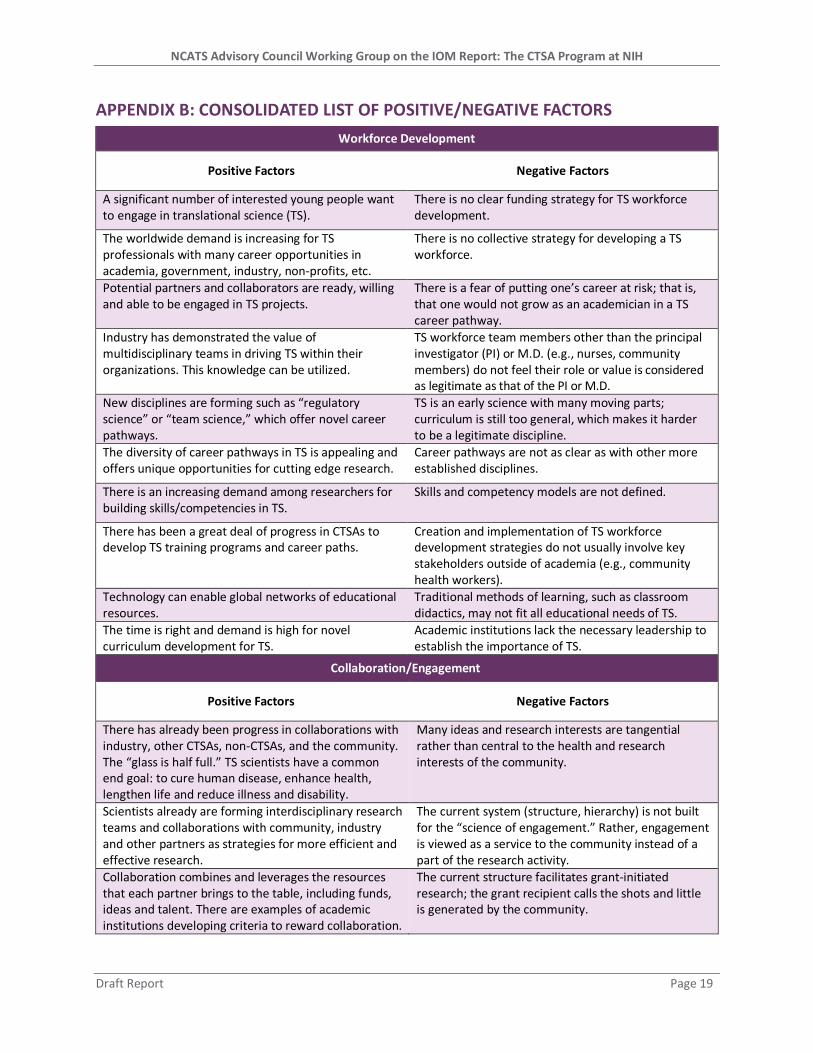
NCATS Advisory Council Working Group on the IOM Report: The CTSA Program at NIH
Draft Report Page 19
APPENDIX B: CONSOLIDATED LIST OF POSITIVE/NEGATIVE FACTORS Workforce Development
Positive Factors Negative Factors
A significant number of interested young people want to engage in translational science (TS).
There is no clear funding strategy for TS workforce development.
The worldwide demand is increasing for TS professionals with many career opportunities in academia, government, industry, non-profits, etc.
There is no collective strategy for developing a TS workforce.
Potential partners and collaborators are ready, willing and able to be engaged in TS projects.
There is a fear of putting one’s career at risk; that is, that one would not grow as an academician in a TS career pathway.
Industry has demonstrated the value of multidisciplinary teams in driving TS within their organizations. This knowledge can be utilized.
TS workforce team members other than the principal investigator (PI) or M.D. (e.g., nurses, community members) do not feel their role or value is considered as legitimate as that of the PI or M.D.
New disciplines are forming such as “regulatory science” or “team science,” which offer novel career pathways.
TS is an early science with many moving parts; curriculum is still too general, which makes it harder to be a legitimate discipline.
The diversity of career pathways in TS is appealing and offers unique opportunities for cutting edge research.
Career pathways are not as clear as with other more established disciplines.
There is an increasing demand among researchers for building skills/competencies in TS.
Skills and competency models are not defined.
There has been a great deal of progress in CTSAs to develop TS training programs and career paths.
Creation and implementation of TS workforce development strategies do not usually involve key stakeholders outside of academia (e.g., community health workers).
Technology can enable global networks of educational resources.
Traditional methods of learning, such as classroom didactics, may not fit all educational needs of TS.
The time is right and demand is high for novel curriculum development for TS.
Academic institutions lack the necessary leadership to establish the importance of TS.
Collaboration/Engagement
Positive Factors Negative Factors
There has already been progress in collaborations with industry, other CTSAs, non-CTSAs, and the community. The “glass is half full.” TS scientists have a common end goal: to cure human disease, enhance health, lengthen life and reduce illness and disability.
Many ideas and research interests are tangential rather than central to the health and research interests of the community.
Scientists already are forming interdisciplinary research teams and collaborations with community, industry and other partners as strategies for more efficient and effective research.
The current system (structure, hierarchy) is not built for the “science of engagement.” Rather, engagement is viewed as a service to the community instead of a part of the research activity.
Collaboration combines and leverages the resources that each partner brings to the table, including funds, ideas and talent. There are examples of academic institutions developing criteria to reward collaboration.
The current structure facilitates grant-initiated research; the grant recipient calls the shots and little is generated by the community.

NCATS Advisory Council Working Group on the IOM Report: The CTSA Program at NIH
Page 20 Draft Report
Some successful models for collaborative TS exist, including practice-based research networks and community-based participatory research partnerships.
In general, the rewards system is not aligned with TS, whether it is money, promotion, tenure, a sense of belonging, or a sense of respect.
There are excellent examples of different scientific approaches to the study of collaboration in industry, academia and transformative scientific endeavors (e.g., space missions).
TS capacity building and infrastructure support is needed to enable patient advocates and community members to participate fully as partners.
The CTSA program has attempted in a systemic way to engage the public in the process of translational sciences.
We do not teach collaboration as well as we could, and many collaborations fail.
Diversity of skills, experiences and backgrounds enhances performance of teams and organizations.
We encourage competition rather than collaboration, from science fairs to graduate school; it is part of the culture.
High performing teams are based on trust, diversity and collaboration.
There is a lack of understanding about what each party can bring to the table.
Diverse teams are often the most innovative. Collaborations take a lot of time and must begin with creating a trusting partnership.
There is a growing group of patient advocates and community members who are eager to participate as partners in TS. Many people embrace the concept of “citizen scientist.”
The practice of community engagement in TS is often limited to community outreach for recruitment of study participants, particularly minority populations.
There are many roadblocks to collaboration across sectors and across the entire TS spectrum.
Integration
Positive Factors Negative Factors
CTSAs are poised to understand diseases in the transition from childhood to adulthood and from adulthood into old age.
There are barriers to lifespan research; for example, age restrictions for studying drug interventions in pediatric and geriatric (80+ years) populations.
CTSAs are uniquely positioned to play a coordinating/convening role for bringing together scientists from the disparate fields needed to study disease longitudinally.
There is tension about the relative value of translation from basic science to human studies, versus translation of new data into the clinic and health decision making.
Analytical and computational tools are becoming available to release new information and subsequent insights by integrating increasingly large and diverse sets of data.
Scientists who are focused on a specific field (either life-stage or type of intervention) do not routinely interact with colleagues in other fields.
Integration of scientific information across periods of time leads to knowledge formation, including longitudinal disease-specific databases.
There is a lack of a knowledge base for all types of interventions at the extremes of age as well as within special populations.
There is a growing body of knowledge about the non-clinical determinants of health (e.g., a robust network of community-based public health practitioners, urban planning).
Patients are not engaged as collaborative partners in the clinical care and clinical research process.
Patient advocate groups are eager to help partner in research.
There is a research gap in the transition phases of aging.
Academics and NIH attempt to create awareness on the study of minorities and special populations.
There are many barriers to working with the pediatric population if one is not formally trained as a pediatrician.

NCATS Advisory Council Working Group on the IOM Report: The CTSA Program at NIH
Draft Report Page 21
There are some medical subspecialties that have a track record of following disease across age ranges (i.e., cystic fibrosis, sickle cell).
Support is lacking for maintenance of long-term databases and biorepositories.
Academic health centers are interested in defining and providing best practices, and this increases interest in defining quality care at the extremes of the lifespan.
Many ethical issues exist for dealing with special populations, but there is limited access to ethics expertise.
Disease prevention is a field of study of high interest to the CTSA program.
More robust training programs are needed for investigators studying lifespan transitions.
Strong progress has been made in computing power to integrate and display vast amounts of disparate information.
There is no single clear solution for which data analytics system to use.
Methods/Processes
Positive Factors Negative Factors
Standardization of methods and processes frees investigators to focus on innovation.
There are no established standards in TS for performance measures to gauge, for example, the achievement of research objectives or the efficiency and timeliness of the research process.
Effective processes enhance productivity while minimizing waste.
There is no standardization or harmonization of information among CTSA sites.
Reproducibility and validation of science is enhanced by high-quality methods and processes.
Regulatory science competencies of researchers are not standardized, are inconsistent, or are not strong.
There is recognition of the need to change methodologies to advance TS.
A regulatory pathway for emerging technologies does not exist (e.g., for regenerative medicine).
There are examples of applications of business methodology to address TS.
There is no clear funding strategy for studying method development or process improvement in TS.
There is interest in driving new technologies to the clinic.
TS processes are slow and cumbersome and often were designed without the investigator or the patient in mind.
CTSAs have access to the diverse expertise needed to redesign the TS enterprise.
Historically, CTSAs have not had a strong focus on the “science of translational science.” This should be a main goal.
Novel methodologies and processes have come from the CTSA program.
“Out of the box” thinking or solutions often are met with skepticism.
CTSAs now have the flexibility to focus on new areas of science.
Effective methods for dissemination of novel technologies, methods or practices are not readily available.
Academia is often the birthplace of new disciplines, and CTSAs can be involved at the onset in determining what is needed to move emerging fields forward.
Many major improvements to the TS structure will require redesign of resources outside the control of CTSAs (i.e., technology transfer or institutional review board offices).

NCATS Advisory Council Working Group on the IOM Report: The CTSA Program at NIH
Page 22 Draft Report
APPENDIX C: WORKING GROUP TIMELINE • Initial face-to-face meeting with Working Group — December 6, 2013 • WebEx with Working Group — January 27, 2014 • Second face-to-face meeting with Working Group — February 11, 2014 • Working Group Review of Draft Report Outline — March 13-26, 2014 • Working Group Review of Draft Report — April 16-21, 2014 • Co-Chairs Presentation of Report to NCATS Advisory Council — May 16, 2014

NCATS Working Group Recommendations on IOM CTSA Report: Summary for UF CTSI
Page 1 of 5 (drafted by C. Baralt 5/30/2014, last updated 6/17/2014)
NCATS Working Group charge: Consider four of the seven IOM recommendations and develop meaningful, measurable goals and outcomes for the CTSA program that speak to critical issues and opportunities across the full spectrum of clinical and translational sciences. Four IOM recommendations considered: • Formalize and standardize evaluation processes • Advance innovation in education and training programs • Ensure community engagement in all phases of research • Strengthen clinical and translational science relevant to child health NCATS Working Group report released May 16, 2014: Intended to serve as a reference for developing strategies to strengthen the CTSA program and as a guide for measuring and reporting progress. Sets forth a framework within which translational science stakeholders can address some of the most perplexing challenges and emerging opportunities that hinder the translation of basic science discoveries into interventions that improve human health. NCATS next steps: NCATS considers implementation strategies and metrics. NCATS measures results. NCATS Working Group’s definition and vision for translational science: • Definition: Translational science is the field of investigation focused on understanding and addressing
the scientific and organizational challenges underlying each step of the translational process. • Vision: To advance, translational science must evolve from the sequential to the parallel; from linear to
bidirectional; from single discipline to multidiscipline; from single institutions to collaborative, integrated networks of institutions; and from investigator-initiated to stakeholder-driven processes. Translational science must adhere to high quality methods and processes, and must use and advocate for models that are clearly reliable, reproducible, and ultimately validated in humans. Translational science must be conducted in structures that are much flatter, more cooperative and more process-oriented, with a focus on teams and collaborations. New technologies, approaches, methods and policies must be developed to speed tangible improvements to human health.
NCATS Working Group’s view of CTSA role: • Each institutional CTSA functions as a living laboratory for the study of the translational science
process. The CTSA program members create new knowledge, technologies, methods and policies to benefit the conduct of translational science across the nation.
NCATS Working Group’s four proposed strategic goals for CTSA program (see pages 2-5 for measurable objectives and view of success proposed for each goal): • Workforce Development: The translational science workforce has the skills and knowledge necessary
to advance translation of discoveries. • Collaboration/Engagement: Stakeholders are engaged in collaborations to advance translation. • Integration: Translational science is integrated across its multiple phases and disciplines within
complex populations and across the individual lifespan. • Methods/Processes: The scientific study of the process of conducting translational science itself
enables significant advances in translation.

NCATS Working Group Recommendations on IOM CTSA Report: Summary for UF CTSI
Page 2 of 5 (drafted by C. Baralt 5/30/2014, last updated 6/17/2014)
WORKFORCE DEVELOPMENT Proposed Strategic Goal: Translational science workforce has the skills and knowledge necessary to advance translation of discoveries. Focuses on building an environment that supports and values translational science as “the place to go” for those who want to pursue high-impact careers in health sciences; training and educating a world-leading, continuously learning workforce; developing a translational science workforce that can meet the needs of today and tomorrow.
Proposed Measurable Objectives Working Group View of Success NCATS View of Next Steps
1. Core competencies for a translational science workforce and the methods for evaluating those competencies are defined. - Skills and competency models are created. - Information on skills and competencies are broadly and readily available. - Effective practices are shared and adopted in a continuously learning environment. - Core competencies are developed for, and with the involvement of, all stakeholders.
2. Translational science is a fully developed, highly valued and rewarding discipline with formal career pathways. - Translational science organizational units are established at academic health centers. These translational
science organizational units hold the same stature as traditional biomedical research departments (e.g., anatomy) yet engage all disciplines in team science.
- There is a national strategy for developing a translational science workforce that has been developed collaboratively with the involvement of all stakeholders.
- There is a defined educational pathway for translational science specialties that enables focused preparation to begin at the undergraduate level.
- The workforce is broadly trained across the full spectrum of translational science, regardless of the specific specialization of an individual translational scientist.
- The systems for staff development and faculty promotion at academic health centers recognize and reward the collaborative nature of translational science.
- Mentoring programs are established, evaluated and made widely available. 3. Translational science is conducted by interdisciplinary teams for optimal impact.
- There are means to define, recognize and reward the contributions of all team members regardless of role or degree. - Sustainable partnerships are the norm. - Reward systems are built around team science metrics. - Individual team members are valued and have clear career paths. - The translational workforce is trained in the core competencies of collaboration/engagement.
4. Core competencies are available to all members of the workforce through vehicles for learning that are readily accessible and flexible. - Degree programs in translational science are widely available. - Certificate programs in subdisciplines of translational science are widely available. - Ongoing continuing translational science educational programs exist at sites where translational science is performed. - Criteria for translational science competence have been defined and evaluation of that competence can be
documented. - Quality programs for translational science are operating at all institutions involved in the discipline.
5. Training curricula on effective teams, high-performing organizations and productive collaborations are developed, made broadly available and viewed as a core element of success. For example, training is available on how to create effective and streamlined collaborative processes.
Achieving success will require that: • The translational science
“workforce” is broadly defined and includes researchers, clinicians, practitioners, patients, patient advocacy organizations, industry and community members.
• Curriculum is developed to train a world-leading, globally connected, continually learning workforce with the skills needed to excel in translational science.
• Translational science training draws from sources outside the academic arena (e.g., from industry and non-profit sectors).
• The subdisciplines within translational science are well defined.
• The steps to advancement within each translational science subdiscipline are well defined.
• Resources are available for the research and development of needed educational competency models in each translational science subdiscipline, as well as the tools and methods needed to develop those competencies so that education constantly evolves.
• The needs of the translational science workforce are identified and forecast.
Petra Kaufmann examples presented to CTSA PIs, May 28, 2014: • For research staff at all
levels, provide training that is harmonized across studies and CTSA sites (GCP).
• For K scholars, provide innovative curricula that include a focus on non-traditional study areas such as regulatory science or entrepreneurship, and that offer “mini sabbaticals” in academia or industry to enrich the training experience.
• In graduate training programs, focus on methodological rigor and transparency in reporting to enhance the validity and reproducibility of pre-clinical research.
• Create an environment where team science and translational science is a viable career path, for example by adjusting promotion criteria to meet the needs of today.

NCATS Working Group Recommendations on IOM CTSA Report: Summary for UF CTSI
Page 3 of 5 (drafted by C. Baralt 5/30/2014, last updated 6/17/2014)
COLLABORATION / ENGAGEMENT Proposed Strategic Goal: Stakeholders are engaged in collaborations to advance translation. Focuses on engaging stakeholder communities so they contribute meaningfully across the translational sciences spectrum; enabling team science to become a major academic model; ensuring that all translational science is performed in the context of collaborative team science and that shared leadership roles are the norm throughout the entire translational science process.
Proposed Measurable Objectives Working Group View of Success NCATS View of Next Steps
1. Methods, processes and systems are developed and utilized to identify and effectively engage relevant and diverse stakeholders across the translation spectrum. - Developed methods are adopted broadly. - Approaches studied rigorously add valuable insights and information, regardless of
whether they succeed or fail. - Both positive and negative results are widely disseminated through suitable means of
communication. 2. Methods, processes and systems for collaborating are innovative and evolve to meet the
needs of the translational science field. - Novel methodologies, study design and technologies are developed and tested. - The existing barriers to effective collaborations are reduced.
3. Each partner within a diverse translational science team has the capacity and infrastructure support to be both a collaborator and to lead collaborations as complex translational science projects evolve. - Project roles are clearly defined. - Leadership values diverse expertise. - Institutions demonstrate their support for establishing, maintaining and expanding
collaborations and partnerships. 4. Translational science collaborations involve individuals, organizations and disciplines that are
appropriate to the study aims. - Rationale for choice of stakeholder engagement is clear and meaningful.
5. There are established measures for assessing and improving collaborations. - Methods have been developed for evaluating the value and productivity of collaboration. - Methods have been developed collaboratively by translational science stakeholders for
assessing the quality and impact of community engagement and collaboration in translational science.
6. Diverse stakeholders and community members play key roles throughout the infrastructure of the CTSA program both locally and nationally. - There is full and effective integration of all stakeholders at all levels of governance.
7. The translational science workforce is competent in community engagement and collaboration. - Robust training programs are developed and outcomes assessed. - The science of successful collaboration becomes part of the translational science
portfolio.
Achieving success will require that: • Translational scientists are aligned toward a
common goal: to cure human disease, enhance health, lengthen life and reduce illness and disability.
• The role and function of the CTSA program is clear to all potential collaborators.
• Communities involved in all aspects of the translational science spectrum contribute to the development of all aspects of translational sciences.
• Translational science is governed by collaborations and partnerships that reward all stakeholders, including researchers, patients and the community.
• Government funding agencies, such as NIH, routinely collaborate in translational science initiatives and effectively engage other federal agencies, industry, academia and philanthropic organizations as partners.
• The value of collaboration is enhanced while the cost and difficulties of collaboration are reduced by methodologies and approaches emanating from CTSA programs.
• Collaboration to accelerate translational science extends beyond U.S. borders.
• Patient advocates, community members and citizen scientists have the capacity and infrastructure in place to participate fully as partners in all phases of translational science.
• All stakeholders are respected, valued and rewarded for their time and expertise.
• We can measure the impact of the collaborative culture change on translational science.
Petra Kaufmann examples presented to CTSA PIs, May 28, 2014: Engaging stakeholder communities across the translational spectrum • Include patients early on in the
concept development to make sure we answer questions that matter to patients
o in protocol development to make sure that the plan is feasible in terms of participant burden
o in considering risk/benefit relationships and in developing consent language
o in considering endpoints to make sure that what is measures matters to them
o in developing communication plans to make sure messages reach relevant communities
• Include all relevant stakeholders in the health care delivery system (e.g. hospitals, office-based clinicians)
• Promote partnerships with industry and non-profit organizations
• Identify and disseminate successful collaboration models

NCATS Working Group Recommendations on IOM CTSA Report: Summary for UF CTSI
Page 4 of 5 (drafted by C. Baralt 5/30/2014, last updated 6/17/2014)
INTEGRATION Proposed Strategic Goal: Translational science is integrated across its multiple phases and disciplines within complex populations and across the individual lifespan. Focuses on integrating translational science across the entire lifespan to attain improvements in health for all; launching efforts to study special population differences in the progress and treatment of disease processes; developing a seamless integrated approach to translational science across all phases of research.
Proposed Measurable Objectives Working Group View of Success NCATS View of Next Steps
1. Translational science addresses special populations (e.g., children, the elderly, Latinos, African-Americans) and all transitions across the lifespan. - Interventions and devices are developed for population-specific needs. - Participant risk in translational sciences is managed appropriately for all
populations (e.g., pediatrics, geriatrics). - All populations are welcome to participate in translational science.
2. Translational science addresses all types of interventions (e.g., devices, medical procedures, behavioral changes, non-clinical determinants of health) in all populations.
3. Translational science is integrated from basic research to clinical to care implementation and to populations across the spectrum of the lifespan. - Clinical research objectives are aligned with clinical care. - Academic medical centers embrace translational research as a critical part of their
clinical care mission. - Translational science enhances patient outcomes by understanding and
improving medical care compliance and adherence to treatment plans. 4. Translational scientists integrate the entire translational science spectrum into how
they conceptualize and implement their research for patients throughout the lifespan. 5. The methods that influence the integration of evidence-based interventions into
practice settings (i.e., implementation science) become fully realized across the lifespan and for all populations, especially those experiencing health disparities.
Success is achieved when: • Translational science efforts lead to quantifiable
improvements to the health, health care outcomes and quality of life for people living with chronic disease and for racial, ethnic and underserved populations.
• Laboratory and clinical advances are translated rapidly into lifesaving and life-prolonging interventions in both the young and elderly, without unnecessary delay.
• Expertise, scientific data and technologies are shared to broaden the impact and enhance productivity of translational science across the lifespan.
• New models (including regulatory, ethical or policy considerations) exist that include all patients in biomedical research.
• Opportunities to prevent, postpone the onset or otherwise alter the natural history of acute and chronic conditions through interventions early in the life course are examined by translational scientists.
• Data across the full lifespan are integrated, analyzed, displayed and exploited as relating to translational science.
• Translational research on health conditions that are specific to different life stages (childhood, adolescence, early adulthood, reproductive ages, pregnancy, and older adulthood) are emphasized.
• Mechanisms are in place to ensure that interventions reach the patients who need them the most.
Petra Kaufmann examples presented to CTSA PIs, May 28, 2014: • Consider the entire lifespan in
translational research o Pediatric populations o Elderly populations
• Promote the study of population difference in disease progression and treatment response
• Support implementation science o Across the lifespan o Across all populations,
especially those experiencing health disparities

NCATS Working Group Recommendations on IOM CTSA Report: Summary for UF CTSI
Page 5 of 5 (drafted by C. Baralt 5/30/2014, last updated 6/17/2014)
METHODS / PROCESSES Proposed Strategic Goal: The scientific study of the process of conducting translational science itself enables significant advances in translation. Focuses on enabling CTSAs to function individually and together as a research engine transforming the way translational science is conducted across the nation to make tangible improvements in the health of individuals and the population; rapidly translating CTSA-generated new knowledge and technologies into health interventions in real world settings; developing technologies, methods, data, analytics and resources that change the way translational scientists approach their work; generating and curating comprehensive data sets or other resources that catalyze science.
Proposed Measurable Objectives Working Group View of Success NCATS View of Next Steps
1. Methods and processes are developed or optimized for carrying out translational sciences within different stakeholder environments.
2. Emerging areas in science proceed more quickly due to CTSA-driven innovations.
3. The business of translational science is managed with accountability and data-driven decision making: - There are established performance measures for the conduct of
translational sciences (including achievement of research objectives). - Using performance measures, management practices are analyzed for
effectiveness and efficiency. Strategies are developed and implemented to enhance effectiveness.
- Processes among and between translational science stakeholders are harmonized (e.g., data elements, medical records, institutional review board approval process, procurement)
4. Methods and processes are optimized for the development of both regulated and non-regulated interventions so requirements are transparent and consistently applied.
5. Analytical and computational tools are developed and deployed to manage the explosion of data and enable optimal utilization of those data to make tangible improvements to human health. For example, new sets of data are visualized, integrated and made broadly available for a diverse range of translational science uses.
6. Tangible improvements are made in the timeliness, quality and ethical standards of research design (e.g., institutional review boards, human subject protections). For example, a multisite clinical proof-of-concept trial is carried out in a timely manner.
We will have achieved this goal when: • Key roadblocks that impede the translation of science
into improved impacts on human health have been identified and eliminated.
• New tools, technologies, data sets and models are widely available to enable translation across organizations, accelerate translation of science, and test new approaches that foster innovation in real world settings.
• Translational science uses digital technologies to create scientific information and to communicate, replicate and reuse scientific knowledge and data.
• Data sets are integrated; data sharing and access to secondary data is the norm across the translational spectrum.
• By changing methods and processes, translational science dramatically improves translation of discoveries into tangible effects on health in real world settings.
• Successful translational science practices and effective solutions are adopted across the nation.
• Outcomes from implemented solutions are correlated with expected changes.
• Common processes exist to strengthen clinical study, implementation and impact.
Petra Kaufmann examples presented to CTSA PIs, May 28, 2014: • Use innovations in data and privacy
technology to accelerate translation of science
o Research-friendly consent forms o Data standards o Cohort identification
• Identify key roadblocks to minimize inefficiencies
o Building network capacity o Streamlining IRB, contracting,
training and site qualification • Adherence to high quality methods and
processes