methods of data collection - delhi university
TRANSCRIPT

Methods of Data Collection 95
6
Methods of Data Collection
The task of data collection begins after a research problem has been defined and research design/plan chalked out. While deciding about the method of data collection to be used for the study, theresearcher should keep in mind two types of data viz., primary and secondary. The primary data arethose which are collected afresh and for the first time, and thus happen to be original in character.The secondary data, on the other hand, are those which have already been collected by someoneelse and which have already been passed through the statistical process. The researcher would haveto decide which sort of data he would be using (thus collecting) for his study and accordingly he willhave to select one or the other method of data collection. The methods of collecting primary andsecondary data differ since primary data are to be originally collected, while in case of secondarydata the nature of data collection work is merely that of compilation. We describe the differentmethods of data collection, with the pros and cons of each method.
COLLECTION OF PRIMARY DATA
We collect primary data during the course of doing experiments in an experimental research but incase we do research of the descriptive type and perform surveys, whether sample surveys or censussurveys, then we can obtain primary data either through observation or through direct communicationwith respondents in one form or another or through personal interviews.* This, in other words, means
* An experiment refers to an investigation in which a factor or variable under test is isolated and its effect(s) measured.In an experiment the investigator measures the effects of an experiment which he conducts intentionally. Survey refers tothe method of securing information concerning a phenomena under study from all or a selected number of respondents ofthe concerned universe. In a survey, the investigator examines those phenomena which exist in the universe independent ofhis action. The difference between an experiment and a survey can be depicted as under:
Surveys Experiments
can be studied through determine
Possible relationships between the data and the unknowns in the universe
Economic Psychological Others

96 Research Methodology
that there are several methods of collecting primary data, particularly in surveys and descriptiveresearches. Important ones are: (i) observation method, (ii) interview method, (iii) through questionnaires,(iv) through schedules, and (v) other methods which include (a) warranty cards; (b) distributoraudits; (c) pantry audits; (d) consumer panels; (e) using mechanical devices; (f) through projectivetechniques; (g) depth interviews, and (h) content analysis. We briefly take up each method separately.
Observation Method
The observation method is the most commonly used method specially in studies relating to behaviouralsciences. In a way we all observe things around us, but this sort of observation is not scientificobservation. Observation becomes a scientific tool and the method of data collection for the researcher,when it serves a formulated research purpose, is systematically planned and recorded and is subjectedto checks and controls on validity and reliability. Under the observation method, the information issought by way of investigator’s own direct observation without asking from the respondent. Forinstance, in a study relating to consumer behaviour, the investigator instead of asking the brand ofwrist watch used by the respondent, may himself look at the watch. The main advantage of thismethod is that subjective bias is eliminated, if observation is done accurately. Secondly, the informationobtained under this method relates to what is currently happening; it is not complicated by either thepast behaviour or future intentions or attitudes. Thirdly, this method is independent of respondents’willingness to respond and as such is relatively less demanding of active cooperation on the part ofrespondents as happens to be the case in the interview or the questionnaire method. This method isparticularly suitable in studies which deal with subjects (i.e., respondents) who are not capable ofgiving verbal reports of their feelings for one reason or the other
However, observation method has various limitations. Firstly, it is an expensive method. Secondly,the information provided by this method is very limited. Thirdly, sometimes unforeseen factors mayinterfere with the observational task. At times, the fact that some people are rarely accessible todirect observation creates obstacle for this method to collect data effectively.
While using this method, the researcher should keep in mind things like: What should be observed?How the observations should be recorded? Or how the accuracy of observation can be ensured? Incase the observation is characterised by a careful definition of the units to be observed, the style ofrecording the observed information, standardised conditions of observation and the selection of pertinentdata of observation, then the observation is called as structured observation. But when observationis to take place without these characteristics to be thought of in advance, the same is termed asunstructured observation. Structured observation is considered appropriate in descriptive studies,whereas in an exploratory study the observational procedure is most likely to be relatively unstructured.
We often talk about participant and non-participant types of observation in the context of studies,particularly of social sciences. This distinction depends upon the observer’s sharing or not sharingthe life of the group he is observing. If the observer observes by making himself, more or less, amember of the group he is observing so that he can experience what the members of the groupexperience, the observation is called as the participant observation. But when the observer observesas a detached emissary without any attempt on his part to experience through participation whatothers feel, the observation of this type is often termed as non-participant observation. (When theobserver is observing in such a manner that his presence may be unknown to the people he isobserving, such an observation is described as disguised observation.)

Methods of Data Collection 97
There are several merits of the participant type of observation: (i) The researcher is enabled torecord the natural behaviour of the group. (ii) The researcher can even gather information whichcould not easily be obtained if he observes in a disinterested fashion. (iii) The researcher can evenverify the truth of statements made by informants in the context of a questionnaire or a schedule. Butthere are also certain demerits of this type of observation viz., the observer may lose the objectivityto the extent he participates emotionally; the problem of observation-control is not solved; and it maynarrow-down the researcher’s range of experience.
Sometimes we talk of controlled and uncontrolled observation. If the observation takes placein the natural setting, it may be termed as uncontrolled observation, but when observation takes placeaccording to definite pre-arranged plans, involving experimental procedure, the same is then termedcontrolled observation. In non-controlled observation, no attempt is made to use precision instruments.The major aim of this type of observation is to get a spontaneous picture of life and persons. It has atendency to supply naturalness and completeness of behaviour, allowing sufficient time for observingit. But in controlled observation, we use mechanical (or precision) instruments as aids to accuracyand standardisation. Such observation has a tendency to supply formalised data upon whichgeneralisations can be built with some degree of assurance. The main pitfall of non-controlledobservation is that of subjective interpretation. There is also the danger of having the feeling that weknow more about the observed phenomena than we actually do. Generally, controlled observationtakes place in various experiments that are carried out in a laboratory or under controlled conditions,whereas uncontrolled observation is resorted to in case of exploratory researches.
Interview Method
The interview method of collecting data involves presentation of oral-verbal stimuli and reply interms of oral-verbal responses. This method can be used through personal interviews and, if possible,through telephone interviews.
(a) Personal interviews:Personal interview method requires a person known as the interviewerasking questions generally in a face-to-face contact to the other person or persons. (At times theinterviewee may also ask certain questions and the interviewer responds to these, but usually theinterviewer initiates the interview and collects the information.) This sort of interview may be in theform of direct personal investigation or it may be indirect oral investigation. In the case of directpersonal investigation the interviewer has to collect the information personally from the sourcesconcerned. He has to be on the spot and has to meet people from whom data have to be collected.This method is particularly suitable for intensive investigations. But in certain cases it may not bepossible or worthwhile to contact directly the persons concerned or on account of the extensivescope of enquiry, the direct personal investigation technique may not be used. In such cases anindirect oral examination can be conducted under which the interviewer has to cross-examine otherpersons who are supposed to have knowledge about the problem under investigation and theinformation, obtained is recorded. Most of the commissions and committees appointed by governmentto carry on investigations make use of this method.
The method of collecting information through personal interviews is usually carried out in astructured way. As such we call the interviews as structured interviews. Such interviews involvethe use of a set of predetermined questions and of highly standardised techniques of recording. Thus,

98 Research Methodology
the interviewer in a structured interview follows a rigid procedure laid down, asking questions in aform and order prescribed. As against it, the unstructured interviews are characterised by a flexibilityof approach to questioning. Unstructured interviews do not follow a system of pre-determinedquestions and standardised techniques of recording information. In a non-structured interview, theinterviewer is allowed much greater freedom to ask, in case of need, supplementary questions or attimes he may omit certain questions if the situation so requires. He may even change the sequenceof questions. He has relatively greater freedom while recording the responses to include some aspectsand exclude others. But this sort of flexibility results in lack of comparability of one interview withanother and the analysis of unstructured responses becomes much more difficult and time-consumingthan that of the structured responses obtained in case of structured interviews. Unstructured interviewsalso demand deep knowledge and greater skill on the part of the interviewer. Unstructured interview,however, happens to be the central technique of collecting information in case of exploratory orformulative research studies. But in case of descriptive studies, we quite often use the technique ofstructured interview because of its being more economical, providing a safe basis for generalisationand requiring relatively lesser skill on the part of the interviewer.
We may as well talk about focussed interview, clinical interview and the non-directive interview.Focussed interview is meant to focus attention on the given experience of the respondent and itseffects. Under it the interviewer has the freedom to decide the manner and sequence in which thequestions would be asked and has also the freedom to explore reasons and motives. The main task ofthe interviewer in case of a focussed interview is to confine the respondent to a discussion of issueswith which he seeks conversance. Such interviews are used generally in the development ofhypotheses and constitute a major type of unstructured interviews. The clinical interview is concernedwith broad underlying feelings or motivations or with the course of individual’s life experience. Themethod of eliciting information under it is generally left to the interviewer’s discretion. In case ofnon-directive interview, the interviewer’s function is simply to encourage the respondent to talkabout the given topic with a bare minimum of direct questioning. The interviewer often acts as acatalyst to a comprehensive expression of the respondents’ feelings and beliefs and of the frame ofreference within which such feelings and beliefs take on personal significance.
Despite the variations in interview-techniques, the major advantages and weaknesses of personalinterviews can be enumerated in a general way. The chief merits of the interview method are asfollows:
(i) More information and that too in greater depth can be obtained.
(ii) Interviewer by his own skill can overcome the resistance, if any, of the respondents; theinterview method can be made to yield an almost perfect sample of the general population.
(iii) There is greater flexibility under this method as the opportunity to restructure questions isalways there, specially in case of unstructured interviews.
(iv) Observation method can as well be applied to recording verbal answers to various questions.
(v) Personal information can as well be obtained easily under this method.(vi) Samples can be controlled more effectively as there arises no difficulty of the missing
returns; non-response generally remains very low.(vii) The interviewer can usually control which person(s) will answer the questions. This is not
possible in mailed questionnaire approach. If so desired, group discussions may also beheld.

Methods of Data Collection 99
(viii) The interviewer may catch the informant off-guard and thus may secure the most spontaneousreactions than would be the case if mailed questionnaire is used.
(ix) The language of the interview can be adopted to the ability or educational level of theperson interviewed and as such misinterpretations concerning questions can be avoided.
(x) The interviewer can collect supplementary information about the respondent’s personalcharacteristics and environment which is often of great value in interpreting results.
But there are also certain weaknesses of the interview method. Among the important weaknesses,mention may be made of the following:
(i) It is a very expensive method, specially when large and widely spread geographical sampleis taken.
(ii) There remains the possibility of the bias of interviewer as well as that of the respondent;there also remains the headache of supervision and control of interviewers.
(iii) Certain types of respondents such as important officials or executives or people in highincome groups may not be easily approachable under this method and to that extent thedata may prove inadequate.
(iv) This method is relatively more-time-consuming, specially when the sample is large and re-calls upon the respondents are necessary.
(v) The presence of the interviewer on the spot may over-stimulate the respondent, sometimeseven to the extent that he may give imaginary information just to make the interviewinteresting.
(vi) Under the interview method the organisation required for selecting, training and supervisingthe field-staff is more complex with formidable problems.
(vii) Interviewing at times may also introduce systematic errors.
(viii) Effective interview presupposes proper rapport with respondents that would facilitate freeand frank responses. This is often a very difficult requirement.
Pre-requisites and basic tenets of interviewing: For successful implementation of the interviewmethod, interviewers should be carefully selected, trained and briefed. They should be honest, sincere,hardworking, impartial and must possess the technical competence and necessary practical experience.Occasional field checks should be made to ensure that interviewers are neither cheating, nor deviatingfrom instructions given to them for performing their job efficiently. In addition, some provision shouldalso be made in advance so that appropriate action may be taken if some of the selected respondentsrefuse to cooperate or are not available when an interviewer calls upon them.
In fact, interviewing is an art governed by certain scientific principles. Every effort should bemade to create friendly atmosphere of trust and confidence, so that respondents may feel at easewhile talking to and discussing with the interviewer. The interviewer must ask questions properly andintelligently and must record the responses accurately and completely. At the same time, the interviewermust answer legitimate question(s), if any, asked by the respondent and must clear any doubt that thelatter has. The interviewers approach must be friendly, courteous, conversational and unbiased. Theinterviewer should not show surprise or disapproval of a respondent’s answer but he must keep thedirection of interview in his own hand, discouraging irrelevant conversation and must make all possibleeffort to keep the respondent on the track.
100 Research Methodology
(b) Telephone interviews:This method of collecting information consists in contacting respondentson telephone itself. It is not a very widely used method, but plays important part in industrial surveys,particularly in developed regions. The chief merits of such a system are:
1. It is more flexible in comparison to mailing method.2. It is faster than other methods i.e., a quick way of obtaining information.3. It is cheaper than personal interviewing method; here the cost per response is relatively low.
4. Recall is easy; callbacks are simple and economical.5. There is a higher rate of response than what we have in mailing method; the non-response
is generally very low.6. Replies can be recorded without causing embarrassment to respondents.
7. Interviewer can explain requirements more easily.8. At times, access can be gained to respondents who otherwise cannot be contacted for one
reason or the other.9. No field staff is required.
10. Representative and wider distribution of sample is possible.
But this system of collecting information is not free from demerits. Some of these may behighlighted.
1. Little time is given to respondents for considered answers; interview period is not likely toexceed five minutes in most cases.
2. Surveys are restricted to respondents who have telephone facilities.
3. Extensive geographical coverage may get restricted by cost considerations.4. It is not suitable for intensive surveys where comprehensive answers are required to various
questions.5. Possibility of the bias of the interviewer is relatively more.
6. Questions have to be short and to the point; probes are difficult to handle.
COLLECTION OF DATA THROUGH QUESTIONNAIRES
This method of data collection is quite popular, particularly in case of big enquiries. It is being adoptedby private individuals, research workers, private and public organisations and even by governments.In this method a questionnaire is sent (usually by post) to the persons concerned with a request toanswer the questions and return the questionnaire. A questionnaire consists of a number of questionsprinted or typed in a definite order on a form or set of forms. The questionnaire is mailed to respondentswho are expected to read and understand the questions and write down the reply in the space meantfor the purpose in the questionnaire itself. The respondents have to answer the questions on theirown.
The method of collecting data by mailing the questionnaires to respondents is most extensivelyemployed in various economic and business surveys. The merits claimed on behalf of this method areas follows:
1. There is low cost even when the universe is large and is widely spread geographically.

Methods of Data Collection 101
2. It is free from the bias of the interviewer; answers are in respondents’ own words.3. Respondents have adequate time to give well thought out answers.4. Respondents, who are not easily approachable, can also be reached conveniently.
5 Large samples can be made use of and thus the results can be made more dependable andreliable.
The main demerits of this system can also be listed here:
1. Low rate of return of the duly filled in questionnaires; bias due to no-response is oftenindeterminate.
2. It can be used only when respondents are educated and cooperating.
3. The control over questionnaire may be lost once it is sent.4. There is inbuilt inflexibility because of the difficulty of amending the approach once
questionnaires have been despatched.5. There is also the possibility of ambiguous replies or omission of replies altogether to certain
questions; interpretation of omissions is difficult.
6. It is difficult to know whether willing respondents are truly representative.7. This method is likely to be the slowest of all.
Before using this method, it is always advisable to conduct ‘pilot study’ (Pilot Survey) for testingthe questionnaires. In a big enquiry the significance of pilot survey is felt very much. Pilot survey isinfact the replica and rehearsal of the main survey. Such a survey, being conducted by experts, bringsto the light the weaknesses (if any) of the questionnaires and also of the survey techniques. From theexperience gained in this way, improvement can be effected.
Main aspects of a questionnaire:Quite often questionnaire is considered as the heart of asurvey operation. Hence it should be very carefully constructed. If it is not properly set up, then thesurvey is bound to fail. This fact requires us to study the main aspects of a questionnaire viz., thegeneral form, question sequence and question formulation and wording. Researcher should note thefollowing with regard to these three main aspects of a questionnaire:
1. General form:So far as the general form of a questionnaire is concerned, it can either bestructured or unstructured questionnaire. Structured questionnaires are those questionnaires in whichthere are definite, concrete and pre-determined questions. The questions are presented with exactlythe same wording and in the same order to all respondents. Resort is taken to this sort of standardisationto ensure that all respondents reply to the same set of questions. The form of the question may beeither closed (i.e., of the type ‘yes’ or ‘no’) or open (i.e., inviting free response) but should be statedin advance and not constructed during questioning. Structured questionnaires may also have fixedalternative questions in which responses of the informants are limited to the stated alternatives. Thusa highly structured questionnaire is one in which all questions and answers are specified and commentsin the respondent’s own words are held to the minimum. When these characteristics are not presentin a questionnaire, it can be termed as unstructured or non-structured questionnaire. More specifically,we can say that in an unstructured questionnaire, the interviewer is provided with a general guide onthe type of information to be obtained, but the exact question formulation is largely his own responsibilityand the replies are to be taken down in the respondent’s own words to the extent possible; in somesituations tape recorders may be used to achieve this goal.
102 Research Methodology
Structured questionnaires are simple to administer and relatively inexpensive to analyse. Theprovision of alternative replies, at times, helps to understand the meaning of the question clearly. Butsuch questionnaires have limitations too. For instance, wide range of data and that too in respondent’sown words cannot be obtained with structured questionnaires. They are usually considered inappropriatein investigations where the aim happens to be to probe for attitudes and reasons for certain actions orfeelings. They are equally not suitable when a problem is being first explored and working hypothesessought. In such situations, unstructured questionnaires may be used effectively. Then on the basis ofthe results obtained in pretest (testing before final use) operations from the use of unstructuredquestionnaires, one can construct a structured questionnaire for use in the main study.2. Question sequence:In order to make the questionnaire effective and to ensure quality to thereplies received, a researcher should pay attention to the question-sequence in preparing thequestionnaire. A proper sequence of questions reduces considerably the chances of individual questionsbeing misunderstood. The question-sequence must be clear and smoothly-moving, meaning therebythat the relation of one question to another should be readily apparent to the respondent, with questionsthat are easiest to answer being put in the beginning. The first few questions are particularly importantbecause they are likely to influence the attitude of the respondent and in seeking his desiredcooperation. The opening questions should be such as to arouse human interest. The following typeof questions should generally be avoided as opening questions in a questionnaire:
1. questions that put too great a strain on the memory or intellect of the respondent;2. questions of a personal character;
3. questions related to personal wealth, etc.
Following the opening questions, we should have questions that are really vital to the researchproblem and a connecting thread should run through successive questions. Ideally, the question-sequence should conform to the respondent’s way of thinking. Knowing what information is desired,the researcher can rearrange the order of the questions (this is possible in case of unstructuredquestionnaire) to fit the discussion in each particular case. But in a structured questionnaire the bestthat can be done is to determine the question-sequence with the help of a Pilot Survey which is likelyto produce good rapport with most respondents. Relatively difficult questions must be relegatedtowards the end so that even if the respondent decides not to answer such questions, considerableinformation would have already been obtained. Thus, question-sequence should usually go from thegeneral to the more specific and the researcher must always remember that the answer to a givenquestion is a function not only of the question itself, but of all previous questions as well. For instance,if one question deals with the price usually paid for coffee and the next with reason for preferringthat particular brand, the answer to this latter question may be couched largely in terms of price-differences.3. Question formulation and wording:With regard to this aspect of questionnaire, the researchershould note that each question must be very clear for any sort of misunderstanding can do irreparableharm to a survey. Question should also be impartial in order not to give a biased picture of the truestate of affairs. Questions should be constructed with a view to their forming a logical part of a wellthought out tabulation plan. In general, all questions should meet the following standards—(a) shouldbe easily understood; (b) should be simple i.e., should convey only one thought at a time; (c) shouldbe concrete and should conform as much as possible to the respondent’s way of thinking. (For

Methods of Data Collection 103
instance, instead of asking. “How many razor blades do you use annually?” The more realisticquestion would be to ask, “How many razor blades did you use last week?”
Concerning the form of questions, we can talk about two principal forms, viz., multiple choicequestion and the open-end question. In the former the respondent selects one of the alternativepossible answers put to him, whereas in the latter he has to supply the answer in his own words. Thequestion with only two possible answers (usually ‘Yes’ or ‘No’) can be taken as a special case of themultiple choice question, or can be named as a ‘closed question.’ There are some advantages anddisadvantages of each possible form of question. Multiple choice or closed questions have theadvantages of easy handling, simple to answer, quick and relatively inexpensive to analyse. They aremost amenable to statistical analysis. Sometimes, the provision of alternative replies helps to makeclear the meaning of the question. But the main drawback of fixed alternative questions is that of“putting answers in people’s mouths” i.e., they may force a statement of opinion on an issue aboutwhich the respondent does not infact have any opinion. They are not appropriate when the issueunder consideration happens to be a complex one and also when the interest of the researcher is inthe exploration of a process. In such situations, open-ended questions which are designed to permita free response from the respondent rather than one limited to certain stated alternatives are consideredappropriate. Such questions give the respondent considerable latitude in phrasing a reply. Getting thereplies in respondent’s own words is, thus, the major advantage of open-ended questions. But oneshould not forget that, from an analytical point of view, open-ended questions are more difficult tohandle, raising problems of interpretation, comparability and interviewer bias.*
In practice, one rarely comes across a case when one questionnaire relies on one form ofquestions alone. The various forms complement each other. As such questions of different forms areincluded in one single questionnaire. For instance, multiple-choice questions constitute the basis of astructured questionnaire, particularly in a mail survey. But even there, various open-ended questionsare generally inserted to provide a more complete picture of the respondent’s feelings and attitudes.
Researcher must pay proper attention to the wordings of questions since reliable and meaningfulreturns depend on it to a large extent. Since words are likely to affect responses, they should beproperly chosen. Simple words, which are familiar to all respondents should be employed. Wordswith ambiguous meanings must be avoided. Similarly, danger words, catch-words or words withemotional connotations should be avoided. Caution must also be exercised in the use of phraseswhich reflect upon the prestige of the respondent. Question wording, in no case, should bias theanswer. In fact, question wording and formulation is an art and can only be learnt by practice.
Essentials of a good questionnaire: To be successful, questionnaire should be comparativelyshort and simple i.e., the size of the questionnaire should be kept to the minimum. Questions shouldproceed in logical sequence moving from easy to more difficult questions. Personal and intimatequestions should be left to the end. Technical terms and vague expressions capable of differentinterpretations should be avoided in a questionnaire. Questions may be dichotomous (yes or noanswers), multiple choice (alternative answers listed) or open-ended. The latter type of questions areoften difficult to analyse and hence should be avoided in a questionnaire to the extent possible. Thereshould be some control questions in the questionnaire which indicate the reliability of the respondent.For instance, a question designed to determine the consumption of particular material may be asked
* Interviewer bias refers to the extent to which an answer is altered in meaning by some action or attitude on the part ofthe interviewer.

104 Research Methodology
first in terms of financial expenditure and later in terms of weight. The control questions, thus,introduce a cross-check to see whether the information collected is correct or not. Questions affectingthe sentiments of respondents should be avoided. Adequate space for answers should be provided inthe questionnaire to help editing and tabulation. There should always be provision for indications ofuncertainty, e.g., “do not know,” “no preference” and so on. Brief directions with regard to filling upthe questionnaire should invariably be given in the questionnaire itself. Finally, the physical appearanceof the questionnaire affects the cooperation the researcher receives from the recipients and as suchan attractive looking questionnaire, particularly in mail surveys, is a plus point for enlisting cooperation.The quality of the paper, along with its colour, must be good so that it may attract the attention ofrecipients.
COLLECTION OF DATA THROUGH SCHEDULES
This method of data collection is very much like the collection of data through questionnaire, withlittle difference which lies in the fact that schedules (proforma containing a set of questions) arebeing filled in by the enumerators who are specially appointed for the purpose. These enumeratorsalong with schedules, go to respondents, put to them the questions from the proforma in the order thequestions are listed and record the replies in the space meant for the same in the proforma. In certainsituations, schedules may be handed over to respondents and enumerators may help them in recordingtheir answers to various questions in the said schedules. Enumerators explain the aims and objects ofthe investigation and also remove the difficulties which any respondent may feel in understanding theimplications of a particular question or the definition or concept of difficult terms.
This method requires the selection of enumerators for filling up schedules or assisting respondentsto fill up schedules and as such enumerators should be very carefully selected. The enumeratorsshould be trained to perform their job well and the nature and scope of the investigation should beexplained to them thoroughly so that they may well understand the implications of different questionsput in the schedule. Enumerators should be intelligent and must possess the capacity of cross-examination in order to find out the truth. Above all, they should be honest, sincere, hardworking andshould have patience and perseverance.
This method of data collection is very useful in extensive enquiries and can lead to fairly reliableresults. It is, however, very expensive and is usually adopted in investigations conducted by governmentalagencies or by some big organisations. Population census all over the world is conducted through thismethod.
DIFFERENCE BETWEEN QUESTIONNAIRES AND SCHEDULES
Both questionnaire and schedule are popularly used methods of collecting data in research surveys.There is much resemblance in the nature of these two methods and this fact has made many peopleto remark that from a practical point of view, the two methods can be taken to be the same. But fromthe technical point of view there is difference between the two. The important points of differenceare as under:
1. The questionnaire is generally sent through mail to informants to be answered as specifiedin a covering letter, but otherwise without further assistance from the sender. The schedule

Methods of Data Collection 105
is generally filled out by the research worker or the enumerator, who can interpret questionswhen necessary.
2. To collect data through questionnaire is relatively cheap and economical since we have tospend money only in preparing the questionnaire and in mailing the same to respondents.Here no field staff required. To collect data through schedules is relatively more expensivesince considerable amount of money has to be spent in appointing enumerators and inimporting training to them. Money is also spent in preparing schedules.
3. Non-response is usually high in case of questionnaire as many people do not respond andmany return the questionnaire without answering all questions. Bias due to non-responseoften remains indeterminate. As against this, non-response is generally very low in case ofschedules because these are filled by enumerators who are able to get answers to allquestions. But there remains the danger of interviewer bias and cheating.
4. In case of questionnaire, it is not always clear as to who replies, but in case of schedule theidentity of respondent is known.
5. The questionnaire method is likely to be very slow since many respondents do not returnthe questionnaire in time despite several reminders, but in case of schedules the informationis collected well in time as they are filled in by enumerators.
6. Personal contact is generally not possible in case of the questionnaire method asquestionnaires are sent to respondents by post who also in turn return the same by post.But in case of schedules direct personal contact is established with respondents.
7. Questionnaire method can be used only when respondents are literate and cooperative, butin case of schedules the information can be gathered even when the respondents happen tobe illiterate.
8. Wider and more representative distribution of sample is possible under the questionnairemethod, but in respect of schedules there usually remains the difficulty in sendingenumerators over a relatively wider area.
9. Risk of collecting incomplete and wrong information is relatively more under the questionnairemethod, particularly when people are unable to understand questions properly. But in caseof schedules, the information collected is generally complete and accurate as enumeratorscan remove the difficulties, if any, faced by respondents in correctly understanding thequestions. As a result, the information collected through schedules is relatively more accuratethan that obtained through questionnaires.
10. The success of questionnaire method lies more on the quality of the questionnaire itself, butin the case of schedules much depends upon the honesty and competence of enumerators.
11. In order to attract the attention of respondents, the physical appearance of questionnairemust be quite attractive, but this may not be so in case of schedules as they are to be filledin by enumerators and not by respondents.
12. Along with schedules, observation method can also be used but such a thing is not possiblewhile collecting data through questionnaires.

106 Research Methodology
SOME OTHER METHODS OF DATA COLLECTION
Let us consider some other methods of data collection, particularly used by big business houses inmodern times.
1. Warranty cards: Warranty cards are usually postal sized cards which are used by dealers ofconsumer durables to collect information regarding their products. The information sought is printedin the form of questions on the ‘warranty cards’ which is placed inside the package along with theproduct with a request to the consumer to fill in the card and post it back to the dealer.
2. Distributor or store audits: Distributor or store audits are performed by distributors as well asmanufactures through their salesmen at regular intervals. Distributors get the retail stores auditedthrough salesmen and use such information to estimate market size, market share, seasonal purchasingpattern and so on. The data are obtained in such audits not by questioning but by observation. Forinstance, in case of a grocery store audit, a sample of stores is visited periodically and data arerecorded on inventories on hand either by observation or copying from store records. Store audits areinvariably panel operations, for the derivation of sales estimates and compilation of sales trends bystores are their principal ‘raison detre’. The principal advantage of this method is that it offers themost efficient way of evaluating the effect on sales of variations of different techniques of in-storepromotion.3. Pantry audits: Pantry audit technique is used to estimate consumption of the basket of goods atthe consumer level. In this type of audit, the investigator collects an inventory of types, quantities andprices of commodities consumed. Thus in pantry audit data are recorded from the examination ofconsumer’s pantry. The usual objective in a pantry audit is to find out what types of consumers buycertain products and certain brands, the assumption being that the contents of the pantry accuratelyportray consumer’s preferences. Quite often, pantry audits are supplemented by direct questioningrelating to reasons and circumstances under which particular products were purchased in an attemptto relate these factors to purchasing habits. A pantry audit may or may not be set up as a paneloperation, since a single visit is often considered sufficient to yield an accurate picture of consumers’preferences. An important limitation of pantry audit approach is that, at times, it may not be possibleto identify consumers’ preferences from the audit data alone, particularly when promotion devicesproduce a marked rise in sales.4. Consumer panels:An extension of the pantry audit approach on a regular basis is known as‘consumer panel’, where a set of consumers are arranged to come to an understanding to maintaindetailed daily records of their consumption and the same is made available to investigator on demands.In other words, a consumer panel is essentially a sample of consumers who are interviewed repeatedlyover a period of time. Mostly consume panels are of two types viz., the transitory consumer paneland the continuing consumer panel. A transitory consumer panel is set up to measure the effect ofa particular phenomenon. Usually such a panel is conducted on a before-and-after-basis. Initial interviewsare conducted before the phenomenon takes place to record the attitude of the consumer. A secondset of interviews is carried out after the phenomenon has taken place to find out the consequentchanges that might have occurred in the consumer’s attitude. It is a favourite tool of advertising andof social research. A continuing consumer panel is often set up for an indefinite period with a viewto collect data on a particular aspect of consumer behaviour over time, generally at periodic intervalsor may be meant to serve as a general purpose panel for researchers on a variety of subjects. Suchpanels have been used in the area of consumer expenditure, public opinion and radio and TV listenership

Methods of Data Collection 107
among others. Most of these panels operate by mail. The representativeness of the panel relative tothe population and the effect of panel membership on the information obtained after the two majorproblems associated with the use of this method of data collection.5. Use of mechanical devices:The use of mechanical devices has been widely made to collectinformation by way of indirect means. Eye camera, Pupilometric camera, Psychogalvanometer,Motion picture camera and Audiometer are the principal devices so far developed and commonlyused by modern big business houses, mostly in the developed world for the purpose of collecting therequired information.
Eye cameras are designed to record the focus of eyes of a respondent on a specific portion of asketch or diagram or written material. Such an information is useful in designing advertising material.Pupilometric cameras record dilation of the pupil as a result of a visual stimulus. The extent ofdilation shows the degree of interest aroused by the stimulus. Psychogalvanometer is used for measuringthe extent of body excitement as a result of the visual stimulus. Motion picture cameras can be usedto record movement of body of a buyer while deciding to buy a consumer good from a shop or bigstore. Influence of packaging or the information given on the label would stimulate a buyer to performcertain physical movements which can easily be recorded by a hidden motion picture camera in theshop’s four walls. Audiometers are used by some TV concerns to find out the type of programmesas well as stations preferred by people. A device is fitted in the television instrument itself to recordthese changes. Such data may be used to find out the market share of competing television stations.
6. Projective techniques: Projective techniques (or what are sometimes called as indirectinterviewing techniques) for the collection of data have been developed by psychologists to useprojections of respondents for inferring about underlying motives, urges, or intentions which are suchthat the respondent either resists to reveal them or is unable to figure out himself. In projectivetechniques the respondent in supplying information tends unconsciously to project his own attitudesor feelings on the subject under study. Projective techniques play an important role in motivationalresearches or in attitude surveys.
The use of these techniques requires intensive specialised training. In such techniques, theindividual’s responses to the stimulus-situation are not taken at their face value. The stimuli mayarouse many different kinds of reactions. The nature of the stimuli and the way in which they arepresented under these techniques do not clearly indicate the way in which the response is to beinterpreted. The stimulus may be a photograph, a picture, an inkblot and so on. Responses to thesestimuli are interpreted as indicating the individual’s own view, his personality structure, his needs,tensions, etc. in the context of some pre-established psychological conceptualisation of what theindividual’s responses to the stimulus mean.
We may now briefly deal with the important projective techniques.
(i) Word association tests:These tests are used to extract information regarding such words whichhave maximum association. In this sort of test the respondent is asked to mention the first word thatcomes to mind, ostensibly without thinking, as the interviewer reads out each word from a list. If theinterviewer says cold, the respondent may say hot and the like ones. The general technique is to usea list of as many as 50 to 100 words. Analysis of the matching words supplied by the respondentsindicates whether the given word should be used for the contemplated purpose. The same idea isexploited in marketing research to find out the quality that is mostly associated to a brand of aproduct. A number of qualities of a product may be listed and informants may be asked to write

108 Research Methodology
brand names possessing one or more of these. This technique is quick and easy to use, but yieldsreliable results when applied to words that are widely known and which possess essentially one typeof meaning. This technique is frequently used in advertising research.(ii) Sentence completion tests:These tests happen to be an extension of the technique of wordassociation tests. Under this, informant may be asked to complete a sentence (such as: persons whowear Khadi are...) to find association of Khadi clothes with certain personality characteristics. Severalsentences of this type might be put to the informant on the same subject. Analysis of replies from thesame informant reveals his attitude toward that subject, and the combination of these attitudes of allthe sample members is then taken to reflect the views of the population. This technique permits thetesting not only of words (as in case of word association tests), but of ideas as well and thus, helps indeveloping hypotheses and in the construction of questionnaires. This technique is also quick andeasy to use, but it often leads to analytical problems, particularly when the response happens to bemultidimensional.(iii) Story completion tests:Such tests are a step further wherein the researcher may contrivestories instead of sentences and ask the informants to complete them. The respondent is given justenough of story to focus his attention on a given subject and he is asked to supply a conclusion to thestory.
(iv) Verbal projection tests:These are the tests wherein the respondent is asked to comment on orto explain what other people do. For example, why do people smoke? Answers may reveal therespondent’s own motivations.(v) Pictorial techniques:There are several pictorial techniques. The important ones are as follows:
(a) Thematic apperception test (T.A.T.):The TAT consists of a set of pictures (some of thepictures deal with the ordinary day-to-day events while others may be ambiguous picturesof unusual situations) that are shown to respondents who are asked to describe what theythink the pictures represent. The replies of respondents constitute the basis for the investigatorto draw inferences about their personality structure, attitudes, etc.
(b) Rosenzweig test:This test uses a cartoon format wherein we have a series of cartoonswith words inserted in ‘balloons’ above. The respondent is asked to put his own words inan empty balloon space provided for the purpose in the picture. From what the respondentswrite in this fashion, the study of their attitudes can be made.
(c) Rorschach test:This test consists of ten cards having prints of inkblots. The design happensto be symmetrical but meaningless. The respondents are asked to describe what theyperceive in such symmetrical inkblots and the responses are interpreted on the basis ofsome pre-determined psychological framework. This test is frequently used but the problemof validity still remains a major problem of this test.
(d) Holtzman Inkblot Test (HIT):This test from W.H. Holtzman is a modification of theRorschach Test explained above. This test consists of 45 inkblot cards (and not 10 inkblotsas we find in case of Rorschach Test) which are based on colour, movement, shading andother factors involved in inkblot perception. Only one response per card is obtained fromthe subject (or the respondent) and the responses of a subject are interpreted at three levels ofform appropriateness. Form responses are interpreted for knowing the accuracy (F) orinaccuracy (F–) of respondent’s percepts; shading and colour for ascertaining his affectionaland emotional needs; and movement responses for assessing the dynamic aspects of his life.

Methods of Data Collection 109
Holtzman Inkblot Test or H.I.T. has several special features or advantages. For example, itelicits relatively constant number of responses per respondent. Secondly, it facilitates studyingthe responses of a respondent to different cards in the light of norms of each card instead oflumping them together. Thirdly, it elicits much more information from the respondent then ispossible with merely 10 cards in Rorschach test; the 45 cards used in this test provide avariety of stimuli to the respondent and as such the range of responses elicited by the test iscomparatively wider.There are some limitations of this test as well. One difficulty that remains in using this test isthat most of the respondents do not know the determinants of their perceptions, but for theresearcher, who has to interpret the protocols of a subject and understand his personality (orattitude) through them, knowing the determinant of each of his response is a must. This factemphasises that the test must be administered individually and a post-test inquiry must as wellbe conducted for knowing the nature and sources of responses and this limits the scope ofHIT as a group test of personality. Not only this, “the usefulness of HIT for purposes ofpersonal selection, vocational guidance, etc. is still to be established.”1
In view of these limitations, some people have made certain changes in applying this test. Forinstance, Fisher and Cleveland in their approach for obtaining Barrier score of an individual’spersonality have developed a series of multiple choice items for 40 of HIT cards. Each ofthese cards is presented to the subject along with three acceptable choices [such as ‘Knightin armour’ (Barrier response), ‘X-Ray’ (Penetrating response) and ‘Flower’ (Neutralresponse)]. Subject taking the test is to check the choice he likes most, make a different markagainst the one he likes least and leave the third choice blank. The number of barrier responseschecked by him determines his barrier score on the test.(e) Tomkins-Horn picture arrangement test: This test is designed for group administration.
It consists of twenty-five plates, each containing three sketches that may be arranged indifferent ways to portray sequence of events. The respondent is asked to arrange them ina sequence which he considers as reasonable. The responses are interpreted as providingevidence confirming certain norms, respondent’s attitudes, etc.
(vi) Play techniques:Under play techniques subjects are asked to improvise or act out a situationin which they have been assigned various roles. The researcher may observe such traits as hostility,dominance, sympathy, prejudice or the absence of such traits. These techniques have been used forknowing the attitudes of younger ones through manipulation of dolls. Dolls representing differentracial groups are usually given to children who are allowed to play with them freely. The manner inwhich children organise dolls would indicate their attitude towards the class of persons representedby dolls. This is also known as doll-play test, and is used frequently in studies pertaining to sociology.The choice of colour, form, words, the sense of orderliness and other reactions may provide opportunitiesto infer deep-seated feelings.(vii) Quizzes, tests and examinations:This is also a technique of extracting information regardingspecific ability of candidates indirectly. In this procedure both long and short questions are framed totest through them the memorising and analytical ability of candidates.(viii) Sociometry:Sociometry is a technique for describing the social relationships among individualsin a group. In an indirect way, sociometry attempts to describe attractions or repulsions between
1 S.L. Dass, “Personality Assessment Through Projective Movie Pictures”, p. 17.

110 Research Methodology
individuals by asking them to indicate whom they would choose or reject in various situations. Thus,sociometry is a new technique of studying the underlying motives of respondents. “Under this anattempt is made to trace the flow of information amongst groups and then examine the ways in whichnew ideas are diffused. Sociograms are constructed to identify leaders and followers.”2 Sociogramsare charts that depict the sociometric choices. There are many versions of the sociogram pattern andthe reader is suggested to consult specialised references on sociometry for the purpose. This approachhas been applied to the diffusion of ideas on drugs amongst medical practitioners.
7. Depth interviews: Depth interviews are those interviews that are designed to discover underlyingmotives and desires and are often used in motivational research. Such interviews are held to exploreneeds, desires and feelings of respondents. In other words, they aim to elicit unconscious as alsoother types of material relating especially to personality dynamics and motivations. As such, depthinterviews require great skill on the part of the interviewer and at the same time involve considerabletime. Unless the researcher has specialised training, depth interviewing should not be attempted.
Depth interview may be projective in nature or it may be a non-projective interview. The differencelies in the nature of the questions asked. Indirect questions on seemingly irrelevant subjects provideinformation that can be related to the informant’s behaviour or attitude towards the subject understudy. Thus, for instance, the informant may be asked on his frequency of air travel and he mightagain be asked at a later stage to narrate his opinion concerning the feelings of relatives of someother man who gets killed in an airplane accident. Reluctance to fly can then be related to replies toquestions of the latter nature. If the depth interview involves questions of such type, the same may betreated as projective depth interview. But in order to be useful, depth interviews do not necessarilyhave to be projective in nature; even non-projective depth interviews can reveal important aspects ofpsycho-social situation for understanding the attitudes of people.8. Content-analysis: Content-analysis consists of analysing the contents of documentary materialssuch as books, magazines, newspapers and the contents of all other verbal materials which can beeither spoken or printed. Content-analysis prior to 1940’s was mostly quantitative analysis ofdocumentary materials concerning certain characteristics that can be identified and counted. Butsince 1950’s content-analysis is mostly qualitative analysis concerning the general import or messageof the existing documents. “The difference is somewhat like that between a casual interview anddepth interviewing.”3 Bernard Berelson’s name is often associated with. the latter type of content-analysis. “Content-analysis is measurement through proportion…. Content analysis measurespervasiveness and that is sometimes an index of the intensity of the force.”4
The analysis of content is a central activity whenever one is concerned with the study of thenature of the verbal materials. A review of research in any area, for instance, involves the analysisof the contents of research articles that have been published. The analysis may be at a relativelysimple level or may be a subtle one. It is at a simple level when we pursue it on the basis of certaincharacteristics of the document or verbal materials that can be identified and counted (such as on thebasis of major scientific concepts in a book). It is at a subtle level when researcher makes a study ofthe attitude, say of the press towards education by feature writers.
2 G.B. Giles, Marketing, p. 40–41.3 Carter V. Good and Douglas E. Scates, Methods of Research, p. 670.4 Ibid., p. 670.

Methods of Data Collection 111
COLLECTION OF SECONDARY DATA
Secondary data means data that are already available i.e., they refer to the data which have alreadybeen collected and analysed by someone else. When the researcher utilises secondary data, then hehas to look into various sources from where he can obtain them. In this case he is certainly notconfronted with the problems that are usually associated with the collection of original data. Secondarydata may either be published data or unpublished data. Usually published data are available in: (a)various publications of the central, state are local governments; (b) various publications of foreigngovernments or of international bodies and their subsidiary organisations; (c) technical and tradejournals; (d) books, magazines and newspapers; (e) reports and publications of various associationsconnected with business and industry, banks, stock exchanges, etc.; (f) reports prepared by researchscholars, universities, economists, etc. in different fields; and (g) public records and statistics, historicaldocuments, and other sources of published information. The sources of unpublished data are many;they may be found in diaries, letters, unpublished biographies and autobiographies and also may beavailable with scholars and research workers, trade associations, labour bureaus and other public/private individuals and organisations.
Researcher must be very careful in using secondary data. He must make a minute scrutinybecause it is just possible that the secondary data may be unsuitable or may be inadequate in thecontext of the problem which the researcher wants to study. In this connection Dr. A.L. Bowleyvery aptly observes that it is never safe to take published statistics at their face value without knowingtheir meaning and limitations and it is always necessary to criticise arguments that can be based onthem.
By way of caution, the researcher, before using secondary data, must see that they possessfollowing characteristics:
1. Reliability of data: The reliability can be tested by finding out such things about the said data:(a) Who collected the data? (b) What were the sources of data? (c) Were they collected by usingproper methods (d) At what time were they collected?(e) Was there any bias of the compiler?(t) What level of accuracy was desired? Was it achieved ?2. Suitability of data: The data that are suitable for one enquiry may not necessarily be foundsuitable in another enquiry. Hence, if the available data are found to be unsuitable, they should not beused by the researcher. In this context, the researcher must very carefully scrutinise the definition ofvarious terms and units of collection used at the time of collecting the data from the primary sourceoriginally. Similarly, the object, scope and nature of the original enquiry must also be studied. If theresearcher finds differences in these, the data will remain unsuitable for the present enquiry andshould not be used.
3. Adequacy of data: If the level of accuracy achieved in data is found inadequate for the purposeof the present enquiry, they will be considered as inadequate and should not be used by the researcher.The data will also be considered inadequate, if they are related to an area which may be eithernarrower or wider than the area of the present enquiry.
From all this we can say that it is very risky to use the already available data. The alreadyavailable data should be used by the researcher only when he finds them reliable, suitable andadequate. But he should not blindly discard the use of such data if they are readily available fromauthentic sources and are also suitable and adequate for in that case it will not be economical to
112 Research Methodology
spend time and energy in field surveys for collecting information. At times, there may be wealth ofusable information in the already available data which must be used by an intelligent researcher butwith due precaution.
SELECTION OF APPROPRIATE METHOD FOR DATA COLLECTION
Thus, there are various methods of data collection. As such the researcher must judiciously selectthe method/methods for his own study, keeping in view the following factors:
1. Nature, scope and object of enquiry:This constitutes the most important factor affecting thechoice of a particular method. The method selected should be such that it suits the type of enquirythat is to be conducted by the researcher. This factor is also important in deciding whether the dataalready available (secondary data) are to be used or the data not yet available (primary data) are tobe collected.2. Availability of funds: Availability of funds for the research project determines to a large extentthe method to be used for the collection of data. When funds at the disposal of the researcher arevery limited, he will have to select a comparatively cheaper method which may not be as efficientand effective as some other costly method. Finance, in fact, is a big constraint in practice and theresearcher has to act within this limitation.3. Time factor: Availability of time has also to be taken into account in deciding a particular methodof data collection. Some methods take relatively more time, whereas with others the data can becollected in a comparatively shorter duration. The time at the disposal of the researcher, thus, affectsthe selection of the method by which the data are to be collected.4. Precision required: Precision required is yet another important factor to be considered at thetime of selecting the method of collection of data.
But one must always remember that each method of data collection has its uses and none issuperior in all situations. For instance, telephone interview method may be considered appropriate(assuming telephone population) if funds are restricted, time is also restricted and the data is to becollected in respect of few items with or without a certain degree of precision. In case funds permitand more information is desired, personal interview method may be said to be relatively better. Incase time is ample, funds are limited and much information is to be gathered with no precision, thenmail-questionnaire method can be regarded more reasonable. When funds are ample, time is alsoample and much information with no precision is to be collected, then either personal interview or themail-questionnaire or the joint use of these two methods may be taken as an appropriate method ofcollecting data. Where a wide geographic area is to be covered, the use of mail-questionnairessupplemented by personal interviews will yield more reliable results per rupee spent than eithermethod alone. The secondary data may be used in case the researcher finds them reliable, adequateand appropriate for his research. While studying motivating influences in market researches or studyingpeople’s attitudes in psychological/social surveys, we can resort to the use of one or more of theprojective techniques stated earlier. Such techniques are of immense value in case the reason isobtainable from the respondent who knows the reason but does not want to admit it or the reasonrelates to some underlying psychological attitude and the respondent is not aware of it. But when therespondent knows the reason and can tell the same if asked, than a non-projective questionnaire,

Methods of Data Collection 113
using direct questions, may yield satisfactory results even in case of attitude surveys. Since projectivetechniques are as yet in an early stage of development and with the validity of many of them remainingan open question, it is usually considered better to rely on the straight forward statistical methodswith only supplementary use of projective techniques. Nevertheless, in pre-testing and in searchingfor hypotheses they can be highly valuable.
Thus, the most desirable approach with regard to the selection of the method depends on thenature of the particular problem and on the time and resources (money and personnel) availablealong with the desired degree of accuracy. But, over and above all this, much depends upon theability and experience of the researcher. Dr. A.L. Bowley’s remark in this context is very appropriatewhen he says that “in collection of statistical data common sense is the chief requisite and experiencethe chief teacher.”
CASE STUDY METHOD
Meaning: The case study method is a very popular form of qualitative analysis and involves acareful and complete observation of a social unit, be that unit a person, a family, an institution, acultural group or even the entire community. It is a method of study in depth rather than breadth. Thecase study places more emphasis on the full analysis of a limited number of events or conditions andtheir interrelations. The case study deals with the processes that take place and their interrelationship.Thus, case study is essentially an intensive investigation of the particular unit under consideration.The object of the case study method is to locate the factors that account for the behaviour-patternsof the given unit as an integrated totality.
According to H. Odum, “The case study method is a technique by which individual factor whetherit be an institution or just an episode in the life of an individual or a group is analysed in its relationshipto any other in the group.”5 Thus, a fairly exhaustive study of a person (as to what he does and hasdone, what he thinks he does and had done and what he expects to do and says he ought to do) orgroup is called a life or case history. Burgess has used the words “the social microscope” for thecase study method.”6 Pauline V. Young describes case study as “a comprehensive study of a socialunit be that unit a person, a group, a social institution, a district or a community.”7 In brief, we can saythat case study method is a form of qualitative analysis where in careful and complete observation ofan individual or a situation or an institution is done; efforts are made to study each and every aspectof the concerning unit in minute details and then from case data generalisations and inferences aredrawn.
Characteristics: The important characteristics of the case study method are as under:1. Under this method the researcher can take one single social unit or more of such units for
his study purpose; he may even take a situation to study the same comprehensively.
2. Here the selected unit is studied intensively i.e., it is studied in minute details. Generally, thestudy extends over a long period of time to ascertain the natural history of the unit so as toobtain enough information for drawing correct inferences.
5 H. Odum, An Introduction to Social Research, p. 229.6 Burgess, Research Methods in Sociology, p. 26 in Georges Gurvitch and W.E. Moore (Eds.) Twentieth Century
Sociology.7 Pauline V. Young, Scientific Social Surveys and Research, p. 247.

114 Research Methodology
3. In the context of this method we make complete study of the social unit covering all facets.Through this method we try to understand the complex of factors that are operative withina social unit as an integrated totality.
4 Under this method the approach happens to be qualitative and not quantitative. Merequantitative information is not collected. Every possible effort is made to collect informationconcerning all aspects of life. As such, case study deepens our perception and gives us aclear insight into life. For instance, under this method we not only study how many crimesa man has done but shall peep into the factors that forced him to commit crimes when weare making a case study of a man as a criminal. The objective of the study may be tosuggest ways to reform the criminal.
5. In respect of the case study method an effort is made to know the mutual inter-relationshipof causal factors.
6. Under case study method the behaviour pattern of the concerning unit is studied directlyand not by an indirect and abstract approach.
7. Case study method results in fruitful hypotheses along with the data which may be helpfulin testing them, and thus it enables the generalised knowledge to get richer and richer. In itsabsence, generalised social science may get handicapped.
Evolution and scope: The case study method is a widely used systematic field research techniquein sociology these days. The credit for introducing this method to the field of social investigation goesto Frederic Le Play who used it as a hand-maiden to statistics in his studies of family budgets.Herbert Spencer was the first to use case material in his comparative study of different cultures. Dr.William Healy resorted to this method in his study of juvenile delinquency, and considered it as abetter method over and above the mere use of statistical data. Similarly, anthropologists, historians,novelists and dramatists have used this method concerning problems pertaining to their areas ofinterests. Even management experts use case study methods for getting clues to several managementproblems. In brief, case study method is being used in several disciplines. Not only this, its use isincreasing day by day.Assumptions: The case study method is based on several assumptions. The important assumptionsmay be listed as follows:
(i) The assumption of uniformity in the basic human nature in spite of the fact that humanbehaviour may vary according to situations.
(ii) The assumption of studying the natural history of the unit concerned.(iii) The assumption of comprehensive study of the unit concerned.
Major phases involved: Major phases involved in case study are as follows:
(i) Recognition and determination of the status of the phenomenon to be investigated or theunit of attention.
(ii) Collection of data, examination and history of the given phenomenon.(iii) Diagnosis and identification of causal factors as a basis for remedial or developmental
treatment.(iv) Application of remedial measures i.e., treatment and therapy (this phase is often characterised
as case work).

Methods of Data Collection 115
(v) Follow-up programme to determine effectiveness of the treatment applied.
Advantages: There are several advantages of the case study method that follow from the variouscharacteristics outlined above. Mention may be made here of the important advantages.
(i) Being an exhaustive study of a social unit, the case study method enables us to understandfully the behaviour pattern of the concerned unit. In the words of Charles Horton Cooley,“case study deepens our perception and gives us a clearer insight into life…. It gets atbehaviour directly and not by an indirect and abstract approach.”
(ii) Through case study a researcher can obtain a real and enlightened record of personalexperiences which would reveal man’s inner strivings, tensions and motivations that drivehim to action along with the forces that direct him to adopt a certain pattern of behaviour.
(iii) This method enables the researcher to trace out the natural history of the social unit and itsrelationship with the social factors and the forces involved in its surrounding environment.
(iv) It helps in formulating relevant hypotheses along with the data which may be helpful intesting them. Case studies, thus, enable the generalised knowledge to get richer and richer.
(v) The method facilitates intensive study of social units which is generally not possible if weuse either the observation method or the method of collecting information through schedules.This is the reason why case study method is being frequently used, particularly in socialresearches.
(vi) Information collected under the case study method helps a lot to the researcher in the taskof constructing the appropriate questionnaire or schedule for the said task requires thoroughknowledge of the concerning universe.
(vii) The researcher can use one or more of the several research methods under the case studymethod depending upon the prevalent circumstances. In other words, the use of differentmethods such as depth interviews, questionnaires, documents, study reports of individuals,letters, and the like is possible under case study method.
(viii) Case study method has proved beneficial in determining the nature of units to be studiedalong with the nature of the universe. This is the reason why at times the case studymethod is alternatively known as “mode of organising data”.
(ix) This method is a means to well understand the past of a social unit because of its emphasisof historical analysis. Besides, it is also a technique to suggest measures for improvementin the context of the present environment of the concerned social units.
(x) Case studies constitute the perfect type of sociological material as they represent a realrecord of personal experiences which very often escape the attention of most of the skilledresearchers using other techniques.
(xi) Case study method enhances the experience of the researcher and this in turn increaseshis analysing ability and skill.
(xii) This method makes possible the study of social changes. On account of the minute study ofthe different facets of a social unit, the researcher can well understand the social changethen and now. This also facilitates the drawing of inferences and helps in maintaining thecontinuity of the research process. In fact, it may be considered the gateway to and at thesame time the final destination of abstract knowledge.

116 Research Methodology
(xiii) Case study techniques are indispensable for therapeutic and administrative purposes. Theyare also of immense value in taking decisions regarding several management problems.Case data are quite useful for diagnosis, therapy and other practical case problems.
Limitations: Important limitations of the case study method may as well be highlighted.
(i) Case situations are seldom comparable and as such the information gathered in case studiesis often not comparable. Since the subject under case study tells history in his own words,logical concepts and units of scientific classification have to be read into it or out of it by theinvestigator.
(ii) Read Bain does not consider the case data as significant scientific data since they do notprovide knowledge of the “impersonal, universal, non-ethical, non-practical, repetitive aspectsof phenomena.”8 Real information is often not collected because the subjectivity of theresearcher does enter in the collection of information in a case study.
(iii) The danger of false generalisation is always there in view of the fact that no set rules arefollowed in collection of the information and only few units are studied.
(iv) It consumes more time and requires lot of expenditure. More time is needed under casestudy method since one studies the natural history cycles of social units and that too minutely.
(v) The case data are often vitiated because the subject, according to Read Bain, may writewhat he thinks the investigator wants; and the greater the rapport, the more subjective thewhole process is.
(vi) Case study method is based on several assumptions which may not be very realistic attimes, and as such the usefulness of case data is always subject to doubt.
(vii) Case study method can be used only in a limited sphere., it is not possible to use it in caseof a big society. Sampling is also not possible under a case study method.
(viii) Response of the investigator is an important limitation of the case study method. He oftenthinks that he has full knowledge of the unit and can himself answer about it. In case thesame is not true, then consequences follow. In fact, this is more the fault of the researcherrather than that of the case method.
Conclusion: Despite the above stated limitations, we find that case studies are being undertaken inseveral disciplines, particularly in sociology, as a tool of scientific research in view of the severaladvantages indicated earlier. Most of the limitations can be removed if researchers are alwaysconscious of these and are well trained in the modern methods of collecting case data and in thescientific techniques of assembling, classifying and processing the same. Besides, case studies, inmodern times, can be conducted in such a manner that the data are amenable to quantification andstatistical treatment. Possibly, this is also the reason why case studies are becoming popular day by day.
Question
1. Enumerate the different methods of collecting data. Which one is the most suitable for conductingenquiry regarding family welfare programme in India? Explain its merits and demerits.
8 Pauline V. Young, Scientific social surveys and research, p. 262.
Methods of Data Collection 117
2. “It is never safe to take published statistics at their face value without knowing their meaning andlimitations.” Elucidate this statement by enumerating and explaining the various points which you wouldconsider before using any published data. Illustrate your answer by examples wherever possible.
3. Examine the merits and limitations of the observation method in collecting material. Illustrate your answerwith suitable examples.
4. Describe some of the major projective techniques and evaluate their significance as tools of scientificsocial research.
5. How does the case study method differ from the survey method? Analyse the merits and limitations ofcase study method in sociological research.
6. Clearly explain the difference between collection of data through questionnaires and schedules.7. Discuss interview as a technique of data collection.8. Write short notes on:
(a) Depth interviews;(b) Important aspects of a questionnaire;(c) Pantry and store audits;
(d) Thematic Apperception Test;(e) Holtzman Inkbolt Test.
9. What are the guiding considerations in the construction of questionnaire? Explain.
10. Critically examine the following:(i) Interviews introduce more bias than does the use of questionnaire.(ii) Data collection through projective techniques is considered relatively more reliable.(iii) In collection of statistical data commonsense is the chief requisite and experience the chief teacher.
11. Distinguish between an experiment and survey. Explain fully the survey method of research.[M. Phi. (EAFM) Exam. 1987 Raj. Uni.]
12. “Experimental method of research is not suitable in management field.” Discuss, what are the problems inthe introduction of this research design in business organisation?
[M.B.A. (Part I) Exam. 1985 Raj. Uni.]

118 Research Methodology
Appendix (i)
Guidelines for ConstructingQuestionnaire/Schedule
The researcher must pay attention to the following points in constructing an appropriate and effectivequestionnaire or a schedule:
1. The researcher must keep in view the problem he is to study for it provides the startingpoint for developing the Questionnaire/Schedule. He must be clear about the various aspectsof his research problem to be dealt with in the course of his research project.
2. Appropriate form of questions depends on the nature of information sought, the sampledrespondents and the kind of analysis intended. The researcher must decide whether to useclosed or open-ended question. Questions should be simple and must be constructed with aview to their forming a logical part of a well thought out tabulation plan. The units ofenumeration should also be defined precisely so that they can ensure accurate and fullinformation.
3. Rough draft of the Questionnaire/Schedule be prepared, giving due thought to the appropriatesequence of putting questions. Questionnaires or schedules previously drafted (if available)may as well be looked into at this stage.
4. Researcher must invariably re-examine, and in case of need may revise the rough draft fora better one. Technical defects must be minutely scrutinised and removed.
5. Pilot study should be undertaken for pre-testing the questionnaire. The questionnaire maybe edited in the light of the results of the pilot study.
6. Questionnaire must contain simple but straight forward directions for the respondents sothat they may not feel any difficulty in answering the questions.

Appendix (ii): Guidelines for Successful Interviewing119
Appendix (ii)
Guidelines for SuccessfulInterviewing
Interviewing is an art and one learns it by experience. However, the following points may be kept inview by an interviewer for eliciting the desired information:
1. Interviewer must plan in advance and should fully know the problem under consideration.He must choose a suitable time and place so that the interviewee may be at ease during theinterview period. For this purpose some knowledge of the daily routine of the intervieweeis essential.
2. Interviewer’s approach must be friendly and informal. Initially friendly greetings inaccordance with the cultural pattern of the interviewee should be exchanged and then thepurpose of the interview should be explained.
3. All possible effort should be made to establish proper rapport with the interviewee; peopleare motivated to communicate when the atmosphere is favourable.
4. Interviewer must know that ability to listen with understanding, respect and curiosity is thegateway to communication, and hence must act accordingly during the interview. For allthis, the interviewer must be intelligent and must be a man with self-restraint and self-discipline.
5. To the extent possible there should be a free-flowing interview and the questions must bewell phrased in order to have full cooperation of the interviewee. But the interviewer mustcontrol the course of the interview in accordance with the objective of the study.
6. In case of big enquiries, where the task of collecting information is to be accomplished byseveral interviewers, there should be an interview guide to be observed by all so as toensure reasonable uniformity in respect of all salient points in the study.

120 Research Methodology
Appendix (iii)
Difference BetweenSurvey and Experiment
The following points are noteworthy so far as difference between survey and experiment is concerned:
(i) Surveys are conducted in case of descriptive research studies where as experiments are apart of experimental research studies.
(ii) Survey-type research studies usually have larger samples because the percentage ofresponses generally happens to be low, as low as 20 to 30%, especially in mailed questionnairestudies. Thus, the survey method gathers data from a relatively large number of cases at aparticular time; it is essentially cross-sectional. As against this, experimental studies generallyneed small samples.
(iii) Surveys are concerned with describing, recording, analysing and interpreting conditionsthat either exist or existed. The researcher does not manipulate the variable or arrange forevents to happen. Surveys are only concerned with conditions or relationships that exist,opinions that are held, processes that are going on, effects that are evident or trends thatare developing. They are primarily concerned with the present but at times do considerpast events and influences as they relate to current conditions. Thus, in surveys, variablesthat exist or have already occurred are selected and observed.Experimental research provides a systematic and logical method for answering the question,“What will happen if this is done when certain variables are carefully controlled ormanipulated?” In fact, deliberate manipulation is a part of the experimental method. In anexperiment, the researcher measures the effects of an experiment which he conductsintentionally.
(iv) Surveys are usually appropriate in case of social and behavioural sciences (because manytypes of behaviour that interest the researcher cannot be arranged in a realistic setting)where as experiments are mostly an essential feature of physical and natural sciences.
(v) Surveys are an example of field research where as experiments generally constitute anexample of laboratory research.

Appendix (iii): Difference Between Survey and Experiment 121
(vi) Surveys are concerned with hypothesis formulation and testing the analysis of the relationshipbetween non-manipulated variables. Experimentation provides a method of hypothesis testing.After experimenters define a problem, they propose a hypothesis. They then test thehypothesis and confirm or disconfirm it in the light of the controlled variable relationshipthat they have observed. The confirmation or rejection is always stated in terms of probabilityrather than certainty. Experimentation, thus, is the most sophisticated, exacting and powerfulmethod for discovering and developing an organised body of knowledge. The ultimatepurpose of experimentation is to generalise the variable relationships so that they may beapplied outside the laboratory to a wider population of interest.*
(vii) Surveys may either be census or sample surveys. They may also be classified as socialsurveys, economic surveys or public opinion surveys. Whatever be their type, the methodof data collection happens to be either observation, or interview or questionnaire/opinionnaireor some projective technique(s). Case study method can as well be used. But in case ofexperiments, data are collected from several readings of experiments.
(viii) In case of surveys, research design must be rigid, must make enough provision for protectionagainst bias and must maximise reliability as the aim happens to be to obtain complete andaccurate information. Research design in case of experimental studies, apart reducing biasand ensuring reliability, must permit drawing inferences about causality.
(ix) Possible relationships between the data and the unknowns in the universe can be studiedthrough surveys where as experiments are meant to determine such relationships.
(x) Causal analysis is considered relatively more important in experiments where as in mostsocial and business surveys our interest lies in understanding and controlling relationshipsbetween variables and as such correlation analysis is relatively more important in surveys.
* John W. Best and James V. Kahn, “Research in Education”, 5th ed., Prentice-Hall of India Pvt. Ltd., New Delhi, 1986,p.111.

122 Research Methodology
7
Processing and Analysis of Data
The data, after collection, has to be processed and analysed in accordance with the outline laid downfor the purpose at the time of developing the research plan. This is essential for a scientific study andfor ensuring that we have all relevant data for making contemplated comparisons and analysis.Technically speaking, processing implies editing, coding, classification and tabulation of collecteddata so that they are amenable to analysis. The term analysis refers to the computation of certainmeasures along with searching for patterns of relationship that exist among data-groups. Thus, “inthe process of analysis, relationships or differences supporting or conflicting with original or newhypotheses should be subjected to statistical tests of significance to determine with what validity datacan be said to indicate any conclusions”.1 But there are persons (Selltiz, Jahoda and others) who donot like to make difference between processing and analysis. They opine that analysis of data in ageneral way involves a number of closely related operations which are performed with the purposeof summarising the collected data and organising these in such a manner that they answer theresearch question(s). We, however, shall prefer to observe the difference between the two terms asstated here in order to understand their implications more clearly.
PROCESSING OPERATIONS
With this brief introduction concerning the concepts of processing and analysis, we can now proceedwith the explanation of all the processing operations.
1. Editing: Editing of data is a process of examining the collected raw data (specially in surveys) todetect errors and omissions and to correct these when possible. As a matter of fact, editing involvesa careful scrutiny of the completed questionnaires and/or schedules. Editing is done to assure that thedata are accurate, consistent with other facts gathered, uniformly entered, as completed as possibleand have been well arranged to facilitate coding and tabulation.
With regard to points or stages at which editing should be done, one can talk of field editing andcentral editing. Field editing consists in the review of the reporting forms by the investigator forcompleting (translating or rewriting) what the latter has written in abbreviated and/or in illegible form
1 G.B. Giles, Marketing, p. 44.

Processing and Analysis of Data 123
at the time of recording the respondents’ responses. This type of editing is necessary in view of thefact that individual writing styles often can be difficult for others to decipher. This sort of editingshould be done as soon as possible after the interview, preferably on the very day or on the next day.While doing field editing, the investigator must restrain himself and must not correct errors of omissionby simply guessing what the informant would have said if the question had been asked.
Central editing should take place when all forms or schedules have been completed and returnedto the office. This type of editing implies that all forms should get a thorough editing by a single editorin a small study and by a team of editors in case of a large inquiry. Editor(s) may correct the obviouserrors such as an entry in the wrong place, entry recorded in months when it should have beenrecorded in weeks, and the like. In case of inappropriate on missing replies, the editor can sometimesdetermine the proper answer by reviewing the other information in the schedule. At times, therespondent can be contacted for clarification. The editor must strike out the answer if the same isinappropriate and he has no basis for determining the correct answer or the response. In such a casean editing entry of ‘no answer’ is called for. All the wrong replies, which are quite obvious, must bedropped from the final results, especially in the context of mail surveys.
Editors must keep in view several points while performing their work: (a) They should be familiarwith instructions given to the interviewers and coders as well as with the editing instructions suppliedto them for the purpose. (b) While crossing out an original entry for one reason or another, theyshould just draw a single line on it so that the same may remain legible. (c) They must make entries(if any) on the form in some distinctive colur and that too in a standardised form. (d) They shouldinitial all answers which they change or supply. (e) Editor’s initials and the date of editing should beplaced on each completed form or schedule.
2. Coding: Coding refers to the process of assigning numerals or other symbols to answers so thatresponses can be put into a limited number of categories or classes. Such classes should be appropriateto the research problem under consideration. They must also possess the characteristic ofexhaustiveness (i.e., there must be a class for every data item) and also that of mutual exclusivelywhich means that a specific answer can be placed in one and only one cell in a given category set.Another rule to be observed is that of unidimensionality by which is meant that every class is definedin terms of only one concept.
Coding is necessary for efficient analysis and through it the several replies may be reduced to asmall number of classes which contain the critical information required for analysis. Coding decisionsshould usually be taken at the designing stage of the questionnaire. This makes it possible to precodethe questionnaire choices and which in turn is helpful for computer tabulation as one can straightforward key punch from the original questionnaires. But in case of hand coding some standardmethod may be used. One such standard method is to code in the margin with a coloured pencil. Theother method can be to transcribe the data from the questionnaire to a coding sheet. Whatevermethod is adopted, one should see that coding errors are altogether eliminated or reduced to theminimum level.
3. Classification: Most research studies result in a large volume of raw data which must be reducedinto homogeneous groups if we are to get meaningful relationships. This fact necessitates classificationof data which happens to be the process of arranging data in groups or classes on the basis ofcommon characteristics. Data having a common characteristic are placed in one class and in this

124 Research Methodology
way the entire data get divided into a number of groups or classes. Classification can be one of thefollowing two types, depending upon the nature of the phenomenon involved:
(a) Classification according to attributes:As stated above, data are classified on the basisof common characteristics which can either be descriptive (such as literacy, sex, honesty,etc.) or numerical (such as weight, height, income, etc.). Descriptive characteristics referto qualitative phenomenon which cannot be measured quantitatively; only their presence orabsence in an individual item can be noticed. Data obtained this way on the basis of certainattributes are known as statistics of attributes and their classification is said to beclassification according to attributes.
Such classification can be simple classification or manifold classification. In simpleclassification we consider only one attribute and divide the universe into two classes—oneclass consisting of items possessing the given attribute and the other class consisting ofitems which do not possess the given attribute. But in manifold classification we considertwo or more attributes simultaneously, and divide that data into a number of classes (totalnumber of classes of final order is given by 2n, where n = number of attributes considered).*
Whenever data are classified according to attributes, the researcher must see that theattributes are defined in such a manner that there is least possibility of any doubt/ambiguityconcerning the said attributes.
(b) Classification according to class-intervals:Unlike descriptive characteristics, thenumerical characteristics refer to quantitative phenomenon which can be measured throughsome statistical units. Data relating to income, production, age, weight, etc. come under thiscategory. Such data are known as statistics of variables and are classified on the basis ofclass intervals. For instance, persons whose incomes, say, are within Rs 201 to Rs 400 canform one group, those whose incomes are within Rs 401 to Rs 600 can form another groupand so on. In this way the entire data may be divided into a number of groups or classes orwhat are usually called, ‘class-intervals.’ Each group of class-interval, thus, has an upperlimit as well as a lower limit which are known as class limits. The difference between thetwo class limits is known as class magnitude. We may have classes with equal classmagnitudes or with unequal class magnitudes. The number of items which fall in a givenclass is known as the frequency of the given class. All the classes or groups, with theirrespective frequencies taken together and put in the form of a table, are described as groupfrequency distribution or simply frequency distribution. Classification according to classintervals usually involves the following three main problems:
(i) How may classes should be there? What should be their magnitudes?
There can be no specific answer with regard to the number of classes. The decisionabout this calls for skill and experience of the researcher. However, the objectiveshould be to display the data in such a way as to make it meaningful for the analyst.Typically, we may have 5 to 15 classes. With regard to the second part of the question,we can say that, to the extent possible, class-intervals should be of equal magnitudes,but in some cases unequal magnitudes may result in better classification. Hence the
* Classes of the final order are those classes developed on the basis of ‘n’ attributes considered. For example, if attributesA and B are studied and their presence is denoted by A and B respectively and absence by a and b respectively, then we havefour classes of final order viz., class AB, class Ab, class aB, and class ab.
Processing and Analysis of Data 125
researcher’s objective judgement plays an important part in this connection. Multiplesof 2, 5 and 10 are generally preferred while determining class magnitudes. Somestatisticians adopt the following formula, suggested by H.A. Sturges, determining thesize of class interval:
i = R/(1 + 3.3 log N)where
i = size of class interval;R = Range (i.e., difference between the values of the largest item and smallest item
among the given items);N = Number of items to be grouped.
It should also be kept in mind that in case one or two or very few items have very high or verylow values, one may use what are known as open-ended intervals in the overall frequency distribution.Such intervals may be expressed like under Rs 500 or Rs 10001 and over. Such intervals are generallynot desirable, but often cannot be avoided. The researcher must always remain conscious of this factwhile deciding the issue of the total number of class intervals in which the data are to be classified.
(ii) How to choose class limits?While choosing class limits, the researcher must take into consideration the criterionthat the mid-point (generally worked out first by taking the sum of the upper limit andlower limit of a class and then divide this sum by 2) of a class-interval and the actualaverage of items of that class interval should remain as close to each other as possible.Consistent with this, the class limits should be located at multiples of 2, 5, 10, 20, 100and such other figures. Class limits may generally be stated in any of the followingforms:Exclusive type class intervals: They are usually stated as follows:
10–20
20–3030–4040–50
The above intervals should be read as under:10 and under 2020 and under 30
30 and under 4040 and under 50
Thus, under the exclusive type class intervals, the items whose values are equal to theupper limit of a class are grouped in the next higher class. For example, an item whosevalue is exactly 30 would be put in 30–40 class interval and not in 20–30 class interval.In simple words, we can say that under exclusive type class intervals, the upper limit ofa class interval is excluded and items with values less than the upper limit (but not lessthan the lower limit) are put in the given class interval.

126 Research Methodology
Inclusive type class intervals: They are usually stated as follows:11–2021–30
31–4041–50
In inclusive type class intervals the upper limit of a class interval is also included in theconcerning class interval. Thus, an item whose value is 20 will be put in 11–20 classinterval. The stated upper limit of the class interval 11–20 is 20 but the real limit is20.99999 and as such 11–20 class interval really means 11 and under 21.
When the phenomenon under consideration happens to be a discrete one (i.e., can be measuredand stated only in integers), then we should adopt inclusive type classification. But when thephenomenon happens to be a continuous one capable of being measured in fractions as well, we canuse exclusive type class intervals.*
(iii) How to determine the frequency of each class?This can be done either by tally sheets or by mechanical aids. Under the technique oftally sheet, the class-groups are written on a sheet of paper (commonly known as thetally sheet) and for each item a stroke (usually a small vertical line) is marked againstthe class group in which it falls. The general practice is that after every four smallvertical lines in a class group, the fifth line for the item falling in the same group, isindicated as horizontal line through the said four lines and the resulting flower (IIII)represents five items. All this facilitates the counting of items in each one of the classgroups. An illustrative tally sheet can be shown as under:
Table 7.1: An Illustrative Tally Sheet for Determining the Numberof 70 Families in Different Income Groups
Income groups Tally mark Number of families or
(Rupees) (Class frequency)
Below 400 IIII IIII III 13401–800 IIII IIII IIII IIII 20801–1200 IIII IIII II 12
1201–1600 IIII IIII IIII III 181601 andabove IIII II 7
Total 70
Alternatively, class frequencies can be determined, specially in case of large inquires and surveys,by mechanical aids i.e., with the help of machines viz., sorting machines that are available for thepurpose. Some machines are hand operated, whereas other work with electricity. There are machines
* The stated limits of class intervals are different than true limits. We should use true or real limits keeping in view thenature of the given phenomenon.

Processing and Analysis of Data 127
which can sort out cards at a speed of something like 25000 cards per hour. This method is fast butexpensive.
4. Tabulation: When a mass of data has been assembled, it becomes necessary for the researcherto arrange the same in some kind of concise and logical order. This procedure is referred to astabulation. Thus, tabulation is the process of summarising raw data and displaying the same in compactform (i.e., in the form of statistical tables) for further analysis. In a broader sense, tabulation is anorderly arrangement of data in columns and rows.
Tabulation is essential because of the following reasons.
1. It conserves space and reduces explanatory and descriptive statement to a minimum.
2. It facilitates the process of comparison.3. It facilitates the summation of items and the detection of errors and omissions.4. It provides a basis for various statistical computations.
Tabulation can be done by hand or by mechanical or electronic devices. The choice depends onthe size and type of study, cost considerations, time pressures and the availaibility of tabulatingmachines or computers. In relatively large inquiries, we may use mechanical or computer tabulationif other factors are favourable and necessary facilities are available. Hand tabulation is usuallypreferred in case of small inquiries where the number of questionnaires is small and they are ofrelatively short length. Hand tabulation may be done using the direct tally, the list and tally or the cardsort and count methods. When there are simple codes, it is feasible to tally directly from thequestionnaire. Under this method, the codes are written on a sheet of paper, called tally sheet, and foreach response a stroke is marked against the code in which it falls. Usually after every four strokesagainst a particular code, the fifth response is indicated by drawing a diagonal or horizontal linethrough the strokes. These groups of five are easy to count and the data are sorted against each codeconveniently. In the listing method, the code responses may be transcribed onto a large work-sheet,allowing a line for each questionnaire. This way a large number of questionnaires can be listed onone work sheet. Tallies are then made for each question. The card sorting method is the most flexiblehand tabulation. In this method the data are recorded on special cards of convenient size and shapewith a series of holes. Each hole stands for a code and when cards are stacked, a needle passesthrough particular hole representing a particular code. These cards are then separated and counted.In this way frequencies of various codes can be found out by the repetition of this technique. We canas well use the mechanical devices or the computer facility for tabulation purpose in case we wantquick results, our budget permits their use and we have a large volume of straight forward tabulationinvolving a number of cross-breaks.
Tabulation may also be classified as simple and complex tabulation. The former type of tabulationgives information about one or more groups of independent questions, whereas the latter type oftabulation shows the division of data in two or more categories and as such is deigned to giveinformation concerning one or more sets of inter-related questions. Simple tabulation generally resultsin one-way tables which supply answers to questions about one characteristic of data only. Asagainst this, complex tabulation usually results in two-way tables (which give information about twointer-related characteristics of data), three-way tables (giving information about three interrelatedcharacteristics of data) or still higher order tables, also known as manifold tables, which supply

128 Research Methodology
information about several interrelated characteristics of data. Two-way tables, three-way tables ormanifold tables are all examples of what is sometimes described as cross tabulation.
Generally accepted principles of tabulation: Such principles of tabulation, particularly ofconstructing statistical tables, can be briefly states as follows:*
1. Every table should have a clear, concise and adequate title so as to make the table intelligiblewithout reference to the text and this title should always be placed just above the body ofthe table.
2. Every table should be given a distinct number to facilitate easy reference.
3. The column headings (captions) and the row headings (stubs) of the table should be clearand brief.
4. The units of measurement under each heading or sub-heading must always be indicated.5. Explanatory footnotes, if any, concerning the table should be placed directly beneath the
table, along with the reference symbols used in the table.
6. Source or sources from where the data in the table have been obtained must be indicatedjust below the table.
7. Usually the columns are separated from one another by lines which make the table morereadable and attractive. Lines are always drawn at the top and bottom of the table andbelow the captions.
8. There should be thick lines to separate the data under one class from the data underanother class and the lines separating the sub-divisions of the classes should be comparativelythin lines.
9. The columns may be numbered to facilitate reference.
10. Those columns whose data are to be compared should be kept side by side. Similarly,percentages and/or averages must also be kept close to the data.
11. It is generally considered better to approximate figures before tabulation as the same wouldreduce unnecessary details in the table itself.
12. In order to emphasise the relative significance of certain categories, different kinds of type,spacing and indentations may be used.
13. It is important that all column figures be properly aligned. Decimal points and (+) or (–)signs should be in perfect alignment.
14. Abbreviations should be avoided to the extent possible and ditto marks should not be usedin the table.
15. Miscellaneous and exceptional items, if any, should be usually placed in the last row of thetable.
16. Table should be made as logical, clear, accurate and simple as possible. If the data happento be very large, they should not be crowded in a single table for that would make the tableunwieldy and inconvenient.
17. Total of rows should normally be placed in the extreme right column and that of columnsshould be placed at the bottom.
* All these points constitute the characteristics of a good table.

Processing and Analysis of Data 129
18. The arrangement of the categories in a table may be chronological, geographical, alphabeticalor according to magnitude to facilitate comparison. Above all, the table must suit the needsand requirements of an investigation.
SOME PROBLEMS IN PROCESSING
We can take up the following two problems of processing the data for analytical purposes:
(a) The problem concerning “Don’t know” (or DK) responses:While processing the data, theresearcher often comes across some responses that are difficult to handle. One category of suchresponses may be ‘Don’t Know Response’ or simply DK response. When the DK response groupis small, it is of little significance. But when it is relatively big, it becomes a matter of major concernin which case the question arises: Is the question which elicited DK response useless? The answerdepends on two points viz., the respondent actually may not know the answer or the researcher mayfail in obtaining the appropriate information. In the first case the concerned question is said to bealright and DK response is taken as legitimate DK response. But in the second case, DK responseis more likely to be a failure of the questioning process.
How DK responses are to be dealt with by researchers? The best way is to design better type ofquestions. Good rapport of interviewers with respondents will result in minimising DK responses.But what about the DK responses that have already taken place? One way to tackle this issue is toestimate the allocation of DK answers from other data in the questionnaire. The other way is to keepDK responses as a separate category in tabulation where we can consider it as a separate replycategory if DK responses happen to be legitimate, otherwise we should let the reader make his owndecision. Yet another way is to assume that DK responses occur more or less randomly and as suchwe may distribute them among the other answers in the ratio in which the latter have occurred.Similar results will be achieved if all DK replies are excluded from tabulation and that too withoutinflating the actual number of other responses.(b) Use or percentages:Percentages are often used in data presentation for they simplify numbers,reducing all of them to a 0 to 100 range. Through the use of percentages, the data are reduced in thestandard form with base equal to 100 which fact facilitates relative comparisons. While usingpercentages, the following rules should be kept in view by researchers:
1. Two or more percentages must not be averaged unless each is weighted by the group sizefrom which it has been derived.
2. Use of too large percentages should be avoided, since a large percentage is difficult tounderstand and tends to confuse, defeating the very purpose for which percentages areused.
3. Percentages hide the base from which they have been computed. If this is not kept in view,the real differences may not be correctly read.
4. Percentage decreases can never exceed 100 per cent and as such for calculating thepercentage of decrease, the higher figure should invariably be taken as the base.
5. Percentages should generally be worked out in the direction of the causal-factor in case oftwo-dimension tables and for this purpose we must select the more significant factor out ofthe two given factors as the causal factor.

130 Research Methodology
ELEMENTS/TYPES OF ANALYSIS
As stated earlier, by analysis we mean the computation of certain indices or measures along withsearching for patterns of relationship that exist among the data groups. Analysis, particularly in caseof survey or experimental data, involves estimating the values of unknown parameters of the populationand testing of hypotheses for drawing inferences. Analysis may, therefore, be categorised as descriptiveanalysis and inferential analysis (Inferential analysis is often known as statistical analysis). “Descriptiveanalysis is largely the study of distributions of one variable. This study provides us with profiles ofcompanies, work groups, persons and other subjects on any of a multiple of characteristics such assize. Composition, efficiency, preferences, etc.”2. this sort of analysis may be in respect of onevariable (described as unidimensional analysis), or in respect of two variables (described as bivariateanalysis) or in respect of more than two variables (described as multivariate analysis). In this contextwe work out various measures that show the size and shape of a distribution(s) along with the studyof measuring relationships between two or more variables.
We may as well talk of correlation analysis and causal analysis. Correlation analysis studiesthe joint variation of two or more variables for determining the amount of correlation between two ormore variables. Causal analysis is concerned with the study of how one or more variables affectchanges in another variable. It is thus a study of functional relationships existing between two ormore variables. This analysis can be termed as regression analysis. Causal analysis is consideredrelatively more important in experimental researches, whereas in most social and business researchesour interest lies in understanding and controlling relationships between variables then with determiningcauses per se and as such we consider correlation analysis as relatively more important.
In modern times, with the availability of computer facilities, there has been a rapid developmentof multivariate analysis which may be defined as “all statistical methods which simultaneouslyanalyse more than two variables on a sample of observations”3. Usually the following analyses* areinvolved when we make a reference of multivariate analysis:
(a) Multiple regression analysis:This analysis is adopted when the researcher has one dependentvariable which is presumed to be a function of two or more independent variables. The objective ofthis analysis is to make a prediction about the dependent variable based on its covariance with all theconcerned independent variables.(b) Multiple discriminant analysis:This analysis is appropriate when the researcher has a singledependent variable that cannot be measured, but can be classified into two or more groups on thebasis of some attribute. The object of this analysis happens to be to predict an entity’s possibility ofbelonging to a particular group based on several predictor variables.(c) Multivariate analysis of variance (or multi-ANOVA): This analysis is an extension of two-way ANOVA, wherein the ratio of among group variance to within group variance is worked out ona set of variables.
(d) Canonical analysis:This analysis can be used in case of both measurable and non-measurablevariables for the purpose of simultaneously predicting a set of dependent variables from their jointcovariance with a set of independent variables.
2 C. William Emory, Business Research Methods, p. 356.3 Jagdish N. Sheth, “The Multivariate Revolution in Marketing Research”, Journal of Marketing, Vol. 35, No. 1
(Jan. 1971), pp. 13–19.* Readers are referred to standard texts for more details about these analyses.

Processing and Analysis of Data 131
Inferential analysis is concerned with the various tests of significance for testing hypotheses inorder to determine with what validity data can be said to indicate some conclusion or conclusions. Itis also concerned with the estimation of population values. It is mainly on the basis of inferentialanalysis that the task of interpretation (i.e., the task of drawing inferences and conclusions) isperformed.
STATISTICS IN RESEARCH
The role of statistics in research is to function as a tool in designing research, analysing its data anddrawing conclusions therefrom. Most research studies result in a large volume of raw data whichmust be suitably reduced so that the same can be read easily and can be used for further analysis.Clearly the science of statistics cannot be ignored by any research worker, even though he may nothave occasion to use statistical methods in all their details and ramifications. Classification andtabulation, as stated earlier, achieve this objective to some extent, but we have to go a step furtherand develop certain indices or measures to summarise the collected/classified data. Only after thiswe can adopt the process of generalisation from small groups (i.e., samples) to population. If fact,there are two major areas of statistics viz., descriptive statistics and inferential statistics. Descriptivestatistics concern the development of certain indices from the raw data, whereas inferential statisticsconcern with the process of generalisation. Inferential statistics are also known as sampling statisticsand are mainly concerned with two major type of problems: (i) the estimation of population parameters,and (ii) the testing of statistical hypotheses.
The important statistical measures* that are used to summarise the survey/research data are:(1) measures of central tendency or statistical averages; (2) measures of dispersion; (3) measures
of asymmetry (skewness); (4) measures of relationship; and (5) other measures.Amongst the measures of central tendency, the three most important ones are the arithmetic
average or mean, median and mode. Geometric mean and harmonic mean are also sometimes used.
From among the measures of dispersion, variance, and its square root—the standard deviationare the most often used measures. Other measures such as mean deviation, range, etc. are alsoused. For comparison purpose, we use mostly the coefficient of standard deviation or the coefficientof variation.
In respect of the measures of skewness and kurtosis, we mostly use the first measure of skewnessbased on mean and mode or on mean and median. Other measures of skewness, based on quartilesor on the methods of moments, are also used sometimes. Kurtosis is also used to measure thepeakedness of the curve of the frequency distribution.
Amongst the measures of relationship, Karl Pearson’s coefficient of correlation is the frequentlyused measure in case of statistics of variables, whereas Yule’s coefficient of association is used incase of statistics of attributes. Multiple correlation coefficient, partial correlation coefficient, regressionanalysis, etc., are other important measures often used by a researcher.
Index numbers, analysis of time series, coefficient of contingency, etc., are other measures thatmay as well be used by a researcher, depending upon the nature of the problem under study.
We give below a brief outline of some important measures (our of the above listed measures)often used in the context of research studies.
* One may read any standard text book on statistical methods for details about these measures.

132 Research Methodology
MEASURES OF CENTRAL TENDENCY
Measures of central tendency (or statistical averages) tell us the point about which items have atendency to cluster. Such a measure is considered as the most representative figure for the entiremass of data. Measure of central tendency is also known as statistical average. Mean, median andmode are the most popular averages. Mean, also known as arithmetic average, is the most commonmeasure of central tendency and may be defined as the value which we get by dividing the total ofthe values of various given items in a series by the total number of items. we can work it out as under:
Mean (or )*XX
n
X X X
ni n=
∑=
+ + +1 2 ...
where X = The symbol we use for mean (pronounced as X bar)
∑ = Symbol for summation X
i = Value of the ith item X, i = 1, 2, …, n
n = total number of itemsIn case of a frequency distribution, we can work out mean in this way:
Xf X
f
f X f X f X
f f f ni i
i
n n
n
=∑
∑=
+ + ++ + + =
1 1 2 2
1 2
...
...
Sometimes, instead of calculating the simple mean, as stated above, we may workout the weightedmean for a realistic average. The weighted mean can be worked out as follows:
Xw X
wwi i
i
=∑
∑where Xw = Weighted item
wi = weight of ith item X
Xi = value of the ith item X
Mean is the simplest measurement of central tendency and is a widely used measure. Its chiefuse consists in summarising the essential features of a series and in enabling data to be compared. Itis amenable to algebraic treatment and is used in further statistical calculations. It is a relativelystable measure of central tendency. But it suffers from some limitations viz., it is unduly affected byextreme items; it may not coincide with the actual value of an item in a series, and it may lead towrong impressions, particularly when the item values are not given with the average. However,mean is better than other averages, specially in economic and social studies where direct quantitativemeasurements are possible.
Median is the value of the middle item of series when it is arranged in ascending or descendingorder of magnitude. It divides the series into two halves; in one half all items are less than median,whereas in the other half all items have values higher than median. If the values of the items arrangedin the ascending order are: 60, 74, 80, 90, 95, 100, then the value of the 4th item viz., 88 is the valueof median. We can also write thus:
* If we use assumed average A, then mean would be worked out as under:
X AX A
ni= +
∑ −b g or X Af X A
fi i
i
= +∑ −
∑b g
, in case of frequency distribution. This is also known as short cut
method of finding X .

Processing and Analysis of Data 133
Median Value of n + 1
2th itemMb g = F
HGIKJ
Median is a positional average and is used only in the context of qualitative phenomena, forexample, in estimating intelligence, etc., which are often encountered in sociological fields. Median isnot useful where items need to be assigned relative importance and weights. It is not frequently usedin sampling statistics.
Mode is the most commonly or frequently occurring value in a series. The mode in a distributionis that item around which there is maximum concentration. In general, mode is the size of the itemwhich has the maximum frequency, but at items such an item may not be mode on account of theeffect of the frequencies of the neighbouring items. Like median, mode is a positional average and isnot affected by the values of extreme items. it is, therefore, useful in all situations where we want toeliminate the effect of extreme variations. Mode is particularly useful in the study of popular sizes.For example, a manufacturer of shoes is usually interested in finding out the size most in demand sothat he may manufacture a larger quantity of that size. In other words, he wants a modal size to bedetermined for median or mean size would not serve his purpose. but there are certain limitations ofmode as well. For example, it is not amenable to algebraic treatment and sometimes remainsindeterminate when we have two or more model values in a series. It is considered unsuitable incases where we want to give relative importance to items under consideration.
Geometric mean is also useful under certain conditions. It is defined as the nth root of theproduct of the values of n times in a given series. Symbolically, we can put it thus:
Geometric mean (or G.M.) = πXin
= ⋅ ⋅X X X Xnn
1 2 3 ...
whereG.M. = geometric mean, n = number of items.
Xi = ith value of the variable X
π = conventional product notation
For instance, the geometric mean of the numbers, 4, 6, and 9 is worked out as
G.M. = 4 693 . .
= 6
The most frequently used application of this average is in the determination of average per centof change i.e., it is often used in the preparation of index numbers or when we deal in ratios.
Harmonic mean is defined as the reciprocal of the average of reciprocals of the values of itemsof a series. Symbolically, we can express it as under:
Harmonic mean (H.M.) = Rec.Rec∑ X
ni
= Rec.Rec. Rec. Rec.X X X
nn1 2+ + +...
134 Research Methodology
whereH.M. = Harmonic mean Rec. = Reciprocal
Xi = ith value of the variable X
n = number of itemsFor instance, the harmonic mean of the numbers 4, 5, and 10 is worked out as
H.M. = Rec Rec15 + 12 + 6
1 4 1 5 1 10
3 360/ / /+ +
=
= Rec33
60×F
HGIKJ = =1
3
60
11545.
Harmonic mean is of limited application, particularly in cases where time and rate are involved.The harmonic mean gives largest weight to the smallest item and smallest weight to the largest item.As such it is used in cases like time and motion study where time is variable and distance constant.
From what has been stated above, we can say that there are several types of statistical averages.Researcher has to make a choice for some average. There are no hard and fast rules for theselection of a particular average in statistical analysis for the selection of an average mostly dependson the nature, type of objectives of the research study. One particular type of average cannot betaken as appropriate for all types of studies. The chief characteristics and the limitations of thevarious averages must be kept in view; discriminate use of average is very essential for soundstatistical analysis.
MEASURES OF DISPERSION
An averages can represent a series only as best as a single figure can, but it certainly cannot revealthe entire story of any phenomenon under study. Specially it fails to give any idea about the scatter ofthe values of items of a variable in the series around the true value of average. In order to measurethis scatter, statistical devices called measures of dispersion are calculated. Important measures ofdispersion are (a) range, (b) mean deviation, and (c) standard deviation.
(a) Range is the simplest possible measure of dispersion and is defined as the difference betweenthe values of the extreme items of a series. Thus,
Range = Highest value of anitem in a series
Lowest value of anitem in a series
FH
IK − FH
IK
The utility of range is that it gives an idea of the variability very quickly, but the drawback is thatrange is affected very greatly by fluctuations of sampling. Its value is never stable, being based ononly two values of the variable. As such, range is mostly used as a rough measure of variability andis not considered as an appropriate measure in serious research studies.(b) Mean deviation is the average of difference of the values of items from some average of theseries. Such a difference is technically described as deviation. In calculating mean deviation weignore the minus sign of deviations while taking their total for obtaining the mean deviation. Meandeviation is, thus, obtained as under:

Processing and Analysis of Data 135
Mean deviation from mean δ XiX X
nc h =
∑ −, if deviations, X Xi − , are obtained from
or arithmetic average.
Mean deviation from median δmiX M
nb g =
∑ −, if deviations, X Mi − , are obtained
or from median
Mean deviation from mode δziX Z
nb g =
∑ −, if deviations, X Zi − , are obtained from
mode.
where δ = Symbol for mean deviation (pronounced as delta);
Xi = ith values of the variable X;
n = number of items;
X = Arithmetic average; M = Median;
Z = Mode.When mean deviation is divided by the average used in finding out the mean deviation itself, theresulting quantity is described as the coefficient of mean deviation. Coefficient of mean deviationis a relative measure of dispersion and is comparable to similar measure of other series. Meandeviation and its coefficient are used in statistical studies for judging the variability, and therebyrender the study of central tendency of a series more precise by throwing light on the typicalness ofan average. It is a better measure of variability than range as it takes into consideration the values ofall items of a series. Even then it is not a frequently used measure as it is not amenable to algebraicprocess.(c) Standard deviation is most widely used measure of dispersion of a series and is commonlydenoted by the symbol ‘σ ’ (pronounced as sigma). Standard deviation is defined as the square-rootof the average of squares of deviations, when such deviations for the values of individual items in aseries are obtained from the arithmetic average. It is worked out as under:
Standard deviation* σb gd i
=∑ −X X
n
i2
* If we use assumed average, A, in place of X while finding deviations, then standard deviation would be worked out asunder:
σ =∑ −
−∑ −FHG
IKJ
X A
n
X A
ni ib g b g2 2
Or
σ =∑ −
∑−
∑ −∑
FHG
IKJ
f X A
f
f X A
fi i
i
i i
i
b g b g2 2
, in case of frequency distribution.
This is also known as the short-cut method of finding σ .
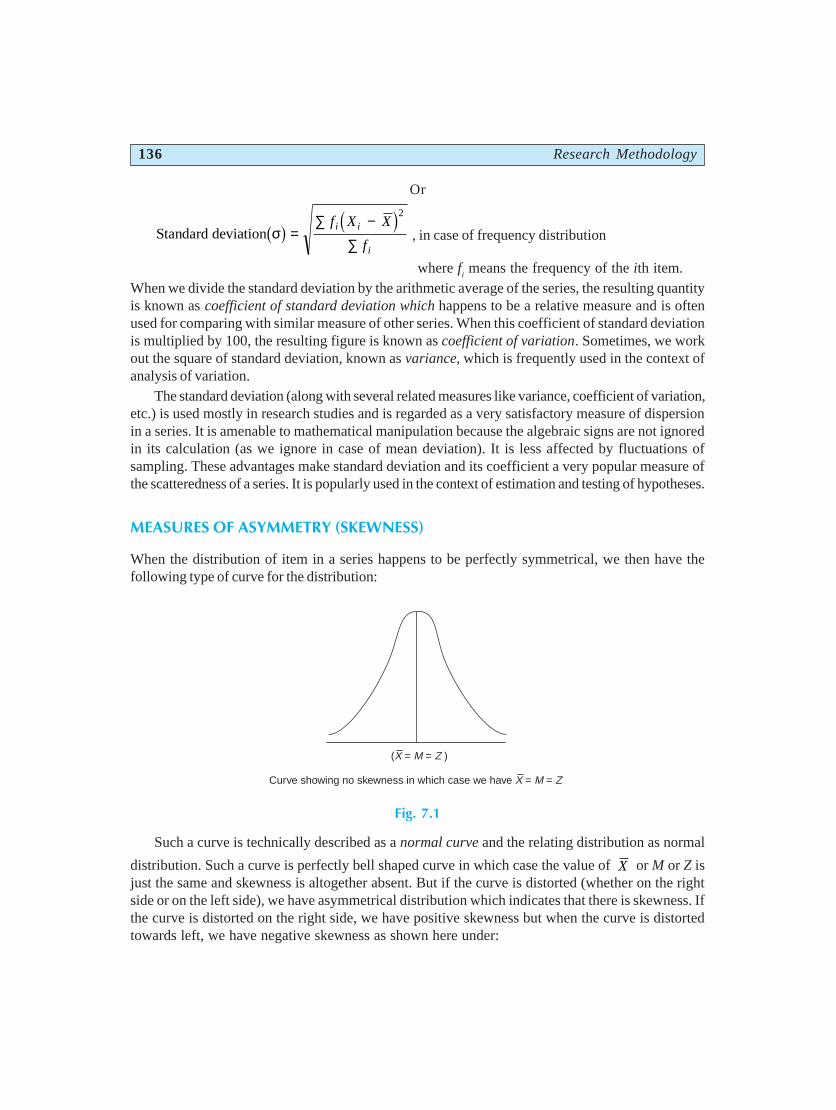
136 Research Methodology
Or
Standard deviationσb g d i=
∑ −
∑
f X X
f
i i
i
2
, in case of frequency distribution
where fi means the frequency of the ith item.
When we divide the standard deviation by the arithmetic average of the series, the resulting quantityis known as coefficient of standard deviation which happens to be a relative measure and is oftenused for comparing with similar measure of other series. When this coefficient of standard deviationis multiplied by 100, the resulting figure is known as coefficient of variation. Sometimes, we workout the square of standard deviation, known as variance, which is frequently used in the context ofanalysis of variation.
The standard deviation (along with several related measures like variance, coefficient of variation,etc.) is used mostly in research studies and is regarded as a very satisfactory measure of dispersionin a series. It is amenable to mathematical manipulation because the algebraic signs are not ignoredin its calculation (as we ignore in case of mean deviation). It is less affected by fluctuations ofsampling. These advantages make standard deviation and its coefficient a very popular measure ofthe scatteredness of a series. It is popularly used in the context of estimation and testing of hypotheses.
MEASURES OF ASYMMETRY (SKEWNESS)
When the distribution of item in a series happens to be perfectly symmetrical, we then have thefollowing type of curve for the distribution:
Fig. 7.1
Such a curve is technically described as a normal curve and the relating distribution as normal
distribution. Such a curve is perfectly bell shaped curve in which case the value of X or M or Z isjust the same and skewness is altogether absent. But if the curve is distorted (whether on the rightside or on the left side), we have asymmetrical distribution which indicates that there is skewness. Ifthe curve is distorted on the right side, we have positive skewness but when the curve is distortedtowards left, we have negative skewness as shown here under:
( = = )X M Z
Curve showing no skewness in which case we have = =X M Z

Processing and Analysis of Data 137
Fig. 7.2
Skewness is, thus, a measure of asymmetry and shows the manner in which the items are clusteredaround the average. In a symmetrical distribution, the items show a perfect balance on either side ofthe mode, but in a skew distribution the balance is thrown to one side. The amount by which thebalance exceeds on one side measures the skewness of the series. The difference between themean, median or the mode provides an easy way of expressing skewness in a series. In case of
positive skewness, we have Z < M < X and in case of negative skewness we have X < M < Z.Usually we measure skewness in this way:
Skewness = X – Z and its coefficient (j) is worked
out as jX Z
=−σ
In case Z is not well defined, then we work out skewness as under:
Skewness = 3(X – M) and its coefficient (j) is worked
out as jX M
=−3d iσ
The significance of skewness lies in the fact that through it one can study the formation of seriesand can have the idea about the shape of the curve, whether normal or otherwise, when the items ofa given series are plotted on a graph.
Kurtosis is the measure of flat-toppedness of a curve. A bell shaped curve or the normal curveis Mesokurtic because it is kurtic in the centre; but if the curve is relatively more peaked than thenormal curve, it is called Leptokurtic whereas a curve is more flat than the normal curve, it is calledPlatykurtic. In brief, Kurtosis is the humpedness of the curve and points to the nature of distributionof items in the middle of a series.
It may be pointed out here that knowing the shape of the distribution curve is crucial to the use ofstatistical methods in research analysis since most methods make specific assumptions about thenature of the distribution curve.
X X
Curve showing positive skewnessIn case of positive skewness we have:
< <Z M X
Curve showing negative skewnessIn case of negative skewness we have:
< <X M Z
Z ZM M

138 Research Methodology
MEASURES OF RELATIONSHIP
So far we have dealt with those statistical measures that we use in context of univariate populationi.e., the population consisting of measurement of only one variable. But if we have the data on twovariables, we are said to have a bivariate population and if the data happen to be on more than twovariables, the population is known as multivariate population. If for every measurement of a variable,X, we have corresponding value of a second variable, Y, the resulting pairs of values are called abivariate population. In addition, we may also have a corresponding value of the third variable, Z, orthe forth variable, W, and so on, the resulting pairs of values are called a multivariate population. Incase of bivariate or multivariate populations, we often wish to know the relation of the two and/ormore variables in the data to one another. We may like to know, for example, whether the number ofhours students devote for studies is somehow related to their family income, to age, to sex or tosimilar other factor. There are several methods of determining the relationship between variables,but no method can tell us for certain that a correlation is indicative of causal relationship. Thus wehave to answer two types of questions in bivariate or multivariate populations viz.,
(i) Does there exist association or correlation between the two (or more) variables? If yes, ofwhat degree?
(ii) Is there any cause and effect relationship between the two variables in case of the bivariatepopulation or between one variable on one side and two or more variables on the other sidein case of multivariate population? If yes, of what degree and in which direction?
The first question is answered by the use of correlation technique and the second question by thetechnique of regression. There are several methods of applying the two techniques, but the importantones are as under:
In case of bivariate population: Correlation can be studied through (a) cross tabulation;(b) Charles Spearman’s coefficient of correlation; (c) Karl Pearson’s coefficient of correlation;whereas cause and effect relationship can be studied through simple regression equations.
In case of multivariate population: Correlation can be studied through (a) coefficient of multiplecorrelation; (b) coefficient of partial correlation; whereas cause and effect relationship can be studiedthrough multiple regression equations.
We can now briefly take up the above methods one by one.Cross tabulation approach is specially useful when the data are in nominal form. Under it we
classify each variable into two or more categories and then cross classify the variables in these sub-categories. Then we look for interactions between them which may be symmetrical, reciprocal orasymmetrical. A symmetrical relationship is one in which the two variables vary together, but weassume that neither variable is due to the other. A reciprocal relationship exists when the two variablesmutually influence or reinforce each other. Asymmetrical relationship is said to exist if one variable(the independent variable) is responsible for another variable (the dependent variable). The crossclassification procedure begins with a two-way table which indicates whether there is or there is notan interrelationship between the variables. This sort of analysis can be further elaborated in whichcase a third factor is introduced into the association through cross-classifying the three variables. Bydoing so we find conditional relationship in which factor X appears to affect factor Y only whenfactor Z is held constant. The correlation, if any, found through this approach is not considered a very

Processing and Analysis of Data 139
powerful form of statistical correlation and accordingly we use some other methods when datahappen to be either ordinal or interval or ratio data.
Charles Spearman’s coefficient of correlation (or rank correlation) is the technique ofdetermining the degree of correlation between two variables in case of ordinal data where ranks aregiven to the different values of the variables. The main objective of this coefficient is to determinethe extent to which the two sets of ranking are similar or dissimilar. This coefficient is determined asunder:
Spearman's coefficient of correlation (or rs) = 1
6
1
2
2−
∑−
L
NMM
O
QPP
d
n ni
e j
where di = difference between ranks of ith pair of the two variables;
n = number of pairs of observations.
As rank correlation is a non-parametric technique for measuring relationship between pairedobservations of two variables when data are in the ranked form, we have dealt with this technique ingreater details later on in the book in chapter entitled ‘Hypotheses Testing II (Non-parametric tests)’.
Karl Pearson’s coefficient of correlation (or simple correlation) is the most widely used methodof measuring the degree of relationship between two variables. This coefficient assumes the following:
(i) that there is linear relationship between the two variables;(ii) that the two variables are casually related which means that one of the variables is
independent and the other one is dependent; and
(iii) a large number of independent causes are operating in both variables so as to produce anormal distribution.
Karl Pearson’s coefficient of correlation can be worked out thus.
Karl Pearson’s coefficient of correlation (or r)* =∑ − −
⋅ ⋅
X X Y Y
n
i i
X Y
d i d iσ σ
* Alternatively, the formula can be written as:
rX X Y Y
X X Y Y
i i
i i
=∑ − −
∑ − ⋅ ∑ −
d i d i
d i d i2 2
Or
rX Y X X Y Y n
x y
i i
x y
=⋅
=∑ − −
⋅Covariance between and
σ σ σ σd i d i/
Or
rX Y n X Y
X nX Y nY
i i
i i
=∑ − ⋅ ⋅
∑ − ∑ −2 2 2 2
(This applies when we take zero as the assumed mean for both variables, X and Y.)

140 Research Methodology
where Xi = ith value of X variable
X = mean of X Y
i = ith value of Y variable
Y = Mean of Y
n = number of pairs of observations of X and Y
σ X = Standard deviation of X
σY = Standard deviation of Y
In case we use assumed means (Ax and A
y for variables X and Y respectively) in place of true means,
then Karl Person’s formula is reduced to:
∑ ⋅−
∑ ⋅ ∑FHG
IKJ
∑ − ∑FHG
IKJ
∑ − ∑FHG
IKJ
dx dy
n
dx dy
n
dx
n
dx
n
dy
n
dy
n
i i i i
i i i i2 2 2 2
∑ ⋅−
∑ ⋅ ∑FHG
IKJ
∑ − ∑FHG
IKJ
∑ − ∑FHG
IKJ
dx dy
n
dx dy
n
dx
n
dx
n
dy
n
dy
n
i i i i
i i i i2 2 2 2
where ∑ = ∑ −dx X Ai i xb g ∑ = ∑ −dy Y Ai i yd i ∑ = ∑ −dx X Ai i x
2 2b g ∑ = ∑ −dy Y Ai i y
2 2d i
∑ ⋅ = ∑ − −dx dy X A Y Ai i i x i yb g d i n = number of pairs of observations of X and Y.
This is the short cut approach for finding ‘r’ in case of ungrouped data. If the data happen to begrouped data (i.e., the case of bivariate frequency distribution), we shall have to write Karl Pearson’scoefficient of correlation as under:
∑ ⋅ ⋅−
∑⋅
∑FHG
IKJ
∑−
∑FHG
IKJ
∑−
∑FHG
IKJ
f dx dy
n
f dx
n
f dy
n
f dx
n
f dx
n
f dy
n
f dy
n
ij i j i i j j
i i i i i j j j2 2 2
where fij is the frequency of a particular cell in the correlation table and all other values are defined
as earlier.

Processing and Analysis of Data 141
Karl Pearson’s coefficient of correlation is also known as the product moment correlationcoefficient. The value of ‘r’ lies between ± 1. Positive values of r indicate positive correlationbetween the two variables (i.e., changes in both variables take place in the statement direction),whereas negative values of ‘r’ indicate negative correlation i.e., changes in the two variables takingplace in the opposite directions. A zero value of ‘r’ indicates that there is no association between thetwo variables. When r = (+) 1, it indicates perfect positive correlation and when it is (–)1, it indicatesperfect negative correlation, meaning thereby that variations in independent variable (X) explain100% of the variations in the dependent variable (Y). We can also say that for a unit change inindependent variable, if there happens to be a constant change in the dependent variable in the samedirection, then correlation will be termed as perfect positive. But if such change occurs in the oppositedirection, the correlation will be termed as perfect negative. The value of ‘r’ nearer to +1 or –1indicates high degree of correlation between the two variables.
SIMPLE REGRESSION ANALYSIS
Regression is the determination of a statistical relationship between two or more variables. In simpleregression, we have only two variables, one variable (defined as independent) is the cause of thebehaviour of another one (defined as dependent variable). Regression can only interpret what existsphysically i.e., there must be a physical way in which independent variable X can affect dependentvariable Y. The basic relationship between X and Y is given by
$Y a bX= +
where the symbol $Y denotes the estimated value of Y for a given value of X. This equation is knownas the regression equation of Y on X (also represents the regression line of Y on X when drawn on agraph) which means that each unit change in X produces a change of b in Y, which is positive fordirect and negative for inverse relationships.
Then generally used method to find the ‘best’ fit that a straight line of this kind can give is theleast-square method. To use it efficiently, we first determine
∑ = ∑ −x X nXi i2 2 2
∑ = ∑ −y Y nYi i2 2 2
∑ = ∑ − ⋅x y X Y nX Yi i i i
Then bx y
xa Y bXi i
i
=∑∑
= −2
,
These measures define a and b which will give the best possible fit through the original X and Ypoints and the value of r can then be worked out as under:
rb x
y
i
i
=∑
∑
2
2

142 Research Methodology
Thus, the regression analysis is a statistical method to deal with the formulation of mathematicalmodel depicting relationship amongst variables which can be used for the purpose of prediction of thevalues of dependent variable, given the values of the independent variable.
[Alternatively, for fitting a regression equation of the type $Y = a + bX to the given values of Xand Y variables, we can find the values of the two constants viz., a and b by using the following twonormal equations:
∑ = + ∑Y na b Xi i
∑ = ∑ + ∑X Y a X b Xi i i i2
and then solving these equations for finding a and b values. Once these values are obtained and havebeen put in the equation $Y = a + bX, we say that we have fitted the regression equation of Y on Xto the given data. In a similar fashion, we can develop the regression equation of X and Y viz., $X =a + bX, presuming Y as an independent variable and X as dependent variable].
MULTIPLE CORRELATION AND REGRESSION
When there are two or more than two independent variables, the analysis concerning relationship isknown as multiple correlation and the equation describing such relationship as the multiple regressionequation. We here explain multiple correlation and regression taking only two independent variablesand one dependent variable (Convenient computer programs exist for dealing with a great number ofvariables). In this situation the results are interpreted as shown below:
Multiple regression equation assumes the form
$Y = a + b1X
1 + b
2X
2
where X1 and X
2 are two independent variables and Y being the dependent variable, and the constants
a, b1 and b
2 can be solved by solving the following three normal equations:
∑ = + ∑ + ∑Y na b X b Xi i i1 1 2 2
∑ = ∑ + ∑ + ∑X Y a X b X b X Xi i i i i i1 1 1 12
2 1 2
∑ = ∑ + ∑ + ∑X Y a X b X X b Xi i i i i i2 2 1 1 2 2 22
(It may be noted that the number of normal equations would depend upon the number ofindependent variables. If there are 2 independent variables, then 3 equations, if there are 3 independentvariables then 4 equations and so on, are used.)
In multiple regression analysis, the regression coefficients (viz., b1 b
2) become less reliable as
the degree of correlation between the independent variables (viz., X1, X
2) increases. If there is a high
degree of correlation between independent variables, we have a problem of what is commonlydescribed as the problem of multicollinearity. In such a situation we should use only one set of theindependent variable to make our estimate. In fact, adding a second variable, say X
2, that is correlated
with the first variable, say X1, distorts the values of the regression coefficients. Nevertheless, the
prediction for the dependent variable can be made even when multicollinearity is present, but in sucha situation enough care should be taken in selecting the independent variables to estimate a dependentvariable so as to ensure that multi-collinearity is reduced to the minimum.

Processing and Analysis of Data 143
With more than one independent variable, we may make a difference between the collectiveeffect of the two independent variables and the individual effect of each of them taken separately.The collective effect is given by the coefficient of multiple correlation,
Ry x x⋅ 1 2 defined as under:
Rb Y X nY X b Y X nY X
Y nYy x x
i i i i
i⋅ =
∑ − + ∑ −∑ −1 2
1 1 1 2 2 22 2
Alternatively, we can write
Rb x y b x y
Yy x x
i i i i
i⋅ =
∑ + ∑∑1 2
1 1 2 22
where
x1i = (X
1i – X1 )
x2i = (X
2i – X2 )
yi = (Y
i – Y )
and b1 and b
2 are the regression coefficients.
PARTIAL CORRELATION
Partial correlation measures separately the relationship between two variables in such a way that theeffects of other related variables are eliminated. In other words, in partial correlation analysis, weaim at measuring the relation between a dependent variable and a particular independent variable byholding all other variables constant. Thus, each partial coefficient of correlation measures the effectof its independent variable on the dependent variable. To obtain it, it is first necessary to compute thesimple coefficients of correlation between each set of pairs of variables as stated earlier. In the caseof two independent variables, we shall have two partial correlation coefficients denoted ryx x1 2⋅ andryx x2 1⋅ which are worked out as under:
rR r
ryx x
y x x yx
yx1 2
1 2 2
2
2 2
21⋅
⋅=
−
−
This measures the effort of X1 on Y, more precisely, that proportion of the variation of Y not explained
by X2 which is explained by X
1. Also,
rR r
ryx x
y x x yx
yx2 1
1 2 1
1
2 2
21⋅
⋅=−
−
in which X1 and X
2 are simply interchanged, given the added effect of X
2 on Y.

144 Research Methodology
Alternatively, we can work out the partial correlation coefficients thus:
rr r r
r ryx x
yx yx x x
yx x x1 2
1 2 1 2
2 1 21 12 2
⋅ =− ⋅
− −
and
rr r r
r ryx x
yx yx x x
yx x x2 1
2 1 1 2
1 1 21 12 2
⋅ =− ⋅
− −
These formulae of the alternative approach are based on simple coefficients of correlation (alsoknown as zero order coefficients since no variable is held constant when simple correlation coefficientsare worked out). The partial correlation coefficients are called first order coefficients when onevariable is held constant as shown above; they are known as second order coefficients when twovariables are held constant and so on.
ASSOCIATION IN CASE OF ATTRIBUTES
When data is collected on the basis of some attribute or attributes, we have statistics commonlytermed as statistics of attributes. It is not necessary that the objects may process only one attribute;rather it would be found that the objects possess more than one attribute. In such a situation ourinterest may remain in knowing whether the attributes are associated with each other or not. Forexample, among a group of people we may find that some of them are inoculated against small-poxand among the inoculated we may observe that some of them suffered from small-pox after inoculation.The important question which may arise for the observation is regarding the efficiency of inoculationfor its popularity will depend upon the immunity which it provides against small-pox. In other words,we may be interested in knowing whether inoculation and immunity from small-pox are associated.Technically, we say that the two attributes are associated if they appear together in a greater numberof cases than is to be expected if they are independent and not simply on the basis that they areappearing together in a number of cases as is done in ordinary life.
The association may be positive or negative (negative association is also known as disassociation).If class frequency of AB, symbolically written as (AB), is greater than the expectation of AB beingtogether if they are independent, then we say the two attributes are positively associated; but if theclass frequency of AB is less than this expectation, the two attributes are said to be negativelyassociated. In case the class frequency of AB is equal to expectation, the two attributes are consideredas independent i.e., are said to have no association. It can be put symbolically as shown hereunder:
If ABA
N
B
NNb g b g b g
> × × , then AB are positively related/associated.
If ABA
N
B
NNb g b g b g
< × × , then AB are negatively related/associated.
If ABA
N
B
NNb g b g b g
= × × , then AB are independent i.e., have no association.

Processing and Analysis of Data 145
Where (AB) = frequency of class AB and
A
N
B
NN
b g b g× × = Expectation of AB, if A and B are independent, and N being the number of
itemsIn order to find out the degree or intensity of association between two or more sets of attributes, weshould work out the coefficient of association. Professor Yule’s coefficient of association is mostpopular and is often used for the purpose. It can be mentioned as under:
QAB ab Ab aB
AB ab Ab aBAB =−+
b g b g b g b gb g b g b g b g
where, Q
AB = Yule’s coefficient of association between attributes A and B.
(AB) = Frequency of class AB in which A and B are present.
(Ab) = Frequency of class Ab in which A is present but B is absent.(aB) = Frequency of class aB in which A is absent but B is present.(ab) = Frequency of class ab in which both A and B are absent.
The value of this coefficient will be somewhere between +1 and –1. If the attributes are completelyassociated (perfect positive association) with each other, the coefficient will be +1, and if they arecompletely disassociated (perfect negative association), the coefficient will be –1. If the attributesare completely independent of each other, the coefficient of association will be 0. The varying degreesof the coefficients of association are to be read and understood according to their positive andnegative nature between +1 and –1.
Sometimes the association between two attributes, A and B, may be regarded as unwarrantedwhen we find that the observed association between A and B is due to the association of both A andB with another attribute C. For example, we may observe positive association between inoculationand exemption for small-pox, but such association may be the result of the fact that there is positiveassociation between inoculation and richer section of society and also that there is positive associationbetween exemption from small-pox and richer section of society. The sort of association between Aand B in the population of C is described as partial association as distinguished from total associationbetween A and B in the overall universe. We can workout the coefficient of partial associationbetween A and B in the population of C by just modifying the above stated formula for findingassociation between A and B as shown below:
QABC abC AbC aBC
ABC abC AbC aBCAB C. =−+
b g b g b g b gb g b g b g b g
where,Q
AB.C = Coefficient of partial association between A and B in the population of C; and all other
values are the class frequencies of the respective classes (A, B, C denotes the presence of concerning attributes and a, b, c denotes the absence of concerning attributes).
At times, we may come across cases of illusory association, wherein association between twoattributes does not correspond to any real relationship. This sort of association may be the result of

146 Research Methodology
some attribute, say C with which attributes A and B are associated (but in reality there is no associationbetween A and B). Such association may also be the result of the fact that the attributes A and Bmight not have been properly defined or might not have been correctly recorded. Researcher mustremain alert and must not conclude association between A and B when in fact there is no suchassociation in reality.
In order to judge the significance of association between two attributes, we make use of Chi-square test* by finding the value of Chi-square (χ2 ) and using Chi-square distribution the value ofχ2 can be worked out as under:
χ2
2
= ∑−O E
E
ij ij
ij
d ii = 1, 2, 3 …
where j = 1, 2, 3 …O
ij = observed frequencies
Eij = expected frequencies.
Association between two attributes in case of manifold classification and the resulting contingencytable can be studied as explained below:
We can have manifold classification of the two attributes in which case each of the two attributesare first observed and then each one is classified into two or more subclasses, resulting into what iscalled as contingency table. The following is an example of 4 × 4 contingency table with two attributesA and B, each one of which has been further classified into four sub-categories.
Table 7.2: 4 × 4 Contingency Table
Attribute A
A1
A2
A3
A4
Total
B1
(A1 B
1) (A
2 B
1) (A
3 B
1) (A
4 B
1) (B
1)
Attribute B B2
(A1 B
2) (A
2 B
2) (A
3 B
2) (A
4 B
2) (B
2)
B3
(A1 B
3) (A
2 B
3) (A
3 B
3) (A
4 B
3) (B
3)
B4
(A1 B
4) (A
2 B
4) (A
3 B
4) (A
4 B
4) (B
4)
Total (A1) (A
2) (A
3) (A
4) N
Association can be studied in a contingency table through Yule’s coefficient of association asstated above, but for this purpose we have to reduce the contingency table into 2 × 2 table bycombining some classes. For instance, if we combine (A
1) + (A
2) to form (A) and (A
3) + (A
4) to form
(a) and similarly if we combine (B1) + (B
2) to form (B) and (B
3) + (B
4) to form (b) in the above
contingency table, then we can write the table in the form of a 2 × 2 table as shown in Table 4.3
* See Chapter “Chi-square test” for all details.

Processing and Analysis of Data 147
Table 7.3
Attribute
A a Total
Attribute B (AB) (aB) (B)b (Ab) (ab) (b)
Total (A) (a) N
After reducing a contingency table in a two-by-two table through the process of combining someclasses, we can work out the association as explained above. But the practice of combining classesis not considered very correct and at times it is inconvenient also, Karl Pearson has suggested ameasure known as Coefficient of mean square contingency for studying association in contingencytables. This can be obtained as under:
CN
=+
χχ
2
2
whereC = Coefficient of contingency
χ2 = Chi-square value which is = ∑
−O E
E
ij ij
ij
d i2
N = number of items.
This is considered a satisfactory measure of studying association in contingency tables.
OTHER MEASURES
1. Index numbers: When series are expressed in same units, we can use averages for the purposeof comparison, but when the units in which two or more series are expressed happen to be different,statistical averages cannot be used to compare them. In such situations we have to rely upon somerelative measurement which consists in reducing the figures to a common base. Once such methodis to convert the series into a series of index numbers. This is done when we express the givenfigures as percentages of some specific figure on a certain data. We can, thus, define an indexnumber as a number which is used to measure the level of a given phenomenon as compared to thelevel of the same phenomenon at some standard date. The use of index number weights more as aspecial type of average, meant to study the changes in the effect of such factors which are incapableof being measured directly. But one must always remember that index numbers measure only therelative changes.
Changes in various economic and social phenomena can be measured and compared throughindex numbers. Different indices serve different purposes. Specific commodity indices are to serveas a measure of changes in the phenomenon of that commodity only. Index numbers may measurecost of living of different classes of people. In economic sphere, index numbers are often termed as
148 Research Methodology
‘economic barometers measuring the economic phenomenon in all its aspects either directly bymeasuring the same phenomenon or indirectly by measuring something else which reflects upon themain phenomenon.
But index numbers have their own limitations with which researcher must always keep himselfaware. For instance, index numbers are only approximate indicators and as such give only a fair ideaof changes but cannot give an accurate idea. Chances of error also remain at one point or the otherwhile constructing an index number but this does not diminish the utility of index numbers for they stillcan indicate the trend of the phenomenon being measured. However, to avoid fallacious conclusions,index numbers prepared for one purpose should not be used for other purposes or for the samepurpose at other places.2. Time series analysis:In the context of economic and business researches, we may obtain quiteoften data relating to some time period concerning a given phenomenon. Such data is labelled as‘Time Series’. More clearly it can be stated that series of successive observations of the givenphenomenon over a period of time are referred to as time series. Such series are usually the result ofthe effects of one or more of the following factors:
(i) Secular trend or long term trend that shows the direction of the series in a long period oftime. The effect of trend (whether it happens to be a growth factor or a decline factor) isgradual, but extends more or less consistently throughout the entire period of time underconsideration. Sometimes, secular trend is simply stated as trend (or T).
(ii) Short time oscillations i.e., changes taking place in the short period of time only and suchchanges can be the effect of the following factors:
(a) Cyclical fluctuations (or C) are the fluctuations as a result of business cycles and aregenerally referred to as long term movements that represent consistently recurringrises and declines in an activity.
(b) Seasonal fluctuations (or S) are of short duration occurring in a regular sequence atspecific intervals of time. Such fluctuations are the result of changing seasons. Usuallythese fluctuations involve patterns of change within a year that tend to be repeatedfrom year to year. Cyclical fluctuations and seasonal fluctuations taken togetherconstitute short-period regular fluctuations.
(c) Irregular fluctuations (or I), also known as Random fluctuations, are variations whichtake place in a completely unpredictable fashion.
All these factors stated above are termed as components of time series and when we try to analysetime series, we try to isolate and measure the effects of various types of these factors on a series. Tostudy the effect of one type of factor, the other type of factor is eliminated from the series. The givenseries is, thus, left with the effects of one type of factor only.
For analysing time series, we usually have two models; (1) multiplicative model; and (2) additivemodel. Multiplicative model assumes that the various components interact in a multiplicative mannerto produce the given values of the overall time series and can be stated as under:
Y = T × C × S × I
whereY = observed values of time series, T = Trend, C = Cyclical fluctuations, S = Seasonal fluctuations,I = Irregular fluctuations.

Processing and Analysis of Data 149
Additive model considers the total of various components resulting in the given values of theoverall time series and can be stated as:
Y = T + C + S + IThere are various methods of isolating trend from the given series viz., the free hand method, semi-average method, method of moving averages, method of least squares and similarly there are methodsof measuring cyclical and seasonal variations and whatever variations are left over are considered asrandom or irregular fluctuations.
The analysis of time series is done to understand the dynamic conditions for achieving the short-term and long-term goals of business firm(s). The past trends can be used to evaluate the success orfailure of management policy or policies practiced hitherto. On the basis of past trends, the futurepatterns can be predicted and policy or policies may accordingly be formulated. We can as well studyproperly the effects of factors causing changes in the short period of time only, once we haveeliminated the effects of trend. By studying cyclical variations, we can keep in view the impact ofcyclical changes while formulating various policies to make them as realistic as possible. Theknowledge of seasonal variations will be of great help to us in taking decisions regarding inventory,production, purchases and sales policies so as to optimize working results. Thus, analysis of timeseries is important in context of long term as well as short term forecasting and is considered a verypowerful tool in the hands of business analysts and researchers.
Questions
1. “Processing of data implies editing, coding, classification and tabulation”. Describe in brief these fouroperations pointing out the significance of each in context of research study.
2. Classification according to class intervals involves three main problems viz., how many classes shouldbe there? How to choose class limits? How to determine class frequency? State how these problemsshould be tackled by a researcher.
3. Why tabulation is considered essential in a research study? Narrate the characteristics of a good table.4. (a) How the problem of DK responses should be dealt with by a researcher? Explain.
(b) What points one should observe while using percentages in research studies?
5. Write a brief note on different types of analysis of data pointing out the significance of each.6. What do you mean by multivariate analysis? Explain how it differs from bivariate analysis.7. How will you differentiate between descriptive statistics and inferential statistics? Describe the important
statistical measures often used to summarise the survey/research data.
8. What does a measure of central tendency indicate? Describe the important measures of central tendencypointing out the situation when one measure is considered relatively appropriate in comparison to othermeasures.
9. Describe the various measures of relationships often used in context of research studies. Explain themeaning of the following correlation coefficients:
(i) ryx, (ii) ryx x1 2⋅ , (iii) Ry x x⋅ 1 2
10. Write short notes on the following:(i) Cross tabulation;(ii) Discriminant analysis;
150 Research Methodology
(iii) Coefficient of contingency;
(iv) Multicollinearity;(v) Partial association between two attributes.
11. “The analysis of time series is done to understand the dynamic conditions for achieving the short-termand long-term goals of business firms.” Discuss.
12. “Changes in various economic and social phenomena can be measured and compared through indexnumbers”. Explain this statement pointing out the utility of index numbers.
13. Distinguish between:(i) Field editing and central editing;
(ii) Statistics of attributes and statistics of variables;(iii) Exclusive type and inclusive type class intervals;(iv) Simple and complex tabulation;
(v) Mechanical tabulation and cross tabulation.14. “Discriminate use of average is very essential for sound statistical analysis”. Why? Answer giving
examples.15. Explain how would you work out the following statistical measures often used by researchers?
(i) Coefficient of variation;(ii) Arithmetic average;(iii) Coefficient of skewness;
(iv) Regression equation of X on Y;
(v) Coefficient of ryx x2 1⋅ .

Ap
pe
nd
ix: De
velo
pin
g a
Re
sea
rch P
lan
15
1Appendix
(Summary chart concerning analysis of data)
Analysis of Data(in a broad general way can be categorised into)
Processing of Data(Preparing data for analysis)
Analysis of Data(Analysis proper)
EditingCoding
ClassificationTabulation
Using percentages
Descriptive and Causal Analyses Inferential analysis/Statistical analysis
Uni-dimensionalanalysis
Bivariateanalysis(Analysis oftwo variablesor attributesin a two-wayclassification)
Multi-variateanalysis(simultaneousanalysis ofmore thantwo variables/attributes ina multiwayclassification)
Estimation ofparameter values
Testinghypotheses
Pointestimate
Intervalestimate
Para-metrictests
Non-parametrictests orDistributionfree tests
(Calculation of several measuresmostly concerning one variable)
(i) Measures of Central Tendency;(ii) Measures of dispersion;
(iii) Measures of skewness;(iv) One-way ANOVA, Index numbers,
Time series analysis; and(v) Others (including simple correlation
and regression in simple classificationof paired data)
Simple regression* andsimple correlation (inrespect of variables)Association of attributes(through coefficient ofassociation and coefficientof contingency)Two-way ANOVA
Multiple regression* and multiple correlation/partial correlation in respect of variablesMultiple discriminant analysis (in respect ofattributes)Multi-ANOVA (in respect of variables)Canonical analysis (in respect of both variablesand attributes)(Other types of analyses (such as factor analysis,cluster analysis)
* Regression analysis (whether simple or multiple) is termed as Causal analysis whereas correlation analysis indicates simply co-variation between two ormore variables.