methodology for the free allocation of emission allowances ... · of emissions are estimates for...
TRANSCRIPT
Methodology for the free allocation of emission allowances in the
EU ETS post 2012
Sector report for the ceramics industry
November 2009
Ecofys (project leader)
Fraunhofer Institute for Systems and Innovation Research
Öko-Institut
By order of the European Commission
Study Contract: 07.0307/2008/515770/ETU/C2
Ecofys project Number: PECSNL082164


i
Disclaimer and acknowledgements
Disclaimer The views expressed in this study represent only the views of the authors and not those of the
European Commission. The focus of this study is on preparing a first blueprint of an
allocation methodology for free allocation of emission allowances under the EU Emission
Trading Scheme for the period 2013 – 2020 for installations in the ceramic industry. The
report should be read in conjunction with the report on the project approach and general
issues. This sector report has been written by Ecofys.
Acknowledgements The authors would like to thank representatives from the ceramics industry for the in-depth
discussions on possible benchmarking options for the ceramics industry during the execution
of the project.
ii
Table of content
1 Introduct ion . . . . . . . . . . . . . . . . . . . . . . . . . . . . . . . . . . . . . . . . . . . . . . . . . . . . . 1
2 Product ion process and GHG emiss ions . . . . . . . . . . . . . . . . . 4
3 Benchmark ing methodology . . . . . . . . . . . . . . . . . . . . . . . . . . . . . . . . 6
3.1 Background .............................................................................................................. 6
3.2 Bricks and roof tiles ................................................................................................. 7
3.3 Wall and floor tiles................................................................................................. 12
3.4 Refractory products................................................................................................ 15
3.5 Other products........................................................................................................ 16
3.6 Overview of proposal of products to be distinguished........................................... 16
4 Benchmark va lues . . . . . . . . . . . . . . . . . . . . . . . . . . . . . . . . . . . . . . . . . . . . 19
4.1 Bricks and roof tiles ............................................................................................... 19
4.2 Wall and floor tiles................................................................................................. 23
4.3 Refractory products................................................................................................ 25
4.4 Other products........................................................................................................ 26
4.5 Overview of proposal for benchmark values ......................................................... 26
5 Addit iona l s teps required . . . . . . . . . . . . . . . . . . . . . . . . . . . . . . . . . . 27
6 Stakeholder comments . . . . . . . . . . . . . . . . . . . . . . . . . . . . . . . . . . . . . . 28
7 References . . . . . . . . . . . . . . . . . . . . . . . . . . . . . . . . . . . . . . . . . . . . . . . . . . . . . . 30
Appendix A: PRODCOM L ist 2007 . . . . . . . . . . . . . . . . . . . . . . . . . . . . . . 32
Appendix B : Add i t iona l benchmark curves . . . . . . . . . . . . . . . . . 33
1
1 Introduction
The ceramic manufacturing industry produces ceramic products, which are inorganic
materials (with possibly some organic content) made up of non-metallic compounds and made
permanent by a firing process. In addition to clay based materials, today ceramics include a
multitude of products with a small fraction of clay or none at all.
In order to acquire information on the ceramic manufacturing industry, Ecofys has been in
contact with the Cerame Unie which is an umbrella organization of eight ceramics sector
organization. Ecofys has been in contact with three of these organizations: the European Tiles
& Bricks Producers' Federation (TBE), the European Ceramic Tile Manufacturers' Federation
(CET), the European Refractories Producers Federation (PRE).
Table 1 provides an overview of the classification of the ceramic industry in relevant activity
classifications. The ceramic industry is associated with one category of activities in the Annex
I to original1 and amended
2 Greenhouse Gas Emission Allowance Trading Directive, which
will be referred to as the Directive. In the NACE Rev. 1.1, classification of economic
activities, the sector is associated with eight four-digit codes.
Table 1 Classification of the ceramic industry in the categories of activities of the Annex I of the
Directive and in the NACE Rev. 1.1 classification of economic activities
Category of activities according to Annex I to the original Directive
NACE Rev. 1.1 code
Description (NACE Rev. 1.1)
Installations for the manufacture of ceramic
products by firing, in particular roofing
tiles, bricks, refractory bricks, tiles,
stoneware or porcelain, with a production
capacity exceeding 75 tonnes per day,
and/or with a kiln capacity exceeding 4 m3
and with a setting density per kiln
exceeding 300 kg/m3
Category of activities according to Annex I to the amended Directive
26.21 Manufacture of ceramic household
and ornamental articles
26.22 Manufacture of ceramic sanitary
fixtures
Manufacture of ceramic products by firing,
in particular roofing tiles, bricks, refractory
bricks, tiles, stoneware or porcelain, with a
production capacity exceeding 75 tonnes
per day
26.23 Manufacture of ceramic insulators
and insulating fittings
1 Directive 2003/87/EC
2 Directive 2009/29/EC amending Directive 2003/87/EC

2
Continuation Table 1
26.24 Manufacture of other technical
ceramic products
26.25 Manufacture of other ceramic
products
26.26 Manufacture of refractory ceramic
products
26.30 Manufacture of ceramic tiles and
flags
Manufacture of ceramic products by firing,
in particular roofing tiles, bricks, refractory
bricks, tiles, stoneware or porcelain, with a
production capacity exceeding 75 tonnes
per day
26.40
Manufacture of bricks, tiles and
construction products, in baked
clay
There are currently 1097 open accounts in EU27 registered in the Community Independent
Transaction Log (CITL) that are specified in the original Annex I category of activities
associated with the ceramic manufacturing industry (CITL, 2009a). As a result of the change
in definition of ceramic installations in Annex I this number will increase to around 2000
(Cerame Unie, 2009c). No information is available on the number of ceramic producing
installations that are not covered by the ETS, because of their limited size. Many ceramic
installations have annual emissions below 25 kt CO2 and could be opted-out out by Member
States in the next EU ETS trading phase, e.g. regarding bricks and roof tile production, 90%
of installations in Spain and 60% of installations in France have annual emissions below 25 kt
CO2 (TBE, 2009a). Table 2 shows the distribution of installations included in the ETS
producing ceramic products per MS and Norway.
Table 2 Number of installations producing ceramic products per country (CITL, 2009a)
Country No. of installations Country No. of installations
Austria 33 Italy 35
Belgium 34 Latvia 6
Bulgaria 21 Lithuania 8
Cyprus 8 Netherlands 42
Czech Republic 64 Norway 3
Denmark 25 Poland 50
Estonia 2 Portugal 70
Finland 4 Romania 32
France 51 Slovakia 11
Germany 138 Slovenia 9
Greece 45 Spain 287
Hungary 43 Sweden 5
Ireland 3 United Kingdom 70
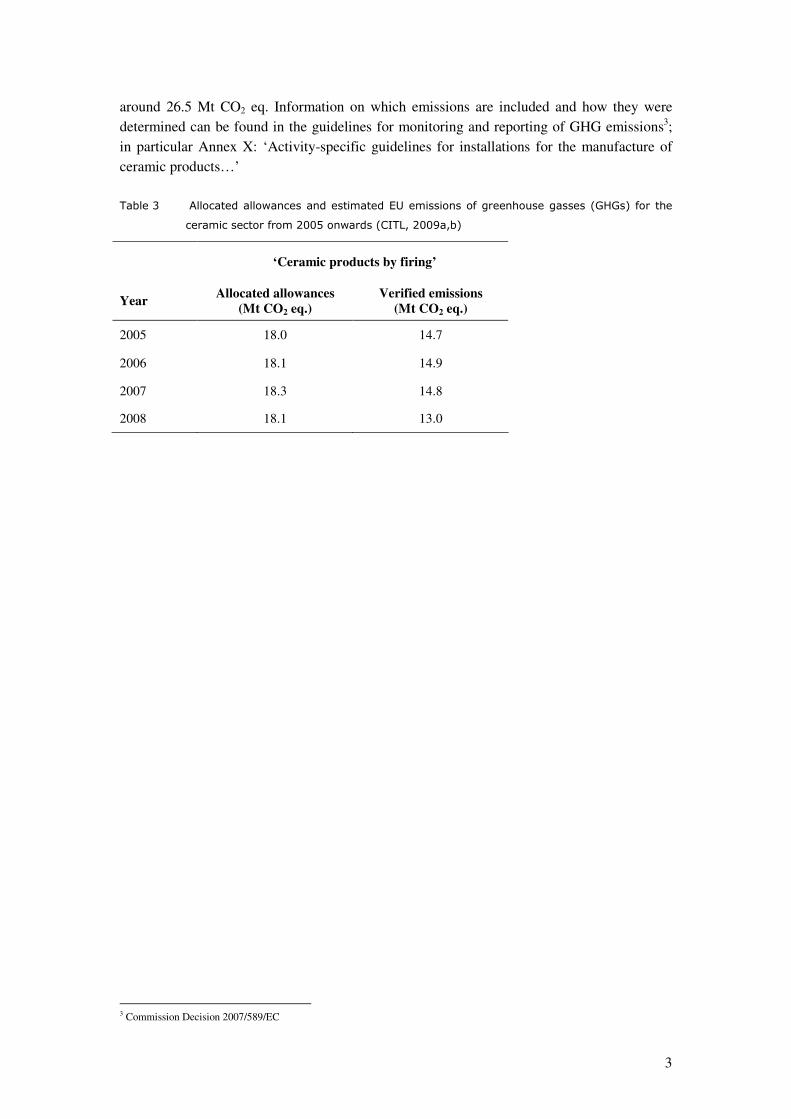
Table 3 lists the allocated allowances and verified EU27 emissions of greenhouse gasses
(GHGs) of the ceramics industry from 2005 onwards. According to estimates of Cerame Unie
(2009c) as of 2013 the total emissions for ceramic installations in the ETS will increase to
3
around 26.5 Mt CO2 eq. Information on which emissions are included and how they were
determined can be found in the guidelines for monitoring and reporting of GHG emissions3;
in particular Annex X: ‘Activity-specific guidelines for installations for the manufacture of
ceramic products…’
Table 3 Allocated allowances and estimated EU emissions of greenhouse gasses (GHGs) for the
ceramic sector from 2005 onwards (CITL, 2009a,b)
‘Ceramic products by firing’
Year Allocated allowances
(Mt CO2 eq.) Verified emissions
(Mt CO2 eq.)
2005 18.0 14.7
2006 18.1 14.9
2007 18.3 14.8
2008 18.1 13.0
3 Commission Decision 2007/589/EC
4
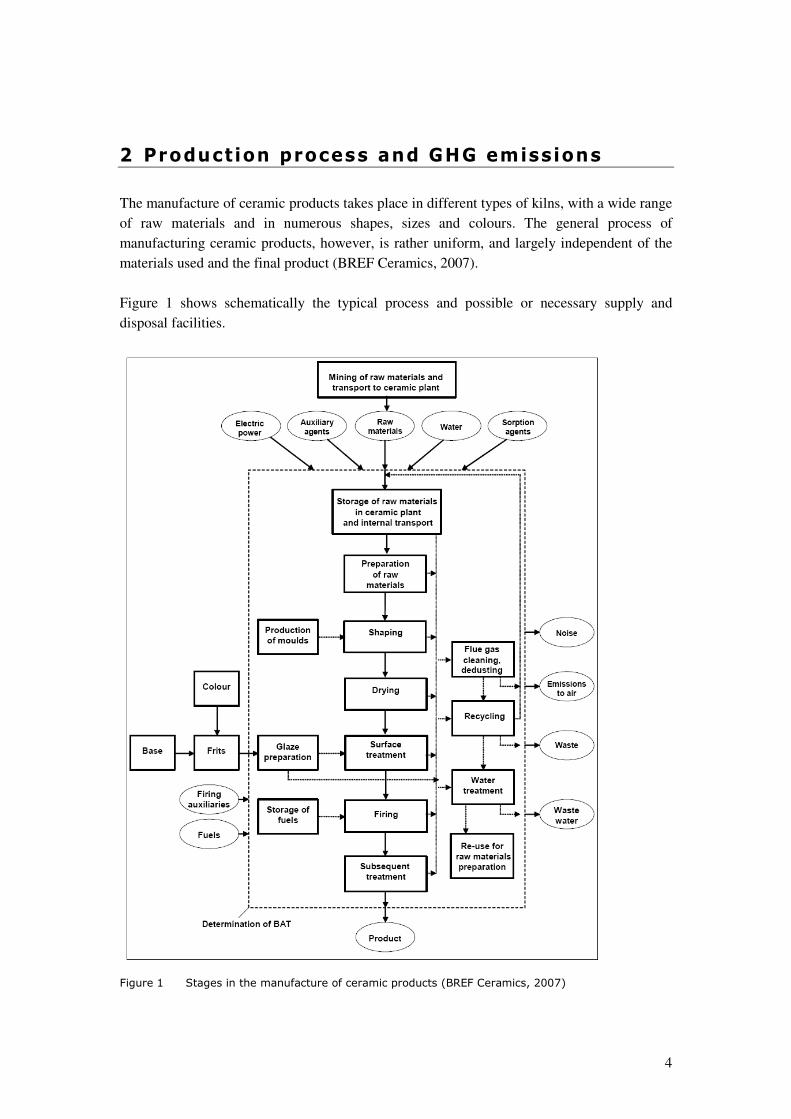
2 Production process and GHG emissions
The manufacture of ceramic products takes place in different types of kilns, with a wide range
of raw materials and in numerous shapes, sizes and colours. The general process of
manufacturing ceramic products, however, is rather uniform, and largely independent of the
materials used and the final product (BREF Ceramics, 2007).
Figure 1 shows schematically the typical process and possible or necessary supply and
disposal facilities.
Figure 1 Stages in the manufacture of ceramic products (BREF Ceramics, 2007)
5
The following main process steps can be distinguished (Enviros Consulting Limited, 2006):
1. Raw material preparation
2. Component mixing
3. Forming and shaping of ware
4. Drying of ware
5. Firing of ware
6. Product finishing
7. Addition of auxiliary materials
In general, raw materials are mixed and cast, pressed or extruded into shape. Water is
regularly used for a thorough mixing and shaping. This water is evaporated in dryers and the
products are either placed by hand in the kiln (especially in the case of periodically operated
kilns) or placed onto carriages that are transferred through continuously operated kilns (BREF
Ceramics, 2007).
Over 70% of the emissions from the ceramic manufacturing industry are created in the firing
process (Ceram data in BREF Ceramics, 2007). Carbon dioxide arises from the combustion of
fuel in the kiln, from calcinations of limestone or dolomite in the raw material and from
limestone, which is used to reduce air pollutants (Enviros Consulting Limited, 2006). Process
emissions are dependent on the mineral composition of the raw materials, which in most cases
consists mainly of the locally available clay. Process emissions vary between product groups,
mostly due to the mineral composition of the clay and the raw material mix.
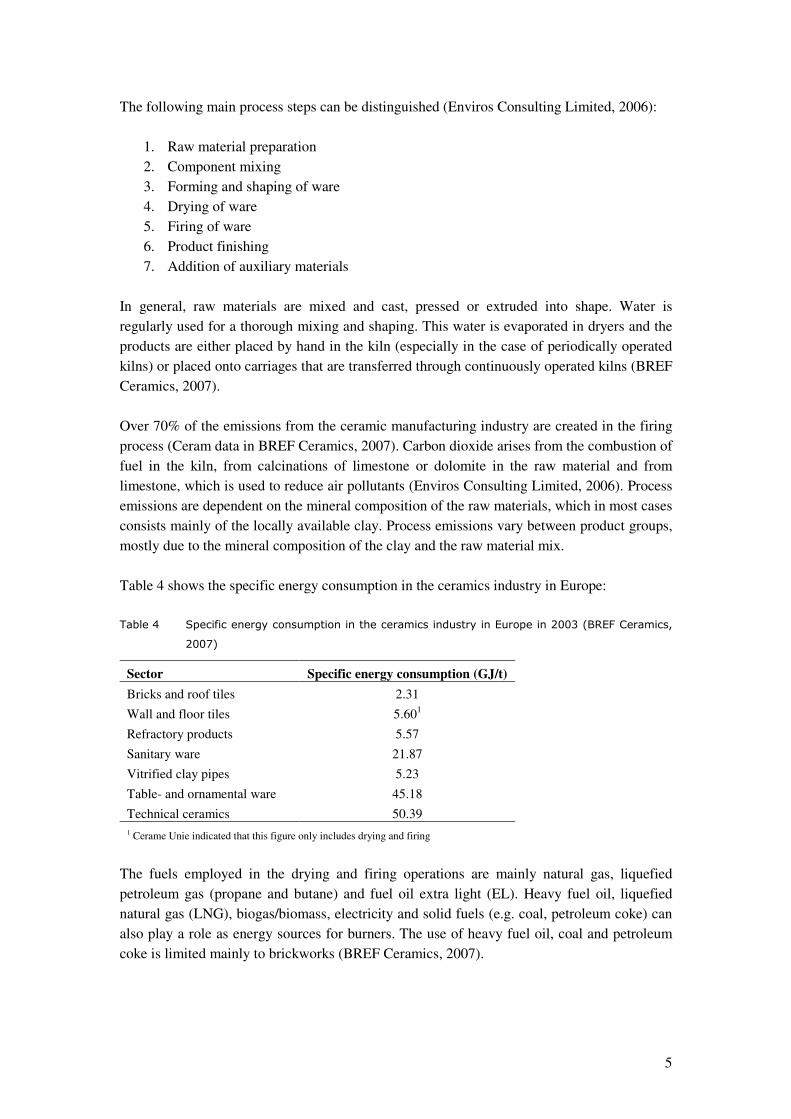
Table 4 shows the specific energy consumption in the ceramics industry in Europe:
Table 4 Specific energy consumption in the ceramics industry in Europe in 2003 (BREF Ceramics,
2007)
Sector Specific energy consumption (GJ/t)
Bricks and roof tiles 2.31
Wall and floor tiles 5.601
Refractory products 5.57
Sanitary ware 21.87
Vitrified clay pipes 5.23
Table- and ornamental ware 45.18
Technical ceramics 50.39
1 Cerame Unie indicated that this figure only includes drying and firing
The fuels employed in the drying and firing operations are mainly natural gas, liquefied
petroleum gas (propane and butane) and fuel oil extra light (EL). Heavy fuel oil, liquefied
natural gas (LNG), biogas/biomass, electricity and solid fuels (e.g. coal, petroleum coke) can
also play a role as energy sources for burners. The use of heavy fuel oil, coal and petroleum
coke is limited mainly to brickworks (BREF Ceramics, 2007).

6
3 Benchmarking methodology
3.1 Background
The ceramics industry produces a large variety of different products for different applications.
PRODCOM 2007 lists 17 six-digit and 48 eight-digit ceramic products (see appendix A). The
reference document on best available techniques distinguishes nine sub-sectors of ceramic
products (BREF Ceramics, 2007; pp. 6):
1. bricks and roof tiles
2. wall and floor tiles
3. refractory products
4. expanded clay aggregates
5. vitrified clay pipes
6. table- and ornamental ware
7. sanitary ware
8. technical ceramics
9. inorganic bonded adhesive
The energy consumption associated with product group was estimated using EU15 production
data and the specific energy consumption in the year 2000 as reported in the reference
document on best available techniques (BREF Ceramics ,2007) (see Table 5).
Table 5 Estimation of share of energy consumption of sub-sectors for EU15 in the year 2000
(BREF Ceramics, 2007)
Sub-sector Production
(Mt)
Specific energy
consumption
(GJ/t)
Energy
consumption
(TJ)
Relative share
of energy
consumption
Bricks and roof tiles 55 238 130.9 38%
Wall and floor tiles 25 5.741 143.5 42%
Refractory products 4.5 5.41 24.345 7%
Sanitary ware 0.5 20.88 10.44 3%
Vitrified clay pipes 0.7 6.10 4.27 1%
Table- and
ornamental ware 0.5
43.46
21.73 6%
Technical ceramics 0.15 34.72 5,208 2%
Expanded clay
aggregates (2002)
3.0
Inorganic bonded
abrasives (2003)
0.04
Total 340 100% 1 Cerame Unie indicated that this figure only includes drying and firing

7
Based on the estimated shares of energy consumption as given in Table 5, and discussion with
Cerame Unie (TBE, 2009a), the first three groups in this list are expected to account for close
to 80% of the emissions of the total ceramic manufacturing sector. The first two groups,
bricks and roof tiles and wall and floor tiles, together account for about two-thirds of
emissions, wall and floor tiles accounting for a slightly larger share (TBE, 2009a). The
emissions from the refractory industry covered by the ETS account for about 5% of total
ceramic industry emissions covered by the ETS (Cerame Unie, 2009d). Note that these shares
of emissions are estimates for the total European ceramic industry. Shares of emissions within
framework of the EU-ETS may differ because of opt-out of small installations
In section 4.4.3 of the report on the project approach and general issues, we discuss the issue
of product differentiation and give some guidance on how many products to distinguish.
Criteria to distinguish products as proposed in that section are related to the amount of
emissions associated with a certain product, the difference in emission intensity compared to
other products, the number of installations that produce a product, the existence of a clear
product differentiation and whether a product is sold as an intermediate product. In case of the
ceramic sector, we found that that there was a need to provide some additional guidance on
product differentiation based on physical properties.
There are different considerations that play a role when distinguishing products. Apart from
the ones described in section 4.4.3 of the report on the project approach and general issues
and the ones that will not be take into account in accordance with the principles as laid down
in section 4.4 of the report on the project approach and general issues (e.g. production
technology, raw material input), we encountered three arguments to distinguish products
within groups that can be distinguished based on the general type of application (e.g. bricks
versus floor tiles): difference in material characteristics (e.g. density, frost resistance),
difference in specific application, and appearance (shape and aesthetics). Although we
acknowledge differences in the specific application of products, we aim to use that argument
only in an indirect way, since in our line of thought it should be covered by the other two: the
material characteristics and appearance make a product more suitable for a particular
application.
We choose only to take differences in material characteristics and difference in appearance in
account if they make a product more suitable for a particular application in terms of technical
requirements. Consequently, we will not distinguish products on the basis of aesthetical
differences. That way, products with a similar quality, but higher carbon intensity because of
an aesthetic feature will be more expensive to produce, thereby providing an incentive to
produce products with lower carbon intensity.
In the following sections, product differentiation following the approach described above will
be discussed for the main subsectors.
3.2 Br icks and roof t i les
The products produced by bricks and roof tiles manufacturers can be grouped in different
ways. Table 6 gives an overview of different ways of distinguishing main product groups. In
8
the text below, the main product groups according to the grouping used by TBE will be
discussed in more detail. Unless noted otherwise, information was provided by TBE.
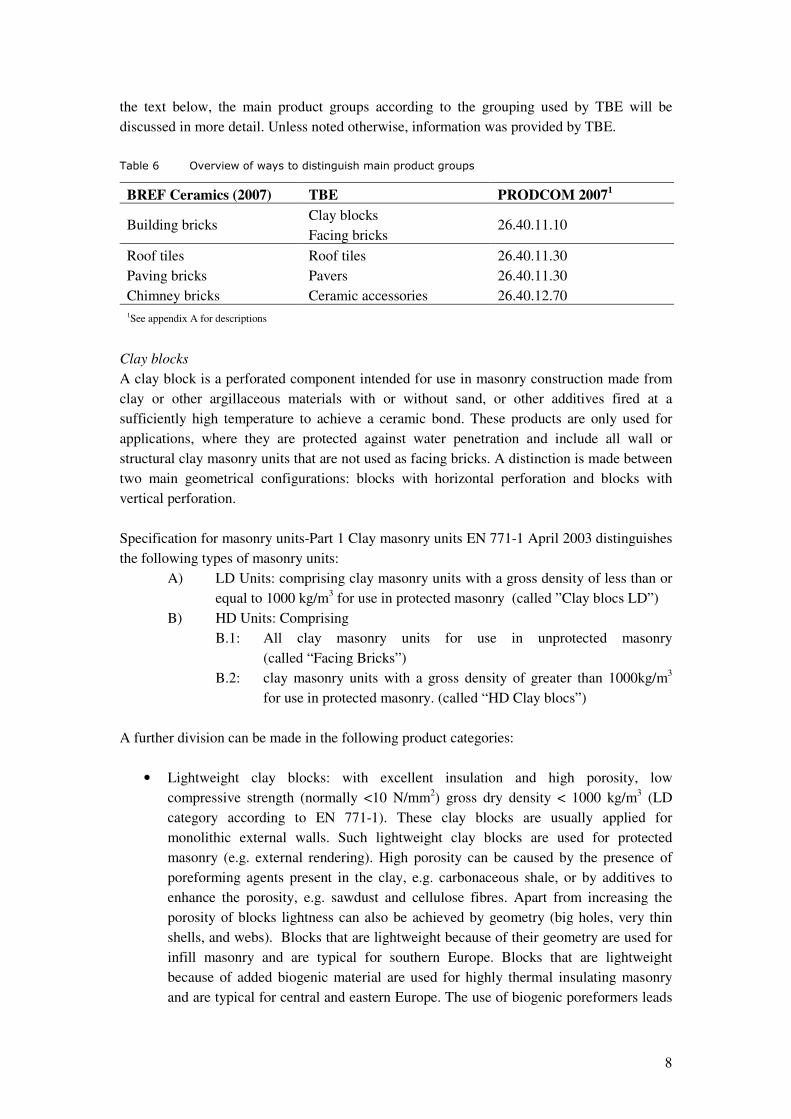
Table 6 Overview of ways to distinguish main product groups
BREF Ceramics (2007) TBE PRODCOM 20071
Clay blocks Building bricks
Facing bricks 26.40.11.10
Roof tiles Roof tiles 26.40.11.30
Paving bricks Pavers 26.40.11.30
Chimney bricks Ceramic accessories 26.40.12.70
1See appendix A for descriptions
Clay blocks
A clay block is a perforated component intended for use in masonry construction made from
clay or other argillaceous materials with or without sand, or other additives fired at a
sufficiently high temperature to achieve a ceramic bond. These products are only used for
applications, where they are protected against water penetration and include all wall or
structural clay masonry units that are not used as facing bricks. A distinction is made between
two main geometrical configurations: blocks with horizontal perforation and blocks with
vertical perforation.
Specification for masonry units-Part 1 Clay masonry units EN 771-1 April 2003 distinguishes
the following types of masonry units:
A) LD Units: comprising clay masonry units with a gross density of less than or
equal to 1000 kg/m3 for use in protected masonry (called ”Clay blocs LD”)
B) HD Units: Comprising
B.1: All clay masonry units for use in unprotected masonry
(called “Facing Bricks”)
B.2: clay masonry units with a gross density of greater than 1000kg/m3
for use in protected masonry. (called “HD Clay blocs”)
A further division can be made in the following product categories:
• Lightweight clay blocks: with excellent insulation and high porosity, low
compressive strength (normally <10 N/mm2) gross dry density < 1000 kg/m
3 (LD
category according to EN 771-1). These clay blocks are usually applied for
monolithic external walls. Such lightweight clay blocks are used for protected
masonry (e.g. external rendering). High porosity can be caused by the presence of
poreforming agents present in the clay, e.g. carbonaceous shale, or by additives to
enhance the porosity, e.g. sawdust and cellulose fibres. Apart from increasing the
porosity of blocks lightness can also be achieved by geometry (big holes, very thin
shells, and webs). Blocks that are lightweight because of their geometry are used for
infill masonry and are typical for southern Europe. Blocks that are lightweight
because of added biogenic material are used for highly thermal insulating masonry
and are typical for central and eastern Europe. The use of biogenic poreformers leads
9
to lower specific fossil fuel consumption, because of the energy input associated with
these additives.
• Ordinary clay blocks: With a low porosity. These blocks belong either to the LD or
HD category according to EN 771-1 and are generally used in walls with external or
internal additional insulation.
• Heavy clay blocks: with high mechanical resistance, high compressive strength
(normally > 10 N/mm2), high thermal capacity, high acoustic insulation); either infill
blocks or perforated blocks with a low percentage of voids, no poreforming agents,
gross dry density > 1000 kg/m3 (HD according to EN 771-1). These clay blocks are
usually applied for the inner leaf in cavity wall constructions with facing bricks for
the outer leaf and also for internal partition walls (acoustic performance).
• Floor slabs and floor blocks: clay blocks used in conjunction with beams in
compliance with EN 15037-1 and/or cast-in-situ concrete (topping) for the
construction of beam-and-block floor systems. Also, clay floor slabs with infill blocks
for beam and block floor systems in many different sizes and shapes according to EN
15037-2.
• Roof boarding sarking: clay units used for the massive underconstruction of clay
roofs.
Facing bricks
Facing bricks are used for the outer leaf of buildings with cavity walls. Such facing bricks are
used for unprotected masonry and therefore need to be frost-resistant. They also play an
important role in the aesthetics of the building (architectural styles, colour combinations etc.).
Facing Bricks exist in different colours, which results in a significantly different energy
consumption and fuel CO2 emission due to different firing temperatures and in a different
process CO2 emission due to different carbon and different lime (CaO) content in the clay as
well as significantly different iron or to lime (Fe2O3/CaO) ratios. These different colours are
closely related to local availability of raw materials (types of clays), local wishes and building
traditions from planners and costumers. Four basic colours can be distinguished: red, yellow,
white and blue.
• Red, rosé and yellow colours and other shades: the Fe203/CaO-ratio in the raw
materials mix can vary significantly, usually with a higher CaCO3 content for rosé or
yellow colours. Firing temperatures also vary significantly between 1000 and
1150°C, strongly influenced by both the iron (Fe2O3) and the lime (CaCO3) content.
A higher carbon and/or lime content results in higher energy consumption and higher
specific CO2 output. To produce a specific locally requested colour can therefore
result in a significantly higher process CO2 output of up to approx. +100 kg process
CO2/ton and to a significantly higher energy consumption of approx. +10 Nm3
gas/1000 bricks or approximately +47 kWh/ton compared to “standard” bricks.
• White colours: firing temperature between 1150°C and 1200°C with approx. +30
Nm3 gas/1000 bricks or +120 kWh/ton in comparison to red bricks.
• Blue colours: braised facing bricks, fired in high reduced atmosphere and
significantly higher temperature; mostly in intermittent chamber kilns with higher
specific energy consumption (approximately +60 Nm3/1000 bricks or +250 kWh/ton
in comparison to plain red bricks).
10
Pavers
In general the features that are mentioned above to distinguish between the various types of
facing bricks will also apply to pavers. Pavers have a significantly different product
performance; they have a higher compressive strength, a lower porosity, lower water
absorption and higher abrasion resistance. To be frost resistant pavers are usually fired at
higher temperatures resulting into approximately +30 Nm3 gas /1000WF or 130 kWh/ton
compared to fired facing bricks. Pavers exist in different colours such as red, yellow, and blue
braised.
Roof tiles
In EN 1304:2005 requirements for clay roofing tiles and fittings for pitched roof coverings
and wall cladding and lining, the following types of tiles are defined:
A) Special tiles: tiles made to shapes that vary from tile to tile for aesthetic reasons.
B) Interlocking tiles with sidelock and/or headlock: tiles pressed in moulds in different
sizes from approx. 8 pieces/m2 to 25 pieces/m
2:
B.1 large sized interlocking tiles < 12 pieces/m2
B.2 medium sized interlocking tiles: 12-17 pieces/m2
B.3 small sized interlocking tiles: > 17 pieces/m2
C) Plain tiles: tiles usually with a flat surface that can be slightly cross cambered and/or
longitudinally cambered and which have no interlocking system;
D) Overlapping tiles: tiles which have no side or headlock and are profiled in an “S”
shape.
E) Over and under tiles: tiles with the shape of a gutter whose design makes it possible
either to fix them with variable headlaps or where their headlap is fixed due to the
presence of lugs on the tiles. They are made with their edges either parallel or
forming a cone;
F) Clay roofing fittings: products that are complementary to the tiles have complex
shapes and have a technical function.
Roof tiles are produced with three purposes in mind:
1. Roof-covering with weathering protection. The diversity of climatic conditions
throughout Europe explains the diversity of roof tile characteristics according to the
regional requirements. The major climatic aggression to which roof tiles are exposed
is frost. The recent European standardisation for CE marking fixed a common method
to measure frost resistance all over Europe, but allowed for each Member State to fix
the minimum requirement for its domestic market. These minimum requirements
throughout Europe (50 freeze-thaw cycles in the South of Europe, 150 cycles in the
North). Frost resistance is directly connected to firing temperature of the tiles and
hence to energy consumption and CO2 emissions. Roof tiles close to the seaside have
to resist aggression by saline atmospheres. Increasing this specific quality also
depends on increasing the firing temperature.
In the South of Europe roofs are low pitched. Therefore roof tiles have a highly
curved design to drain rainwater coming in short but with heavy showers. Roof tiles

11
are either Roman tiles (the traditional type) or curved interlocking tiles reproducing
the aspect of Roman tiles, usually with big sizes (<15 pieces/m2). In the North of
Europe, roofs have a high pitch. Therefore roof tiles are plain tiles (the traditional
type), or interlocking tiles with shapes varying from curved to totally flat.
2. Aesthetics of the building i.e. architectural styles with different colours, shapes,
dimensions
3. Renovation and maintenance purposes i.e. repair of old and protected historic
buildings with existing or new roof tile shapes. Roughly half of the market for roof
tiles is for repair - therefore old shapes and colours have to be produced beside newer
models. Many urban planning regulations also impose the use of "historical" types of
roof tiles even for new buildings.
The quality standards and different colours are materialized during the firing process of the
roof tiles with the support of refractory firing accessories such as U- or H-setters. The relation
between the weight of the refractory support (cassettes) and the weight of the roof tiles
significantly influence the energy consumption and consequently the emissions. Glazed roof
tiles are better protected against damage in the kiln when H-cassettes are used, but the use of
these H-cassettes leads to lower setting density and higher specific emissions.
Ceramic accessories
The following products can be considered to be accessories that can not be included in any of
the other groups based on their specific application and shape:
• Cladding products: the increased use of thermal insulation placed on the outside of
building walls and frame construction buildings has led manufacturers of clay
products to develop cladding elements which are able to protect the specific thermal
insulation used and the outer coating. Several solutions based on fired clay products
are available on the market.
• Flue blocks for chimneys: flue blocks are fired clay components that can be used to
put up chimneys. The product is mainly used in France and Italy.
• Very long bricks (also known as storey-height bricks)
• Clay shells for beams and lintels: Shells for beams of beam and block floor systems
and for lintels. These shells are filled with either reinforced or prestressed
concrete.
Final proposal for products to be distinguished
Having looked at the information send to us by TBE, taking into account the existence of
product classifications and following our approach described in section 3.1, we propose
distinguishing the following product groups:
• Clay blocks: two products groups: LD units (<1000 kg/m3) and HD units (>1000
kg/m3) used for protected masonry based on EN 771-1; This differentiation is
justified based on the different material properties of the product groups, most
notably porosity, which make them better suited for particular applications. No
classification was found to distinguish more products. Also, we do not distinguish
product based on a difference in application only.
12
• Facing bricks: one product group; HD units (>1000 kg/m3) used for unprotected
masonry based on EN 771-1. We propose not to distinguish types of bricks based on
colour in accordance with our approach not to distinguish products based on
aesthetics differences alone (see section 3.1). Another reason not to distinguish types
of bricks based on colour is that no unambiguous product classification exists that
takes into account difference on colour.
• Pavers: one product group. As for bricks, we propose not to distinguish types of
pavers based on colour.
• Roof tiles: In accordance with our approach not to distinguish products based on
aesthetics differences alone (see section 3.1), we propose not to distinguish types of
roof tiles based on colour or shape of roof tile due to roof pitch. A differentiation
based on frost resistance and resistance to saline atmospheres could be justified since
these features of roof tiles can be regarded as material characteristics that make a
product more suitable for a particular application in terms of technical requirements.
Differentiation can be based on classes and types of tiles as defined in EN 1304:2005.
We propose to regard clay roofing fittings (defined in EN 1304:2005) as speciality
products since they have very specific shapes needed for specific applications. (see
below).
• A speciality group including ceramics accessories (cladding products, flue blocks for
chimneys, very long bricks, clay shells for beams and lintels) and clay roof fittings.
These products are in this group since they have very specific shapes needed for
specific applications.
The availability of more information could lead to the insight that it would be appropriate to
distinguish more products or that there are products within the first four product groups that
should be regarded as specialties. It is stressed that the present differentiation of product
groups follows from the approach as described in section 3.1.
3.3 Wal l and f loor t i les
The description below is based on information from Cerame Unie (2009b). The European
Standard that defines and gives terms, requirements and marking criteria for ceramic tiles
(produced by extrusion and dust pressing techniques) is EN 14411 “Ceramic tiles –
Definitions, classification, characteristics and marking“.
This standard defines “ceramic tiles” as follows: Thin slabs made from clays and/or other
inorganic raw materials, generally used as coverings for floor and walls, usually shaped by
extruding (A) or pressing (B) at room temperature but may be formed by other processes (C),
then dried and subsequently fired at temperatures sufficient to develop the required
properties, tiles can be glazed (GL) or unglazed (UGL) and are incombustible and unaffected
by light.
Ceramic tiles can be divided into groups according to their method of manufacture and their
water absorption:

13
Methods of manufacture:
A Extruded tiles
B Dry-pressed tiles
Water absorption (E):
• Group I: Tiles of low water absorption (E ≤ 3%)
o a) E ≤ 0,5 %
o b) 0.5% ≤ E ≤ 3%
• Group II: Tiles of medium water absorption (3% ≤ E ≤ 10%)
o a) 3% ≤ E ≤ 6%
o b) 6% ≤ E ≤ 10%
• Group III: Tiles of high water absorption (E ≥ 10%)
The majority of the European wall and floor tile production is shaped by dry-pressing. Dry-
pressed tiles can be divided in wall tiles and floor tiles by considering differences in water
absorption: larger than 10% for wall tiles4 (Group III) and smaller than 10% for floor tiles
(Groups I and II). The characteristic of the water absorption or porosity of the ceramic tiles
provides information on the mechanical resistance of the tiles: the lower the water absorption
or porosity of the tile, the higher is its mechanical resistance. The main properties of wall and
floor tiles that distinguish them from one another are:
Wall tiles:
• Thickness < 10 mm; water absorption between 11-15%; breaking strength 300-
1200N; not frost resistant.
• Wall tiles can only be used as coverings for internal walls.
Floor tiles:
• Thickness > 8 mm; water absorption between 0.1- 6%; breaking strength 1000-
5000N; those with low water absorption are frost resistant.
• Floor tiles can be used as a covering for internal and external walls, internal or
external floor, and special uses, since they have better technical properties. Floor tiles
that have lower water absorption can be used for external uses, and the ones that have
medium water absorption only can be used for internal residential and commercial
floorings.
In manufacturing plants of wall and floor tiles different types of products are manufactured at
the same time, and no information on energy consumption per type of tile is available. As a
consequence, no information on energy consumption and CO2 emissions per type of product
is available at installation level. However, it is known from a technical point of view that wall
tiles consume more energy in the firing stage than floor tiles:
• Although the production of wall tiles requires lower temperatures and the firing cycle
can be shorter, the raw materials contain more carbonates than those used for floor
tiles: on average 10% for porous wall tiles and 1% for vitrified floor tiles (Timellini
4 Although this distinction related to water absorption is considered to be a general rule, in some cases ceramic tiles with water
absorption >10% are also adequate for flooring.
14
& Blasco-Fuentes, 1993). Since the decomposition of carbonates is an endothermic
reaction, it leads to an increased need for energy input.
• The average density of floor tiles in the furnace is higher than that of wall tiles.
Therefore, during firing, a smaller share of energy is wasted per tonne product to heat
the kiln interior (walls and furniture such as kiln cars).
• The higher content of carbonates also leads to higher process emissions: process
emissions for wall tiles usually represent about 25% of total emissions, while for floor
tiles this share is about 5-10%.
Apart from the end-products discussed above, the production of dry-pressed ceramic tiles also
entails an intermediate sold product: spray dried powder which is obtained in the first step of
the manufacturing process. There are no codified standards for this product. At European
level there is no information available on the CO2 emissions per process step. However, based
on data of the most significant Italian plants in terms of energy requirements (BREF
Ceramics, 2007) and an estimation of the Spanish National Association of Manufacturers
following an internal survey (Cerame Unie, 2009d), the emissions from spray drying are
considered to account for about 30% of the total emissions due to dry-pressed ceramic tile
production, using natural gas consumption data. Spray dried powder production may involve
cogeneration, which is commonly done by using the exhaust gases in natural gas turbines.
Extruded tiles are rustic tiles and are thicker than dry-pressed tiles. They are normally used as
flooring in terraces and balconies, but can also be used in industrial areas. Energy
consumption for extruded tiles is 2 to 3 times as high as for dry-pressed ones. Extruded
ceramic tiles account for about 5% of the total emissions from ceramic tiles production
(Cerame Unie, 2009d).
Final proposal for products to be distinguished For wall and floor tiles there is a clear product classification. Dry-pressed wall tiles and dry-
pressed floor tiles are distinguished based on a difference in water absorption which are
material characteristics. Based on Cerame Unie (2009b) we conclude that these two products
would account for the great majority of the emissions from ceramic tile production.
As explained in the previous section, the production of wall and floor tiles also entails the
production of an intermediate sold product: spray dried powder. Following the principle to
use separate benchmarks for intermediate products (see section 4.4 of the report on the project
approach and general issues), we propose not to include the production of spray dried powder
in the end-product benchmark(s) for ceramic tiles and to consider it as a separate product.
Apart from the production of dry-pressed tiles, the subsector wall tiles and floor tiles also
covers the production of extruded tiles. The difference between dry-pressed tiles and tiles is
amongst others related to process technology. Distinguishing extruded tiles as a separate
product based on the difference in process technology employed would however not be in line
with the principles laid down in section 4.4 of the report on the project approach and general
issues. Another difference between extruded tiles and dry-pressed tiles is thickness: extruded
tiles are thicker than dry-pressed tiles. However, since we consider thickness to be an
aesthetic feature, distinguishing extruded tiles as a separate product group based on a

15
difference in thickness would not be in line with the approach to distinguish products as
outlined in section 3.1. One argument to define extruded tiles as a separate product is that
some extruded products -such as angles, pieces for stairs, and all types of peaces- can not be
produced by dry-pressing (Cerame Unie, 2009b).
Regardless of the discussion in the previous paragraph, we propose to consider extruded tiles
as a separate product group, since the production of extruded tiles does not require spray dried
powder production, whereas the production of dry-pressed tiles does. As a consequence, a
single benchmark for dry-pressed tile production and extruded tiles production would not be
appropriate: for dry-pressed tiles the benchmark would account for part of the production
process to come to an end-product, whereas for extruded tiles it would account for the whole
production process. Because of the small amount of emissions associated with the production
of extruded tiles (5% of the total emissions from ceramic tiles production) and the limited
amount of data available, we propose to group extruded tiles together with specialty products.
3.4 Refractory products
The refractory industry is characterized by a very wide variety of products with different
shapes and technical characteristics required for the different applications in which these
products are used. Refractory products are used in all industrial processes where temperatures
exceed 600°C. PRODCOM 2007 lists 3 six-digit and 10 eight-digit refractory products. In
terms of 6-digit PRODCOM 2007 codes, the refractory industry produces the following
products:
• PRODCOM 26.26.11: Bricks, blocks, tiles and other ceramic goods of siliceous fossil
meals (for example, kieselguhr, tripolite or diatomite) or of similar siliceous earths
• PRODCOM 26.26.12: Refractory bricks, blocks, tiles and similar refractory ceramic
constructional goods, other than those of siliceous fossil meals or similar siliceous
earths.
• PRODCOM 26.26.14: Other refractory ceramic goods (for example, retorts,
crucibles, muffles, nozzles, plugs, supports, cupels, tubes, pipes, sheaths and rods),
other than those of siliceous fossil meals or of similar siliceous earths.
The products in the latter group are diverse in terms of their shape which is generally a more
complex shape than the products in the other two groups. They will therefore typically have a
lower setting density resulting in higher energy consumption and higher emissions.
A classification between low-heat resistant and high-heat resistant products is based on the
ISO standard R836 from 1968, which was revised in 2001 (ISO 836:2001). This standard on
“terminology for refractories” is based on the German standard DIN 51060 and defines the
following categories:
• Heat resistant products: firing temperature < 1500°C
• Refractory products: firing temperature > 1500°C
• Highly refractory products: firing temperature > 1800°C
16
Final proposal for products to be distinguished For refractory products there are clear product classifications based on the Combined
Nomenclature/PRODCOM and on the firing temperature. We propose to distinguish three
product groups:
• PRODCOM 26.26.11 and 26.26.12: High-heat resistant products: firing temperature
>1500°C ( based on ISO 836:2001)
• PRODCOM 26.26.11 and 26.26.12: Low-heat resistant products: firing temperature
<1500°C ( based on ISO 836:2001)
• PRODCOM 26.26.14: Other refractory ceramic goods.
The differentiation between the first two groups is based on a difference in material
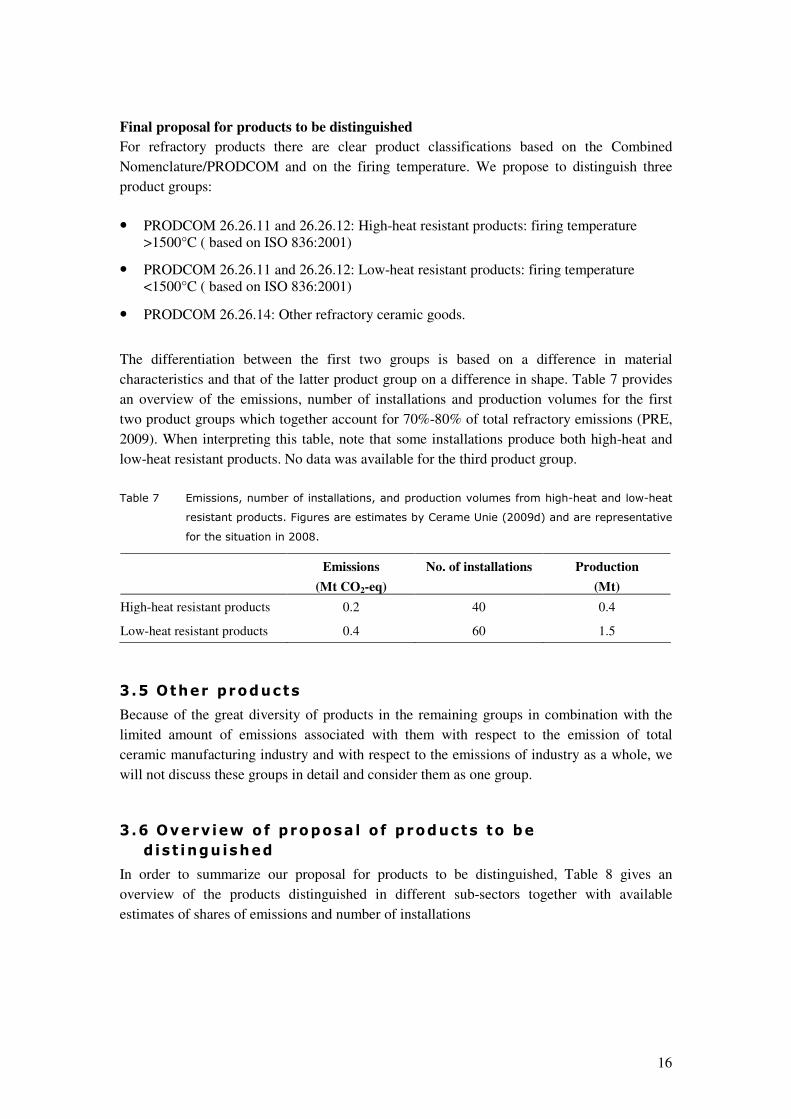
characteristics and that of the latter product group on a difference in shape. Table 7 provides
an overview of the emissions, number of installations and production volumes for the first
two product groups which together account for 70%-80% of total refractory emissions (PRE,
2009). When interpreting this table, note that some installations produce both high-heat and
low-heat resistant products. No data was available for the third product group.
Table 7 Emissions, number of installations, and production volumes from high-heat and low-heat
resistant products. Figures are estimates by Cerame Unie (2009d) and are representative
for the situation in 2008.
Emissions
(Mt CO2-eq)
No. of installations Production
(Mt)
High-heat resistant products 0.2 40 0.4
Low-heat resistant products 0.4 60 1.5
3.5 Other products
Because of the great diversity of products in the remaining groups in combination with the
limited amount of emissions associated with them with respect to the emission of total
ceramic manufacturing industry and with respect to the emissions of industry as a whole, we
will not discuss these groups in detail and consider them as one group.
3.6 Overv iew o f proposa l o f products to be
d is t ingu ished
In order to summarize our proposal for products to be distinguished, Table 8 gives an
overview of the products distinguished in different sub-sectors together with available
estimates of shares of emissions and number of installations
17
Table 8 Overview of proposal for products to be distinguished
Product Definition Share of emissions w.r.t. total ceramic industry1,2
No. of installations
Bricks and roof tiles 30%
- Low-density clay
blocks
PRODCOM:
- 26.40.11.10
EN 771-1:
- Density: <1000 kg/m3
- High-density
clay blocks
PRODCOM:
- 26.40.11.10
EN 771-1:
- Density: >1000 kg/m3
- Unprotected masonry
- Facing bricks PRODCOM:
- 26.40.11.10
EN 771-1:
- Density: >1000 kg/m3
- Protected masonry
- Pavers PRODCOM:
- 26.40.11.30
- Roof tiles3 PRODCOM:
- 26.40.12.50
EN 1304:2005:
- All groups except for clay
roof fittings
Wall and floor tiles 35%
- Wall tiles PRODCOM:
- 26.30.10
EN 14411:
- Dry-pressed
- Water absorption: >10%
Together with
floor tiles: 22%
18
Continuation Table 8
- Floor tiles PRODCOM:
- 26.30.10
EN 14411:
- Dry-pressed
- Water absorption: <10%
Together with
wall tiles:22%
- Spray dried
powder
Unclear whether standards are
available, benchmark refers to
0% humidity
11%
Refractory products 5%
- High-heat
resistant products
PRODCOM:
- 26.26.11
- 26.26.12
ISO 836:2001:
- Firing temp.: >1500°C
1% 40
- Low-heat
resistant products
PRODCOM:
- 26.26.11
- 26.26.12
ISO 836:2001:
- Firing temp.: <1500°C
2% 20
Specialty products PRODCOM:
- 26.21
- 26.22
- 26.23
- 26.24
- 26.25
- 26.26.14
- 26.30.10 (EN 14411: B)
- 26.40.12.70
- 26.40.13.00
1 Shares of emissions are rough estimates for total European ceramic industry. For further explanations we refer to the sector
descriptions given in this Chapter. Shares of emissions within framework of the EU-ETS may differ because of opt-out of
small installations 2 Sum of estimates of emissions of products considered in a sub-sector may not be equal to that of the sub-sector (in italics),
since products covered by a sub-sector may be grouped together with specialty products. 3 Differentiation based on difference in frost resistance and resistance to saline atmospheres could be justified using EN
1304:2005 to define classes and types of roof tiles.

19
4 Benchmark values
In this chapter benchmark values for different sub-sectors are proposed. As a result of data
collection and analysis of the respective sector organizations, a considerable amount of
information needed to construct benchmark curves has become available. Nevertheless, none
of the benchmark values proposed was determined completely in accordance the approach
proposed on the basis of our interpretation of amended Directive text (see section 4.4 of the
report on the project approach and general issues). Consequently, all values should be
regarded as preliminary.
4.1 Br icks and roof t i les
TBE has collected data from 80-90% of installations (small, medium and large sites) in 18
Member States5, together accounting for 80-90% of total sub-sector emissions (TBE, 2009a).
The data set provided by TBE includes both process and fuel emissions only for 2007, as data
for 2008 are not available yet. The sample covers only single-product installations, as for
installations producing more than one product it is not possible to allocate emissions to each
product. Moreover, the sample does not cover at all or only partially those countries (excl.
Cyprus, Malta, Greece, Poland, Hungary) where specific emissions are expected to be higher
due to the different fuel mix. Using the collected data, TBE was able to construct benchmark
curves for three product groups: clay blocks, facing bricks and roof tiles.
TBE provided the graphs for each product category excluding the best and worst 10%
installations of the available sample, since having considered the above, they regard these
curves to give a more representative picture of the whole European industry. We note that the
exclusion of the best and worst 10% installations is not in line with Article 10a (2) of the
amended Directive stating that the starting point for benchmarks shall be the average
performance of the 10% most efficient installations, nor with our proposed approach to take
into account the presence of data outliers (see section 4.4.1 of the report on the project
approach and general issues).
The respective curves are presented in Figure 2, 3 and 4. The figures show the curves
differentiating process emissions and emissions due to the use of fuels. Note that the curve for
clay blocks also includes emissions from biomass origin which are not included in the EU
ETS and therefore should be left out. As noted in section 3.2, the use of biogenic poreformers
leads to lower specific fossil fuel consumption, because of the energy input associated with
these additives.
5 Austria, Belgium, Czech Republic, Germany, Denmark, Finland, France, Hungary, Italy, the Netherlands, Poland, Portugal,
Romania, Slovakia, Slovenia, Spain, Sweden and the UK.

20
Figure 2 Part of benchmark curve for clay blocks; 10th to 90th percentile (TBE, 2009c)
Figure 3 Part of benchmark curve for facing bricks; 10th to 90th percentile (TBE, 2009c)
21
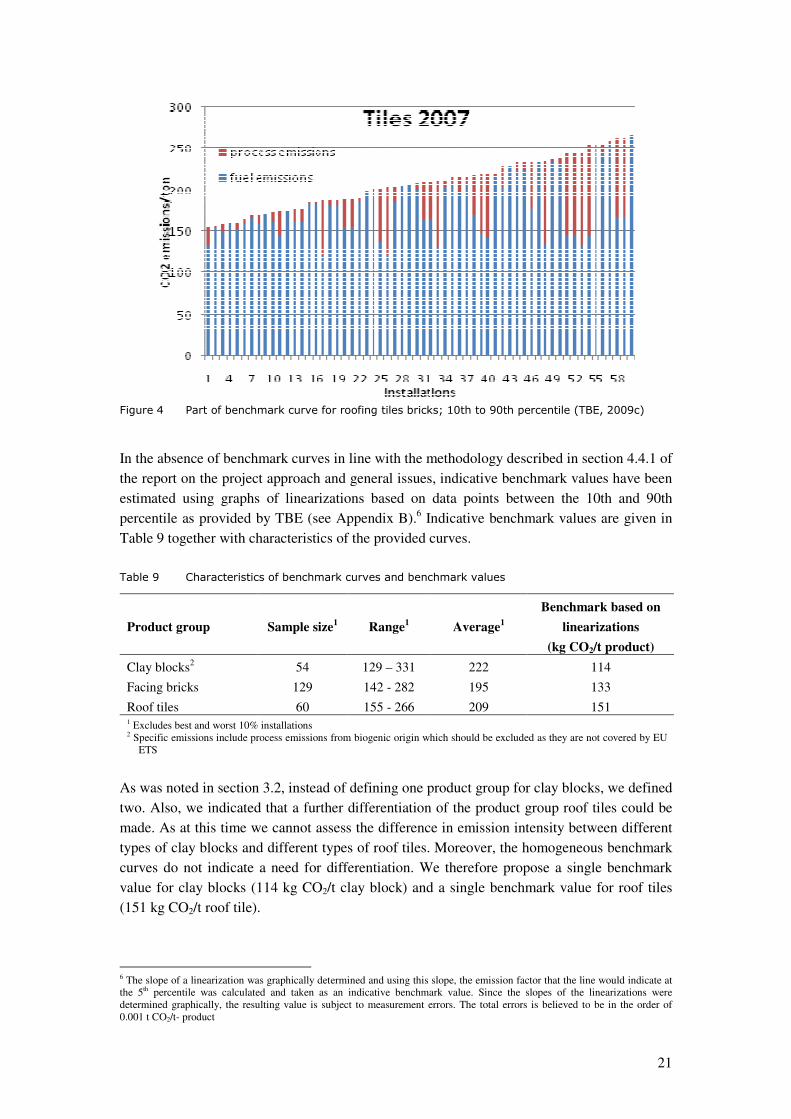
Figure 4 Part of benchmark curve for roofing tiles bricks; 10th to 90th percentile (TBE, 2009c)
In the absence of benchmark curves in line with the methodology described in section 4.4.1 of
the report on the project approach and general issues, indicative benchmark values have been
estimated using graphs of linearizations based on data points between the 10th and 90th
percentile as provided by TBE (see Appendix B).6 Indicative benchmark values are given in
Table 9 together with characteristics of the provided curves.
Table 9 Characteristics of benchmark curves and benchmark values
Product group Sample size1 Range1 Average1
Benchmark based on
linearizations
(kg CO2/t product)
Clay blocks2
54 129 – 331
222 114
Facing bricks 129 142 - 282 195 133
Roof tiles 60 155 - 266 209 151 1 Excludes best and worst 10% installations 2 Specific emissions include process emissions from biogenic origin which should be excluded as they are not covered by EU
ETS
As was noted in section 3.2, instead of defining one product group for clay blocks, we defined
two. Also, we indicated that a further differentiation of the product group roof tiles could be
made. As at this time we cannot assess the difference in emission intensity between different
types of clay blocks and different types of roof tiles. Moreover, the homogeneous benchmark
curves do not indicate a need for differentiation. We therefore propose a single benchmark
value for clay blocks (114 kg CO2/t clay block) and a single benchmark value for roof tiles
(151 kg CO2/t roof tile).
6 The slope of a linearization was graphically determined and using this slope, the emission factor that the line would indicate at
the 5th percentile was calculated and taken as an indicative benchmark value. Since the slopes of the linearizations were
determined graphically, the resulting value is subject to measurement errors. The total errors is believed to be in the order of
0.001 t CO2/t- product

22
Apart from clay blocks, facing bricks and roof tiles, we proposed to distinguish the product
groups pavers and specialty products. At the time of writing this report, we do not have data
available on pavers. Based on the relatively small difference in the benchmark specific
emissions resulting from the curves for products that do not have process emissions from
biomass origin (facing bricks and roof tiles), it may be expected that the benchmark specific
emission for pavers would not differ substantially from the benchmark values for these
products. On the other hand, in a study for DTI on benchmarking of the UK ceramic industry,
Enviros Consulting Limited (2006) proposed a value for benchmark specific energy
consumption for pavers that was 1.5 times as high as the one for common facing and
engineering bricks. Nevertheless, due to the lack of available information, we propose to take
the same benchmark value for pavers as for bricks (133 kg CO2/t product). We stress that this
value should be regarded as preliminary as its basis is rather weak and that there is a clear
need for further data collection.
Benchmarking for the specialty group as a whole is not considered to be appropriate because
of the diversity of products. We therefore propose to use a fall-back approach to come to an
allocation for this group of products (see section 5 of the report on the project approach and
general issues).
Overall, the availability of more information could lead to the assessment that it would be
appropriate to distinguish more products based on difference in benchmark emission intensity
and on considerations related to the discussion in section 3.2.
Figures 2 to 4 show that the share of process emissions in the total emissions can differ
substantially from installation to installation (e.g. in the UK it varies from about 3 to 75%
according to the chemistry of your clay (TBE, 2009c)). In order to further show the relative
impact of process and fuel related emissions, Figure 5 and Figure 6 show curves for each type
of emissions separately for all products. Curves of process emissions for each product group
specifically are included in appendix B.
Figure 5 Full benchmark curves of specific process emissions for all products (TBE, 2009b)

23
Figure 6 Full benchmark curves of specific fuel related emissions for all products (TBE, 2009b)
4.2 Wal l and f loor t i les
Presently, there is a lack of information regarding the specific emissions per type of product.
There are two main reasons for this situation: firstly, most of the installations are not currently
covered by EU ETS, and thus no historical information on emissions exists. Secondly,
multiple products are produced on the same site, which makes it difficult to allocate the
amount of emissions from the production of each product.
Taking into account the lack of information regarding the specific energy consumption per
type of product, we will use literature values to come to benchmark values. To this end values
for the production of dry-pressed tiles from Enviros Consulting Limited (2006) and the the
reference document on best available techniques (BREF Ceramics, 2007) are summarized in
Table 10. In addition the table shows the energy requirement for firing stages for ceramic tiles
for the award of the Community Eco-label (EC, 2009).
Table 10 Specific energy consumption for dry-pressed wall and floor tile production according to
Enviros Consulting Limited (2006) and the reference document on best available
techniques (BREF Ceramics, 2007), and energy requirements for the award of the
Community Eco-label (EC, 2009).
Enviros Consulting
Limited (2006)
BREF Ceramics
(2007)2
Community eco-
label (EC, 2009)
Spray drying (kJ/kg) 980 - 2200
Drying (kJ/kg) 250 - 750
Firing (kJ/kg)
7744
19003 – 7300 3,500
Total (kJ/kg) 77441 3130 – 10250
4
1 Value reported by Enviros Consulting Limited (2006) is representative of UK industry in 2002 and is limited to wall tile
production (Enviros Consulting Limited, 2006, pp. 12) 2 Based on Italian data only, where the Italian ceramic tile industry is one of the most efficient in the EU (CET, 2009) 3 Refers to one step of a double firing process (the first step for the production of the intermediate product called "biscuit" and
the second step for the "vitrification" of this biscuit (CET, 2009) 4 The total range as given based on the reference document on best available techniques was obtained by adding all low end
values and all high and values and is not representative for the actual total range.
24
We propose to base the benchmark for spray drying on the lower end value as reported by the
reference document on best available techniques (BREF Ceramics, 2007). Considering the
emission factor for natural gas (56.1 kg CO2/GJ (IPCC,1997)), the corresponding specific
emission factor for spray drying can be determined to be 55.0 kg CO2/t spray dried powder
produced.
For dry-pressed wall and floor tile production (excl. spray drying), we propose to base the
benchmark on the lower end value energy consumption for the drying stage as reported in the
reference document on best available techniques (BREF Ceramics, 2007). For the firing stage
we opt to use the energy requirement for the award of the Community eco-label (EC, 2009)
instead of the lower end value reported in the reference document on best available techniques
(BREF Ceramics, 2007), since that value refers to one step of a double firing process and is
therefore not regarded to be representative for an efficient firing process to produce a
common tile. Using an emission factor for natural gas of 56.1 kg CO2/GJ (IPCC, 1997), the
specific emission factor due to fuel consumption for dry-pressed wall and floor tile production
(excl. spray drying), can be determined to be 210.4 kg CO2/t tiles produced.
Specific process emissions as proposed by Enviros Consulting Limited (2006) and CET
(2009) are shown in Table 11. CET obtained its reported value using Annex X to the
guidelines for monitoring and reporting of GHG emissions7. In that Annex two different
methods are defined to determine process emissions, the one applicable to wall and floor tiles
production being the one based on carbon inputs (“Calculation method A”) (CET, 2009). We
propose to use the resulting value in determining the benchmark.
Table 11 Process emission factors for wall and floor tile production according to Enviros Consulting
Limited (2006) and CET (2009)
Enviros Consulting Limited (2006) CET (2009)
Process emissions (kg CO2/t product) 139 96.42
Summarizing the above, the proposed benchmark values based on BAT data are presented in
the table below. Note that the value for spray dried powder is calculated on the basis of tonnes
of tiles produced. When using the benchmark to come to an allocation, the weight of spray
dried powder would therefore need to be corrected for water content.
Table 12 Overview of product benchmarks
Product Benchmark value (kg CO2/t product)
Dry-pressed wall and floor tiles (excl. spray drying) 300.0
Spray dried powder (0% humidity) 55.0
There are indications that wall tiles and floor tiles differ both in fuel emission intensity and
process emission intensity, but at this stage not enough information is available to be able to
7 Commission Decision 2007/589/EC
25
0
100
200
300
400
500
600
700
800
900
1000
1 3 5 7 9 11 13 15 17 19 21 23 25
installation
kg
CO
2/t
pro
du
ct
assess whether or not benchmarks for wall and floor tiles would differ from one to another by
more than 20% in order to justify the definition of different benchmarks. In light of this
situation, CET is internally preparing a data collection exercise and developing a
methodology to acquire information about the emission intensity of both products. More
accurate information on specific emissions may therefore become available in the near future.
This information could lead to the assessment that separate benchmarks for wall tiles and
floor tiles would be appropriate based on differences in emission intensity.
For the production of extruded tiles no best practice value could be found. Also, the
production volume of extruded tiles is considered to be small compared to that of dry-pressed
tiles. We therefore propose to use a fall-back approach to come to an allocation for this group
of products (see section 5 of the report on the project approach and general issues).
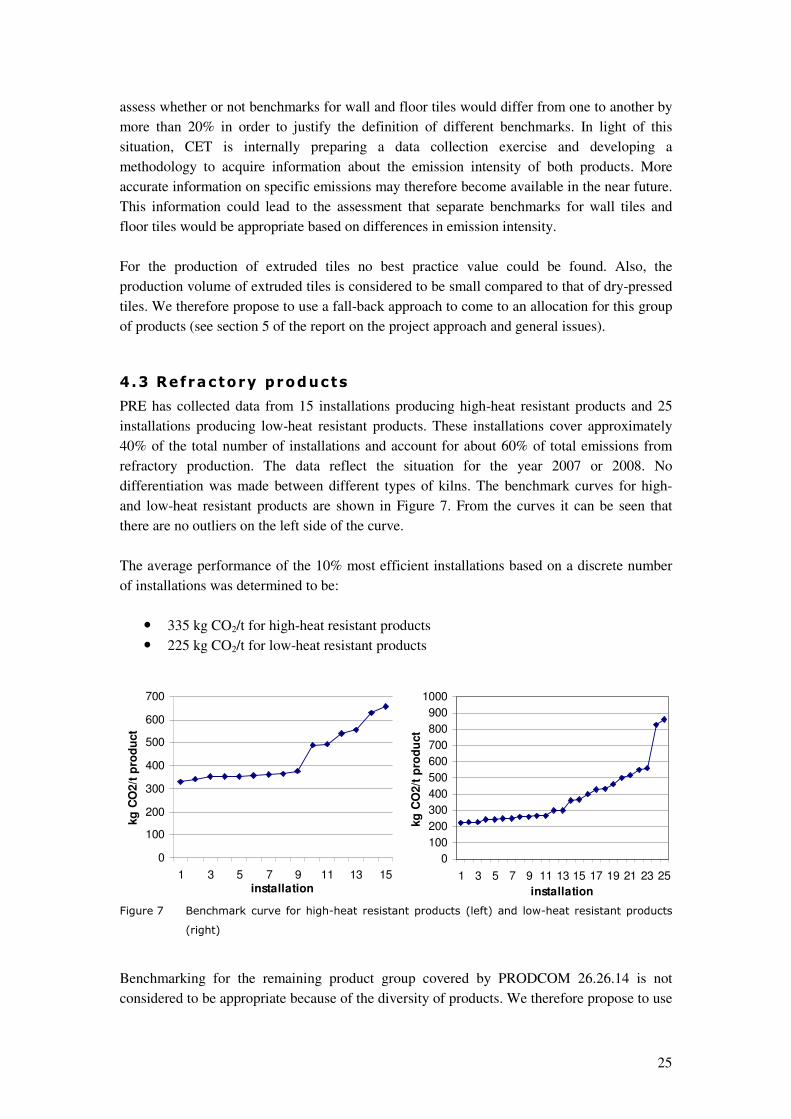
4.3 Refractory products
PRE has collected data from 15 installations producing high-heat resistant products and 25
installations producing low-heat resistant products. These installations cover approximately
40% of the total number of installations and account for about 60% of total emissions from
refractory production. The data reflect the situation for the year 2007 or 2008. No
differentiation was made between different types of kilns. The benchmark curves for high-
and low-heat resistant products are shown in Figure 7. From the curves it can be seen that
there are no outliers on the left side of the curve.
The average performance of the 10% most efficient installations based on a discrete number
of installations was determined to be:
• 335 kg CO2/t for high-heat resistant products
• 225 kg CO2/t for low-heat resistant products
0
100
200
300
400
500
600
700
1 3 5 7 9 11 13 15
installation
kg
CO
2/t
pro
du
ct
Figure 7 Benchmark curve for high-heat resistant products (left) and low-heat resistant products
(right)
Benchmarking for the remaining product group covered by PRODCOM 26.26.14 is not
considered to be appropriate because of the diversity of products. We therefore propose to use

26
a fall-back approach to come to an allocation for this group of products (see section 5 of the
report on the project approach and general issues).
4.4 Other products
Because of the diversity of products in the remaining product group, benchmarking for this
group as a whole is considered to be appropriate. We therefore propose to use a fall-back
approach to come to an allocation for this group of products (see section 5 of the report on the
project approach and general issues).
4.5 Overv iew o f proposa l for benchmark va lues
Table 13 gives an overview of the benchmark values for the products distinguished in
different sub-sectors. For product definition and available estimates of shares of emissions
and number of installations the reader is referred to section 3.6
Table 13 Overview of preliminary benchmark values
Product Benchmark value (t CO2/t-product)
Bricks and roof tiles
- Low-density clay blocks 0.114
- High-density clay blocks 0.114
- Facing bricks 0.133
- Pavers 0.133
- Roof tiles 0.151
Wall and floor tiles
- Wall tiles 0.300
- Floor tiles 0.300
- Spray dried powder 0.055
Refractory products
- High-heat resistant products 0.335
- Low-heat resistant products 0.225
Specialty products Covered by a fall-back approach (see Chapter 5
of the report on the project approach and general
issues).

27
5 Additional steps required
Bricks and roof tiles
• TBE has collected data from 80-90% of installations (small, medium and large sites)
in 18 MS. Since the benchmark should be based on the average performance of the
10% most efficient installations in a sector or subsector in the Community (Art. 10a
(2) of the amended Directive), additional installations should be included in the
curves.
• Benchmarks should be based on 2007-2008 performance (Art. 10a (2) of the amended
Directive). The present benchmark curves only include 2007 data, so 2008 data would
still need to be considered.
• Benchmarks should be based on the 10% most efficient installations in a sector or
subsector performance (Art. 10a (2) of the amended Directive). The present
benchmark curves exclude the best and worst 10% installations. These installations
should however be included in the curves.
• Using the complete curve as a staring point, the presence and exclusion of data
outliers should be considered.
• A benchmark curve for clay blocks excluding biogenic process emissions should be
constructed.
• Differentiation of benchmark values for different products in the product groups roof
tiles and clay blocks could be considered.
• When the steps above have been completed, the preliminary benchmark values
reported in the present report need to be reassessed.
• In the present proposal a single benchmark value for roof tiles and facing bricks is
proposed. After reassessment of benchmark values, it needs to be assessed whether or
not this grouping of values is appropriate.
• In the present proposal, the benchmark value for roof tiles and facing bricks is also
proposed for pavers. Further data collection is needed in order to be able assess
whether or not this choice is appropriate.
Wall and floor tiles • CET is internally preparing a data collection exercise and developing a methodology
to acquire information about the emission intensity of both products. More accurate
information on specific emissions may therefore become available in the near future.
Based on this information, the proposed values need to be reassessed.
• It should be assessed how spray dried powder can be defined using standards
available within the sector.
Refractory products • PRE has collected data from 40% of the installations that produce refractory products.
Since the benchmark should be based on the average performance of the 10% most
efficient installations in a sector or subsector in the Community (Art. 10a (2) of the
amended Directive), additional installations should be included in the curves.

28
6 Stakeholder comments
The European Tiles & Bricks Producers' Federation (TBE), the European Ceramic Tile
Manufacturers' Federation (CET), the European Refractories Producers Federation (PRE)
commented on a first draft report discussed with the sector before summer 2009 (Cerame
Unie, 2009c). Some of these comments have been addressed in the text of this report. A
summary of the comments can be found below. In order to make this summary, we (Ecofys)
made a selection of the text as provided to us by the sector organizations.
TBE
• We propose to apply – if any – the benchmark approach only to “standard products”,
which will represent approx. 80% of the total production; special products should be
treated with alternative systems
• Such special products could e.g. be special colour facing bricks (e.g. white or blue
braised), clay roof tiles accessories or highly insulating clay blocks produced with
biogenic additives, which cannot be dealt with properly by fuel benchmarks
• Our industry should receive between 15 and 21 benchmarks to properly cover the large
variety of different products
• Should this request for a greater number of benchmarks not be acceptable, we would like
to recommend an alternative approach based on the current Belgian and Dutch CO2
external auditing schemes. These installation specific schemes take into account the
improvement potential of each installation, which is determined by a third party
• Benchmarks – if any- should be based on the maximum available number of installations
in the EU
• The principle that the number of benchmarks of a sector should be related to its share of
emissions in the ETS undermines the level playing field across the sectors, resulting in an
unfair burden for those sectors, like the clay bricks and roof tiles industry, which are
characterized by high product variety but have a limited share of emissions in the whole
ETS and favoring other sectors, like cement and steel industries.
CET • The actual situation in manufacturing plants of wall and floor tiles is that different types
of products (wall, floor, porcelain, red body tiles, white body tiles…) are manufactured at
the same time, and no information on energy consumption per type of tile is available,
and thus no information on CO2 emissions per type of product. Although no information
on energy consumption per type of tile is available at installation level, it is known from a
technical point of view that wall tiles consume more energy in the firing stage than floor
tiles mainly for the following reasons (Ecofys: see section 3.3 for a summary of these
reasons):
• CET would like clearly state that its aim is to have two different benchmarks for final
product, one for wall tiles and one for floor tiles, since the amount of CO2 emissions to
produce each type of product is different, but at this stage we do not have yet enough
information to propose different values for each benchmark.

29
• We considered that only one benchmark for spray dried powder shall be defined for the
total production of powder, regardless of whether the powder is consumed in the
installation where it has been produced or not. This way there is a level playing field for
all installation around EU producing powder.
• Extruded tiles are rustic tiles much thicker than dry-pressed ones, normally used as
flooring in terraces and balconies, but also can be used in industrial areas. The energy
consumption for extruded tiles is usually 2 or 3 times for dry-pressed tiles, so it is the
extremely important to foresee a different treatment for this type of products in the
benchmarking exercise.
PRE
• Given the wide variety of product applications, many products are special products for
which no benchmark would be appropriate. These products, such as retorts, crucibles,
muffles, nozzles, plugs, supports, tubes, pipes, sheaths and rods, are all classified by CN
6903 (or PRODCOM 26.26.14). PRE has always advocated that these products should
not be benchmarked but should receive a fall-back position. Therefore PRE fully supports
the statement written in the first draft report: “As stated above, certain refractory products
may have an emission intensity that differs by at least more than 20% from this
benchmark. For those products, the fall-back approach is envisioned.”
• PRE has organised a data collection on the CO2 emissions (kg/ton of product) for the
benchmarkable refractory products (CN 6901 and 6902 or PRODCOM 26.26.11 and
26.26.12). Based on the results received so far, PRE concludes that the refractory industry
would need two benchmarks, one benchmark for high heat resistant products used in high
temperature applications and one for low heat resistant products used in low temperature
applications.

30
7 References
BREF Ceramics (2007) Reference document on Best Available Techniques in the Ceramic
Manufacturing Industry, European Commission, Institute for Prospective Technological
studies, Seville, August 2007
Cerame Unie (2009), conference call between Cerame Unie and Ecofys, April 4, 2009
Cerame Unie (2009), conference call between Cerame Unie and Ecofys, April 17, 2009a
Cerame Unie (2009b). Ceramic wall and floor tile subsector; product definition for
benchmarks development, send by email by A. Aiello on May 26, 2009b
Cerame Unie (2009c). Cerame Unie comments on the “Consultation paper: Free allocation
methodology for the ETS post 2012-first draft report for the ceramic manufacturing
industry”, send by email by A. Aiello on July 7, 2009c
Cerame Unie (2009d). email from A. Aiello to P. Blinde, on August 17, 2009d
CET (2009) CET comments on the energy requirements, emailed August 31, 2009
CITL (2009a), verified emissions 2007-2008 and allocations 2008 (version May 11, 2009),
available at http://ec.europa.eu/environment/climat/emission/citl_en.htm, accessed July
21, 2009.
CITL (2009b), 2005-2007 compiled compliance data and, available at
http://ec.europa.eu/environment/climat/emission/citl_en.htm, accessed July 21, 2009.
Enviros Consulting Limited (2006), EU ETS Phase II benchmarks supporting documentation:
ceramics, report for DTI, August 2006.
EC (2009) Commission Decision of 9 Jyly 2009 establishing the ecological criteria for the
award of the Community eco-label to hard coverings. (2009/607/EC)
IPCC (1997) Revised 1996 Guidelines for National Greenhouse Gas Inventories – Reference
Manual [Houghton, J.T., L.G. Meira Filho, B. Kim, K. Treanton, I. Mamaty, Y.
Bonduki, D.J. Griggs and B.A. Callender (eds.)]. Published by UK Meteorological
Office for the IPCC/OECD/IEA, Bracknell, United Kingdom.
PRE (2009) additional clarification, emailedAugust 28, 2009.
TBE (2009a), meeting between TBE and Ecofys, Utrecht, May 4, 2009

31
TBE (2009b), Position paper, May 2009
TBE (2009c), Benchmark curves and additional information send in September 2009.
Timellini, A. and Blasco-Fuentes, A. (1993), “ Energy consumption and carbon dioxide
emissions in the ceramic tile sector: Italy and Spain, Ceramica Acta, No. 1-2, 1993.
32
Appendix A: PRODCOM List 2007
PRODCOM 2007 code
Description
26211130 Porcelain or china tableware and kitchenware (excluding electro-thermic apparatus,
coffee or spice mills with metal working parts)
26211150 Household and toilet articles, n.e.c., of porcelain or china
26211210 Ceramic tableware, other household articles : common pottery
26211230 Ceramic tableware, other household articles : stoneware
26211250 Ceramic tableware, other household articles : earthenware or fine pottery
26211290 Ceramic tableware, other household articles : others
26211330 Statuettes and other ornamental articles, of porcelain or china
26211350 Ceramic statuettes and other ornamental articles
26221030 Ceramic sinks... and other sanitary fixtures, of porcelain or china
26221050 Ceramic sinks, wash basins, baths... and other sanitary fixtures, n.e.c.
26231033 Ceramic electrical insulators (excluding with metallic parts)
26231035 Ceramic electrical insulators for overhead power transmission or traction lines
(including with metallic parts) (excluding lightning arresters)
26231039 Ceramic electrical insulators (including with metallic parts) (excluding for overhead
power transmission or traction lines, lightning arresters)
26231053 Ceramic insulating fittings for electrical machines, appliances or equipment;
containing ≥ 80 % by weight of metallic oxides
26231055 Ceramic insulating fittings for electrical machines, appliances or equipment
(excluding fittings containing ≥ 80% by weight of metallic oxides)
26241100 Ceramic wares for laboratory, chemical, technical use, of porcelain or china
26241200 Ceramic wares for laboratory, chemical, technical use, other material than porcelain or
china
26251100 Ceramic (agricultural) troughs, tubs...; ceramic pot, jars..., n.e.c.
26251230 Other ceramic articles of porcelain/china including non-refractory firebrick cheeks,
parts of stoves/fireplaces, flower-pots, handles and knobs, signs/motifs for shops,
radiator humidifiers
26251255 Other ceramic articles (common pottery) including heating apparatus, non-refractory
firebrick cheeks, stoves/fireplaces parts, flower-pots, handles/knobs, shopssigns,
radiator humidifiers
26251259 Ceramic articles, n.e.c. : other than porcelain or common pottery
26261100 Ceramic goods of siliceous fossil meals or earths including bricks, blocks, slabs,
panels, tiles, hollow bricks, cylinder shells and pipes excluding filter plates containing
kieselguhr and quartz
26261210 Refractory ceramic constructional goods containing >50% of MgO, CaO or Cr2O3
including bricks, blocks and tiles excluding goods of siliceous fossil meals or earths,
tubing and piping
26261233 Refractory bricks, blocks..., weight > 50% Al2O3 and/or SiO2: ≥ 93% silica (SiO2)
33
Continuation
PRODCOM 2007 code
Description
26261235 Refractory bricks, blocks, tiles and similar refractory ceramic onstructional goods
containing, by weight, > 7% but < 45% alumina, but > 50% by weight combined with
silica
26261237 Refractory bricks, blocks..., weight > 50% Al2O3 and/or SiO2: others
26261290 Refractory bricks, blocks, tiles, etc, n.e.c.
26261300 Refractory cements, mortars, concretes and similar compositions (including refractory
plastics, ramming mixes, gunning mixes) (excluding carbonaceous pastes)
26261410 Articles containing magnesite, dolomite or chromite (including bricks and other
shapes, touchstones for testing precious metal, paving blocks and slabs) (excluding
refractory goods)
26261430 Refractory ceramic goods, n.e.c., by weight > 25% graphite or other forms of carbon
26261455 Refractory ceramic goods, n.e.c., alumina or silica or mixture > 50% : alumina < 45%
26261459 Refractory ceramic goods, n.e.c., alumina or silica or mixture > 50% : alumina ≥ 45%
26261490 Refractory ceramic goods, n.e.c.
26301010 Unglazed ceramic mosaic tiles, cubes and similar articles, with a surface area < 49 cm²
26301020 Glazed ceramic mosaic tiles, cubes and similar articles, with a surface area < 49 m²
26301030 Unglazed ceramic double tiles of the Spaltplatten type
26301053 Unglazed stoneware flags and paving, hearth or wall tiles (excluding double tiles of
the Spaltplatten type)
26301055 Unglazed earthenware or fine pottery flags and paving, hearth or wall tiles (excluding
double tiles of the Spaltplatten type)
26301059 Unglazed ceramic flags and paving, hearth or wall tiles (excluding stoneware,
earthenware or fine pottery, double tiles of the Spaltplatten type)
26301071 Glazed ceramic double tiles of the Spaltplatten type
26301073 Glazed stoneware flags and paving, hearth or wall tiles, with a face of > 90 cm²
26301075 Glazed earthenware or fine pottery ceramic flags and paving, hearth or wall tiles, with
a face of > 90 cm²
26301079 Glazed ceramic flags and paving, hearth or wall tiles excluding double tiles of the
spaltplatten type, stoneware, earthenware or fine pottery flags, paving or tiles with a
face of not > 90 cm²
26401110 Non-refractory clay building bricks (excluding of siliceous fossil meals or earths)
26401130 Non-refractory clay flooring blocks, support or filler tiles and the like (excluding of
siliceous fossil meals or earths)
26401250 Non-refractory clay roofing tiles
26401270 Non-refractory clay constructional products (including chimneypots, cowls, chimney
liners and flue-blocks, architectural ornaments, ventilator grills, clay-lath; excluding
pipes, guttering and the like)
26401300 Ceramic pipes, conduits, guttering and pipe fittings: drain pipes and guttering with
fittings
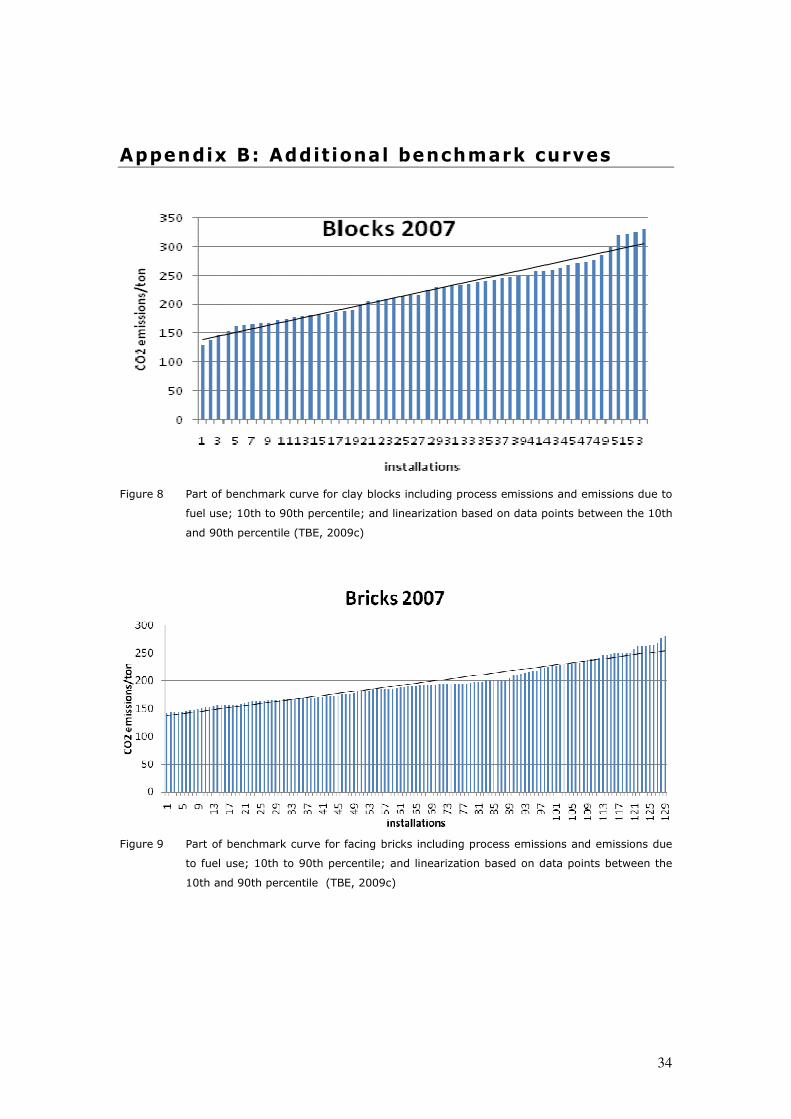
34
Appendix B: Additional benchmark curves
Figure 8 Part of benchmark curve for clay blocks including process emissions and emissions due to
fuel use; 10th to 90th percentile; and linearization based on data points between the 10th
and 90th percentile (TBE, 2009c)
Figure 9 Part of benchmark curve for facing bricks including process emissions and emissions due
to fuel use; 10th to 90th percentile; and linearization based on data points between the
10th and 90th percentile (TBE, 2009c)
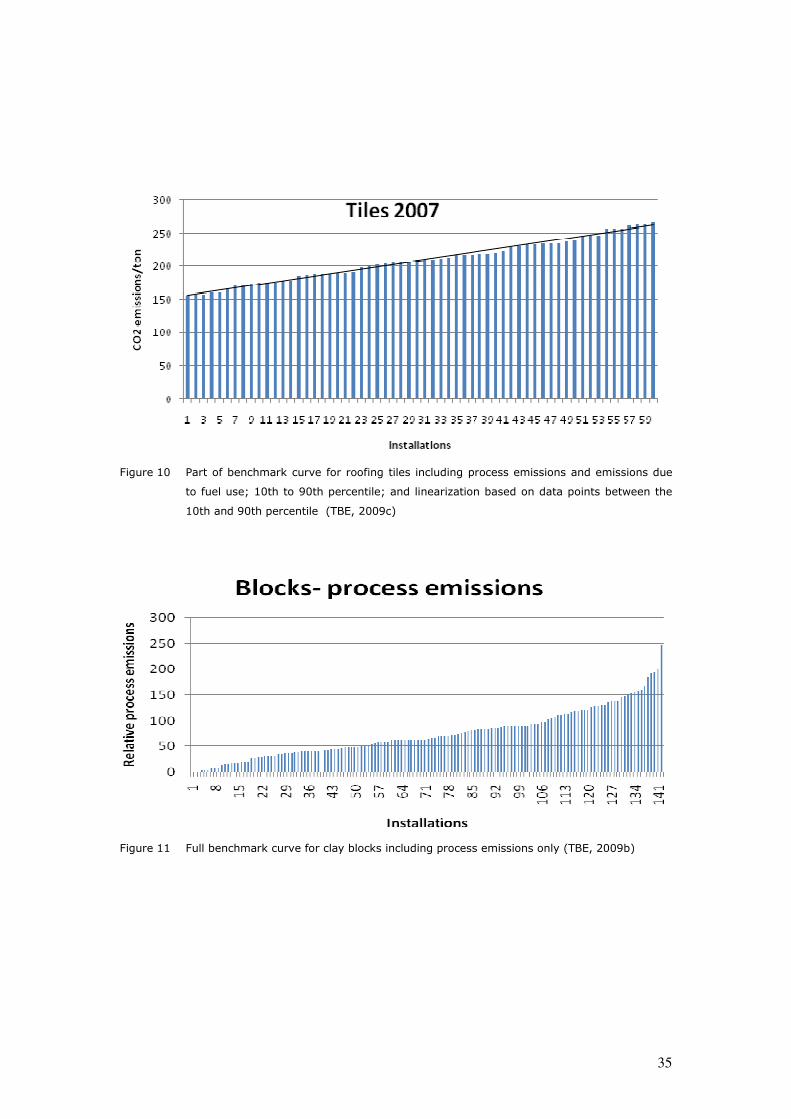
35
Figure 10 Part of benchmark curve for roofing tiles including process emissions and emissions due
to fuel use; 10th to 90th percentile; and linearization based on data points between the
10th and 90th percentile (TBE, 2009c)
Figure 11 Full benchmark curve for clay blocks including process emissions only (TBE, 2009b)
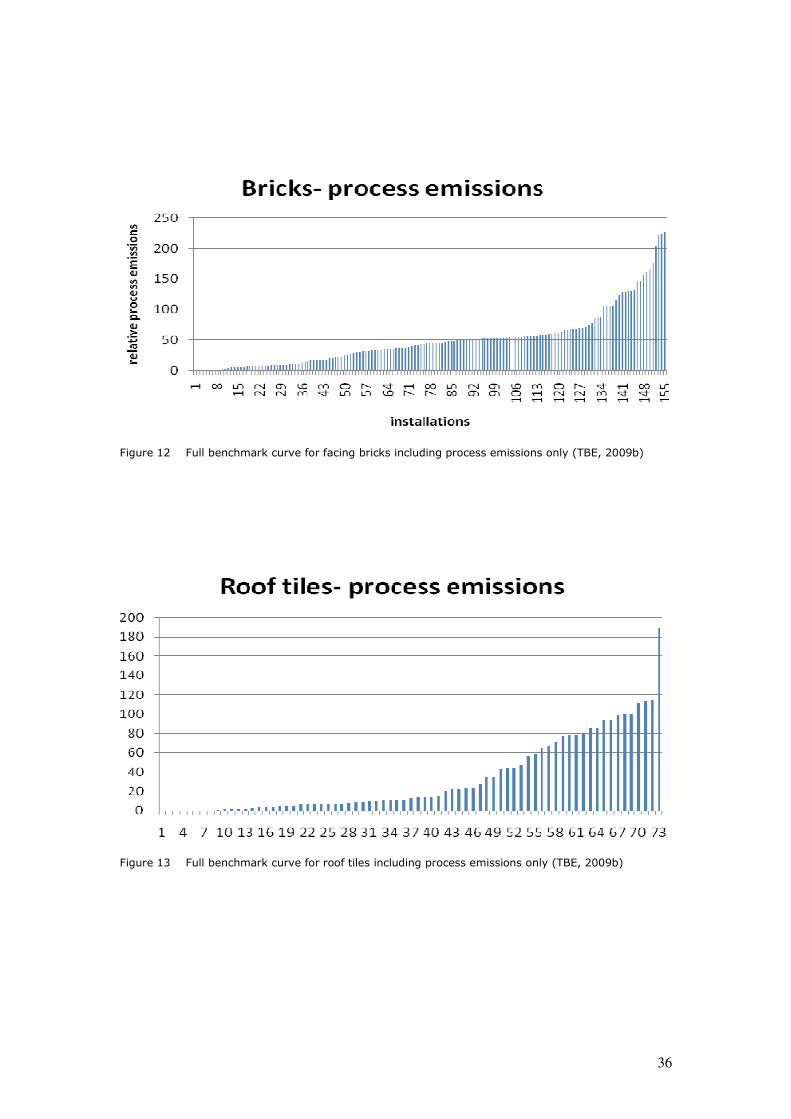
36
Figure 12 Full benchmark curve for facing bricks including process emissions only (TBE, 2009b)
Figure 13 Full benchmark curve for roof tiles including process emissions only (TBE, 2009b)