methodologies to assess the economy wide impact of avian flu
TRANSCRIPT
A Collaborative Research Project Funded by:
Implemented by:
Methodologies to Assess the Economy Wide Impact of Avian Flu
Devesh Roy
Africa/Indonesia Team Working Paper No. 8


Pro-Poor HPAI Risk Reduction
i
Table of Contents Page
PREFACE .................................................................................................................................................. III
1. INTRODUCTION ................................................................................................................................... 1
2. INTEGRATED MODELING FRAMEWORK TO CAPTURE THE ECONOMY WIDE IMPACT OF HPAI .......... 5
3. DETAILS OF THE POULTRY SECTOR IN THE FIVE COUNTRIES AND ITS IMPLICATIONS FOR MODELING ................................................................................................................................... 9
3.1 Ethiopia .................................................................................................................................. 10
3.2 Ghana ..................................................................................................................................... 13
3.3 Indonesia ................................................................................................................................ 14
3.4 Kenya ...................................................................................................................................... 16
3.5 Nigeria .................................................................................................................................... 20
4. CONCLUSIONS.................................................................................................................................... 23
5. REFERENCES ....................................................................................................................................... 25
List of Tables
Table 1 A synopsis of policies for containment and mitigation of HPAI influenza ............................. 2 Table 2 Economic Impact of HPAI ....................................................................................................... 7 Table 3 Characteristics of the poultry production systems for the five country studies ................... 9
List of Figure
Figure 1: Production and SAM multipliers in Kenya ................................................................................ 19

Africa/Indonesia Team Working Paper
ii
Pro-Poor HPAI Risk Reduction
iii
Preface
Since its re-emergence, HPAI H5N1 has attracted considerable public and media attention because the viruses involved have been shown to be capable of producing fatal disease in humans. While there is fear that the virus may mutate into a strain capable of sustained human-to-human transmission, the greatest impact to date has been on the highly diverse poultry industries in affected countries. In response to this, HPAI control measures have so far focused on implementing prevention and eradication measures in poultry populations, with more than 175 million birds culled in Southeast Asia alone.
Until now, significantly less emphasis has been placed on assessing the efficacy of risk reduction measures, including their effects on the livelihoods of smallholder farmers and their families. In order to improve local and global capacity for evidence-based decision making on the control of HPAI (and other diseases with epidemic potential), which inevitably has major social and economic impacts, the UK Department for International Development (DFID) has agreed to fund a collaborative, multidisciplinary HPAI research project for Southeast Asia and Africa.
The specific purpose of the project is to aid decision makers in developing evidence-based, pro-poor HPAI control measures at national and international levels. These control measures should not only be cost-effective and efficient in reducing disease risk, but also protect and enhance livelihoods, particularly those of smallholder producers in developing countries, who are and will remain the majority of livestock producers in these countries for some time to come.
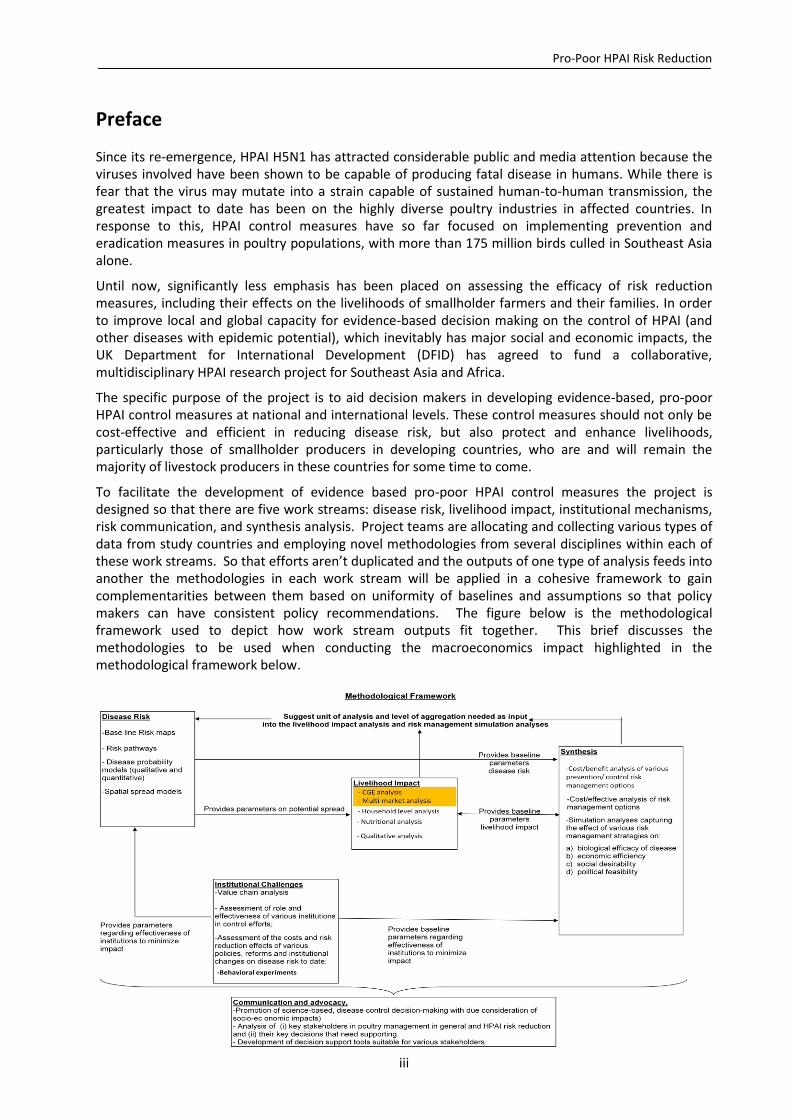
To facilitate the development of evidence based pro-poor HPAI control measures the project is designed so that there are five work streams: disease risk, livelihood impact, institutional mechanisms, risk communication, and synthesis analysis. Project teams are allocating and collecting various types of data from study countries and employing novel methodologies from several disciplines within each of these work streams. So that efforts aren’t duplicated and the outputs of one type of analysis feeds into another the methodologies in each work stream will be applied in a cohesive framework to gain complementarities between them based on uniformity of baselines and assumptions so that policy makers can have consistent policy recommendations. The figure below is the methodological framework used to depict how work stream outputs fit together. This brief discusses the methodologies to be used when conducting the macroeconomics impact highlighted in the methodological framework below.
Africa/Indonesia Team Working Paper
iv
Author
Devesh Roy, Research Fellow, Markets, Trade and Institutions Division, International Food Policy Research Institute, 2033 K Street NW, Washington, DC 20006
Disclaimer
The views expressed in this report are those of the author(s) and are not necessarily endorsed by or representative of IFPRI, or of the cosponsoring or supporting organizations. This report is intended for discussion. It has not yet undergone editing.
More information
For more information about the project please refer to www.hpai-research.net.
Pro-Poor HPAI Risk Reduction
1
1. Introduction
This paper is aimed at suggesting common methodologies to assess the economy wide impact of
avian flu outbreak in the following five countries: Ethiopia, Ghana, Indonesia, Kenya and Nigeria.
Indeed, these countries differ in their socio-economic, veterinary and institutional contexts including
the importance of the poultry sector, its structure and the history of the disease. Hence, a uniform
methodology that can be applied to all countries has its limitations in terms of applicability to each
individual country. However, the objective is to suggest a broadly similar methodology that can be
modified to fit the context of individual countries and can answer the main research questions of
interest. The choice of methodology is related to questions such as whether a partial or a general
equilibrium modeling is to be implemented, how the shocks to the models will be determined, what
shocks the models will include and what will be the appropriate unit of analysis.
Animal disease outbreaks such as Avian Influenza in principle can have far reaching economic
impacts. The extent of the economic impact depends upon several factors notably the economic size
of the sector and its forward and backward linkages with other sectors. The economic impact and the
points of impact are vital information for the policy makers in designing prevention and mitigation
strategies. Note that the economic impact of Avian Flu occurs from three channels
(i) If the disease occurs, then the major channel is its impact and the effects of control and mitigation strategies that are put into place (including compensation)
(ii) If the disease does not occur, the major channel is the impact of the costs of the preventive strategies and the benefits of not having an outbreak
(iii) If the disease occurs or does not occur it can result in a demand shock where the demand for poultry products is likely to be affected.
The overall impact of the disease (including that of control measures) hence can occur from both
demand as well as supply side. As consumer perceptions change with the occurrence of HPAI, the
demand of poultry products and therefore the livelihoods of producers and other agents employed
in the value chain of poultry will be affected. Disease shocks also affect the available supply of
poultry products due to mortality (from disease and also because of mitigation measures such as
culling) and this will affect market prices. Both control and mitigation policies (Table 1, below) are
expected to reduce the overall rate of disease incidence and thereby affect the economy favorably.
It is important to capture the list of control measures and mitigation strategies that span the universe
of possible options. Control and mitigation strategies will always have associated indirect cost in
terms of the impact on livelihoods. Hence, some policy measures will require specific interventions to
safeguard the livelihoods of the poor (for example culling will need to be supplemented with
compensation). Similarly, it is also important to take into account the direct costs of implementing
these measures (for example cost of vaccines).
Africa/Indonesia Team Working Paper
2
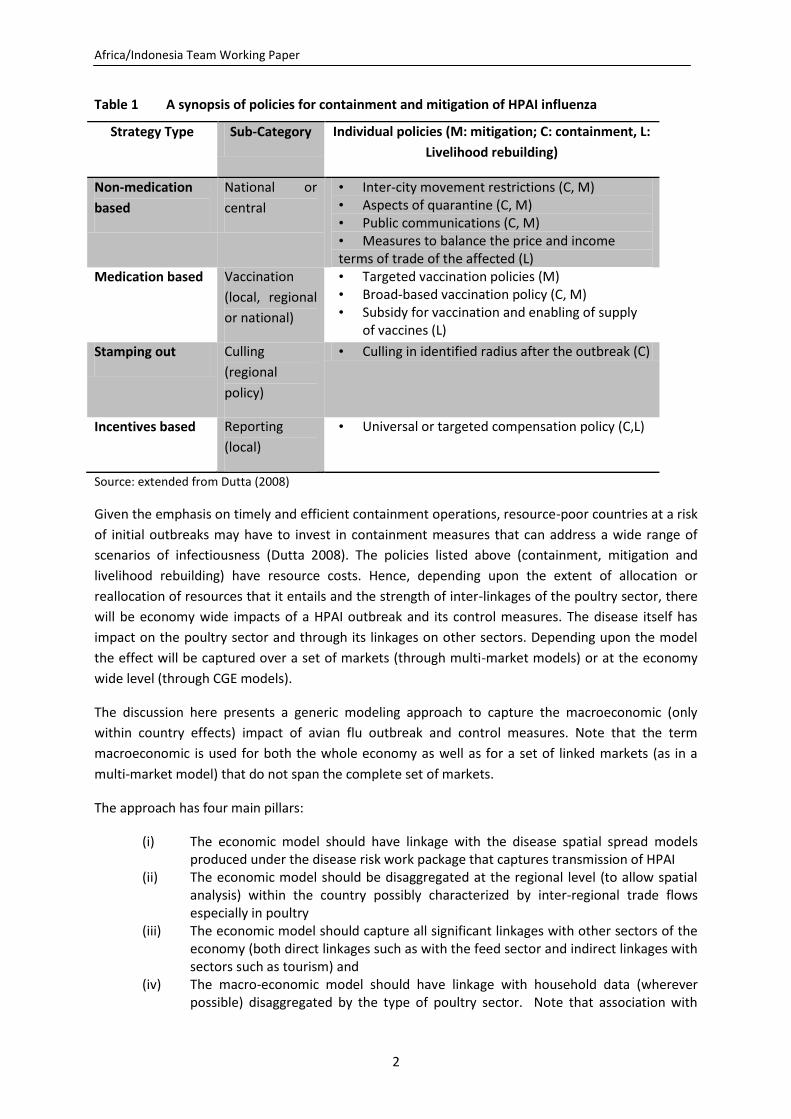
Table 1 A synopsis of policies for containment and mitigation of HPAI influenza
Strategy Type Sub-Category Individual policies (M: mitigation; C: containment, L:
Livelihood rebuilding)
Non-medication
based
National or
central
• Inter-city movement restrictions (C, M) • Aspects of quarantine (C, M) • Public communications (C, M) • Measures to balance the price and income terms of trade of the affected (L)
Medication based Vaccination
(local, regional
or national)
• Targeted vaccination policies (M) • Broad-based vaccination policy (C, M) • Subsidy for vaccination and enabling of supply
of vaccines (L)
Stamping out Culling
(regional
policy)
• Culling in identified radius after the outbreak (C)
Incentives based Reporting
(local)
• Universal or targeted compensation policy (C,L)
Source: extended from Dutta (2008)
Given the emphasis on timely and efficient containment operations, resource-poor countries at a risk
of initial outbreaks may have to invest in containment measures that can address a wide range of
scenarios of infectiousness (Dutta 2008). The policies listed above (containment, mitigation and
livelihood rebuilding) have resource costs. Hence, depending upon the extent of allocation or
reallocation of resources that it entails and the strength of inter-linkages of the poultry sector, there
will be economy wide impacts of a HPAI outbreak and its control measures. The disease itself has
impact on the poultry sector and through its linkages on other sectors. Depending upon the model
the effect will be captured over a set of markets (through multi-market models) or at the economy
wide level (through CGE models).
The discussion here presents a generic modeling approach to capture the macroeconomic (only
within country effects) impact of avian flu outbreak and control measures. Note that the term
macroeconomic is used for both the whole economy as well as for a set of linked markets (as in a
multi-market model) that do not span the complete set of markets.
The approach has four main pillars:
(i) The economic model should have linkage with the disease spatial spread models produced under the disease risk work package that captures transmission of HPAI
(ii) The economic model should be disaggregated at the regional level (to allow spatial analysis) within the country possibly characterized by inter-regional trade flows especially in poultry
(iii) The economic model should capture all significant linkages with other sectors of the economy (both direct linkages such as with the feed sector and indirect linkages with sectors such as tourism) and
(iv) The macro-economic model should have linkage with household data (wherever possible) disaggregated by the type of poultry sector. Note that association with

Pro-Poor HPAI Risk Reduction
3
household data can capture the micro level effect using additional tools such as micro-simulations for computable general equilibrium (CGE) models. In case of CGE models, micro-simulation is a model based on a dataset that contains information on individual microeconomic agents (individuals, households, firms). Microsimulations will allow simulation of the effect of policies/shocks on individuals. Microsimulations in this case would be most useful for obtaining counterfactual distributions of income (and hence poverty) from an AI outbreak or from control measures. The project is particularly interested in distinguishing the impact across types of poultry sector such as small scale, medium scale and large scale commercial.
However, the existing situation (in terms of data) in the five countries might not allow all four
components of the generic methodology to be covered in each of the five countries.
This brief is organized as follows. Section 2 lays out an integrated modeling framework for capturing
the macroeconomic impact of HPAI. Section 3 presents brief description of the size and structure of
the poultry sector in each country that provide information towards selection of the appropriate
model. Section 4 concludes.

Africa/Indonesia Team Working Paper
4

Pro-Poor HPAI Risk Reduction
5
2. Integrated Modeling Framework to Capture the Economy Wide Impact of HPAI
The modeling methods in this project must use an integrated approach that combines spatial disease
spread models with the economic models.1 Spatial spread models are usually based on the concept
of state-transition. There are two important variables viz. state and the transition probabilities that
determine the disease spread model. For the economic models it is important that both the states
and transition probabilities (from spatial spread models) are available at the unit of analysis
employed in the economic model. Thus, if the model is disaggregated to the level of regions within a
country, the epidemiological models must provide the state and transition probabilities at the level
of regions. From the state transition functions, the level of disease shock at the level of the unit of
analysis need to be derived.
Note that the transition probabilities are not independent of economic flows and also depend on
control measures. Thus, even though we call it a spatial spread model that determines the disease
transmission, in effect the model incorporates several elements. During any time period, depending
on various factors, birds in a country have a probability of remaining in that state or move to another
state (a transition).
Spatial pattern is an important characteristic of the spread of AI. An outbreak of AI usually occurs in a
particular geographic location and spreads from thereon (You and Diao 2007). The risk of exposure to
HPAI is also spatial, depending on the distance from AI transmission routes and contact with infected
flocks.
Outputs of the spatial spread models will be linked to the macro- economic model. The
macroeconomic model usually a Computable General Equilibrium (CGE) model or a partial
equilibrium multi-market (MM) model will capture the costs of disease spread. As the outputs of the
disease risk package will be available after some time the macro-economic models will be run initially
with arbitrary shocks then later integrate with disease risk outputs once completed so as to capture
spatial dimensions of HPAI outbreak which captures disease shocks as well as shocks following
control measures. The modelers will thus use the initial disease risk maps to do the first round of the
potential economic and livelihood impact of spatial spread of HPAI to different regions and refine the
analysis when the risk assessment and spatial spread models are completed.
This will be done by incorporating the demand and supply shocks, the inter-linkages to other sectors,
and possibly the resource cost shocks (both public and private) implied by the disease and by the
control strategies. Linkage with a household data wherever possible will then translate the effects to
a disaggregated level. The cost benefit analysis in this project will provide information on costs
incurred or to be incurred by the public and private sectors to implement control and containment
measures. This information will be used to determine the resource cost shocks wherever applicable.
Note that one form of demand shocks will be international or regional (within country) trade
restrictions that could result from an outbreak (this can be modeled as a relative price shock or a
1 Even though the focus is on within country or on the single country impacts, note that disease risk models can
extend to trans-boundary transmission. The models in this project are likely to focus on within country transmission channels.

Africa/Indonesia Team Working Paper
6
shock in terms of quantitative restrictions (this would also lead to a price wedge)). The supply shocks
in terms of reduced output could usually be regional (could be modeled as a percentage decline in
the output of the poultry sector ideally for each of the sub-sectors in poultry). Demand shocks could
extend to other sectors such as tourism which the literature usually terms as the knock-on effects.
The models should strive to include all significant forward and backward linkages to capture the
knock on effects.
The resource cost shocks would include among others stamping out costs including the cost of culling
(for example cleaning and disinfection), compensation paid after culling and costs associated with
imposition of quarantine. Table 2 summarizes the potential impact of HPAI at the economy wide
level and the feedback on the households.

Pro-Poor HPAI Risk Reduction
7
Table 2 Economic Impact of HPAI
Economic Impact of HPAI
Supply shocks to the poultry sector from disease outbreak
Demand shocks to the poultry sector from disease outbreak or perceived outbreak
Demand and supply shocks to the related sectors (forward and backward linkages) – from perceived or actual outbreaks
The demand and supply shocks from control and mitigation strategies
Resource cost shocks from channeling government resources towards AI prevention and control
Microsimulations in CGE models or household disaggregation in multi-market models
Household incomes
Household consumption and nutrition
Impacts on household’s saving and investment

Africa/Indonesia Team Working Paper
8
In summary the common methodology that will be employed across all five countries in the project
will either be a CGE model (Nigeria and Ghana) or a multi-market model (Ethiopia, Kenya and
Indonesia). The choice of the method between these two models is determined by the following
criteria.
(1) The size of the poultry sector in relation to the economy – implies whether or not economy wide effects are important.
(2) The structure of the poultry sector and the extent of its interlinkages - implies whether the partial equilibrium or general equilibrium analysis is relevant.
Further, the regional and spatial disparity in poultry population, density, structure and vulnerability
to introduction and spread of disease implies the need for regional disaggregation in multi-market or
CGE models.
Note that CGE or multi-market models are best suited to long-run analyses during which all factors of
production can adjust to a new equilibrium. These models will not capture the short run impact.2
Further, much greater impacts of Avian flu can occur if the disease takes the form of a pandemic
where impacts can occur also on labor supply. All the cases in the project will abstain from a
pandemic shock.
The next section provides relevant details for the poultry sector in each country and discusses its
implications for modeling. The choice of the model is based on the nature of the poultry sector in
each country which is described below.
2 There might be value towards modifying the models to make them applicable to the short run. There is
relatively scant literature on modeling disequilibrium in CGE/multi-market models. The typical ways in which
this is done is as follows (e.g., Rose and Liao, 2005). First, the ease at which one input can be substituted for
another can be reduced to reflect the more limited options available in the immediate aftermath of a HPAI
outbreak. It can also be supplemented by explicit disequilibrium closure rules. These reflect key account
balances in labor, capital and goods markets, government activity, and trade. Examples include allowing less
than full employment equilibria, government deficit spending, and trade imbalances. This short run impact will
not be captured by the models.

Pro-Poor HPAI Risk Reduction
9
3. Details of the Poultry Sector In the Five Countries and Its Implications for Modeling
All the countries in the project have a large share of small scale unorganized poultry sector including
backyard production. Table 3 below presents the characteristics of the poultry sector in the five
countries. Since the project’s focus is on poor, it is suggested that attempt be made to disaggregate
the poultry sector into finer components particularly the small scale producers. Impact on such
producers is crucial for the estimation of impact on poverty. In this regard, it is important that
models are linked with household data to disaggregate the impacts.
Table 3 Characteristics of the poultry production systems for the five country studies
Characteristics
Industrial and
integrated
Commercial not
integrated
Backyard market-
oriented
Village or backyard
subsistence
Bird and output
marketing
Commercial
Export and urban
Usually
commercial
Urban/rural
Birds usually sold in
live markets
urban/rural
Birds and products
consumed locally
Rural/urban
Use of purchased
inputs
High High High Low
Dependence on
good roads
High High High Low
Location Near capital and
major cities
Near capital and
major cities
Smaller towns and
rural areas
Everywhere;
dominates in remote
areas
Birds kept Indoors Indoors Indoors/Part-time
outdoors
Outdoors most of the
day
No. of birds kept
Ethiopia Above 10,000
birds
1,000-5,000 Below 500 birds
Ghana 10,000 and
above
1,000-5,000 150-500 birds 3-200 birds
Indonesia <50
Kenya 100-1000 50-100? <20
Nigeria 5000 and over 1000-4999 50-999 5-49
Africa/Indonesia Team Working Paper
10
Poultry numbers
Ethiopia Exist but poorly
developed
Exist but poorly
developed
80% of poultry population
Ghana
Indonesia 9.7 million
poultry
58.1 million
poultry
32.4 million
poultry
174 million birds producing
175 million birds per year
and 43.5 million eggs
Kenya Over 75% of the total
chicken population
Nigeria >80% of national poultry
inventory (estimated to be
143 million)
Shed Closed Closed Closed/open Open
Veterinary service
other than in epizootic
disease control
Own
veterinarian
Pays for
veterinary
service
Pays for
veterinary
service
Irregular, depends on
government services
Source of medicine and
vaccine
Company or
market
Market Market Government and market
Source of technical
information
Company and
associated
Sellers of
inputs
Sellers of inputs Government and extension
Source of finance Banks and own Banks and own Banks and
private
Private and banks
Breed of poultry Commercial Commercial Commercial Native
Sources: Adapted from http://www.fao.org/docs/eims/upload//214190/ProductionSystemsCharacteristics.pdf; Demeke, S. 2007; Aning, K.G, P.K. Turkson, and S. Asuming-Brempong 2008, Annex II; Sumiarto, B., B. Arifin 2008, Annex III; Omiti, J., L. Ndirangu, and S. Okuthe 2008, Annex IV; Uzochukwu Obi, T., A. O. Oparinde, and G.A. Maina 2008, Annex V.
3.1 Ethiopia
3.1.1 Background information on Ethiopia’s poultry sector
Ethiopia has one of the largest livestock populations in Africa. However, the role of poultry within
livestock is comparatively less important. A CSA (2005) report revealed that 97.8% of the total
poultry population comprises indigenous birds while 2.2% are exotic breeds. The mode of production
for these indigenous birds is largely backyard production.
The poultry sector in Ethiopia can be characterized into three major production systems based on
some selected parameters such as breed, flock size, housing, feed, health, technology, and bio-

Pro-Poor HPAI Risk Reduction
11
security (Alemu & Tadelle, 1997; Bush, 2006; Goutard & Magalhaes, 2006; AHINTC, 2006). These are
village or backyard poultry production system, small scale poultry production system and commercial
poultry production system.
Alternatively, the FAO classifies poultry production systems into four sectors, depending on the level
of bio-security. Based on this system of classification, Ethiopia has three poultry production systems:
large commercial poultry production with “moderate to high biosecurity” (sector 2), small
commercial poultry production with “low to minimal” biosecurity (sector 3) and village or backyard
production with “minimal biosecurity" (sector 4) (Nzietcheung 2008). Note that that the poultry
sector in Ethiopia plausibly does not contain any sector 1.
The sector 2 system of poultry production is developing and the main commercial poultry farms –
Elflora, Agro Industry, Genesis and Alema – are located around Debre Zeit in Oromia. The sector 3
system is emerging around the urban and peri-urban areas of Ethiopia. In terms of the FAO
definition, sector 4 or the village or backyard production represents the main poultry production
system in most parts of the country. In the dominant system of backyard poultry, there is little or no
inputs for housing, feeding or health care. Based on Dessie et al., (2003), Bush (2006) and field
interviews in Nzietcheung (2008), typical household flock sizes vary from 2 to 15 chickens.
The backyard poultry production systems are not business oriented. In this case, the major purposes
of poultry production include eggs for hatching (51.8%), sale (22.6%), and home consumption
(20.2%) while chickens for sale (26.6%) and home consumption (19.5%).
The next system prevalent in Ethiopia is small-scale commercial poultry production with modest flock
sizes usually ranging from 50 to 500 exotic breeds kept for operating on a more commercial basis.
Most small-scale poultry farms are located around Debre Zeit town in Oromia region and Addis
Ababa. This production system is characterized by medium level of feed, water and veterinary service
inputs. Flock sizes vary from 20 to 1000. Most small-scale poultry farms obtain their feed and
foundation stock from large-scale commercial farms (Genesis or Alema) (Nzietcheung 2008).
Finally there are some large scale commercial farms in Ethiopia. This system is a highly intensive
production system that involves, on average, greater or equal to 10,000 birds. This system depends
heavily on imported exotic breeds that require intensive inputs such as feed, housing, health, and
modern management system. It is estimated that this sector accounts for nearly 2% of the national
poultry population. This poultry production is entirely market-oriented to meet the large poultry
demand in major cities.
In Ethiopia, the commercial poultry sector is situated mostly in Debre Zeit areas. In the intensive
poultry production system, there are also 7 public poultry multiplication and distribution centers
(PMDC) that are located in different regions operating with the major objective of distributing
improved exotic breeds to smallholders. In all centers, day-old chicks were either imported from
Egypt, Germany and Holland, or sourced from Elflora and Genesis commercial farms.
Regionally, there is significant variation in poultry numbers and density. The discussion above points
out that there is difference in structure of poultry sector across regions with comparatively organized
segments located in Debre Zeit areas. Further, because of several risk factors threat of introduction
of HPAI is also different across regions owing to different possible pathways.
The poultry population is mainly concentrated (in order) of Oromiya, Amhara, SNNR, Tigray, and
Benhsangul Regional states. This regional distribution of the poultry population is closely associated

Africa/Indonesia Team Working Paper
12
with the pattern of human population density in the respective regions. The regions with higher
poultry population (Tigray, Amhara, Oromia and SNNPR) had also higher poultry densities.
In international trade, Ethiopia’s imports are limited to import of live birds. The private and public
large scale intensive poultry farms are mainly dependent on the import of day old chicks from abroad
mainly from the Netherlands, Saudi Arabia, Egypt, UK, Germany, and Kenya (Goutard & Magalhaes,
2006). Since 2006 Ethiopia has banned import of poultry products from Egypt, UK, and Germany due
to the incidence of HPAI in these countries. In 2006/07, some imports also occurred from France.
3.1.2 Implications of the structure of poultry sector for modeling of macroeconomic impacts
Following the discussion above, in Ethiopia, for the majority of poultry farms, the linkage with other
sectors of the economy seems weak. There are localized markets for inputs and outputs and a big
part of poultry output is geared towards self consumption. Moreover, a vast majority of poultry
farms do not use purchased inputs thereby delinking them from the immediate upstream firms such
as the feed producers. The commercial poultry sector that has more pronounced inter-sectoral
linkages continues to be small. Hence, aggregate economy wide impacts are likely to be negligible in
Ethiopia.
The effects are likely to be concentrated in the poultry sector along with in markets most directly
linked with poultry. This motivates the use of a multi-market model in case of Ethiopia.
Secondly, as discussed above there is regional concentration in poultry holdings. The impact of a
shock (both if disease strikes in these regions or because of spillover effects from other regions) is
likely to be more severe with high poultry population and density. The regional concentration
becomes even more pronounced in terms of commercial poultry production where there is
concentration around Debre Zeit region. The economic model needs to have this spatial dimension
because it is possible that nationally there is insignificant impact but regionally there are strong
effects of a shock to the poultry sector (either demand or supply).
The proposed multi-market model for Ethiopia is based on Diao et al (2007). This model contains
disaggregation to include poultry and eggs as a separate sector (market). The model is also
regionally disaggregated across regions and zones. The shocks at the level of regional disaggregation
available in the model will be obtained from the disease spread model.
The model also classifies households into decile categories. The effects of shocks to commercial
poultry production in Ethiopia at the regional level will produce results on the economy and also on
specific income decile groups.
Given that the data in the model will not include backyard producers, the estimated effects will come
from shocks to a small segment of the poultry sector. However, this is a dynamic segment of the
poultry economy in Ethiopia and effect of shocks to the commercial poultry production in Ethiopia is
a pertinent research question to address. Moreover, the share of semi-commercial and commercial
poultry has gone up over time.

Pro-Poor HPAI Risk Reduction
13
3.2 Ghana3
3.2.1 Background of the poultry sector in Ghana
Livestock and poultry, together contribute 7% of the national agricultural GDP of Ghana in 2005.
Poultry is an important livestock for the consumers and usually there is a net deficit in terms of
domestic demand supply balance. Ghana imports 60-70% of its poultry meat requirements.
In poultry, free-range village poultry accounts for 60-80% of the national poultry population (FASDEP,
2002; Gyening, 2006) and was estimated to contain between 12 and 20 million birds between 2000
and 2005 (Amakye-Anim, 2000; FAOSTAT, 2005). Rural poultry comprises village chickens, local
guinea fowls, ducks, turkeys and pigeons.
Even though village poultry are kept all over the country, its production is concentrated in the three
northern regions of Ghana (LPIU, 2006). The commercial poultry producers rely heavily on local
maize production that is often supplemented with yellow maize imports. Wheat bran is an important
feed ingredient and it is supplied as a by-product of wheat flour milling by four factories in the
country. Other feed ingredients such as fishmeal, soya bean cake and vitamin-mineral premix are
imported, as are poultry drugs and vaccines. Medium and small-scale commercial farms rely on feed
milling companies for their feed needs (Aning et al 2008).
Like in case of Ethiopia, poultry production in Ghana may be classified into three categories viz.
commercial (or industrial), semi-commercial and backyard producers (Aning, 2006). There are a few
large-scale commercial farms in Ghana, which are integrated with hatchery, production, feed mill
marketing and sometimes processing units (Aning, 2006).
Large-scale farms have an installed capacity of over 10,000 birds each, and operate their own feed
mill. There are only five such farms in Ghana and are located mainly in the Ashanti and Greater Accra
and Brong-Ahafo regions. Medium commercial poultry farmers have installed capacities of 1,000 to
5,000 birds, whereas small-scale farms produce less than 500 birds. Medium and small-scale
commercial farms rely on the large-scale integrated farms for their day old chicks and feed, but may
also obtain feed from other sources.
Semi-commercial poultry farms are usually located in the owners’ backyard where the number of
birds kept typically is below 500. The backyard system is typical as in other countries with low usage
of purchased inputs and limited market orientation.
Relative to most other countries in the project, in Ghana the import of poultry meat is important
Note that Ghana imports only from countries that have an AI free status. The recent increases in
poultry meat imports have been significant, particularly for chicken which has increased more than
four times between 2000 and 2005.
Since 1999, the proportion of poultry meat imported has increased. In 2003, domestic production
supplied only 53% of total poultry meat in Ghana. The major countries exporting poultry meat to
3 This section draws upon the background paper for the HPAI project by Aning et al (2008).
Africa/Indonesia Team Working Paper
14
Ghana are Brazil, the member countries of the European Union and the United States of America,
which together account for more than 75% of total poultry imports with the USA being the biggest
exporter followed by the Netherlands and Brazil.
3.2.2 Poultry sector in Ghana and its Implications for Modeling
As discussed above, like in other countries Ghana also has a sizable backyard poultry sector. Still the
size of semi-commercial and commercial sector in Ghana is significant. Also, among the five
countries, Ghana has the highest importance of poultry as a traded product (both meats and eggs). It
mainly imports meat and exports some eggs. Hence apart from the common shocks discussed the
introduction above, a further shock in terms of possible trade bans could be relevant for Ghana.
There are significant differences in the distribution of poultry sector in Ghana (in terms of number
and density). There is spatial variation also in terms of the structure of the poultry sector. As the
outbreaks of last year show there is potentially significant dispersion in the outbreak in Ghana. The
epidemiological models will provide information of high risk areas in Ghana.
In this project, given the importance of poultry sector in Ghana in terms of domestic consumption
and trade we propose that a CGE analysis combined with microsimulations if possible to be
employed in Ghana. The poultry sector in Ghana (a sizeable portion of it) also has significant
upstream and downstream interlinkages with other sectors.
The 2005 Ghana Social Accounting Matrix (SAM) being developed at IFPRI estimates the structure of
the Ghanaian economy in 2005 and includes detailed information on 56 production sectors, six
factors of production, income and expenditures of rural and urban households, the government
budget, and the balance of payments. A regionally disaggregated version of the SAM is available. The
SAM is regionally divided into four main regions.
The Ghana Living Standards Survey for 2005 (which has been used in the construction of SAM) can be
utilized for obtaining the disaggregated impact on households).
3.3 Indonesia4
3.3.1 Background information on poultry sector in Indonesia
Indonesia fulfills the consumption of poultry and poultry products, mostly from domestic production.
Indonesia also has negligible exports of poultry products. This implies that restricting import/exports
of poultry and poultry products, for example in the case of Avian Influenza (AI) outbreak in
neighboring countries/Indonesia might not have significant impacts on the domestic economy.
The income elasticity of demand for poultry products in Indonesia is high, shown by a significant
decrease (5.25 percent) in its consumption during the economic crisis in the end of 1990s. After the
crisis, the level of consumption of poultry products increased by 9.75 percent.
4 This section draws upon the background paper on Indonesia in the HPAI project.
Pro-Poor HPAI Risk Reduction
15
The island of Java host around 70% of the total poultry and 60% of human population of Indonesia.
Java´s poultry population grew faster compared to other poultry business of other island, specially
the commercial poultry sector.
Overall, Indonesia has a large poultry industry with high regional concentration in Java. As discussed
above, production is mainly aimed to supply the national market, although some export of processed
products and one-day-old chicks may be regionally important. In 2004 and 2005, however, no export
of live birds was carried.
Structure of poultry sector in Indonesia varies greatly ranging from backyard poultry to commercial
breeding farms. About half of them are vertically integrated operations. However, most of the small
– medium enterprises lack integration with operations relating to Day old chicks (DOC), Hatchery egg
suppliers, feed mills, abattoirs belonging to different actors.
CASERED (2004) present a classification of the Indonesian poultry sector based on the FAO system. In
commercially orientated production systems (sector 2) there are thought to be 58.2 million birds in
83 thousand farms, and these systems employ a total of 385 thousand people. There are also nearly
16 thousand farms that have high level bio-security (sector 1) and are associated with industrially
integrated system. Johnston et al.(1992) in a study on Newcastle disease in South east Asia estimated
that 174 million birds were kept in backyard systems (sector 4) with an annual offtake of 175 million
birds and 43.5 million eggs. Assuming that there has been little change in this backyard production
flock over the last 15 years this would suggest that the remaining 32.4 million birds are found in
sector 3 (Rushton and Viscara 2005).
Chicken is the most popular meat in Indonesia. Consumption in 2005 was around 1000 kt or 4.45 kg
per capita per year, followed by beef at 2.4 kg per capita. There were no Poultry exports of
significance. Much of the feed (maize, soybeans) is imported, and the industry is not competitive
with Thailand and other Asian chicken producers. Although not currently an exporter, Indonesia has
been so in the past and could do so once again if a ban on exports from countries such as Thailand
were implemented elsewhere resulting in trade diversion. In 2003 exports were worth US$6.6
million. Japan was the major market. In that year the 700 tonne of imports were valued at $1,321 per
tonne. The USA, Australia and Brazil were the primary sources of supply of chicken meat.
3.3.2 Implications for modeling of macroeconomic impact of HPAI in Indonesia
Recently, computable general equilibrium model (Oktaviani 2008) has been used to assess the overall
costs to the Indonesian economy because of the avian flu outbreak between 2004-2007. This has
been a study commissioned by the government (it has not been released in English). According to the
model results, Indonesia suffered financial losses of Rp4.1 trillion due to bird flu outbreaks during
2004-2007. The losses were estimated based on the impact of outbreaks leading to financial losses
due to chicken culls, reduced demand for poultry products, lower chicken and egg consumption,
costs incurred by farmers as well as the government for bird flu control, and the decline in the
number of tourist visits.
Also, Vanzetti (2007) employs a simulation model (bilateral deterministic trade model called GSIM).
The important structural innovation that Vanzetti includes is to differentiate between light and dark
poultry meat based on Petersen and Orden (2005). Bilateral trade model is considered as the main
focus is on trade flows and bans are likely to be at the bilateral level. Different scenarios are

Africa/Indonesia Team Working Paper
16
considered in Vanzetti (2007) where the magnitude of shocks are derived arbitrarily (and not form an
epidemiological model).
The research in this project should first assess the analysis in these papers and then identify the
research gaps that could be filled. The models to be employed in this project in Indonesia should
have regional disaggregation given the concentration of poultry in Java. Further, the impact is likely
to differ between the epidemic and endemic phase of the disease in the country.
In terms of existing data, the 1995 SAM for Indonesia (at IFPRI) is a 57x57 matrix with accounts for 17
sectors (separate activities and commodities), 6 factors, 7 households, 1 enterprise, the government,
the rest-of-the-world, 2 tax types, and aggregate institutional savings-investments. The SAM is an
aggregation of a 22 sector SAM produced by the Indonesia statistical authority with a revised
treatment of trade and transportation costs (disaggregation across imports, exports and domestic
sales on the basis of value shares). The SAM that IFPRI has for Indonesia for 1995 has 17 activities
that includes livestock but not poultry separately.
The most disaggregated SAM for Indonesia seems to be constructed by Arief Anshory Yousouf. This
Indonesian SAM for the year 2003 contains 181 industries, 181 commodities, and 200 households
(100 urban and 100 rural households grouped by expenditure per capita centiles). The SAM (with the
size of 768x768 accounts) constitutes the most disaggregated SAM for Indonesia at both the sectoral
and household level.
Given that CGE models assessing the impact of HPAI on Indonesia’s economy already exist, one
possibility is to construct a multi-market (MM) model linking poultry and a set of markets where
there are significant links. The MM model should also be disaggregated regionally.
3.4 Kenya5
3.4.1 Background information on Kenya’s poultry sector
Poultry keeping is one of the most popular livestock enterprises in Kenya. In Kenya, free-ranging
indigenous birds comprise 84.1% of population. The poultry sub-sector contributes about 55% to the
livestock sector and 30% of the agricultural GDP (RoK, 2007). The sub-sector employs about two
million people directly in production and marketing and indirectly through linkages with suppliers of
such inputs as day-old-chicks, feeds and veterinary services. Poultry are a major source of animal
proteins and is used in many diets. About 65% of all Kenyan households keep chickens. At the macro-
level however poultry is still concentrated in the backyard (free ranging) system.
The total poultry population in Kenya varied greatly between 2001 and 2006. Rift Valley Province had
the highest poultry population followed by Nyanza and Central Provinces. As expected, indigenous
chickens form the largest proportion of the total poultry population in each year (Details available in
Omiti and Okuthe 2008).
5 This section draws from the background paper on Kenya for the HPAI project.

Pro-Poor HPAI Risk Reduction
17
There is moreover strong regional disparity in poultry holdings. Nairobi province has the highest
number of chicken kept per household (91.3). In contrast in the North eastern province only 2% of all
households keep chicken, a figure far below the national average; these households also keep the
least number of chickens (5.4) in the country. Indigenous birds are mainly reared in the rural areas
while commercial birds (broilers and layers are kept in the outskirts of main urban centers such as
Nairobi, Kisumu, Nakuru and Mombasa.
Even though poultry sector in Kenya might not be a significant contributor to the economy as whole
it does have strong linkages with some sectors. The poultry sector in Kenya is highly integrated
upstream with the poultry feed industry (importers of premixes and feed manufacturers) and animal
health service providers. It also has strong downstream integration with the farming community
(mainly dairying and crop producers via manure), fishing industry (feathers are used to manufacture
fishing baits) and the food industry (through eggs and poultry meat).
Some of the sectors that the poultry industry is integrated with contribute significantly to Kenya’s
economy. For instance, the dairy sub-sector contributes about 10% of the livestock GDP. Crop
production contributes 16% of agricultural GDP. Between 1999 and 2003, the fishing industry
accounted for 0.3% of the total GDP (EPZA, 2005). The food industry where poultry products are
mainly consumed is highly integrated with the tourism sector which contributes about 19% to the
overall economy.
Feed millers constitute the largest players in the animal feed industry. Animal feed (including poultry
feed) is manufactured from imported feed premixes and locally produced cereals – mainly maize,
wheat and rice. The large number of feed millers in Nairobi and Central Provinces is an indication of
the importance of commercial poultry farming in these areas. Indigenous chicken producers like in
other countries rarely purchase commercial feeds.
The fully industrial sector has high use of external inputs for housing, feeding and processing. The
scale of production is large consisting of several thousand commercial birds. Such farms are
integrated with hatcheries that produce day chicks for use on the farm and for sale.
In the commercial poultry production system, this sector consists of hatcheries where poultry is bred
and hatched for commercial purposes and day old chicks are sold to farmers (FAO, 2007). Hatcheries
are well linked with most players in the poultry industry and the rest of the economy. Most of the
day old chicks are sold to smallholder poultry farmers. Culled hens are sold to retailers and
wholesalers in major towns and urban centers. Manure is sold to coffee and flower farmers and also
to dairy producers especially during the dry season.
In commercial turkey production, the breeding stock is usually imported from the United Kingdom.
Turkey feed is sourced from feed manufacturers. There is only one commercial duck hatchery farm in
Kenya. Ducks are hatched, bred and slaughtered on the farm. Dressed carcasses are sold in Nairobi
for further processing by a meat processing and packaging company. Duck feed is bought from feed
manufacturers.
The village (traditional) poultry production system comprises indigenous chicken, ducks, turkeys and
other poultry types kept in the rural areas and in the urban informal settlements. The numbers kept

Africa/Indonesia Team Working Paper
18
vary with region, species and consumption needs. This is a low-input, low-output production system
which involves low income households.
Kenya is generally self-sufficient in egg and poultry meat. Currently, Kenya does not import or export
any chicken meat. However, other poultry products are traded. Day old chicks are the major exports
while hatching eggs are the major imports. A substantial number of day old chicks are imported as
well. Kenyan hatching eggs and day old chicks are exported to the neighboring countries – Uganda,
Tanzania and Ethiopia. Kenya imports poultry breeding stock (parent birds, fertilized eggs and day
old chicks) mainly from Mauritius, Holland, Egypt, India and South Africa. Commercial turkeys are
mainly imported from the United Kingdom and the USA Omiti and Okuthe 2008).
3.4.2 Implications for modeling of macroeconomic impact of HPAI in Kenya
An overwhelming majority of Kenya’s poultry sector is in the backyard sector. Yet, the commercial
and semi commercial sectors are sizable in Kenya and exhibit strong linkages with upstream and
downstream sectors.
Given the size and structure of the poultry sector, in this project we propose that either a CGE model
or a multi-market model could be the adequate one for Kenya. Among the countries in the project,
Kenya has perhaps the most heterogeneous poultry sector. Hence disaggregating the poultry sector
is very important for the case of Kenya. Figure 1 below shows (from the SAM for Kenya) that the
multipliers for poultry are large implying that an elaborate multi-market model or a CGE model could
be employed.

Pro-Poor HPAI Risk Reduction
19
Figure 1: Production and SAM multipliers in Kenya
SAM, 2003 for Kenya
In terms of data availability, the Kenya 2003 Social Accounting Matrix (SAM) has been developed at
IFPRI in collaboration with Kenya Institute for Public Policy research and Analysis (KIPPRA). In the
Kenya SAM the production account (activities and commodities) has been disaggregated into 27
sectors each as defined in national accounts.6 The data is not disaggregated to include poultry. In
terms of regional disaggregation, however households were disaggregated according to region
(rural/urban) and expenditure deciles (lower/upper).
Multi- market models have also been applied for economic analysis in Kenya. These models could be
customized to address the macroeconomic impact of HPAI in Kenya. For example Karanjaa et al
(2003) use a multi-market model to compute both absolute and relative welfare effects of
technological change on different household types located in six distinct agro-ecological zones and in
urban areas. The model has 13 different household types: small farms and large farms in each of
Kenya’s six agro-ecological zones plus urban households. However, the households are assumed to
6 The sectors are: Agriculture
6, Fishing, Forestry, Mining and Quarrying, Meat and dairy processing, Milling,
Bakery and confectionary, Beverages and tobacco, Other food manufactures, Textiles and Footwear, Wood and Paper, Printing and Publishing, Petroleum, Chemicals, Metals and Machinery, Non-metallic manufactures, Other manufactures, Electricity and Water; Building and construction; Trade; Hotels and restaurants; Transport and communication; Financial services; Other services; Education; Health and; Public Administration.
3.81
1.09
1.91
3.55
2.87
3.39
2.12
3.92 3.83 3.923.74 3.76 3.83
4.01 3.91 3.96
3.65
3.213.35
3.64
3.223.05
2.51
3.17
3.56
8.33
1.26
3.23
7.76
6.04
7.65
3.87
8.438.59
8.74
8.39 8.46
7.95
8.44
8.86 8.82
8.49
7.13
7.54
6.71
5.92
5.15
4.35
6.99
7.24
0
1
2
3
4
5
6
7
8
9
10
Production multipliers SAM multipliers

Africa/Indonesia Team Working Paper
20
produce only two commodities. More recently MM models have been developed by Omamo et al
(2006) that have more commodities and include poultry. The MM model by Omamo et al (2006)
needs to be regionally disaggregated. The existing model is at a regional level for East Africa. Hence,
this regional model needs to be disaggregated at a national level for Kenya and subsequently to the
sub-regional level.
3.5 Nigeria7
3.5.1 Background of the poultry sector in Nigeria
Backyard and/or village extensive production system forms 60% of the poultry in Nigeria. Semi-
commercial system of poultry production forms 15% while commercial forms the rest 25%. Location is
an important factor determining the type of poultry management system practiced in Nigeria.
Extensive and backyard (extensive) poultry production systems are common in the rural areas while
backyard (intensive) system is common in rural-town and urban areas in Nigeria (Uzochukwu Obi et al
2008).
Village poultry production system in Nigeria is a ‘low input low output type’ with a small flock size.
Mostly, the raising of birds does not involve many purchased inputs. This could imply weak linkages
with other sectors on the input side. Households usually engage in free-range village poultry
production for their own consumption while only few sell their poultry products for additional income
(implying weak linkages on the output side).
Existing evidences show that village poultry dominates the poultry sub-sector in Nigeria. Almost every
household in rural areas keep poultry in Nigeria. About 70% of the inhabitants of Oyo State keep
livestock particularly poultry (Afolabi, 2007) and ownership of poultry is common across the six
geopolitical zones.
Across regions, subsistence poultry keeping is higher in the south than in the north. The percentage of
households rearing poultry is highest in the south zone (64.42%) followed by south-west (56.44%)
while north-west have the lowest number of families that engage in poultry production (29.96%).
In south west Nigeria, Ogun State has highest percentage of households keeping subsistence poultry
(74%) followed by Osun State (57.3%) while Oyo State has the lowest (42.4%). This is on expected
lines as Ogun State has one of the key international borders (Idiroko Border Station) through which
poultry import (legal and illegal) takes place. Ogun (Uzochukwu Obi et al 2008).
The contribution of village poultry in the national economy of Nigeria has been significant over
decades. Akinwumi et. al. (1979)’s work show that family poultry contributed 61% and 19.5% to the
total poultry meat and egg production respectively between 1977 and 1978 in Nigeria. Also, evidence
from Sonaiya et. al. (1990; cited in Sonaiya, 2007: 134) indicates that family poultry contributed 68.9%
of the total poultry meat produced in the country. Recently, UNDP (2006) indicates that the total
number of birds under village extensive and backyard semi-intensive/intensive production systems
constitute about 70% of the total poultry population in Nigeria. Backyard (intensive) poultry producers
7 This section draws upon the background paper for the HPAI project.

Pro-Poor HPAI Risk Reduction
21
are widely distributed in the peri-urban areas. The density of backyard poultry farms and markets for
livestock inputs (feeds, drugs, etc) is very high in Agege (Oko-Oba) areas in Lagos State and Oke-Aro
areas in Ogun State.
Some small commercial poultry producing farms with a flock size ranging from 1000 – 4999 birds are
unevenly located across the six geopolitical zones in Nigeria. This sector focuses primarily on egg
production with some farmers also engaged in broiler meat production simultaneously. Available data
also show that most of these sector 3 farms are located in Lagos and Ogun States, and those states
close to them. This could be due to the fact that Lagos and Ogun States are the major entry points for
imported poultry inputs such as vaccines and drugs in Nigeria. Besides, the market for poultry
products in Lagos and other southern states (especially eggs) is large. Large commercial farms of
operation capacity within 5,000 and 100,000 birds dominate the commercial production sector. Many
of those that have production capacity on the lower tail are widely spread in Lagos, Osun, Ogun, Oyo,
Ekiti, Ondo, Delta, Edo and northern states. The second group of large commercial farms are those
with relatively high production capacity as high as 250,000 birds. They are few in number and are
mainly found in the southern Nigeria.
In terms of the linkage with other sectors, in the village extensive or free range production system,
birds mainly depend on scavengable resource base (SRB) within the community. In the backyard semi-
intensive/intensive production system, flock is fed with a combination of feeds purchased from feed
mills and shop outlets. Feeds are expensive and as a result the smallholders usually produce feeds
themselves using locally available inputs. Most backyard farmers produce their feeds using a mixture
of local materials like corn and bone meal only or in combination with oyster shell, fish meal, and
wheat offal.
Commercial farmers obtain their feeds from both local and international sources. Many operators in
the commercial poultry sector also have their own feed mill. Another common group in feed
production in the country are the toll millers who do not package processed feeds into the market but
only mill ingredients for poultry farmers for a fee and thus are usually located within surroundings of
livestock farms (e.g. Oke-Aro area in Ogun State and Oko-Oba area in Lagos).
Until 2002 when the government placed a ban on the import of poultry and poultry products, imports
comprised a very significant source of inputs (D.O.C, equipment, feed concentrates, drugs, vaccines,
etc) and poultry products (such as frozen chicken, frozen turkey, etc). Illegal import of poultry is very
important but has not been quantified.
Nigeria imports products of animal origin from majority of its neighbors like Ghana and Cameroon.
The importation of live animals and products of animal origin in the country has been on an increasing
trend since 1999.
With a rapid spread of HPAI across many states in Nigeria within a year of its emergence, it is also
important to review the distribution of trading activities across the zones. Most of the import took
place in South-West (Lagos) and south in 2006. But the disease spread to other regions where inter-
zonal trade also had a role to play (Uzochukwu Obi et al 2008).

Africa/Indonesia Team Working Paper
22
3.5.2 Implications for modeling of macroeconomic impact of HPAI in Nigeria
In this project it is proposed that a CGE model be applied to assess the macroeconomic impact of a
HPAI outbreak in Nigeria.
In terms of data, the social accounting matrix that Paul Dorosh developed at IFPRI has a base year of
1987. Nwafor et al have the SAM for the base year 1997. Both these datasets are quite aggregated
and need to be disaggregated to capture poultry as a separate sector. Like in other countries,
disaggregating the poultry sector itself is important for a country like Nigeria.
For spatial data FAO’s Animal Production and Health Division has, in collaboration with the
Environmental Research Group Oxford (ERGO) developed the "Gridded Livestock of the World" (GLW).
The GLW’s main objective is to produce and distribute contemporary global distribution maps for the
main species of livestock. These maps are created through the spatial disaggregation of sub-national
statistical data based on empirical relationships with environmental variables in similar agro-
ecological zones. The data are produced in ESRI grid format at a spatial resolution of 3 minutes of arc
(roughly 5 km at the equator) for cattle, buffalo, sheep, goats, pigs and poultry/chickens and are freely
available for download via FAO’s GeoNetwork data repository. In a big country like Nigeria spatial data
could be extremely relevant.
Nigeria has a 2004 Living Standards Survey that could be used in combination with the CGE model.
The household level impact should aim to get impacts by poultry sector type and household
categories.

Pro-Poor HPAI Risk Reduction
23
4. Conclusions
This paper suggests a common framework for assessing the impact of an AI outbreak in the five
countries covered in the project. These countries differ on three main aspects that have implications
for the modeling techniques to be adopted (in addition to the data availability that will determine
modeling choices). These are whether or not the country in question had an AI outbreak, what is the
importance of poultry sector in the national and regional economy and what are the potential disease
risk spread mechanisms.
The choice of the models will be based on these criteria. Moreover a common principle guiding the
methods in the project is to combine the information and knowledge from the other components of
the project (disease risk work package) into the analysis. The approach in this project is to appeal to
the existing methods and enrich them with the knowledge from other disciplines.
A CGE or a multi-market model that is regionally disaggregated and draws upon shocks from an
epidemiological model is suggested as the common method. All models are suggested to link up with
household data. The estimated impacts are likely to be most meaningful by differentiating the results
by the type of poultry sector. In some countries, disaggregation of SAM to include the poultry sector is
required. A more challenging job however is to disaggregate the poultry sector itself into different
components such as backyard and commercial production.

Africa/Indonesia Team Working Paper
24

Pro-Poor HPAI Risk Reduction
25
5. References
Afolabi, J.A., 2007. Evaluation of Poultry Egg Marketing in South-Western Nigeria. International
Journal of Poultry Science¸6 (5): 362-366.
Alemu D., T. Degefe, S. Ferede, S. Nzietcheung and D. Roy. 2008. “Overview and Background Paper
on Ethiopia’s Poultry Sector for HPAI Research in Ethiopia.” Draft Report. International Food
Policy Research Institute/International Livestock Research Institute
Alemu Yami and Tadelle Dessie. 1997. The status of poultry research and development. Research
Bulletin No 4. Poultry Commodity program, Debre zeit Agricultural Research Center, Alemaya
University of Agriculture.
Amakye-Anim, J. (2000) V4/I2 Newcastle Disease Project. Ghana Veterinary Medical Association
Newsletter 5(1): 15-17.
Aning K. G., P.K. Turkson and S. Asuming-Brempong.2008. “Pro-Poor HPAI Risk Reduction Strategies.
Ghana Background Paper.” Draft Report. International Food Policy Research
Institute/International Livestock Research Institute
Aning, K.G. (2006). The Structure and Importance of the Commercial and village based poultry in
Ghana. FAO Review Paper 44p.
Bush Jennifer. 2006. The Threat of Avian Flu Predicted Impacts on Rural Livelihoods in Southern
Nation, Nationalities and Peoples Region (SNNPR), Ethiopia. The Food Economy Group, May
2006.
CASERED (Indonesian Centre of Agricultural Socio-Economic Research and Development) 2004.
Socio-Economic Impact Assessment of the Avian Influenza Crisis in Poultry Production
Systems in Indonesia, with Particular Focus on Independent Smallholders. Final Report for
FAO’s TCP/RAS/3010 “Emergency Regional Support for Post Avian Influenza Rehabilitation”.
FAO, Rome, Italy.
CSA (Central Statistical Authority). 2005. Agricultural Sample Survey 2004/05. Volume II. Report on
Livestock and livestock characteristics. Statistical Bulletin 331.
Dessie, T., Million, T., Alemu, Y. and Peter K.J. 2003. Village chicken production system in Ethiopia:
use patterns and performance valuation and chicken products and socioeconomic function of
chicken. Livestock Research for Rural Development 15(1).
Dutta, Arin. 2008. “The Effectiveness of Policies to Control a Human Influenza Pandemic: A Literature
Review (February 1). World Bank Policy Research Working Paper No. 4524 Available at SSRN:
http://ssrn.com/1096847
EPZA (Export Processing Authority) (2005). Meat production in Kenya 2005.
http://www.epzakenya.com/UserFiles/File/Fishkenya.pdf -
FAO (2007). The structure and importance of the commercial and village based poultry systems in
Kenya: An analysis of the poultry sector in Kenya. Food and Agriculture Organization of the
United Nations, Rome, 93pp.
FAOSTAT (2005) Food and Agriculture Indicates – Ghana FAOSTAT, Worldbank Website.

Africa/Indonesia Team Working Paper
26
FASDEP (2002) Food and Agriculture Sector Development Policy, MOFA, Accra 67pp.
Goutard F. and R. S. Magalheas. 2006. Risk and consequence assessment of HPAI. CIRAD. February
Gyening , K.O. (2006) The future of the poultry industry in Ghana. Paper prepared for the Ghana
Veterinary Medical Association 7pp.
Johnston, J., Fontanilla, B. and Silvano, F. 1992. The economic impact of vaccinating Vilklage Fowls: a
Case Study from the Philipines. In “Newcastle Disease in Village Chickens. Control with
Thermostable Oral Vaccines” Edited by Spradbrow, P. Proceedings of an International
Workshop held in Kuala Lumpur, Malaysia, 6-10 October 1991. ACIAR, Canberra, Australia.
Pages 62-71
LPIUV (Livestock Planning and Information Unit) (2006). Projects of the VSD Livestock census figures
of 1995/1996.
Nzietchueng S. 2008. Characterization of poultry production systems and potential pathways for the
introduction of highly pathogenic avian influenza in Ethiopia. Draft Report. International
Livestock Research Institute.
Omiti John M. and Sam O. Okuthe. 2008. “An overview of the poultry sector and status of highly
pathogenic avian influenza (HPAI) in Kenya.” Draft Report. International Food Policy Research
Institute/International Livestock Research Institute
Oktaviani, Rina. 2008. “Dampak Merebaknya Flu Burung terhadap Ekonomi Makro Indonesia: Suatu
Pendekatan CGE” (Impact of Avian Influenza Outbreak on the Indonesian Macro Economy: A
CGE Approach)”. Paper presented at the Workshop on Avian Influenza: Assessment, Policy
Response, and Socio-Economic Impact, on February 28, 2008 in Sanur Bali, Indonesia.
Peterson, E. and D. Orden. 2005. “Effects of Tariffs and Sanitary Barriers on High- and Low-Value
Poultry Trade.” Journal of Agricultural and Resource Economics 30:1 109-127. April.
Republic of Kenya (RoK) (2007). Kenya Integrated Household Budget Survey (KIHBS) 2005/06. Volume
1. Basic Report, 329pp.
Rose, A. and Liao, S-Yi. Modeling Regional Economic Resilience to Disasters: A Computable General
Equilibrium Analysis of Water Service Disruptions. Journal of Regional Science, Vol. 45, No. 1,
pp. 75-112, February
Rushton, J. and R. Viscara. 2005. Emergency Regional Support for Post-Avian Influenza Rehabilitation,
TCP/RAS/3010. Impact of avian influenza outbreaks in the poultry sectors of five South East
Asian countries: Cambodia, Indonesia, Lao PDR, Thailand, Viet Nam - outbreak costs,
responses and potential long term control. Food and Agriculture Organization of the United
Nations. Rome.
Sonaiya, E.B. and Olori, V.E., 1990. ‘Family Poultry Production in Western Nigeria’ In Sonaiya, E.B.,
2007. Family Poultry, food security and the impact of HPAI. World’s Poultry Science Journal,
Vol. 63.
Sonaiya, E.B., 2007. Family Poultry, food security and the impact of HPAI. World’s Poultry Science
Journal, Vol. 63.

Pro-Poor HPAI Risk Reduction
27
Sumiarto B., and Bustanul Arifin. 2008. “Overview on poultry sector and HPAI situation for Indonesia
with special emphasis on the Island of Java.” Draft Report. International Food Policy Research
Institute/International Livestock Research Institute
UNDP, 2006. Socio-Economic Impact of Avian Influenza in Nigeria. UNDP Nigeria. July 2006.
Uzochukwu Obi T., Adewale O. O. and G. A. Maina. 2008. “Pro-Poor HPAI Risk Reduction Strategies.”
Nigeria Background Paper.” Draft Report. International Food Policy Research
Institute/International Livestock Research Institute
Vanzetti, D. 2007. “Chicken Supreme: How the Indonesian Poultry Sector can Survive Avian
Influenza.” Contributed paper at the 51st AARES Annual Conference, Queenstown, New
Zealand, 13-16 February.
You L. and X. Diao. 2007. “Assessing the Potential Impact of Avian Influenza on Poultry in West Africa:
A Spatial Equilibrium Analysis.” Journal of Agricultural Economics. 58. NO. 2. 348-367
Yusuf A. A. 2008. "INDONESIA-E3: An Indonesian Applied General Equilibrium Model for Analyzing
the Economy, Equity, and the Environment," Working Papers in Economics and Development
Studies (WoPEDS) 200804, Department of Economics, Padjadjaran University, revised Sep
2008.