methodologies for analyzing impact of urbanization …
TRANSCRIPT
METHODOLOGIES FOR ANALYZING IMPACT OF URBANIZATION ON IRRIGATION DISTRICTS
Gabriele Bonaiti, Ph.D.1 Guy Fipps, Ph.D., P.E.2
ABSTRACT
The region of Texas along the Mexican border has been experiencing rapid urban growth. This has caused fragmentation of many irrigation districts who are struggling to address the challenges resulting from urbanization. A previous paper provided an analysis of the growth of urban area and its impact on water distribution networks in five Texas border counties over the ten year period, 1996 to 2006. In this paper, we discuss alternative procedures developed to assess such impacts, and we evaluate their effectiveness in identifying critical areas, growth patterns, etc. Urbanized areas were identified starting from aerial photographs using two different approaches: manual, and automatic based on the analysis of radiometric and structural image information. The resulting urbanization maps were then overlapped with distribution network density maps, and critical impact areas were identified. This paper compares the results obtained between the different methods, and evaluates if the analysis can be further improved by categorizing the urban area with the Morphological Segmentation Method.
INTRODUCTION
Texas is predicted to have the fastest population growth in the USA between 2010 and 2060, and the Rio Grande Regional Water Planning Area (Region M), which is one of the 16 Texas Water Planning Regions established by Senate Bill 1 in 1997, is predicted to have the highest growth in Texas, with +182% (Texas Water Development Board, 2012). Within Region M, Hidalgo and Cameron are the most populated counties, with an expected growth of +103 and +164%, respectively between 2010 and 2060 (Rio Grande Regional Water Planning Group, 2010). Urbanization in South Texas is causing the fragmentation and loss of agricultural land, with detrimental effects on normal operation and maintenance of districts (Gooch and Anderson, 2008, and Gooch, 2009). In particular, districts have to abandon structures and invest in new ones to ensure proper operation, change how to operate systems when canals become oversized, and increase rates to address the challenge of reduced revenues from water sales. Districts in this region primarily operate their systems manually, with a canal rider personally moving from site to site. As a consequence, urbanization can create access to and maintenance of facilities difficult or more time consuming. Transfer of water rights from agricultural to other uses reduces the total amount of water flowing through the water distribution networks, which typically decreases 1 Extension Associate, Department of Biological and Agricultural Engineering, 2117 Texas A&M University, College Station, Texas 77843‐2117; [email protected] 2 Professor and Extension Agricultural Engineer, Department of Biological and Agricultural Engineering, 2117 Texas A&M University, College Station, Texas 77843‐2117; [email protected]
conveyance efficiency and increases losses. Finally, the increasing presence of subdivisions and industrial areas in the vicinity of the delivery network increase the liability for canal breaks and flooding. Most districts in the region do very little analysis of the effects of urbanization on their operation and management procedures, or incorporate urbanization trends into planning for future infrastructure improvements. Therefore, there is a need for identification of critical areas. There would be several benefits from such analysis, for example identify priority areas for conversion from open canal to pipeline (Lambert, 2011). The objective of this paper is to compare alternative procedures and techniques to assess urbanization impacts on irrigation districts and to evaluate their effectiveness in identifying critical areas. Literature review Several methodologies have been used to identify urban area extent and growth. Many studies use satellite archive imagery as source of data (e.g., Landsat) which are becoming more readily available, are characterized by a multi-spectral data, and have good spatial resolution for landscape scale analysis. When analysis is carried out on smaller areas, results can be more accurate using aerial photographs, which provide more detail on geometric information. Analysis of imagery data for interpretation of land use and land cover dynamics can be performed with manual (Bonaiti and Fipps, 2011) or automatic procedures. The most utilized automatic approaches are Pixel-Oriented (PO) and Object-Oriented (OO) analysis. In the last decade, several studies demonstrated that the OO method can give more accurate results compared to PO (Pakhale and Gupta, 2010). Urbanization maps identify only the location of urban areas. To interpret the evolution of spatial patterns, Ritters, et al. (2000) proposed a model which distinguishes different types of forest fragmentation through an automatic pixel analysis of aerial photography. Ritters’ analysis is used to determine the progressive intrusion of urbanization, classified into categories: edge, perforated, transition and patched. Vogt, et al. (2007) and Soille and Vogt (2009) proposed an improvement in Ritters method by analyzing the fragmentation on the base of image convolution, called the Morphological Segmentation Method. This method helps to prevent misclassifications of fragmentation and can be easily applied using a free software (Soille and Vogt, 2009, GUIDOS, 2008). Impact on districts can be measured not only with the size or the type of urbanization intrusion in their service area, but also with a specific analysis of the interaction between water distribution network and urban expansion. Little attention has been given to this aspect (Gooch, 2009)
MATERIALS AND METHODS
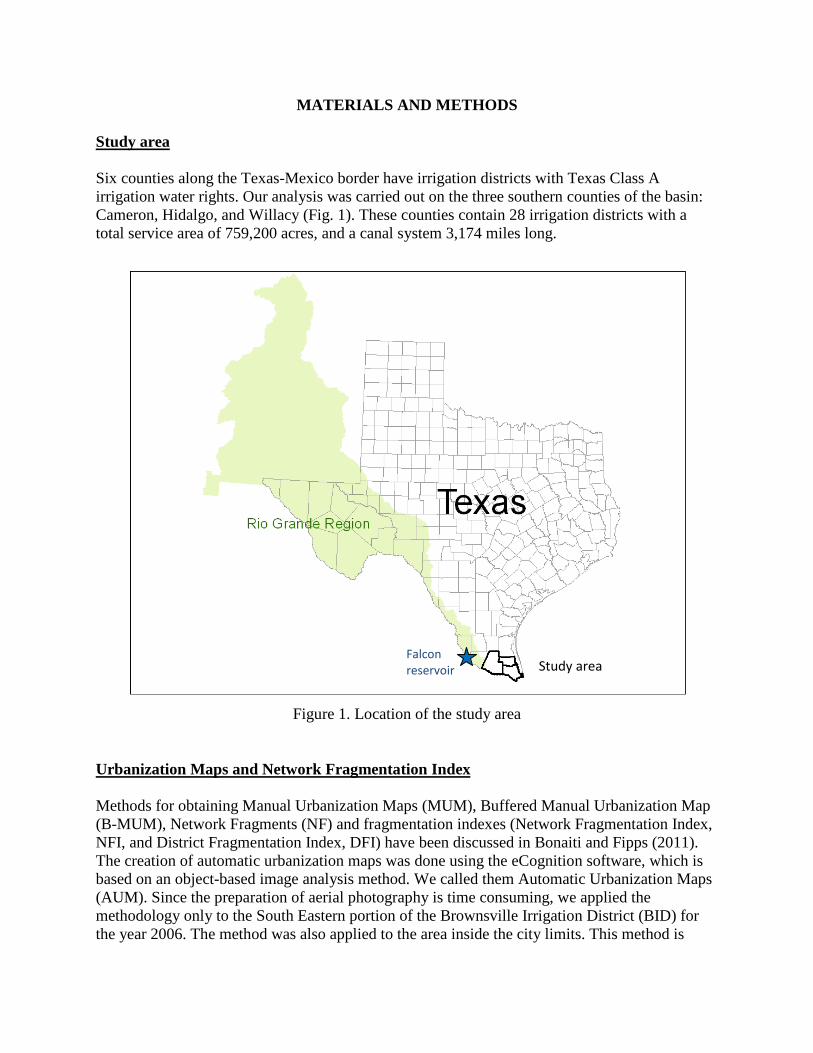
Study area Six counties along the Texas-Mexico border have irrigation districts with Texas Class A irrigation water rights. Our analysis was carried out on the three southern counties of the basin: Cameron, Hidalgo, and Willacy (Fig. 1). These counties contain 28 irrigation districts with a total service area of 759,200 acres, and a canal system 3,174 miles long.
Figure 1. Location of the study area
Urbanization Maps and Network Fragmentation Index Methods for obtaining Manual Urbanization Maps (MUM), Buffered Manual Urbanization Map (B-MUM), Network Fragments (NF) and fragmentation indexes (Network Fragmentation Index, NFI, and District Fragmentation Index, DFI) have been discussed in Bonaiti and Fipps (2011). The creation of automatic urbanization maps was done using the eCognition software, which is based on an object-based image analysis method. We called them Automatic Urbanization Maps (AUM). Since the preparation of aerial photography is time consuming, we applied the methodology only to the South Eastern portion of the Brownsville Irrigation District (BID) for the year 2006. The method was also applied to the area inside the city limits. This method is
Study area Falcon reservoir
faster and gives higher detail compared to MUM, but since it is based on a slightly different approach (e.g., all houses are included) consistency between the two methods must be evaluated. Similarly to what done with MUM, we added 0.03-mile buffer to AUM to create a Buffered Automatic Urbanization Map (B-AUM). Then we overlapped it with open canals and pipelines and we identified “automatic” Network Fragments (NFa). Finally, we applied the Kernel density to NFa and we obtained the “automatic” Network Fragmentation Index (NFIa). Morphological Segmentation Method In order to add information to the urbanization maps, we categorized them using the Morphological Segmentation Method. The categories that are defined by the procedure are: Core, Edge, Perforation, Bridge, Loop, Branch, Islet. We used the GUIDOS 1.3 software (Vogt, 2010). In particular, the software implements the Morphological Spatial Pattern Analysis (MSPA) and allows modification of four (4) parameters as described in the MSPA Guide (Vogt, 2010):
• Foreground Connectivity: for a set of 3 x 3 pixels the center pixel is connected to its adjacent neighboring pixels by having either a) a pixel border and a pixel corner in common (8-connectivity) or, b) a common pixel border only (4-connectivity). The default value is 8
• Edge Width: this parameter defines the width or thickness of the non-core classes in pixels. The actual distance in meters corresponds to the number of edge pixels multiplied by the pixel resolution of the data. The default value is 1
• Transition: transition pixels are those pixels of an edge or a perforation where the core area intersects with a loop or a bridge. If Transition is set to 0 (↔ hide transition pixels) then the perforation and the edges will be closed core boundaries. Note that a loop or a bridge of length 2 will not be visible for this setting since it will be hidden under the edge/perforation. The default value is 1
• Intext: this parameter allows distinguishing internal from external features, where internal features are defined as being enclosed by a Perforation. The default is to enable this distinction which will add a second layer of classes to the seven basic classes. All classes, with the exception of Perforation, which by default is always internal, can then appear as internal or external (default value equal to 1)
We applied the methodology to B-MUM, B-AUM, and AUM. We used default values for the four parameters except for the Edge Width with AUM, which was set to 10 to account for the smaller pixel size of this map. To be suitable for the software, the original files (shapefiles) had to be first converted to raster. To do that, we chose a cell size that looked reasonable for the type of detail of the original map. Therefore we used a cell size of 310 for B-MUM and B-AUM, and a cell size of 31 for AUM. Based on the idea that network fragmentation has a different impact on districts operation according to the category that overlaps it, we also set up a procedure to correct the NFI using a categorization map. Using the 1996 B-MUM, we gave the following weights to categories: 1, 2, 3, 4, 5, and 10, respectively for Core, Edge, Bridge, Loop, Branch, and Islet (no results were obtained for the Perforation category in our maps). In other words, we assumed that the impact
on district operation is greater if a new subdivision overlaps a canal in a remote area, where district personnel and farmers are not well organized to adapt to such changes. Using the Raster Calculator ArcGIS tool we multiplied the category weights by the NFI, and then normalized the results based on the maximum value. We called the result the Corrected Network Fragmentation Index (NFIc). Network Potential Fragmentation Index To avoid the burden of extracting NF and then combining them to urbanization maps to obtain NFI, we tested a simplified procedure based on a probable number of NF instead of the measured one. We first created an Urban Fragments Density Map (UFDM) by calculating the density of urban fragments in the 1996 MUM (i.e., the number of isolated urbanized polygons per area unit). To do this, we applied the “Feature to Point” ArcGIS tool to the urbanization polygons and then the “Kernel Density” tool to the resulting point map. In both cases we used default values. Secondly, we created a Network Density Map (NDM) by applying the “Line Density” tool (with default values) to canals and pipelines. Using the “Raster Calculator” tool, we multiplied the UFDM values by the NDM values, and then normalized the results based on the maximum value. We called the result Network Potential Fragmentation Index (NPFI). In analogy with DFI, we finally calculated for each district a District Potential Fragmentation Index (DPFI). This was done by calculating the ratio between the sums of NPFI pixels values and the total length of canals and pipelines.
RESULTS
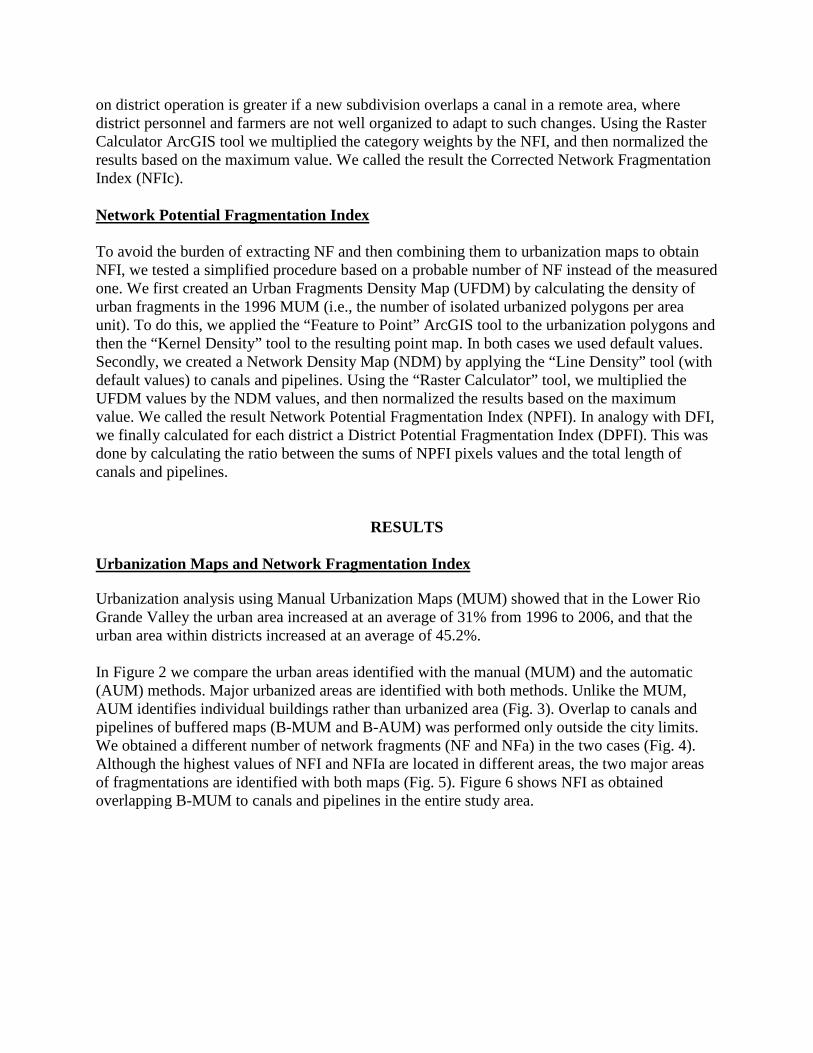
Urbanization Maps and Network Fragmentation Index Urbanization analysis using Manual Urbanization Maps (MUM) showed that in the Lower Rio Grande Valley the urban area increased at an average of 31% from 1996 to 2006, and that the urban area within districts increased at an average of 45.2%. In Figure 2 we compare the urban areas identified with the manual (MUM) and the automatic (AUM) methods. Major urbanized areas are identified with both methods. Unlike the MUM, AUM identifies individual buildings rather than urbanized area (Fig. 3). Overlap to canals and pipelines of buffered maps (B-MUM and B-AUM) was performed only outside the city limits. We obtained a different number of network fragments (NF and NFa) in the two cases (Fig. 4). Although the highest values of NFI and NFIa are located in different areas, the two major areas of fragmentations are identified with both maps (Fig. 5). Figure 6 shows NFI as obtained overlapping B-MUM to canals and pipelines in the entire study area.
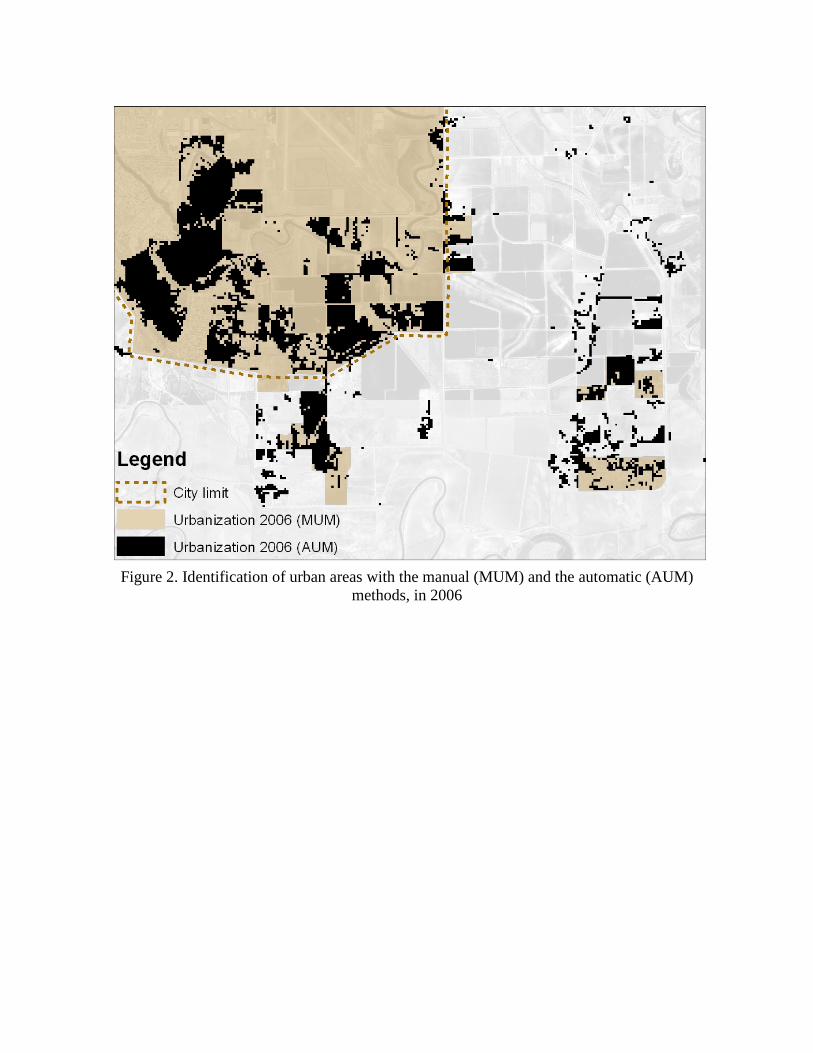
Figure 2. Identification of urban areas with the manual (MUM) and the automatic (AUM)
methods, in 2006
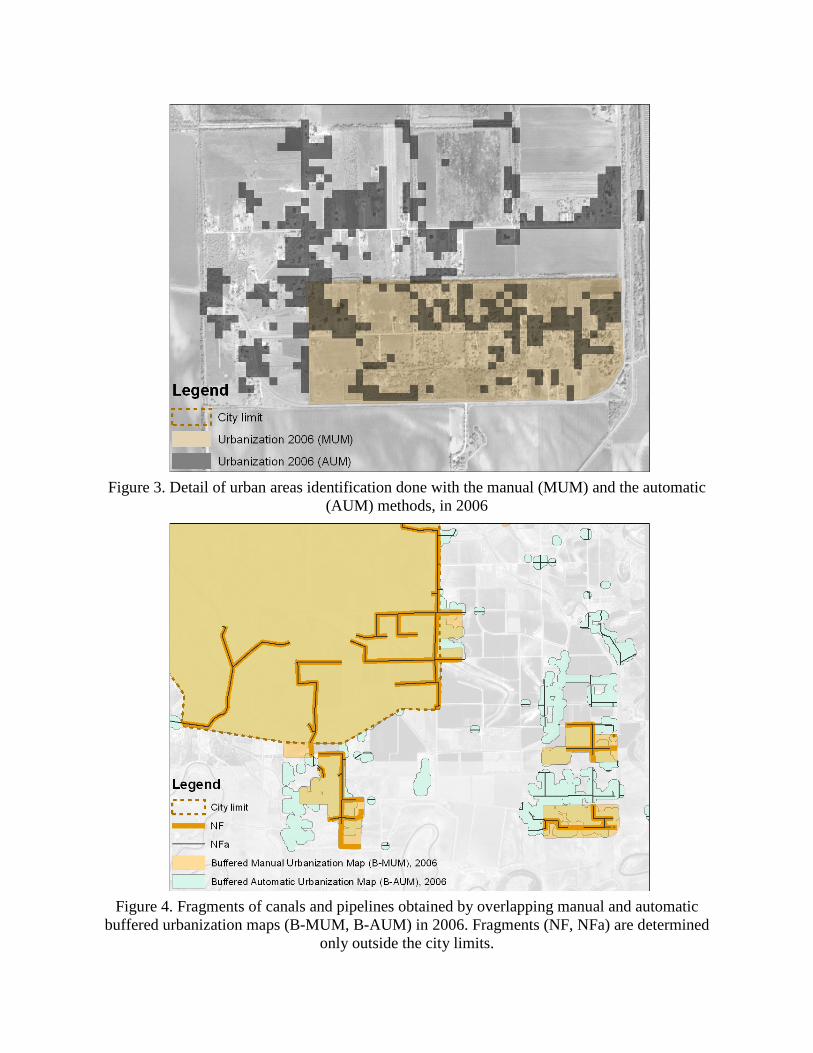
Figure 3. Detail of urban areas identification done with the manual (MUM) and the automatic
(AUM) methods, in 2006
Figure 4. Fragments of canals and pipelines obtained by overlapping manual and automatic
buffered urbanization maps (B-MUM, B-AUM) in 2006. Fragments (NF, NFa) are determined only outside the city limits.
Figure 5. Network Fragments and Network Fragmentation Index calculated for the year 2006
using buffered urbanization maps. A) Using B-MUM (NF and NFI); B) Using B-AUM (NFa and NFIa)
B
A
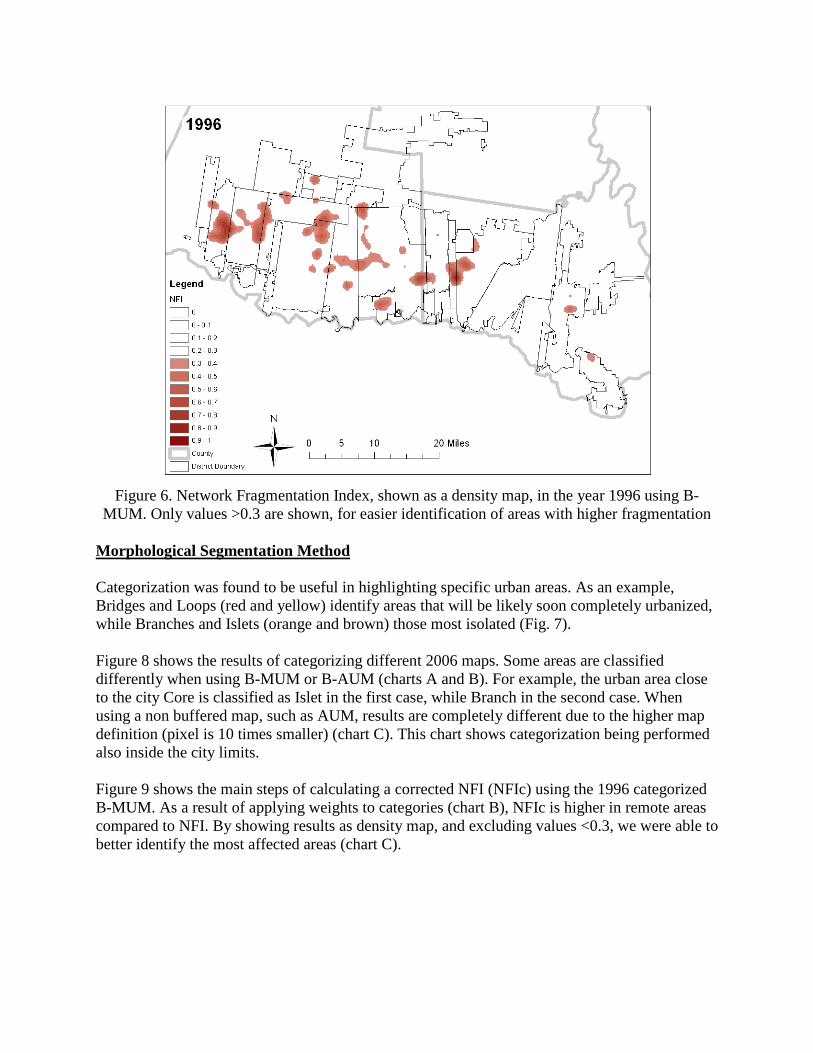
Figure 6. Network Fragmentation Index, shown as a density map, in the year 1996 using B-
MUM. Only values >0.3 are shown, for easier identification of areas with higher fragmentation
Morphological Segmentation Method Categorization was found to be useful in highlighting specific urban areas. As an example, Bridges and Loops (red and yellow) identify areas that will be likely soon completely urbanized, while Branches and Islets (orange and brown) those most isolated (Fig. 7). Figure 8 shows the results of categorizing different 2006 maps. Some areas are classified differently when using B-MUM or B-AUM (charts A and B). For example, the urban area close to the city Core is classified as Islet in the first case, while Branch in the second case. When using a non buffered map, such as AUM, results are completely different due to the higher map definition (pixel is 10 times smaller) (chart C). This chart shows categorization being performed also inside the city limits. Figure 9 shows the main steps of calculating a corrected NFI (NFIc) using the 1996 categorized B-MUM. As a result of applying weights to categories (chart B), NFIc is higher in remote areas compared to NFI. By showing results as density map, and excluding values <0.3, we were able to better identify the most affected areas (chart C).
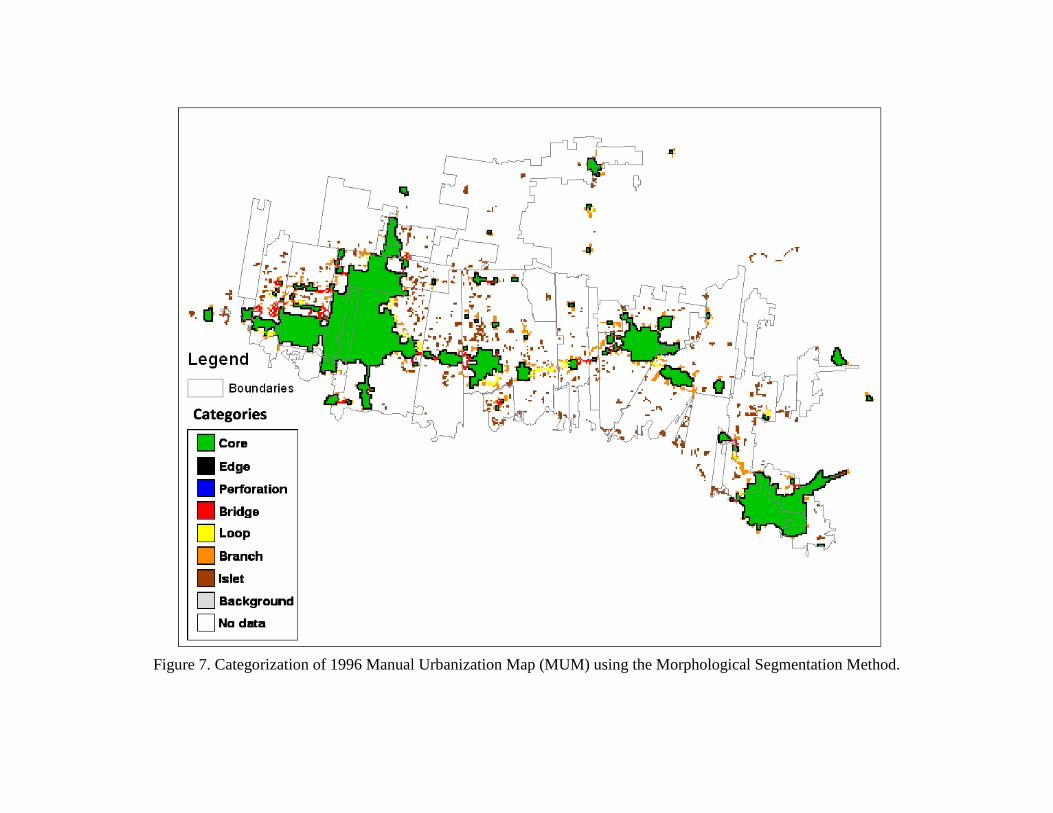
Figure 7. Categorization of 1996 Manual Urbanization Map (MUM) using the Morphological Segmentation Method.
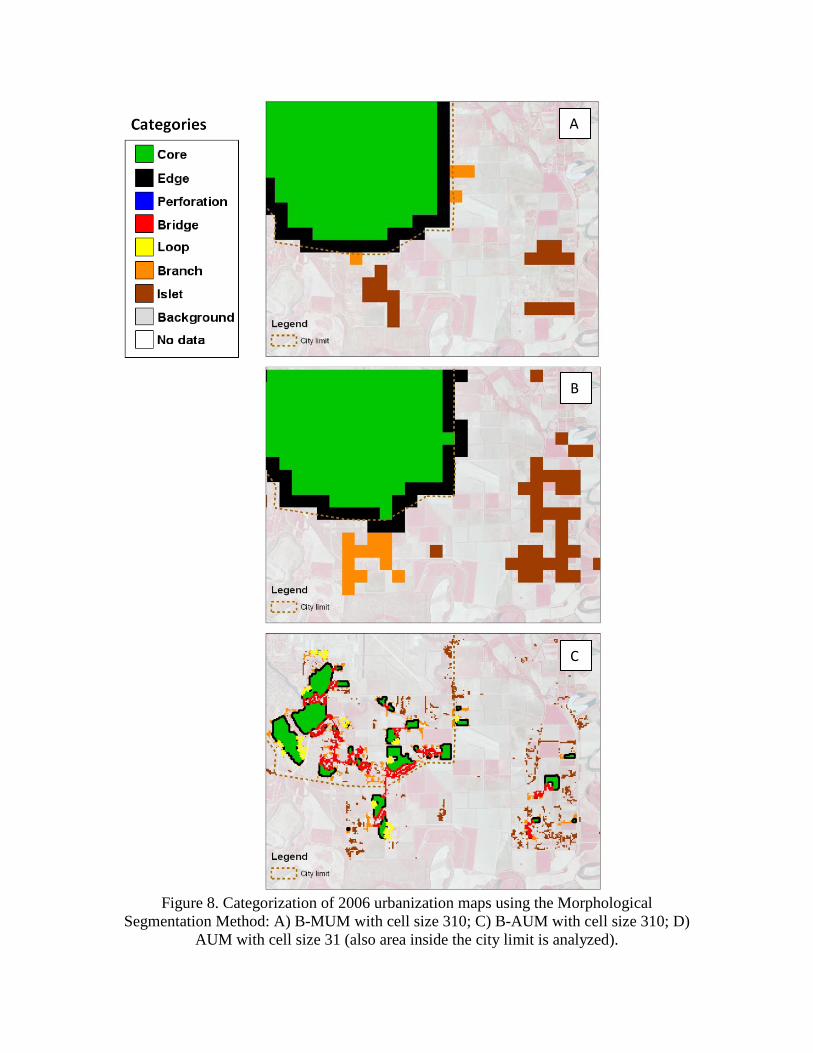
Figure 8. Categorization of 2006 urbanization maps using the Morphological
Segmentation Method: A) B-MUM with cell size 310; C) B-AUM with cell size 310; D) AUM with cell size 31 (also area inside the city limit is analyzed).
A
B
C
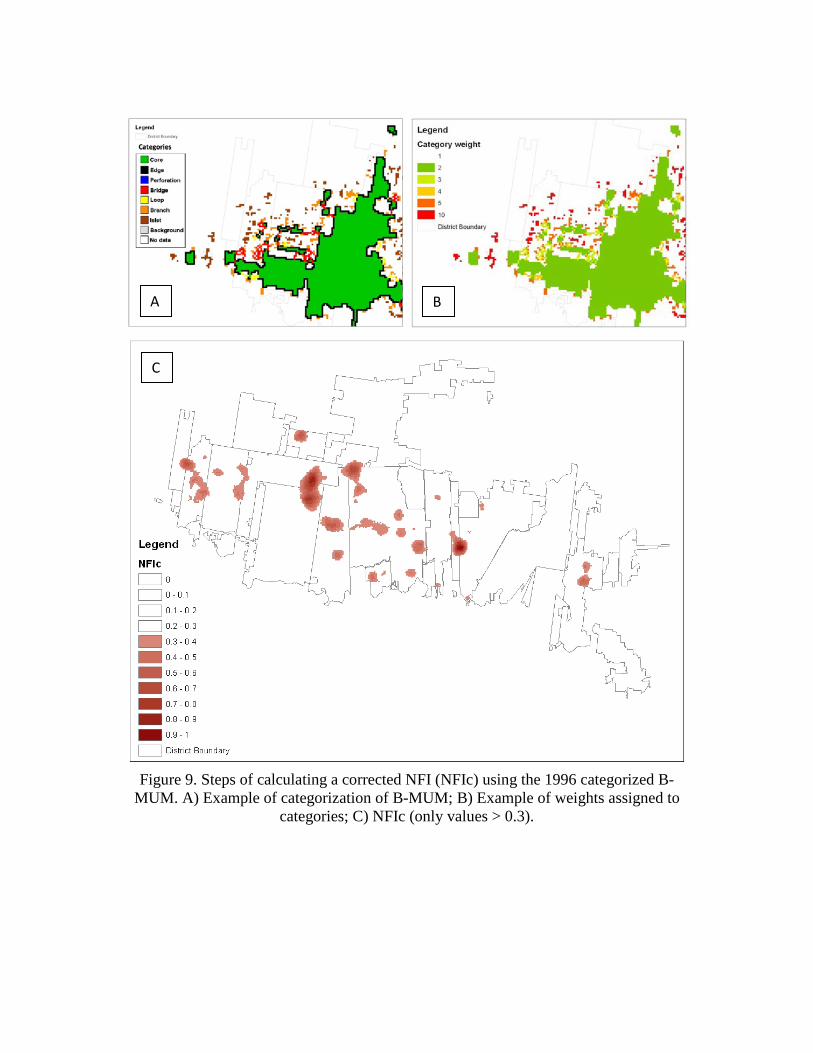
Figure 9. Steps of calculating a corrected NFI (NFIc) using the 1996 categorized B-
MUM. A) Example of categorization of B-MUM; B) Example of weights assigned to categories; C) NFIc (only values > 0.3).
C
B A
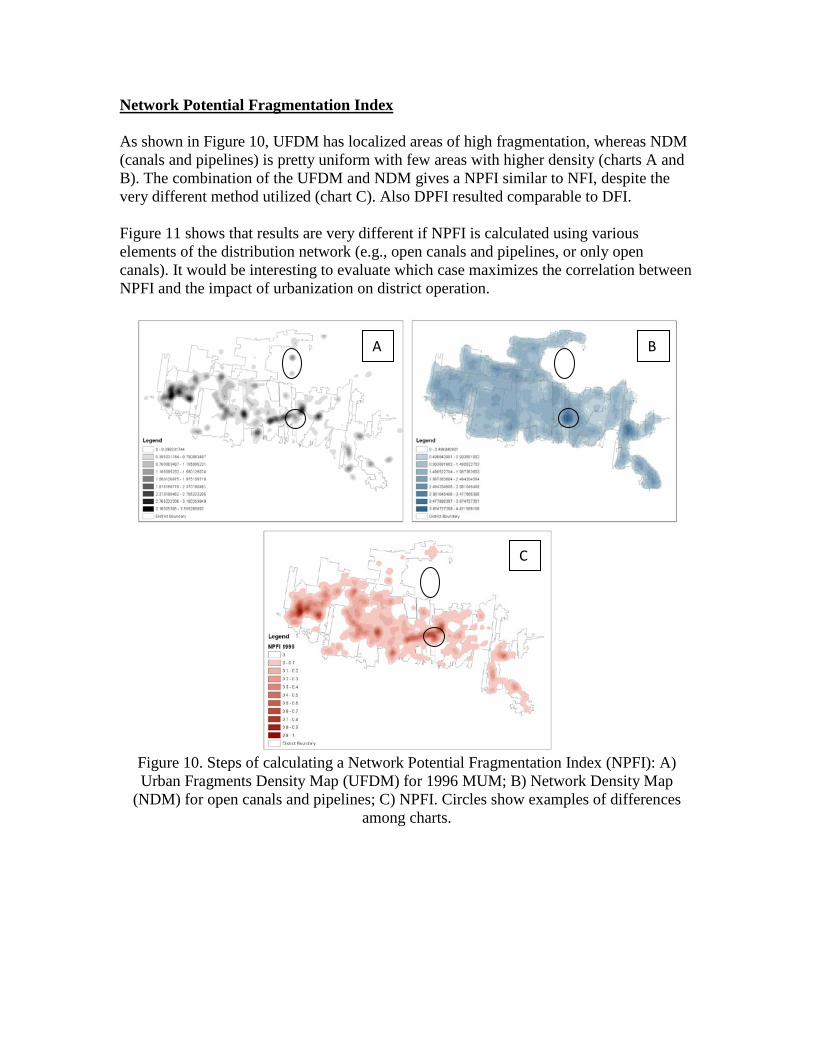
Network Potential Fragmentation Index As shown in Figure 10, UFDM has localized areas of high fragmentation, whereas NDM (canals and pipelines) is pretty uniform with few areas with higher density (charts A and B). The combination of the UFDM and NDM gives a NPFI similar to NFI, despite the very different method utilized (chart C). Also DPFI resulted comparable to DFI. Figure 11 shows that results are very different if NPFI is calculated using various elements of the distribution network (e.g., open canals and pipelines, or only open canals). It would be interesting to evaluate which case maximizes the correlation between NPFI and the impact of urbanization on district operation.
Figure 10. Steps of calculating a Network Potential Fragmentation Index (NPFI): A) Urban Fragments Density Map (UFDM) for 1996 MUM; B) Network Density Map
(NDM) for open canals and pipelines; C) NPFI. Circles show examples of differences among charts.
A B
C
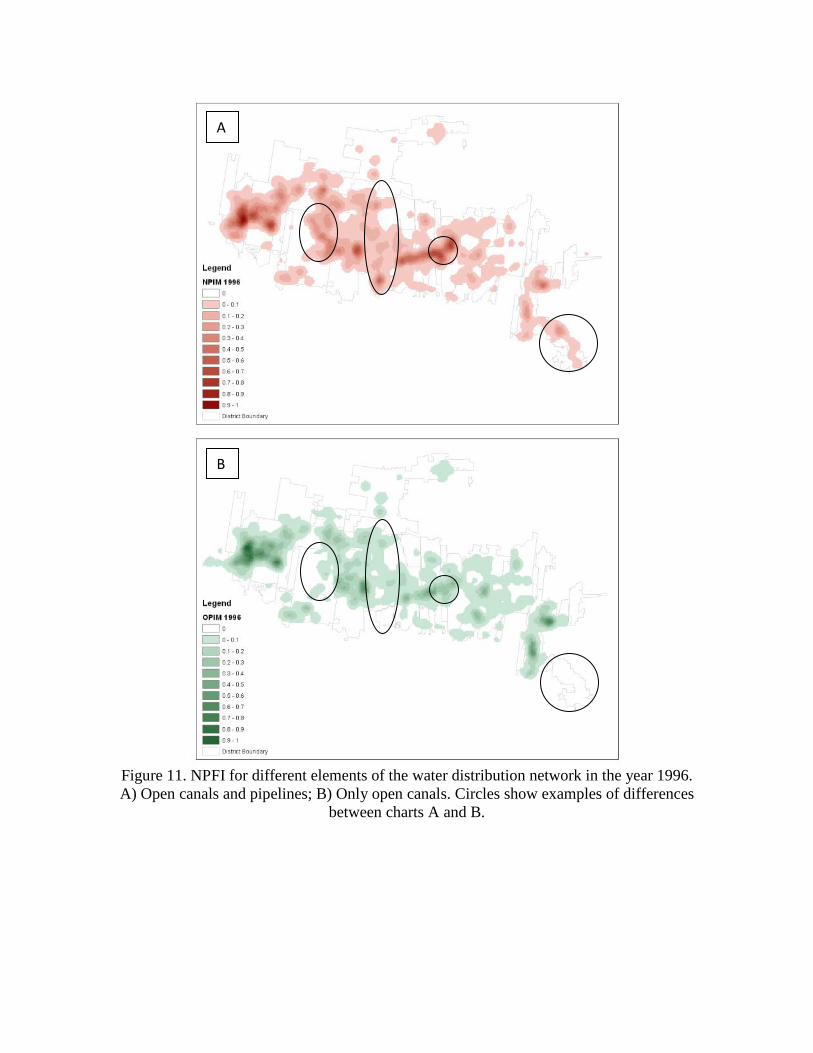
Figure 11. NPFI for different elements of the water distribution network in the year 1996. A) Open canals and pipelines; B) Only open canals. Circles show examples of differences
between charts A and B.
A
B

CONCLUSIONS Methodologies were presented to interpret the fast urban growth dynamics in the Lower Rio Grande Valley of Texas. The two methodologies proposed for urban areas identification, manual and automatic, gave good results, both being able to accurately identify urbanization. Although a test on a larger area would be beneficial, results showed that Automatic Urbanization Maps can replace Manual Urbanization Maps, as the image processing phase is less time consuming. We can estimate that while the manual procedure required weeks of processing, the automatic one took only few days. The use of synthetic indexes helped identify areas where the water distribution network is impacted by urbanization. Although highest values of Network Fragmentation Index were located in different areas when calculated from Manual and Automatic Urbanization Maps, the major areas of fragmentations are identified with both maps. Interpretation of urban fragmentation dynamics was improved by using categories defining the type of urbanization. By assigning weights to such categories, we obtained a corrected Network Fragmentation Index. The set up of a simplified procedure to calculate impact of urbanization (Network Potential Fragmentation Index) showed potential for application, even if analysis was based on probability of fragmentation rather than observations. Recommendations for future work include:
• Identify correlation between analysis results and observed impact on district operation, especially when applying weights to urbanization categories
• Identify which elements of the distribution network have more impact on district operation when fragmented (i.e. open canals, pipelines)
• Further evaluate the advantages in term of computation of automatic analysis
ACKNOWLEDGEMENTS This material is based upon work supported by the Cooperative State Research, Education, and Extension Service, U.S. Department of Agriculture, under Agreement No. 2008‐45049‐04328 and Agreement No. 2008‐34461‐19061. For program information, see http://riogrande.tamu.edu.
Martin Barroso Jr., former GIS Specialist. Eric Leigh, former Extension Associate. Simone Rinaldo, applied eCognition software to aerial photographs.
REFERENCES Bonaiti, G., Fipps, G., 2011. Urbanization of Irrigation Districts in The Texas Rio Grande River Basin. Proceedings of the 2011 USCID Water Management Conference, Emerging Challenges and Opportunities for Irrigation Managers - Energy, Efficiency and Infrastructure, April 26-29, Albuquerque, New Mexico. Gooch, R.S., 2009. Special issue on urbanization of irrigation systems. Irrig. Drainage Syst. 23:61–62. DOI 10.1007/s10795-009-9080-z Gooch, R.S., Anderson, S.S. (Eds.), 2008. Urbanization of Irrigated Land and Water Transfers. A USCID Water Management Conference, Scottsdale, Arizona, May 28-31, U.S. Committee on Irrigation and Drainage. GUIDOS Online, 2008. On-line at: http://forest.jrc.ec.europa.eu/download/software/guidos/ (accessed October 2011) Lambert S., 2011. Personal communication, March 31, 1PM, Cameron County Irrigation District No2 premises. Pakhale, G.K., Gupta, P.K., 2010. Comparison of Advanced Pixel Based (ANN and SVM) and Object-Oriented Classification Approaches Using Landsat-7 Etm+ Data. International Journal of Engineering and Technology, Vol.2 (4), 245-251. Rio Grande Regional Water Planning Group (Rio Grande RWPG), 2010. Region M Water Plan, http://www.riograndewaterplan.org/waterplan.php Ritters, K., Wickham, J., O'Neill, R., Jones, B., Smith, E., 2000. Global-scale patterns of forest fragmentation. Conservation Ecology 4(2): 3. [online] URL: http://www.consecol.org/vol4/iss2/art3/ Soille, P., Vogt, P., 2009. Morphological segmentation of binary patterns, Pattern Recognition Letters 30 (2009) 456–459, doi:10.1016/j.patrec.2008.10.015 Texas Water Development Board, 2012. Water for Texas State 2012 Water Plan (draft), http://www.twdb.state.tx.us/wrpi/swp/draft.asp Vogt, P., 2010. MSPA GUIDE. Institute for Environment and Sustainability (IES), European Commission, Joint Research Centre (JRC), TP 261, I-21027 Ispra (VA), Italy, Release: Version 1.3, February 2010. Vogt, P., Riitters, K.H., Estreguil, C., Kozak, J., Wade, T.G., Wickham, J.D., 2007. Mapping spatial patterns with morphological image. Landscape Ecol 22:171–177, doi:10.1007/s10980-006-9013-2