method 551 determination of chlorination … · determination of chlorination disinfection...
TRANSCRIPT
551-1
METHOD 551
DETERMINATION OF CHLORINATION DISINFECTION BYPRODUCTS ANDCHLORINATED SOLVENTS IN DRINKING WATER BY LIQUID-LIQUID
EXTRACTION AND GAS CHROMATOGRAPHY WITHELECTRON-CAPTURE DETECTION
July 1990
J.W. HodgesonA.L. Cohen
ENVIRONMENTAL MONITORING SYSTEMS LABORATORYOFFICE OF RESEARCH AND DEVELOPMENT
U.S. ENVIRONMENTAL PROTECTION AGENCYCINCINNATI, OHIO 45268
551-2
METHOD 551
DETERMINATION OF CHLORINATION DISINFECTION BYPRODUCTS ANDCHLORINATED SOLVENTS IN DRINKING WATER BY LIQUID-LIQUID
EXTRACTION AND GAS CHROMATOGRAPHY WITHELECTRON-CAPTURE DETECTION
1.0 SCOPE AND APPLICATION
1.1 This method is applicable to the determination of the following analytes in1-4
finished drinking water, drinking water during intermediate stages oftreatment, and raw source water:
Analyte Registry NumberChemical Abstract Services
Bromochloroacetonitrile 83463-62-1Bromodichloromethane 75-27-4Bromoform 75-25-2Carbon Tetrachloride 56-23-5Chloral Hydrate 75-87-6Chloroform 67-66-3Chloropicrin 76-06-2Dibromoacetonitrile 3252-43-5Dibromochloromethane 124-48-11,2-Dibromo-3-chloropropane [DBCP] 96-12-81,2-Dibromoethane [EDB] 106-93-4Dichloroacetonitrile 3018-12-0Trichloroacetonitrile 545-06-2Tetrachloroethylene 127-18-41,1,1-Trichloroethane 71-55-6Trichloroethylene 79-01-61,1,1-Trichloro-2-propanone 918-00-31,1-Dichloro-2-propanone 513-88-2
1.2 This analyte list includes 12 commonly observed chlorination disinfectionbyproducts and six commonly used chlorinated organic solvents - carbon3,4
tetrachloride, 1,2-dibromo-3-chloropropane (DBCP), 1,2-dibromoethane (EDB),tetrachloroethylene, 1,1,1-tri-chloroethane and trichloroethylene.
1.3 This method is intended as a stand-alone procedure for the analysis of only thetrihalomethanes (THMs) or as a procedure for the total analyte list. Thedechlorination/preservation technique presented in Section 8.0 differs for thetwo modes of operation, with a simpler technique available for the THManalysis. The six solvents may be analyzed in the THM mode, since the samedechlorination reagents may be employed.
551-3
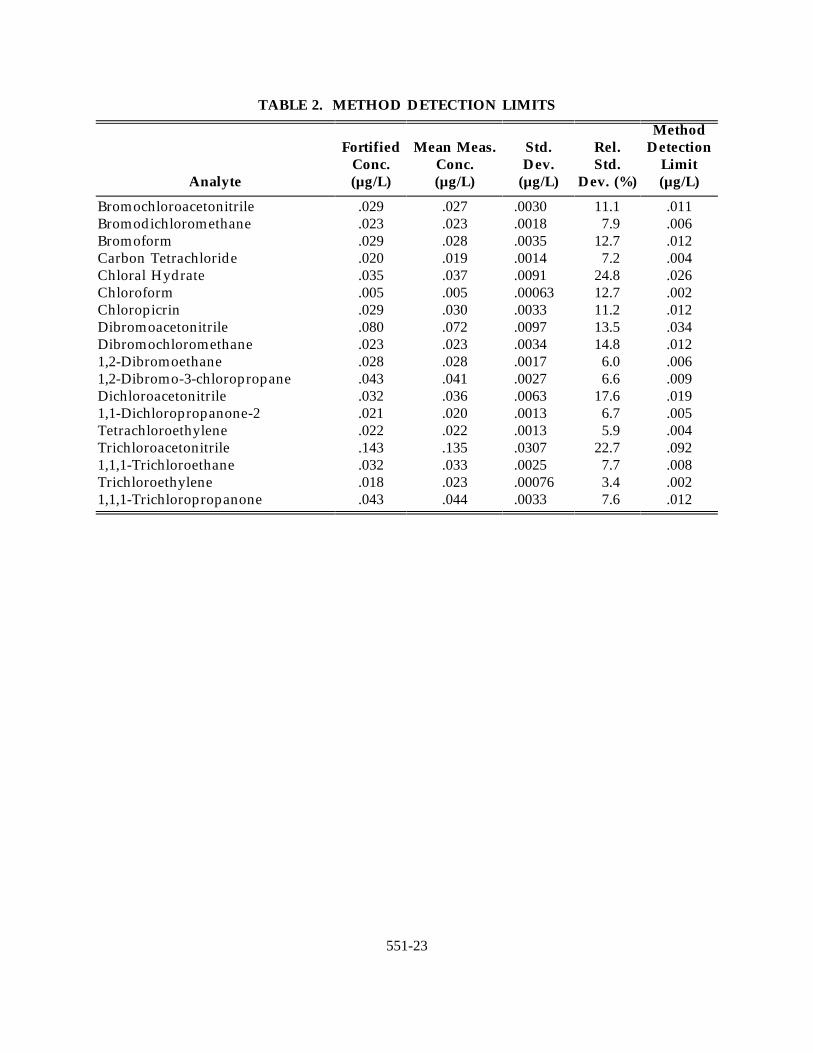
1.4 The experimentally determined method detection limits (MDLs) for the above5
listed analytes are provided in Table 2. Actual MDL values will varyaccording to the particular matrix analyzed and the specific instrumentationemployed.
2.0 SUMMARY OF METHOD
2.1 A 35 mL sample aliquot is extracted with 2 mL of methyl-tert-butyl ether(MTBE). Two µL of the extract is then injected into a GC equipped with afused silica capillary column and linearized electron capture detector forseparation and analysis. Aqueous calibration standards are also extracted andanalyzed in order to compensate for any extraction losses. A typical samplecan be extracted and analyzed in 40-50 minutes using the primary columnchosen for this method (Section 6.8.2.1). Confirmation of the elutedcompounds may be obtained using a dissimilar column (Section 6.8.2.2) or bythe use of GC-MS.
3.0 DEFINITIONS
3.1 Internal Standard -- A pure analyte(s) added to a solution in known amount(s)and used to measure the relative responses of other method analytes andsurrogates that are components of the same solution. The internal standardmust be an analyte that is not a sample component.
3.2 Surrogate Analyte -- A pure analyte(s), which is extremely unlikely to befound in any sample, and which is added to a sample aliquot in knownamount(s) before extraction and is measured with the same procedures used tomeasure other sample components. The purpose of a surrogate analyte is tomonitor method performance with each sample.
3.3 Laboratory Duplicates (LD1 and LD2) -- Two sample aliquots taken in theanalytical laboratory and analyzed separately with identical procedures. Analyses of LD1 and LD2 give a measure of the precision associated withlaboratory procedures, but not with sample collec-tion, preservation, or storageprocedures.
3.4 Field Duplicates (FD1 and FD2) -- Two separate samples collected at the sametime and place under identical circumstances and treated exactly the samethroughout field and laboratory procedures. Analyses of FD1 and FD2 give ameasure of the precision associated with sample collection, preservation andstorage, as well as with laboratory procedures.
3.5 Laboratory Reagent Blank (LRB) -- An aliquot of reagent water that is treatedexactly as a sample including exposure to all glassware, equipment, solvents,reagents, internal standards, and surrogates that are used with other samples. The LRB is used to determine if method analytes or other interferences arepresent in the labora-tory environment, the reagents, or the apparatus.
551-4
3.6 Field Reagent Blank (FRB) -- Reagent water placed in a sample con-tainer inthe laboratory and treated as a sample in all respects, including exposure tosampling site conditions, storage, preservation and all analytical procedures.The purpose of the FRB is to determine if method analytes or otherinterferences are present in the field environment.
3.7 Laboratory Fortified Blank (LFB) -- An aliquot of reagent water to whichknown quantities of the method analytes are added in the laboratory. The LFBis analyzed exactly like a sample, and its purpose is to determine whether themethodology is in control, and whether the laboratory is capable of makingaccurate and precise measurements at the required method detection limit.
3.8 Laboratory Fortified Sample Matrix (LFM) -- An aliquot of an envi-ronmentalsample to which known quantities of the method analytes are added in thelaboratory. The LFM is analyzed exactly like a sample, and its purpose is todetermine whether the sample matrix contributes bias to the analytical results.The background concen-trations of the analytes in the sample matrix must bedetermined in a separate aliquot and the measured values in the LFMcorrected for background concentrations.
3.9 Stock Standard Solution -- A concentrated solution containing a single certifiedstandard that is a method analyte, or a concentrated solution of a singleanalyte prepared in the laboratory with an assayed reference compound. Stockstandard solutions are used to prepare primary dilution standards.
3.10 Primary Dilution Standard Solution -- A solution of several analytes preparedin the laboratory from stock standard solutions and diluted as needed toprepare calibration solutions and other needed analyte solutions.
3.11 Calibration Standard (CAL) -- a solution prepared from the primary dilutionstandard solution and stock standard solutions of the internal standards andsurrogate analytes. The CAL solutions are used to calibrate the instrumentresponse with respect to analyte concentration.
3.12 Quality Control Sample (QCS) -- a sample matrix containing method analytesor a solution of method analytes in a water miscible solvent which is used tofortify reagent water or environmental samples. The QCS is obtained from asource external to the laboratory, and is used to check laboratory performancewith externally prepared test materials.
4.0 INTERFERENCES
4.1 Impurities contained in the extracting solvent usually account for the majorityof the analytical problems. Solvent blanks should be analyzed for each newbottle of solvent before use. An interference-free solvent is a solventcontaining no peaks yielding data at greater than or equal to the MDL(Table 2) and at the retention times of the analytes of interest. Indirect dailychecks on the extracting solvent are obtained by monitoring the laboratory
551-5
reagent blanks (Section 10.2). Whenever an interference is noted in the sampleblank, the analyst should analyze another solvent blank. Low levelinterferences generally can be removed by distillation or columnchromatography .2
4.2 Commercial lots of the MTBE extraction solvent often contain observableamounts of chlorinated solvent impurities, e.g., chloroform, trichloroethylene,carbon tetrachloride. When present, these impurities can normally be removedby a double distillation of the MTBE.
4.3 This liquid/liquid extraction technique efficiently extracts a wide boiling rangeof non-polar and polar organic components of the sample. Thus, confirmationis quite important, particularly at lower analyte concentrations. Aconfirmatory column (Section 6.8.2.2) is provided for this purpose. Alternatively, a more powerful technique is confirmation by GC-MS.
5.0 SAFETY
5.1 The toxicity and carcinogenicity of chemicals used in this method have notbeen precisely defined; each chemical should be treated as a potential healthhazard, and exposure to these chemicals should be minimized. Eachlaboratory is responsible for maintaining awareness of OSHA regulationsregarding safe handling of chemicals used in this method. Additionalreferences to laboratory safety are available for the information of the6-8
analyst.
5.2 The following have been tentatively classified as known or suspected humanor mammalian carcinogens:
Chloroform, 1,2-Dibromo-3-chloropropane, 1,2-Dibromoethane.
5.3 The toxicity of the extraction solvent, MTBE, has not been well defined. Susceptible individuals may experience adverse affects upon skin contact orinhalation of vapors. Therefore, protective clothing and gloves should be usedand MTBE should be used only in a chemical fume hood or glove box. Thesame precaution applies to pure standard materials.
6.0 APPARATUS AND EQUIPMENT (All specifications in Sections 6.0 and 7.0 aresuggested. Catalog numbers are included for illustration only.)
6.1 Sample Containers -- 40 mL screw cap vials (Pierce #13075) or equivalent eachequipped with a PTFE-faced silicone septum (Pierce #12722, Fisher TFE-lined#02-883-3F or equivalent).
NOTE: Some commercial 40 mL vials do not have adequate volume when saltis added. (See Section 11.1.4). Prior to use, wash vials and septa withdetergent and rinse with tap water, followed by distilled water. Allow thevials and septa to dry at room temperature, place the vials in an oven and heat
551-6
to 400°C for 30 minutes. After removal from the oven allow the vials to coolin an area known to be free of organics.
6.2 Vials -- Autosampler, screw cap with septa, 1.8 mL, Varian #96-000099-00 orequivalent.
6.3 Micro Syringes -- 10 µL, 25 µL, 50 µL, 100 µL, and 250 µL.
6.4 Pipettes -- 2.0 mL transfer, glass.
6.5 Volumetric Flask -- 10 mL, 100 mL, and 250 mL, glass stoppered.
6.6 Disposable Pasteur Pipets -- Kimble No. 72050575 or equivalent.
6.7 Standard Solution Storage Containers -- 15 mL Boston round, amber glassbottles with TFE-lined caps. Wheaton Cat. No. 220092 or equivalent. TFE-lined caps must be purchased separately. Size 18-400, Fisher TFE-lined screwcap No. 02-883-3D or equivalent.
6.8 Gas Chromatography System
6.8.1 The GC must be capable of temperature programming and should beequipped with a linearized electron capture detector, fused silicacapillary column, and splitless injector (splitless mode, 30 seconddelay). An auto-sampler/injector is desirable.
6.8.2 Two GC columns are recommended. Column A should be used as theprimary analytical column unless routinely occurring analytes are notadequately resolved. Column B is recommended for use as aconfirmatory column when GC/MS confirmation is unavailable.
6.8.2.1 Column A -- 0.32 mm ID x 30 m fused silica capillary withchemically bonded methyl polysiloxane phase (DB-1, 1.0 µmfilm thickness or equivalent). The linear velocity of the heliumcarrier is established at 23 cm/sec at 35°C. The oven isprogrammed to hold at 35°C for nine minutes, to increase to40°C at 1°C/min, and held for three minutes, to increase to120°C at 6°C/min and held at 120° until all expectedcompounds have eluted. A temperature of 150°C is thenmaintained for five minutes. Injector temperature: 200°C. Detector temperature: 290°C (See Table 1 for retention timedata).
6.8.2.2 Column B -- 0.32 mm ID x 30 m with chemically bonded 50%trifluoropropyl phase (DB-210, SP-2401, 0.5 µm film thickness orequivalent). The linear velocity of the helium carrier gas isestablished at 27 cm/sec. The column temperature isprogrammed to hold at 30°C for 11 minutes, to increase to 120°C
551-7
at 10°C/min and held at 120°C until all expected compoundshave eluted. A temperature of 150°C is then maintained forfive minutes. (See Table 1 for retention data).
6.9 pH Meter -- Capable of accurate measurement of pH (±0.2 units) in the range,pH = 4-8. For laboratory or field measurement of sample pH.
6.10 pH Paper -- Narrow ranges, pH = 3-5.5 and pH = 6.0-8.0. For measurement ofinitial and adjusted sample pH in the field.
7.0 REAGENTS AND CONSUMABLE MATERIALS
7.1 Reagents
7.1.1 MTBE -- High purity grade, It may be necessary to double distill thesolvent if impurities are observed which coelute with some of the morevolatile compounds.
7.1.2 Acetone -- High purity, demonstrated to be free of analytes.
7.1.3 Sodium chloride, NaCl -- ACS reagent grade. Before use pulverize abatch of NaCl and place in muffle furnace, increase temperature to400°C and hold for 30 minutes. Store in a capped bottle.
7.2 Reagent Water -- Reagent water is defined as purified water which does notcontain any measurable quantities of the analyte or any other interferingspecies.
7.2.1 A Millipore Super-Q water system or its equivalent may be used togenerate deionized reagent water. Distilled water that has beencharcoal filtered may also be suitable.
7.2.2 Test reagent water each day it is used by analyzing according toSection 11.2.
7.3 Stock Standard Solutions -- These solutions may be obtained as certifiedsolutions or prepared from neat materials using the following procedures:
7.3.1 Prepare stock standard solutions (5 mg/mL) for the THM's and the sixsolvents by accurately weighing approximately 0.05 g of pure material. Dilute to volume with methanol in a 10 mL volumetric flask. Accuratestandards for the more volatile analytes may be prepared in thefollowing manner.
7.3.1.1 Place about 9.8 mL of methanol into a 10 mL ground-glassstoppered volumetric flask. Allow the flask to stand,unstoppered, for about 10 minutes and weigh to the nearest0.1 mg.
551-8
7.3.1.2 Use a 100 µL syringe and immediately add two or more dropsof standard material to the flask. Be sure that the standardmaterial falls directly into the alcohol without contacting theneck of the flask.
7.3.1.3 Reweigh, dilute to volume, stopper, then mix by inverting theflask several times. Calculate the concentration in microgramsper microliter from the net gain in weight.
7.3.2 Prepare stock standard solutions (5.0 mg/mL) for the eight remainingchlorination byproducts (Section 1.1) by accurately weighing about0.0500 g of pure material. Dissolve the material in acetone and diluteto volume in a 10 mL volumetric flask. Acetone is employed becausedecomposition has been observed during storage in methanol for thedihaloacetonitriles, chloropicrin and 1,1,1-trichloropropanone-2.
7.3.3 Larger volumes of standard solution may be prepared at the discretionof the analyst. When compound purity is assayed to be 96% or greater,the weight can be used without correction to calculate the concentrationof the stock standard. Commercially prepared stock standards can beused at any concentration if they are certified by the manufacturer orby an independent source.
7.3.4 Transfer the stock standard solutions into Teflon-lined screw cap amberbottles. Store at 4°C and protect from light. Stock standard solutionsshould be checked frequently for signs of degradation or evaporation,especially just prior to preparing calibration standards from them.
7.3.5 The stored THM stock standards in methanol are stable for up to sixmonths. The solvent standards in methanol are stable at least fourmonths. The other analytes stored in acetone are stable for at least fourmonths except for chloral hydrate. Initially, fresh chloral hydratestandards should be prepared weekly, until the stability of this analyteis determined.
7.4 Primary Dilution Standards -- Prepare primary dilution standards bycombining and diluting stock standards in methanol (THMs and solvents) oracetone (remaining disinfection byproducts). The primary dilution standardsshould be prepared at concentrations that can be easily diluted to prepareaqueous calibration standards (Section 9.1) that will bracket the workingconcentration range. Store the primary dilution standard solutions at 4°C withminimal headspace and check frequently for signs of deterioration orevaporation, especially just before preparing calibration standards. The samecomments on storage stability in Section 7.3.5 apply to primary dilutionstandards.
551-9
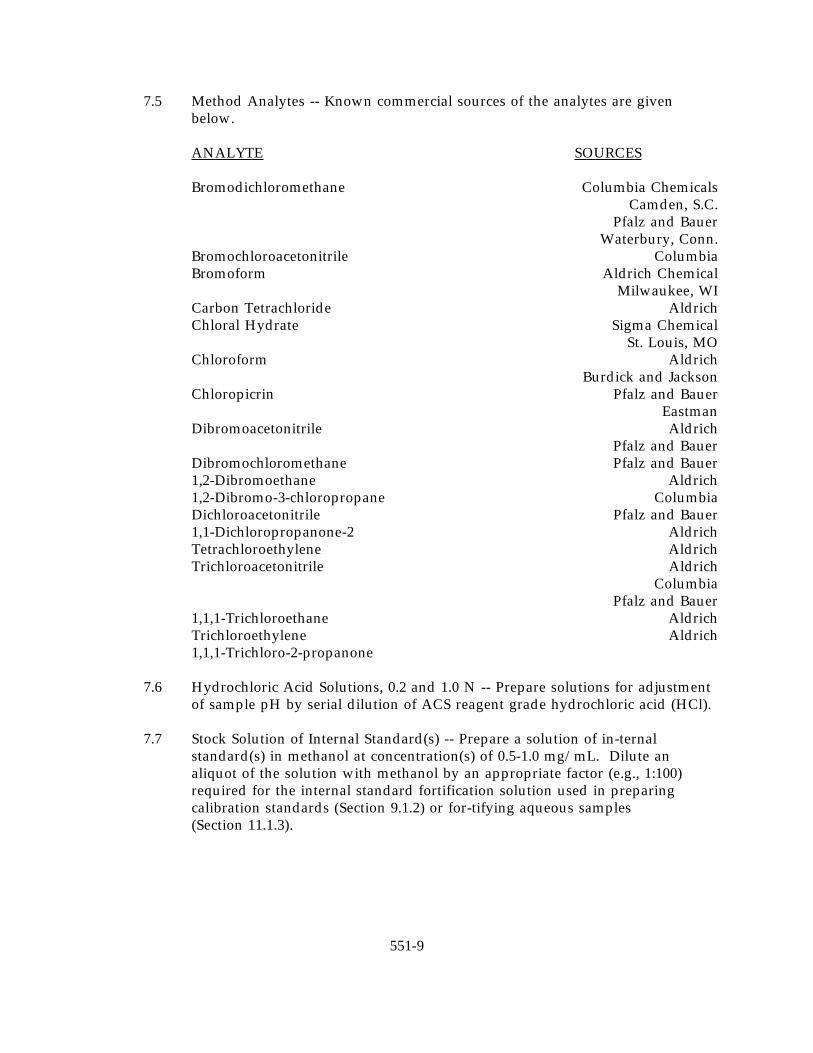
7.5 Method Analytes -- Known commercial sources of the analytes are givenbelow.
ANALYTE SOURCES
Bromodichloromethane Columbia ChemicalsCamden, S.C.
Pfalz and BauerWaterbury, Conn.
Bromochloroacetonitrile ColumbiaBromoform Aldrich Chemical
Milwaukee, WICarbon Tetrachloride AldrichChloral Hydrate Sigma Chemical
St. Louis, MOChloroform Aldrich
Burdick and JacksonChloropicrin Pfalz and Bauer
EastmanDibromoacetonitrile Aldrich
Pfalz and BauerDibromochloromethane Pfalz and Bauer1,2-Dibromoethane Aldrich1,2-Dibromo-3-chloropropane ColumbiaDichloroacetonitrile Pfalz and Bauer1,1-Dichloropropanone-2 AldrichTetrachloroethylene AldrichTrichloroacetonitrile Aldrich
ColumbiaPfalz and Bauer
1,1,1-Trichloroethane AldrichTrichloroethylene Aldrich1,1,1-Trichloro-2-propanone
7.6 Hydrochloric Acid Solutions, 0.2 and 1.0 N -- Prepare solutions for adjustmentof sample pH by serial dilution of ACS reagent grade hydrochloric acid (HCl).
7.7 Stock Solution of Internal Standard(s) -- Prepare a solution of in-ternalstandard(s) in methanol at concentration(s) of 0.5-1.0 mg/mL. Dilute analiquot of the solution with methanol by an appropriate factor (e.g., 1:100)required for the internal standard fortification solution used in preparingcalibration standards (Section 9.1.2) or for-tifying aqueous samples(Section 11.1.3).
551-10
8.0 SAMPLE COLLECTION, PRESERVATION, AND STORAGE
8.1 Sample Collection, Dechlorination, and Preservation
8.1.1 The analyte list of Section 1.1 may be conveniently divided into threeclasses: the four THM's, the six halogenated solvents (Section 1.2) andthe eight remaining organic disinfection by-products. The halogenatedsolvents are quite stable compounds by design and stability uponstorage after collec-tion is not an issue. Likewise, the THM's arepreserved by the addition of any of the following commondechlorination reagents, sodium sulfite or thiosulfate, ascorbic acid andammonium chloride. If the sample assay is only for the THM's and/orsolvents, the acidification step in Section 8.1.3 should be omitted andonly dechlorination reagent added as specified in Section 8.1.2. Thiosulfate, sulfite and ascorbic acid promote the decomposition ofsome members of the third class of analytes, e.g., the dihaloacetonitrilesand chloropicrin, and may not be used as dechlorination reagents intheir analysis. In addition, many of these analytes require theacidification step in Section 8.1.3 for storage stability. Thus analysis forthe total analyte list requires the use of ammonium chloride fordechlorination and sample acidification.
NOTE: However, the possible exception of a separate samplingrequirement for chloral hydrate in Section 8.1.8.
8.1.2 Add the dechlorination reagent as the neat material to the 40 mLsample vials (Section 6.1) immediately before shipment to the field. The reagent amounts are 4 mg for sodium thiosulfate or sulfite andammonium chloride and 25 mg for ascorbic acid. Alternatively, for thefirst three reagents, 100 µL of a freshly prepared solution at aconcentration of 40 mg/mL may be added to the sample vial just beforesample collection (Section 8.1.4). Any of these reagents may be used forthe THM's, whereas ammonium chloride must be employed for thesimultan-eous measurement in a single sample of all the analytes listed(Section 1.1). As described in Section 8.1.8, the measurement of chloralhydrate may require the collection of a separate sample dechlorinatedwith sodium sulfite or ascorbic acid.
8.1.3 Adjustment of sample pH -- Prior to sample collection, the amount ofHCl required to reduce the sample pH to the range, 4.5-5.0 must bemeasured. Collect 40 mL samples and add to 100 mL beakerscontaining 10 mg ammonium chloride. Measure the initial pH with thenarrow range pH paper, 6.0-8.0 (Section 6.10), or a pH meter. Initially,adjust the sample pH to the range 4.5-5.0 with the 0.2 N HCl solutionby dropwise addition with a Pasteur pipet (Section 6.6). Measure thepH during addition with the narrow range pH paper, 3.0-5.5, or a pHmeter. If greater than 10 drops are required (ca. 0.1 mL), measure theamount of 1.0 N HCl solution required and use this amount for sample
551-11
acidification. Care should be exercised not to adjust the sample pHbelow the carbonic acid endpoint, pH ≈ 4.2. Below the endpoint, thepH will decrease rapidly with dropwise acid addition. Some of theanalytes may not be stable below pH = 4.0. Add the required volumeof HCl solution to the 40 mL sample vials (Section 6.1) immediatelybefore collection (Section 8.1.4).
8.1.4 Collect all samples in duplicate. Fill sample bottles to just overflowingbut take care not to flush out the dechlorination and preservationreagents. No air bubbles should pass through the sample as the bottleis filled, or be trapped in the sample when the bottle is sealed.
8.1.5 When sampling from a water tap, open the tap and allow the system toflush until the water temperature has stabilized (usually about10 minutes). Adjust the flow to about 500 mL/min and collectduplicate samples from the flowing stream.
8.1.6 When sampling from an open body of water, fill a 1 qt wide-mouthbottle or 1 L beaker with sample from a representative area, andcarefully fill duplicate sample vials from the 1 qt container.
8.1.7 The samples must be chilled to 4°C on the day of collection andmaintained at that temperature until analysis. Field samples that willnot be received at the laboratory on the day of collection must bepackaged for shipment with suffi-cient ice to ensure that they will be at4°C on arrival at the laboratory.
8.1.8 In some matrices dechlorinated with ammonium chloride, forti-fiedmatrix recoveries of chloral hydrate have been lower than expected by50% or greater, when compared to the same sample dechlorinated withascorbic acid or sodium sulfite. In other matrices, recoveries have beennormal. The reason for these differences has not been determined. Any analyst employing this method must demonstrate that ammoniumchloride is a suitable dechlorination agent for chloral hydrate in thematrix of concern by determining matrix recoveries as outlined inSection 10.6. If problems are encountered, a separate sample,dechlorinated with 100 mg/L sodium sulfite or 625 mg/L ascorbic acid,must be collected for the analysis of chloral hydrate. Limited field dataobtained to date have indicated better precision for chloral hydrateanalyses in samples dechlorinated with sodium sulfite than withascorbic acid.
8.2 Sample Storage
8.2.1 Store samples at 4°C until analysis. The sample storage area must befree of organic solvent vapors.
551-12
8.2.2 Analyze all samples within 14 days of collection. Samples not analyzedwithin this period must be discarded and replaced.
9.0 CALIBRATION
9.1 Preparation of Calibration Standards
9.1.1 At least three calibration standards are needed. One should contain theanalytes at a concentration near to but greater than the methoddetection limit (Table 2) for each compound; the other two shouldbracket the concentration range expected in samples. For example, ifthe MDL is 0.1 µg/L, and a sample expected to contain approximately1.0 µg/L is to be analyzed, aqueous standards should be prepared atconcentrations of 0.2 µg/L, 1.0 µg/L, and 2.0 µg/L.
9.1.2 To prepare a calibration standard, add an appropriate volume of aprimary dilution standard to a 35-mL aliquot of reagent water in a40 mL vial. Use a 25 µL micro syringe and rapidly inject the standardinto the middle point of the water volume. Remove the needle asquickly as possible after injection. If required (Section 9.3), add anappropriate volume of the internal standard fortification solution(Section 7.7) in the same manner. The aqueous concentration ofinternal standard(s) should yield area counts or peak heights equivalentto the medium to upper ranges of analyte concentrations. Mix byinverting the sample vial three times without shaking. Aqueousstandards must be prepared fresh daily and extracted immediately afterpreparation (Section 11.2).
9.1.3 Alternatively, add an appropriate volume of primary dilution standardand internal standard solution to reagent water in a 100 mL volumetricflask and fill to the mark. Mix by inverting three times as inSection 9.1.2. Weigh a 35 mL aliquot of this standard into aprecalibrated 40 mL vial.
9.2 External Standard Calibration Procedure
9.2.1 Extract and analyze each calibration standard according to Section 11.0and tabulate peak height or area response versus the concentration ofthe standard. The results are used to prepare a calibration curve foreach compound by plotting the peak height or area response versus theconcentration. Alternatively, if the ratio of response to concentration(response factor) is constant over the working range (≤10% relativestandard deviation, [RSD]), linearity to the origin can be assumed, andthe average ratio or response factor can be used in place of a calibrationcurve.
551-13
9.2.2 Single-point calibration is sometimes an acceptable alternative to acalibration curve. Prepare single point standards from the primarydilution standard solutions. The single point calibration standardshould be prepared at a concentration that produces a response close(±20%) to that of the unknowns.
9.3 Internal Standard (IS) Calibration Procedure -- To use this approach, theanalyst must select one or more internal standards that are similar in analyticalbehavior to the compounds of interest. The analyst must further demonstratethat the measurement of the internal standard is not affected by method ormatrix interferences. Specific internal standard are not recommended in thismethod. The method validation data reported in Section 13.0 were obtainedby the external calibration procedure.
9.3.1 Extract and analyze each calibration standard according to Section 11.0. Tabulate peak height or area responses against concentration for eachcompound and internal standard. Calculate response factor (RF) foreach compound using Equation 1.
Equation 1
where: A = Response for the analyte to be measured.s
A = Response for the internal standard.is
C = Concentration of the internal standard (µg/L).is
C = Concentration of the analyte to be measured (µg/L).s
If RF value over the working range is constant (<10% RSD), the RF canbe assumed to be invariant and the average RF can be used forcalculations. Alternatively, the results can be used to plot a calibrationcurve of response versus analyte ratios, A /A vs. C /C .s is s is
9.4 The working calibration curve, calibration factor, or RF must be verified oneach working day by the measurement of one or more calibration standards. If the response for any analyte varies from the predicted response by morethan ±20%, the test must be repeated using fresh calibration standard. If thefresh calibration standard also deviates by more ±20%, a new calibration curvemust be prepared for that compound.
9.4.1 Daily calibration requirements using the external standard calibrationprocedure are a minimum of two calibration check standards, one atthe beginning and one at the end of the analysis day. These checkstandards should be at two diff-erent concentration levels to verify thecalibration curve. For extended periods of analysis (greater thaneight hours), it is strongly recommended that check standards be
551-14
interspersed with samples at regular intervals during the course of theanalysis.
9.4.2 Minimum daily calibration requirements using the internal standardcalibration procedure consist of initial analyses of a calibration checkstandard followed by verification of the internal standard response ofeach sample applying criterian described in Section 10.4.
10.0 QUALITY CONTROL
10.1 Each laboratory that uses this method is required to operate a formal qualitycontrol (QC) program. Minimum QC requirements are initial demonstration oflaboratory capability, monitoring internal standard peak area or height in eachsample and blank, analysis of laboratory reagent blanks, laboratory fortifiedblanks, laboratory fortified sample matrices, and QC samples. Additionalquality control practices are recommended.
10.2 Laboratory Reagent Blanks (LRB) -- Before processing any samples, the analystmust analyze at least one LRB to demonstrate that all glass-ware and reagentinterferences are under control. In addition, each time a set of samples isextracted or reagents are changed, a LRB must be analyzed. If within theretention time window of any analyte (Section 11.3.5), the LRB produces apeak that would prevent the determination of that analyte, determine thesource of contamination and eliminate the interference before processingsamples.
10.3 Initial Demonstration of Capability
10.3.1 Select a representative fortified concentration for each of the targetanalytes. Concentrations near analyte levels in Table 4 arerecommended. Prepare a laboratory control (LC) sample concentrate inacetone or methanol 1000 times more concentrated than the selectedconcentration. The LC sample concentrate must be preparedindependently from the standards used to prepare the calibration curve(Section 9.1). With a syringe, add 100 µL of the LC sample concentrateto each of four to seven 100 mL aliquots of reagent water. Analyze thealiquots according to the method beginning in Section 11.0, but usecalibration curves based upon non-extracted standards as called for inSection 10.3.2.
10.3.2 Calculate the mean percent recovery (R) and the standard deviation ofthe recovery (S ). The recovery is determined as the ratio of ther
measured concentration to the actual fortified concentration. Themeasured concentration must be based upon absolute or non-extractedstandards, rather than the extracted aqueous standards called for inSection 9.2.1 or 9.3.1. Prepare absolute calibration curves by injectingknown standards in MTBE, which span the range of fortifiedconcentrations measured. For each analyte, the mean recovery value
551-15
must fall in the range of R ±30% or within R ±3Sr, if broader, using thevalues for R and S for reagent water in Table 4. The standard deviationshould be less than ±30% or 3S , whichever is larger. For thoser
compounds that meet these criteria, performance is consideredacceptable, and sample analysis may begin. For those compounds thatfail these criteria, this procedure must be repeated using a minimum offive fresh samples until satisfactory performance has beendemonstrated.
10.3.3 The initial demonstration of capability is used primarily to preclude alaboratory from analyzing unknown samples via a new, unfamiliarmethod prior to obtaining some experience with it. It is expected thatas laboratory personnel gain experience with this method, the quality ofdata will improve beyond those required here.
10.3.4 The analyst is permitted to modify GC columns, GC conditions, internalstandard or surrogate compounds. Each time such methodmodifications are made, the analyst must repeat the procedures inSection 10.3.1.
10.4 Assessing the Internal Standard
10.4.1 When using the internal standard calibration procedure, the analyst isexpected to monitor the IS response (peak area or peak height) of allsamples during each analysis day. The IS response for any samplechromatogram should not deviate from daily calibration standard's ISresponse by more than 30%.
10.4.2 If >30% deviation occurs with an individual extract, optimizeinstrument performance and inject a second aliquot of that extract.
10.4.2.1 If the reinjected aliquot produces an acceptable internalstandard response, report results for that aliquot.
10.4.2.2 If a deviation of greater than 30% is obtained for thereinjected extract, analysis of the samples should berepeated beginning with Section 11.0, provided thesample is still available. Otherwise, report resultsobtained from the reinjected extract, but annotate assuspect.
10.4.3 If consecutive samples fail the IS response acceptance criterion,immediately analyze a calibration check standard.
10.4.3.1 If the check standard provides a response factor (RF)within 20% of the predicted value, then followprocedures itemized in Section 10.4.2 for each samplefailing the IS response criterion.
551-16
10.4.3.2 If the check standard provides a response factor whichdeviates more than 20% of the predicted value, then theanalyst must recalibrate, as specified in Section 9.0.
10.5 Laboratory Fortified Blank (LFB)
10.5.1 The laboratory must analyze at least one LFB sample with every20 samples or one per sample set (all samples extracted within a24-hour period), whichever is greater. Fortified concentrations nearthose in Table 4 are recommended. The LFB sample must be preparedfrom a standard mix, which is prepared separately and independentlyfrom the standards used to prepare the calibration curve. Calculate themean accuracy (R), based upon extracted standards as called for inSections 9.2.1 and 9.3.1. If the accuracy for any analyte falls outside thecontrol limits (see Section 10.5.2), that analyte is judged out of control,and the source of the problem should be identified and resolved beforecontinuing analyses.
10.5.2 Prepare control charts based on mean upper and lower control limits,R ±3 S , from accuracy and precision data collected over a period ofr
time. The initial demonstration of capability (Section 10.3) may be usedto estimate the initial limits, after correction of recovery data to anaccuracy basis. After each four to six new accuracy measurements,recalculate R and S using all the data, and construct new control limits. r
When the total number of data points reach 20, update the controllimits by calculating R and S using only the most recent 20 data points. r
At least quarterly, replicates of LFBs should be analyzed to determinethe precision of the laboratory measurements. Add these results to theongoing control charts to document data quality.
10.6 Laboratory Fortified Sample Matrix
10.6.1 The laboratory must add known fortified concentrations of analytes to aminimum of 10% of the routine samples or one fortified sample persample set, whichever is greater. The concentrations should be equal toor greater than the background concentrations in the sample selectedfor fortification. Ideally, the concentration should be the same as thatused for the laboratory fortified blank (Section 10.5). Over time,samples from all routine sample sources should be fortified.
10.6.2 Calculate the mean percent accuracy, R, of the concentration for eachanalyte, after correcting the total mean measured concentration, A, fromthe fortified sample for the back-ground concentration, B, measured inthe unfortified sample, i.e.:
R = 100 (A - B) / C,
551-17
where C is the fortifying concentration. Compare these values tocontrol limits appropriate for reagent water data collected in the samefashion (Section 10.5).
10.6.3 If the analysis of the unfortified sample reveals the absence ofmeasurable background concentrations, and the added concentrationsare those specified in Section 10.5, then the appropriate control limitswould be the acceptance limits in Section 10.5.
10.6.4 If the sample contains measurable background concentrations ofanalytes, calculate mean accuracy of the fortified con-centration, R, foreach such analyte after correcting for the background concentration.
R = 100 (A - B)/C
Compare these values to reagent water accuracy data, R*, atcomparable fortified concentrations from Tables 3-5. Results areconsidered comparable if the measured accuracies fall within the range,
R* ±3S ,c
where S is the estimated percent relative standard devi-ation in thec
measurement of the fortified concentration. By contrast to themeasurement of accuracies in reagent water (Section 10.5.2) or matrixsamples without background (Section 10.6.3), the relative standarddeviation, S , must be expressed as the statistical sum of variation fromc
two sources, the measurement of the total concentration as well as themeasurement of background concentration. In this case, variancesdefined as S , are additive and S can be expressed as2
c
S = S + Sc a b2 2 2
or S = (S + S ) ,c a b2 2 1/2
where S and S are the percent relative standard deviations of the totala b
measured concentration and the background concentration respectively. The value of S may be esti-mated from the mean measurement of Aa
above or from data at comparable concentrations from Tables 3-5. Likewise, S can be measured from repetitive measurements of theb
background concentration or estimated from comparable concentrationdata from Tables 3-5.
10.6.5 If the accuracy of any such analyte falls outside the designated range,and the laboratory performance for that analyte is shown to be incontrol (Section 10.5), the accuracy problem encountered with thefortified sample is judged to be matrix related, not system related. Theresult for that analyte in the unfortified sample is labeled
551-18
suspect/matrix to inform the data user that the results are suspect dueto matrix effects.
10.7 Quality Control Sample (QCS) -- At least quarterly, analyze a QCS from anexternal source. If measured analyte concentrations are not of acceptableaccuracy, check the entire analytical procedure to locate and correct theproblem source.
10.8 The laboratory may adapt additional quality control practices for use with thismethod. The specific practices that are most productive depend upon theneeds of the laboratory and the nature of the samples. For example, field orlaboratory duplicates may be analyzed to assess the precision of theenvironmental measurements or field reagent blanks may be used to assesscontamination of samples under site conditions, transportation and storage.
11.0 PROCEDURE
11.1 Sample Preparation
11.1.1 Remove samples from storage and allow them to equilibrate to roomtemperature.
11.1.2 Remove the vial caps. Discard a 5 mL volume of the sample. Replacethe vial caps and weigh the containers with contents to the nearest0.1 g and record these weights for subsequent sample volumedetermination. (See Section 11.2.4 for continuation of weighing andcalculation of true volume). Alternatively, the sample vials may beprecalibrated by weighing in 35 mL of water and scoring the meniscuson the bottle. This will eliminate the gravimetric step above and inSection 11.2.4.
11.1.3 Inject an aliquot of the internal standard fortification solution(Section 7.7) into the sample. The aqueous concentration of internalstandard(s) must be the same as that used in preparing calibrationstandards (Section 9.1.2).
11.1.4 Remove the vial cap of each sample and add 8 g NaCl (Section 7.1.3) tothe sample vial. Recap and dissolve the NaCl by inverting and shakingthe vial vigorously (approximately 20 seconds).
11.2 Sample Extraction
11.2.1 Remove the vial cap and add 2 mL of MTBE with a transfer orautomatic dispensing pipet. Recap and shake by hand for one minute. Invert the vial and allow the water and MTBE phases to separate(approximately two minutes).
551-19
11.2.2 By using a disposable Pasteur pipet (Section 6.6), transfer a portion ofthe solvent phase from the 40 mL vial to an autosampler vial. Becertain no water has carried over onto the bottom of the autosamplervial. If a dual phase appears in the autosampler vial, the bottom layercan be easily removed and discarded by using a Pasteur pipet. Theremaining MTBE phase may be transferred to a second autosamplervial for a subsequent analysis. Approximately 1.5 mL of the solventphase can be conveniently transferred from the original 2 mL volume.
11.2.3 Discard the remaining contents of the sample vial. Shake off the lastfew drops with short, brisk wrist movements.
11.2.4 Reweigh the empty vial with the original cap and calculate the netweight of sample by difference to the nearest 0.1 g (Section 11.1.2minus Section 11.2.4). This net weight (in grams) is equivalent to thevolume of water (in mL) extracted, V .s
11.2.5 The sample extract may be stored at 4°C for a maximum of seven daysbefore chromatographic analysis if required.
11.3 Sample Analysis and Identification
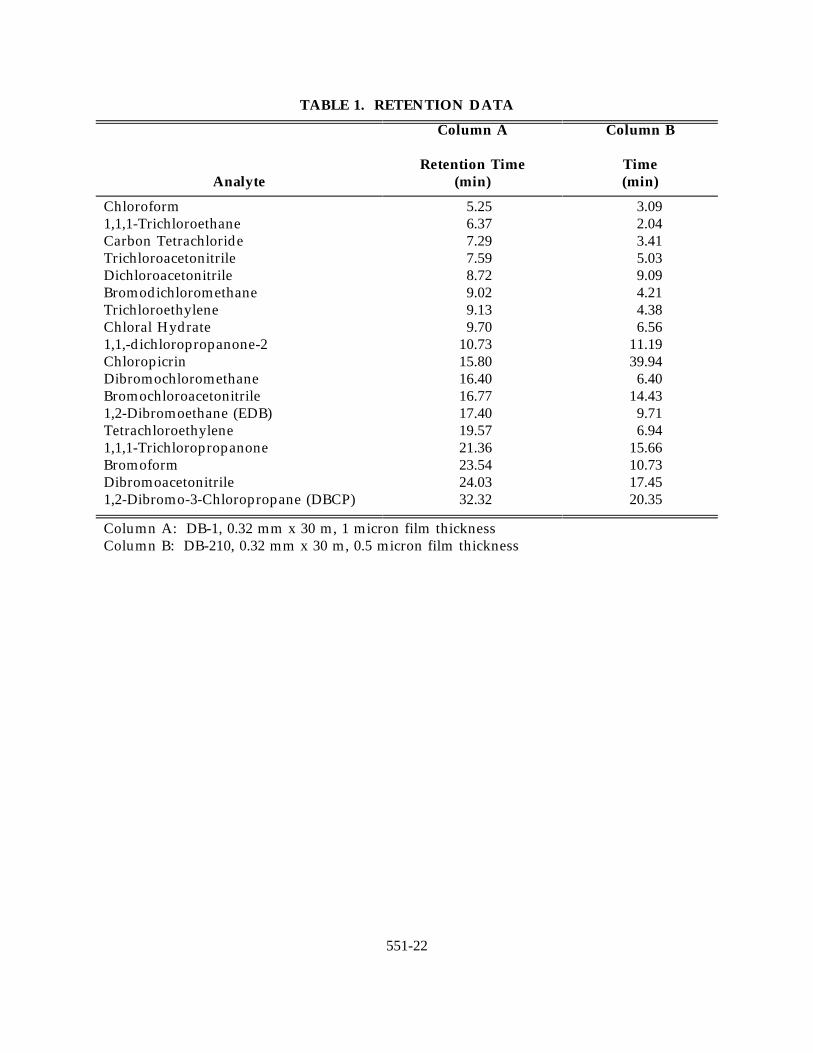
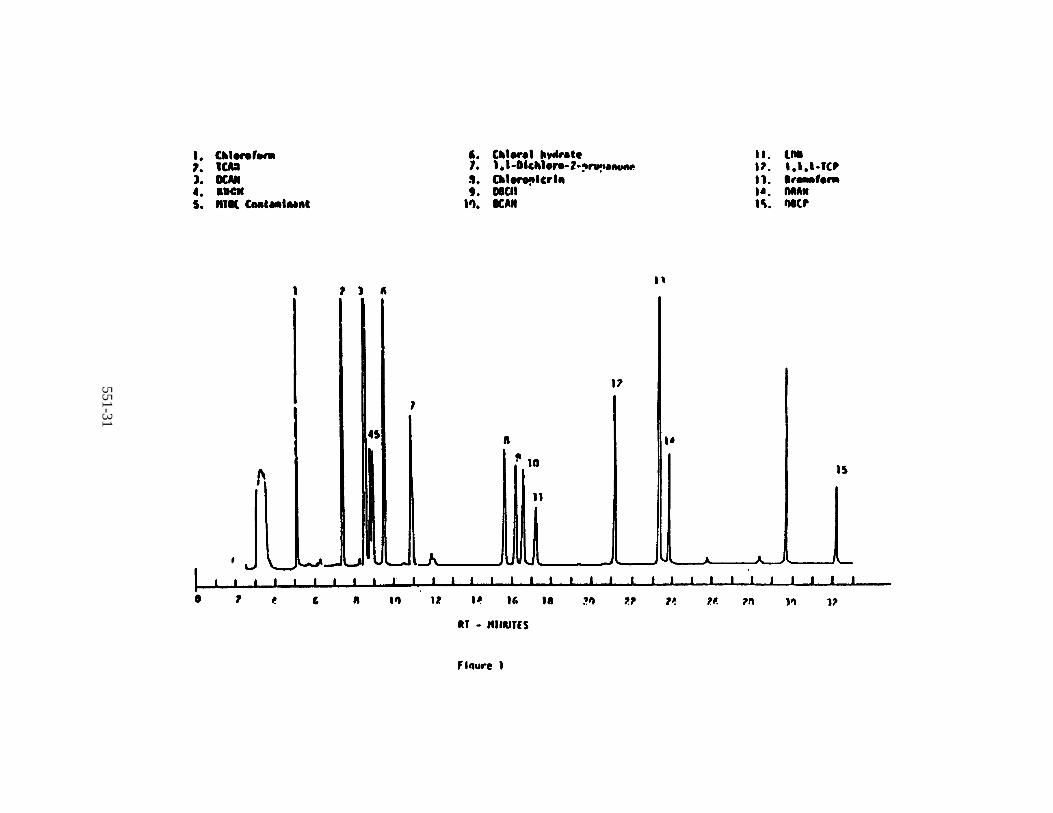
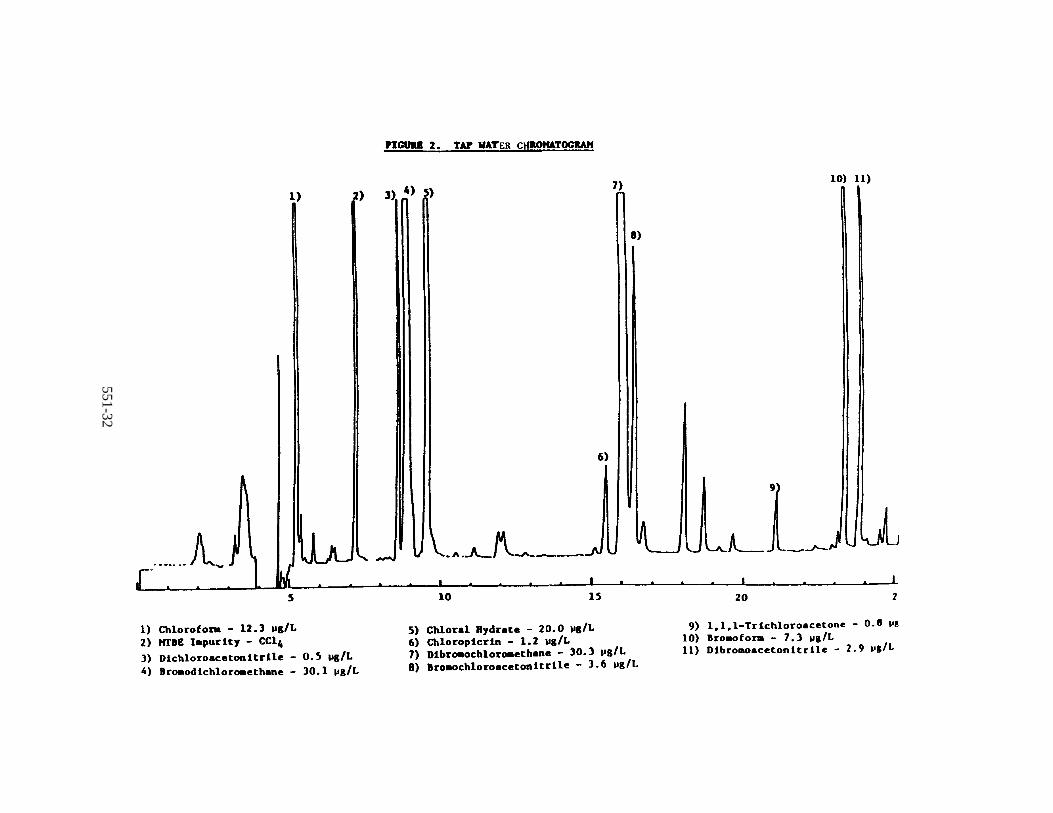
11.3.1 The recommended GC operating conditions are described inSections 6.8.2.1 and 6.8.2.2 along with recommended primary andconfirmation columns. Retention data for the primary and confirmationcolumns are given in Table 1 and examples of separations attained withthe primary column are shown in Figures 1 and 2. Other GC columns,chromatographic conditions, or detectors may be used if therequirements of Section 10.0 are met.
11.3.2 Calibrate the system daily as described in Section 9.0. The standardsand extracts must be in MTBE.
11.3.3 Inject 1-2 µL of the sample extract and record the resulting peak size inarea units. For optimum performance and precision, an autosamplerfor sample injection and a data system for signal processing arestrongly recommended.
11.3.4 Identify sample components by comparison of retention times toretention data from a reference chromatogram. If the retention time ofan unknown compound corresponds, within limits (Section 11.3.5), tothe retention time of a standard compound, then identification isconsidered positive.
11.3.5 The width of the retention time window used to make identificationsshould be based upon measurements of actual retention time variationsof standards over the course of a day. Three times the standarddeviation of a retention time can be used to calculate a suggested
551-20
window size for a compound. However, the experience of the analystshould weigh heavily in the interpretation of chromatograms.
11.3.6 Identification requires expert judgment when sample components arenot resolved chromatographically, that is, when GC peaks obviouslyrepresent more than one sample component (i.e., broadened peak withshoulder(s) or valley between two or more maxima). Whenever doubtexists over the identification of a peak in a chromatogram, confirmationis required by the use of a dissimilar column or by GC-MS.
11.3.7 If the peak area exceeds the linear range of the calibration curve, thefinal extract should be diluted with MTBE and reanalyzed.
12.0 CALCULATIONS
12.1 Calculate the uncorrected concentrations (Ci) of each analyte in the samplefrom the response factors or calibration curves generated in Section 9.2.1 or9.3.1.
12.2 Calculate the corrected sample concentration as:
where the sample volume, Vs in mL, is equivalent to the net sample weight ingrams determined in Sections 11.1.2 and 11.2.4.
13.0 METHOD PERFORMANCE
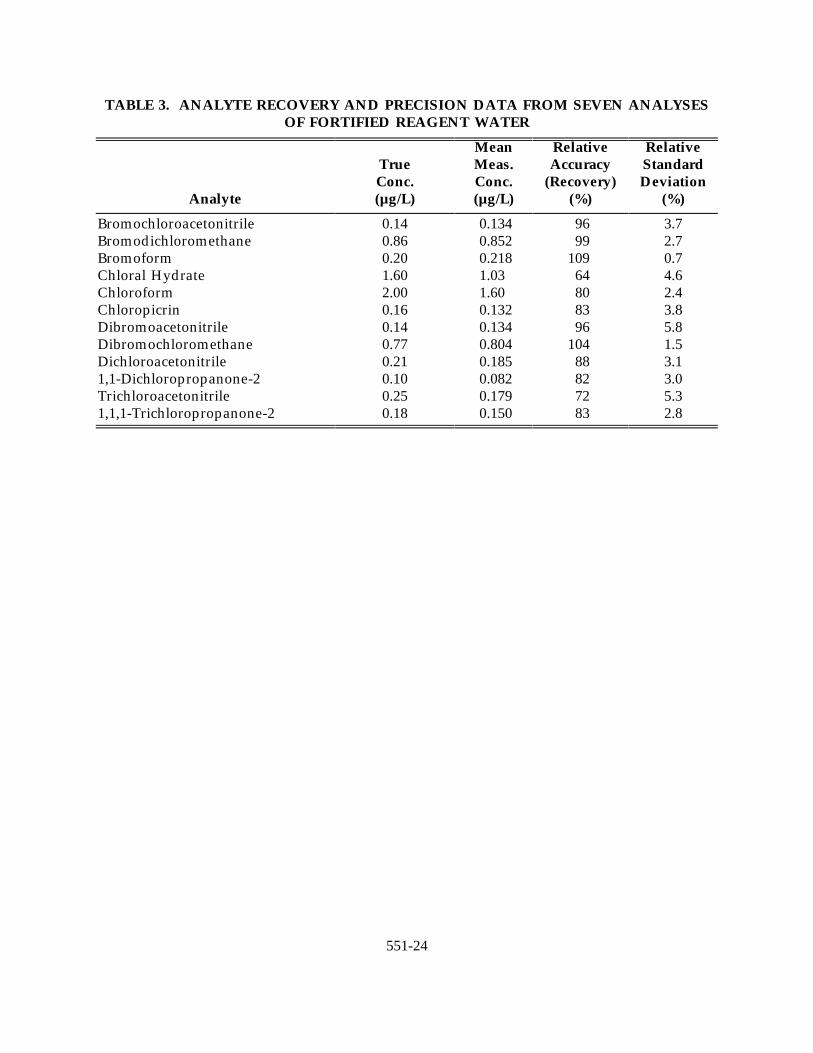
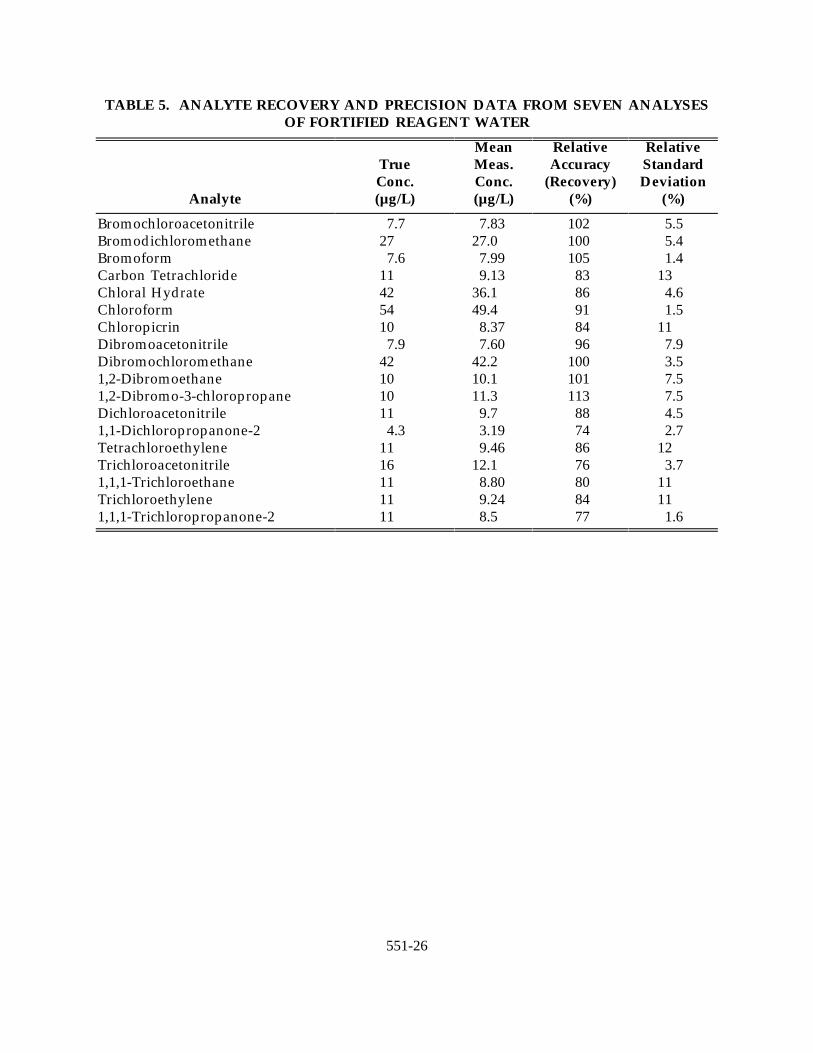
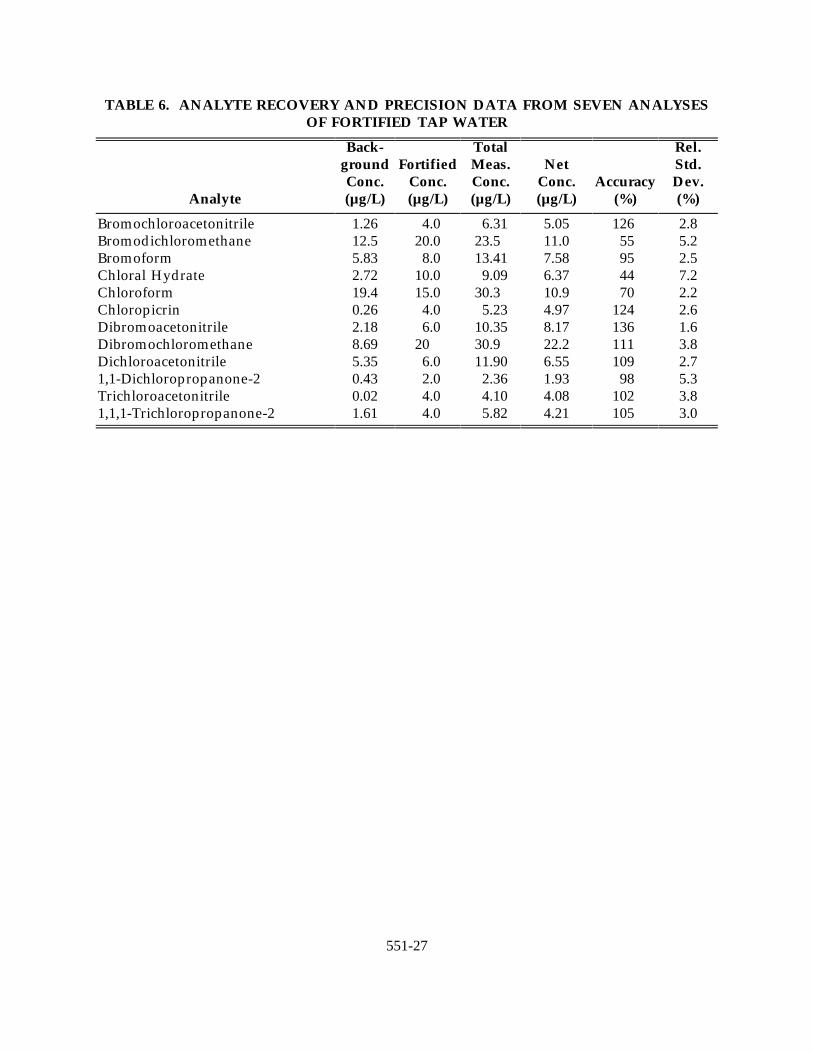
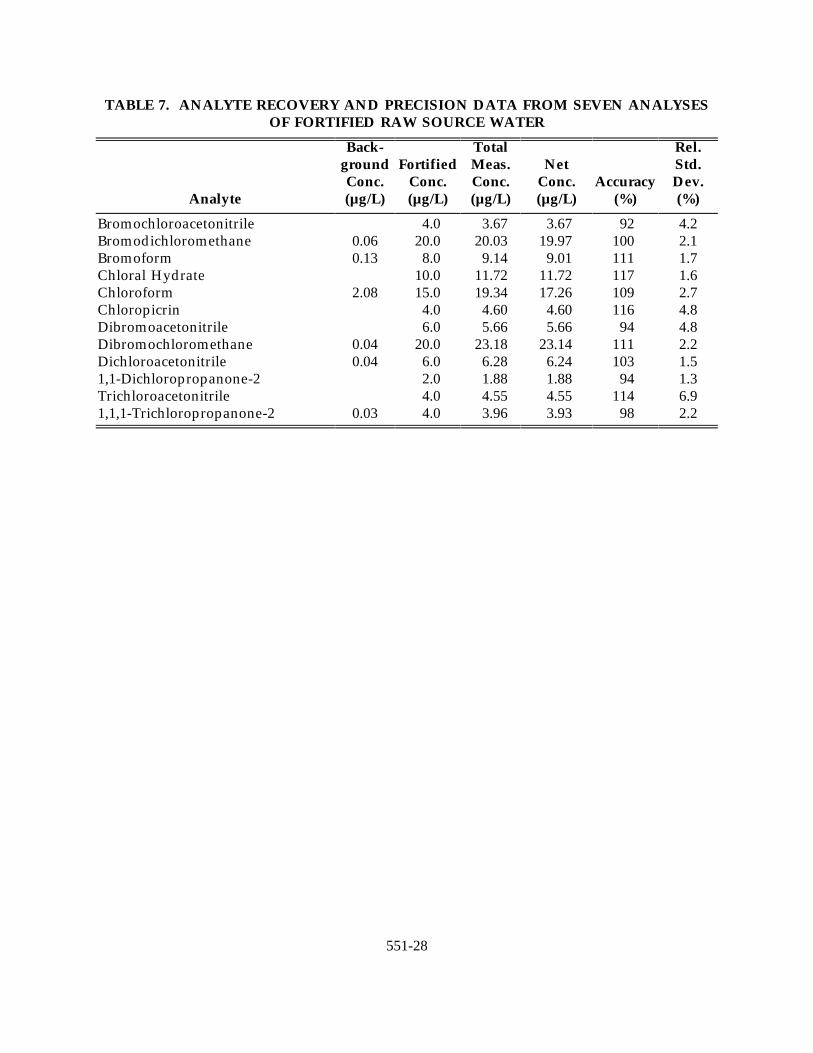
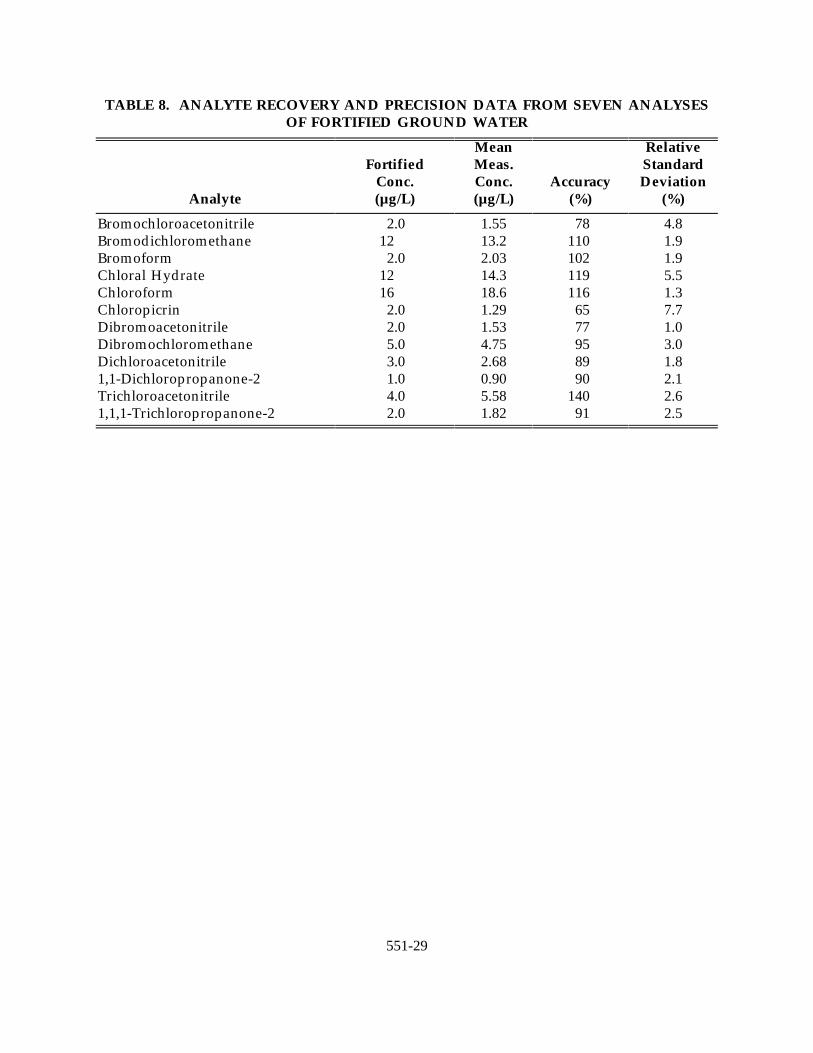
13.1 Single laboratory (EMSL-Cincinnati) recovery and precision data at threeconcentrations in a reagent water matrix are presented in Tables 3-5. Accuracyand precision data based on extracted standards for fortified tap water, rawsource water and groundwater are presented in Tables 6-8.
14.0 REFERENCES
1. Glaze, W.W., Lin, C.C. "Optimization of Liquid-Liquid Extraction Methods forAnalysis of Organics in Water", EPA-600/S4-83-052, U.S. EnvironmentalProtection Agency, January 1984.
2. Richard, J.J. and Junk, G.A. "Liquid Extraction for Rapid Determination ofHalomethanes in Water," Journal AWWA, 69, 62, 1977.
3. Reding, R., Fair, P.S., Shipp, C.J., and Brass, H.J. "Measurement ofDihaloacetonitriles and Chloropicrin in Drinking Water", DisinfectionByproducts: Current Perspectives ", AWWA, Denver, CO, 1989.
551-21
4. Hodgeson, J.W., Cohen, A.L., and Collins, J. P. "Analytical Methods forMeasuring Organic Chlorination Byproducts" Proceedings Water QualityTechnology Conference (WQTC-16), St. Louis, MO, Nov. 13-17, 1988, AmericanWater Works Association, Denver, CO, pp. 981-1001.
5. Glaser, J.A., Foerst, D.L., McKee, G.D., Quave, S.A., and Budde, W.L. "TraceAnalysis for Wastewaters", Environ. Sci. Technol., 15, 1426, 1981.
6. "Carcinogens-Working with Carcinogens", Publication No. 77-206, Departmentof Health, Education, and Welfare, Public Health Service, Center for DiseaseControl, National Institute of Occupational Safety and Health, Atlanta,Georgia, August 1977.
7. "OSHA Safety and Health Standards, General Industry", (29 CFR 1910), OSHA2206, Occupational Safety and Health Administration, Washington, D.C.Revised January 1976.
8. "Safety in Academic Chemistry Laboratories", 3rd Edition, American ChemicalSociety Publication, Committee on Chemical Safety, Washington, D.C., 1979.
551-22
TABLE 1. RETENTION DATA
Analyte (min) (min)
Column A Column B
Retention Time Time
Chloroform 5.25 3.091,1,1-Trichloroethane 6.37 2.04Carbon Tetrachloride 7.29 3.41Trichloroacetonitrile 7.59 5.03Dichloroacetonitrile 8.72 9.09Bromodichloromethane 9.02 4.21Trichloroethylene 9.13 4.38Chloral Hydrate 9.70 6.561,1,-dichloropropanone-2 10.73 11.19Chloropicrin 15.80 39.94Dibromochloromethane 16.40 6.40Bromochloroacetonitrile 16.77 14.431,2-Dibromoethane (EDB) 17.40 9.71Tetrachloroethylene 19.57 6.941,1,1-Trichloropropanone 21.36 15.66Bromoform 23.54 10.73Dibromoacetonitrile 24.03 17.451,2-Dibromo-3-Chloropropane (DBCP) 32.32 20.35
Column A: DB-1, 0.32 mm x 30 m, 1 micron film thicknessColumn B: DB-210, 0.32 mm x 30 m, 0.5 micron film thickness
551-23
TABLE 2. METHOD DETECTION LIMITS
Analyte (µg/L) (µg/L) (µg/L) Dev. (%) (µg/L)
Fortified Mean Meas. Std. Rel. DetectionConc. Conc. Dev. Std. Limit
Method
Bromochloroacetonitrile .029 .027 .0030 11.1 .011Bromodichloromethane .023 .023 .0018 7.9 .006Bromoform .029 .028 .0035 12.7 .012Carbon Tetrachloride .020 .019 .0014 7.2 .004Chloral Hydrate .035 .037 .0091 24.8 .026Chloroform .005 .005 .00063 12.7 .002Chloropicrin .029 .030 .0033 11.2 .012Dibromoacetonitrile .080 .072 .0097 13.5 .034Dibromochloromethane .023 .023 .0034 14.8 .0121,2-Dibromoethane .028 .028 .0017 6.0 .0061,2-Dibromo-3-chloropropane .043 .041 .0027 6.6 .009Dichloroacetonitrile .032 .036 .0063 17.6 .0191,1-Dichloropropanone-2 .021 .020 .0013 6.7 .005Tetrachloroethylene .022 .022 .0013 5.9 .004Trichloroacetonitrile .143 .135 .0307 22.7 .0921,1,1-Trichloroethane .032 .033 .0025 7.7 .008Trichloroethylene .018 .023 .00076 3.4 .0021,1,1-Trichloropropanone .043 .044 .0033 7.6 .012
551-24
TABLE 3. ANALYTE RECOVERY AND PRECISION DATA FROM SEVEN ANALYSESOF FORTIFIED REAGENT WATER
Analyte (µg/L) (µg/L) (%) (%)
True Meas. Accuracy StandardConc. Conc. (Recovery) Deviation
Mean Relative Relative
Bromochloroacetonitrile 0.14 0.134 96 3.7Bromodichloromethane 0.86 0.852 99 2.7Bromoform 0.20 0.218 109 0.7Chloral Hydrate 1.60 1.03 64 4.6Chloroform 2.00 1.60 80 2.4Chloropicrin 0.16 0.132 83 3.8Dibromoacetonitrile 0.14 0.134 96 5.8Dibromochloromethane 0.77 0.804 104 1.5Dichloroacetonitrile 0.21 0.185 88 3.11,1-Dichloropropanone-2 0.10 0.082 82 3.0Trichloroacetonitrile 0.25 0.179 72 5.31,1,1-Trichloropropanone-2 0.18 0.150 83 2.8

551-25
TABLE 4. ANALYTE RECOVERY AND PRECISION DATA FROM SEVEN ANALYSESOF FORTIFIED REAGENT WATER
Analyte (µg/L) (µg/L) (%) (%)
True Meas. Accuracy StandardConc. Conc. (Recovery) Deviation
Mean Relative Relative
Bromochloroacetonitrile 1.5 1.67 111 2.7Bromodichloromethane 11.6 12.4 107 2.7Bromoform 1.9 2.19 115 0.9Carbon Tetrachloride 2.3 1.98 86 6.9Chloral Hydrate 23.4 17.1 73 1.6Chloroform 15.0 15.5 103 3.2Chloropicrin 1.8 1.62 90 8.9Dibromoacetonitrile 1.5 1.62 108 5.6Dibromochloromethane 10.7 12.2 114 2.01,2-Dibromoethane 5.0 5.15 103 4.81,2-Dibromo-3-chloropropane 5.0 5.60 112 4.7Dichloroacetonitrile 2.7 2.56 95 1.51,1-Dichloropropanone-2 0.92 0.74 80 1.7Tetrachloroethylene 2.3 1.99 87 6.6Trichloroacetonitrile 3.6 2.50 69 6.81,1,1-Trichloroethane 2.3 2.18 95 8.3Trichloroethylene 2.3 2.07 90 101,1,1-Trichloropropanone-2 2.3 1.95 85 1.9
551-26
TABLE 5. ANALYTE RECOVERY AND PRECISION DATA FROM SEVEN ANALYSESOF FORTIFIED REAGENT WATER
Analyte (µg/L) (µg/L) (%) (%)
True Meas. Accuracy StandardConc. Conc. (Recovery) Deviation
Mean Relative Relative
Bromochloroacetonitrile 7.7 7.83 102 5.5Bromodichloromethane 27 27.0 100 5.4Bromoform 7.6 7.99 105 1.4Carbon Tetrachloride 11 9.13 83 13Chloral Hydrate 42 36.1 86 4.6Chloroform 54 49.4 91 1.5Chloropicrin 10 8.37 84 11Dibromoacetonitrile 7.9 7.60 96 7.9Dibromochloromethane 42 42.2 100 3.51,2-Dibromoethane 10 10.1 101 7.51,2-Dibromo-3-chloropropane 10 11.3 113 7.5Dichloroacetonitrile 11 9.7 88 4.51,1-Dichloropropanone-2 4.3 3.19 74 2.7Tetrachloroethylene 11 9.46 86 12Trichloroacetonitrile 16 12.1 76 3.71,1,1-Trichloroethane 11 8.80 80 11Trichloroethylene 11 9.24 84 111,1,1-Trichloropropanone-2 11 8.5 77 1.6
551-27
TABLE 6. ANALYTE RECOVERY AND PRECISION DATA FROM SEVEN ANALYSESOF FORTIFIED TAP WATER
Analyte (µg/L) (µg/L) (µg/L) (µg/L) (%) (%)
Back- Total Rel.ground Fortified Meas. Net Std.Conc. Conc. Conc. Conc. Accuracy Dev.
Bromochloroacetonitrile 1.26 4.0 6.31 5.05 126 2.8Bromodichloromethane 12.5 20.0 23.5 11.0 55 5.2Bromoform 5.83 8.0 13.41 7.58 95 2.5Chloral Hydrate 2.72 10.0 9.09 6.37 44 7.2Chloroform 19.4 15.0 30.3 10.9 70 2.2Chloropicrin 0.26 4.0 5.23 4.97 124 2.6Dibromoacetonitrile 2.18 6.0 10.35 8.17 136 1.6Dibromochloromethane 8.69 20 30.9 22.2 111 3.8Dichloroacetonitrile 5.35 6.0 11.90 6.55 109 2.71,1-Dichloropropanone-2 0.43 2.0 2.36 1.93 98 5.3Trichloroacetonitrile 0.02 4.0 4.10 4.08 102 3.81,1,1-Trichloropropanone-2 1.61 4.0 5.82 4.21 105 3.0
551-28
TABLE 7. ANALYTE RECOVERY AND PRECISION DATA FROM SEVEN ANALYSESOF FORTIFIED RAW SOURCE WATER
Analyte (µg/L) (µg/L) (µg/L) (µg/L) (%) (%)
Back- Total Rel.ground Fortified Meas. Net Std.Conc. Conc. Conc. Conc. Accuracy Dev.
Bromochloroacetonitrile 4.0 3.67 3.67 92 4.2Bromodichloromethane 0.06 20.0 20.03 19.97 100 2.1Bromoform 0.13 8.0 9.14 9.01 111 1.7Chloral Hydrate 10.0 11.72 11.72 117 1.6Chloroform 2.08 15.0 19.34 17.26 109 2.7Chloropicrin 4.0 4.60 4.60 116 4.8Dibromoacetonitrile 6.0 5.66 5.66 94 4.8Dibromochloromethane 0.04 20.0 23.18 23.14 111 2.2Dichloroacetonitrile 0.04 6.0 6.28 6.24 103 1.51,1-Dichloropropanone-2 2.0 1.88 1.88 94 1.3Trichloroacetonitrile 4.0 4.55 4.55 114 6.91,1,1-Trichloropropanone-2 0.03 4.0 3.96 3.93 98 2.2
551-29
TABLE 8. ANALYTE RECOVERY AND PRECISION DATA FROM SEVEN ANALYSESOF FORTIFIED GROUND WATER
Analyte (µg/L) (µg/L) (%) (%)
Fortified Meas. StandardConc. Conc. Accuracy Deviation
Mean Relative
Bromochloroacetonitrile 2.0 1.55 78 4.8Bromodichloromethane 12 13.2 110 1.9Bromoform 2.0 2.03 102 1.9Chloral Hydrate 12 14.3 119 5.5Chloroform 16 18.6 116 1.3Chloropicrin 2.0 1.29 65 7.7Dibromoacetonitrile 2.0 1.53 77 1.0Dibromochloromethane 5.0 4.75 95 3.0Dichloroacetonitrile 3.0 2.68 89 1.81,1-Dichloropropanone-2 1.0 0.90 90 2.1Trichloroacetonitrile 4.0 5.58 140 2.61,1,1-Trichloropropanone-2 2.0 1.82 91 2.5
551-30
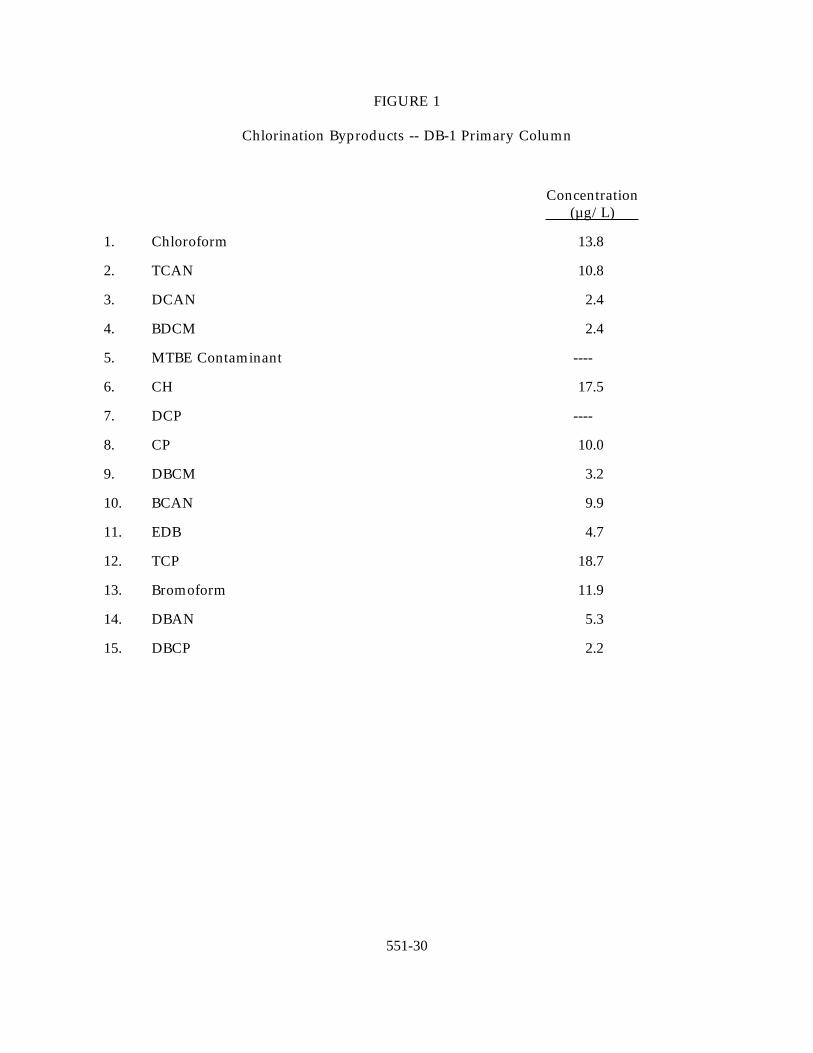
FIGURE 1
Chlorination Byproducts -- DB-1 Primary Column
Concentration (µg/L)
1. Chloroform 13.8
2. TCAN 10.8
3. DCAN 2.4
4. BDCM 2.4
5. MTBE Contaminant ----
6. CH 17.5
7. DCP ----
8. CP 10.0
9. DBCM 3.2
10. BCAN 9.9
11. EDB 4.7
12. TCP 18.7
13. Bromoform 11.9
14. DBAN 5.3
15. DBCP 2.2
551-31
551-32