metatrader 4 - fxsuit.com user guide for … · opening of a demo account. a demo account can be...
TRANSCRIPT
MetaTrader 4USER GUIDE
for PC

2
TABLE OF CONTENTS
A. GETTING STARTED ....................................................................................................... 3
B. CLIENT TERMINAL SETTINGS ...................................................................................... 6
C. USER INTERFACE ........................................................................................................ 13
D. WORKING WITH CHARTS ............................................................................................ 37
E. TECHNICAL INDICATORS ............................................................................................. 48
G. AUTO TRADING ............................................................................................................. 69
F. CUSTOM INDICATORS .................................................................................................. 82
G. SCRIPTS ........................................................................................................................ 84
H. CONFIGURATION AT STARTUP .................................................................................... 86
I. HISTORY CENTER .......................................................................................................... 89
J. EXPORT OF QUOTES .................................................................................................... 91
K. GLOBAL VARIABLES ..................................................................................................... 91
L. CONTRACT SPECIFICATION ........................................................................................ 91
M. LANGUAGES SUPPORT .............................................................................................. 92
N. DATACENTER.INI .......................................................................................................... 92
MT4 USER GUIDE

3
A. GETTING STARTED
Client Terminal is a part of the online trading system. It is installed on the trader’s computer and intended for:
• receiving quotes and news in the online mode;• performing of trade operations;• controlling and managing of open positions and pending
orders;• conducting of technical analysis;• writing of expert advisors, custom indicators, scripts,
and functions in MetaQuotes• Language 4 (MQL 4);• Testing and optimizing of trading strategies.
For making a decision to trade, reliable on-line information is necessary. For that, quotes and news are delivered at the terminal in the real-time mode. On basis of on-line delivered quotes, it is possible to analyze markets using technical indicators and line studies. Expert advisors allow to work off routine of observing markets and the own positions. Moreover, to ensure more flexible control over positions, several order types are built into the terminal.
The Client Terminal can operate under Microsoft Windows 98SE/ME/2000/XP/2003. Hardware requirements are limited with software ones.
a) Terminal InstallationTo install Client Terminal, it is necessary to download its distributive and launch it. Then it will be necessary to choose a directory for installing the program there and follow the Installation Wizard tips. After the terminal has been installed it will run automatically. Terminal can also be installed over an installed version of it. At that, all terminal settings remain as they were in the preceding version. Exceptions can be: DEFAULT profile and template, as well as standard MQL4 programs included in the delivery set. This is why it is not recommended to change standard templates or profiles, but to create MQL4 programs named uniquely.
If there is a need to work with several accounts simultaneously, the corresponding amount of terminals must be installed in different directories. At that, each terminal has its individual settings, except for registration details and interface language that are stored in the Registry.
Terminal StartAfter installation has been completed, a group of Client Terminal programs will be created in the “Start” menu, and the program shortcut will additionally appear on the desktop. They will help to start client terminal.
Attention: Two copies of the Client Terminal are prohibited to be started from the same directory simultaneously. To start several terminals simultaneously, it is necessary to install the corresponding amount of programs in different directories.
Terminal can be started from the command line, certain parameters having been specified. The account number and profile name can be used as a parameter. If the account number was specified as this, an attempt to authorize this account will be made at the program start. If the profile was specified there, it will be downloaded automatically. For example, terminal.exe “123456-’British Pound’”, where “123456” is the account number, and British Pound is the profile name. If there are spaces in the command line (like in the above profile name), the double quotation marks should be used. If no spaces occur, there is no need indouble quotation marks. Single quotes are used for profile names. For example: terminal.exe 123456-’GBPUSD’. Either login only, or profile and login can be used in the command line. The profile cannot be used without login.
The terminal can also be started with predefined settings. For more details, please look through the “Configuration at Startup” and “Datacenter.ini” sections.
b) Opening of AccountsTerminal allows working with two types of accounts: demo accounts and real accounts. Demo accounts enable working under training conditions, without real money on them, but they allow working out and testing trading strategy very well. They possess all the same functionality as the real ones. The distinction consists in that demo accounts can be opened without any investments, though one cannot count on any profit from them.
MT4 USER GUIDE
4
Opening of a Demo AccountA demo account can be opened by the “File - Open an Account” menu command or by the same command of the “Navigator - Accounts” window context menu. Besides, the terminal will offer to open a demo account at the first program start to begin working immediately.
The following data will be requested to open an account:• Name the user’s full name;• Country country of residence;• State area (region, territory, state, etc.) of residence;• City city of residence;• Zip code zip code;• Address exact mailing address (street name, house and
apartment numbers);• Phone contact telephone number;• Email email address;• Account Type account type to be selected from the list
defined by the brokerage company;• Currency the basic currency of the deposit to be set
automatically depending on the account type selected;• Leverage the ratio between the borrowed and owned
funds for trading;• Deposit the amount of the initial deposit in terms of the
basic currency.
To activate the “Next” button and continue registration, it is necessary to flag “I agree to subscribe to your newsletters”. Then a server must be chosen to connect to. Addresses of available servers, their names and ping are listed there. The most preferable is the server having the lowest ping. After the registration has successfully completed, a window will appear that contains information about the open account: “Login” - the account number,“Password” - the password for access, “Investor” - the investor’s password (connection mode in which it is possible to check the account status, analyze the price dynamics, etc., but no trading is allowed). After registration has been completed, the new account will appear in the “Navigator - Accounts” window, and itis ready to work with. At that, the server sends a message to the terminal containing login and passwords of this newly opened account. This message can be found in the “Terminal - Mailbox” window. Besides, after the account has been successfully registered, it will be authorized automatically.
Attention: If any problems occur at the account opening, technical support service of the brokerage company should be asked for help.
Opening of a Real AccountReal accounts, unlike demo accounts, cannot be opened from the terminal. They can only be opened by brokerage companies under certain terms and conditions. Real accounts are marked correspondingly in the “Navigator - Accounts” window. To start working with them, one must perform authorization.
c) AuthorizationAuthorization is connection of terminal to the server through a login and a password. It allows managing a trading account. Two accesses to the account are possible in the terminal: a normal password and an investor password. Being authorized with the standard password, one gets full rights for working with the terminal. Investor authorization allows seeing the account status, analyzing prices, and working with expert advisors, but not to trade. Investor access is a convenient tool used for demonstration of trading at the account. To be authorized, it is necessary to execute the “Login” command of the context menu of the account (context menu is called by clicking with the right mouse button at the account number) in the “Navigator” window or “File” menu. Then, the account number, one of its passwords (standard or investor) should be given in the appearing window, and a server should be chosen. After all data have been specified, the “Login” button should be pressed.
Attention: If the “Keep personal settings and data at startup”, option is enabled, the latest account used will be automatically authorized at the next start of the terminal. The “Keep personal settings and data at startup” option in terminal settings carries out the same action.
d) Security SystemData exchange between the Client Terminal and the server is performed by encryption based on 128 - bit keys. This is sufficient to ensure security of trading. However, besides this system, terminal allows to use one more system: Advanced Security system based on digital signature algorithm of RSA. It is an asymmetric encryption algorithm that implies presence of a public and a private key. Public key can be freely distributed and used for checking the authenticity of a message signed with a private key. Knowing of the public key is guaranteed not to be possible basis for decoding of the private one within an acceptable period of time. Decoding of the private key on the basis of the public one will take tens or hundreds of years even with modern powerful computers.
MT4 USER GUIDE
5
Attention: The Advanced Security system based on electronic digital signatures can be enabled on the server. In the Advanced Security mode, a special window will appear at the first connection to the server that is intended for generation of both public and private keys. To generate keys, it is necessary to move the mouse cursor in the black area of the window in order to generate a random data sequence. Then keys will be generated based on this sequence. The RSA key pair generated is stored on the hard disk, and the public key will be sent to the trading server. Later on, the server will check the authenticity of signed information using this public key.
• If the Advanced Security system is enabled for a tradingaccount, for working at another computer, it is necessary totransfer the generated RSA keys into this other computer.The keys represent files with KEY extension and arestored in the /CONFIG folder;• if either key has been lost or damaged, it is necessary torefer to the brokerage company technical support service.
e) Live UpdateA live update system (LiveUpdate) is built into the terminal. It allows to get informed about and install new versions of the program promptly. This system is always enabled, it is impossible to disable it. The terminal checks for new versions of the program when it connects to the server. If a new version has been discovered, a new window named “Live Update” will appear, the client will be offered to download the update(s). To start downloading these updated files, the “Start” button must be pressed. The updating process and the list of files to be downloaded can be observed in this window. After the updates have been downloaded, the new version of the terminal will be automatically installed and restarted.
Attention:• If there is no connection to the server, the live updatingprocess will not start.• If any problems with live updating occur, the TechnicalSupport Service should be referred to.• When updated, the examples of using expert advisors,indicators and scripts delivered together with the ClientTerminal can be overwritten.
MT4 USER GUIDE

6
B. CLIENT TERMINAL SETTINGS
Client Terminal is generally set up in a special window that can be called by the “Tools - Settings” menu command or with accelerating keys Ctrl+O. All settings are grouped according to their tasks and located in the following tabs:
• Server - setting up parameters of connection to theserver, configuring of the used proxy server and DataCenters, as well as other important settings;
• Charts - general setting of the displaying of pricecharts. It is possible to detect whether periodseparators, Ask-price level, OHLC line will be shown.Besides, the amount of bars stored and displayed onthe chart can be defined in this tab;
• Objects - setting up parameters of objectsmanagement. Selection of object after they have beencreated, their immediate setting, and dockingparameters are defined here;
• Trade - parameters of opening new orders by default.They include: financial instrument (symbol), the amountof lots and deviation;
• Expert Advisors - settings common for all experts.They include: locking of operation for expert advisors,enabling of importing functions from external DLLlibraries and advisors, as well as a number of otherfeatures;
• Email - setting up email parameters. If there is anecessity to send messages by email directly from theterminal, the parameters of the mailbox to be used mustbe set up;
• Publisher - setting up publishing reports in internet.The terminal allows to publish reports in the real-timemode that contain information about the account statusin internet. Connection through ftp is used for thispurpose that can be set up in this tab;
• Events - setting up signals informing about systemevents. Signals informing about connectionunavailability, news incomes, and others, simplify thework very much.
a) The Server Tab
This tab contains the most important settings changes in which can cause serious troubles in the terminal operation as far as the full disconnection. The client terminal is initially configured in the way providing normal, trouble - free operation. Thus, it is highly recommended not tochange any parameters in this window needlessly.
In the “Settings - Server” window, it is possible:• to choose a server to connect to;• to configure the proxy server;• to set up operation through Data Centers;• to specify and change passwords;• to enable export of quotes through DDE protocol;• to enable income of news
ServerPractically, the entire work of the Client Terminal is based on data (news and quotes) continuously incoming from the server. If a client terminal does not receive quotes, it is impossible to trade with it. In such a mode, the terminal allows just to analyze the existing data with indicators and line studies and test expert advisors. This situation can emerge for a number of reasons; one of them is incorrect setting of the server connection.
For connecting the client terminal to the server, the exact server IP address (or domain name) and port must be known. After the program has been installed, all these data will be specified, there is usually no need to change them. However, if there is a need to connect to another server, its address and port must be given in the “Server” field. The data must be given in the following format: “[internet address of the server] : [port number]” (without spaces). For example: “192.168.0.1:443”, where “192.168.0.1” is the server address, and “443” is the port number. After the data have been input, the “OK” button must be pressed.
The newly set server address and port number are stored on the hard disk. These data do not influence the operation of the client terminal until an attempt to open a new account is made. It is this moment when the terminal starts using of these given address and port number. The new server address will be added to the list of servers during account registration, and it can be chosen. If connection to the server succeeds, the new account will be opened. Otherwise, it is recommended to check all settings and try to reconnect.
MT4 USER GUIDE
7
Attention: Incorrect connection setting is not the only reason for which a new account cannot be opened.
Proxy ServerConnection to internet through a proxy server can be another reason for which the server cannot be connected to. A proxy server is an intermediate between the trader’s computer and the trading server. It is mostly used by internet providers or by local networks. If a connection problem occurs, you should turn to your systems administrator or to the internet provider. If a proxy is used, the terminal must be set up in a corresponding way.
Setting of “Enable proxy server” checkbox will enable proxy server support and activate the “Proxy...” button. Pressing of this button will open the window where proxy server parameters should be specified (these data can be given by the systems administrator or by internet provider):
• Server - proxy server address and type (HTTP,SOCKS5, or SOCKS4);
• Login - a user login for access to the proxy server. Iflogin is not needed, this field must remain empty;
• Password - a password for access to the proxy server. Ifpassword is not needed, this field must remain empty.
After the parameters have been specified, it is recommended to press the “Test” button to check how the settings work. If they have been tested successfully, the “OK” button must be pressed in order the settings to be effective. Error message means that the proxy server was set up incorrectly. To find out about the reasons, the system administrator or internet provider must becontacted again.
Data CentersData Centers (access points) are a part of the trading platform and represent specialized proxy servers. They allow saving common traffic: the same quotes and news are given to several client terminals at the same time.
Access points are located between the server and a client terminal. One server can have several access points through which all traders will connect to it. After a terminalhas been installed, connection to Data Centers is set up automatically. It is highly recommended not to change anything. Incorrect setting of connections to Data Centers can be the reason for no connection between the terminal and the server. If there is a necessity to change settings
of Data Centers, it is recommended to contact Technical Support Service first. All information needed to set up Data Centers correctly can be obtained there. In the most cases, it is sufficient just to flag “Data Center auto configuration”.
After that, the client terminal will choose the most preferable access points automatically. For manual setting of access points, this option must be disabled. Then, in the activated “Data Center” field, the IP address (or domain name) and port number must be specified. The data must have the following format: “[Data Center internetaddress] : [port number]”. The settings must be checked by pressing the “Test” button located to the left of this field. If settings are correct, the corresponding message will appear. After that, it will be possible to start working. If an error message appears, the Technical Support service must be contacted to solve the problem.
Attention:• It is not recommended to set up access to Data Centersmanually without a special need.• Before setting up access to Data Centers manually, it ishighly recommended to read the Help files of this program.
Account and LoginClient terminal can connect to the server and work only using an account. There are login (the account number), master and investor passwords in the Client Terminal. To be authorized, one needs an account number and one of two passwords. The master password allows the full access to the account, while the investor one gives only a limited access. Being authorized with the investor password gives the right to look through charts, perform technical analysis and test expert advisors, but not trade. Investor password is a convenient tool showing the trading process at this given account.
After the account has been opened and if “Keep personal settings and data at startup” option is e abled, its data (number, master and investor passwords) will be stored at the hard disk. At the program restart, these data will be used to connect the account automatically. If the option is disabled, a password must be entered manually at each restart of the terminal.
The current account number and password are specified in the fields of “Login” and “Password”. Data of another account can be input in these fields, then, after the “OK” button has been pressed, the terminal will try to authorize it. If authorization was not successfully completed, the data
MT4 USER GUIDE

8
button has been pressed, the terminal will try to authorize it. If authorization was not successfully completed, the data given should be checked and re-authorized. If this does not help, the Technical Support service should be contacted.
Having pressed the “Change” button, one can specify new passwords in the window appeared. Doing so, one has to know the current password. It can be found in the message sent from the server after registration of a demo account. The new password is input in the corresponding field. If the “Change investor (read only) password” option is enabled, the investor (not master) password will be changed.
Data Export through DDE ProtocolQuotes delivered to the terminal can be exported to other applications through “DDE” (Dynamic Data Exchange) protocol. To enable export of quotes, the “Enable DDE server” option must be enabled and the “OK” button must be pressed. Data delivery will start immediately. More details about export of quotes can be found in the corresponding section.
NewsTerminal allows receiving financial news promptly. They start to income just after connection to the server. No news issued when the terminal was disconnected will income in it. To enable news delivering, it is necessary to flag “Enable news”. In the “Terminal” window, the “News” tab will appear in which news will be delivered as they are issued. Attention: If the “Enable news” option is enabled, but no pieces of news were issued, the “News“ tab will not appear in the “Terminal” window.
b) Charts TabCharts show the dynamics of symbol price changes. Charts settings and history data parameters are grouped in this tab; changing of parameters in this tab will not cause any global changes in operation of the terminal.
Trade LevelsLines of open and pending orders placed directly in the chart visualize where exactly the position was opened, when the pending order, Stop Loss or Take Profit will trigger. This option saves traders’ work and helps to avoid some mistakes caused by human emotions. For it to be enabled, the “Show trade levels” must be checked, and the “OK” button must be pressed. At that, the lines corresponding with open prices of positions and orders will appear in the chart. Of course, if no order or position are
opened, no levels will be shown in the chart. This option is active for open positions or orders only. No closed position will come within its action.
Ask LineBars in the terminal are built and shown only for Bid prices. However, for opening of long positions and closing of short ones, Ask price is always used. But it is not shown in the chart in any way, it cannot be seen. To control over one’s trading activities more attentively, one can enable the “Show Ask line” parameter. After this command has been executed, an additional horizontal line corresponding with Ask price of the last bar will appear in the chart.
OHLC Line Charts show the price dynamics, but it is often very difficult to determine exact parameters of the bar by eye. The “Show OHLC” option is very helpful in such situations. It places an additional information line in the upper left corner of each chart. Here, besides the symbol name and chart period, prices of the last bar are listed. They are formatted as follows: OPEN, HIGH, LOW and CLOSE (OHLC) - open price of the bar, the highest price of the bar,the lowest price of the bar, and close price of the bar, respectively. Thus, the exact value of the last bar can always be seen.
Period SeparatorsDate and time of each bar are shown on the chart horizontal axis. The chosen timeframe is the value of this horizontal scale. The “Show period separators” option draws additional vertical lines in the chart that correspond with a larger timeframe. So, for charts having timeframe from M1 to H1, daily separators are built, for H4 - weekly, for D1 - monthly, and for W1 and MN1 - yearly ones.
Color PrintTerminal allows printing not only black and white, but also colored charts. The latter ones are more appropriate for analysis than black and white ones. This option can be enabled by setting of the “Color print” checkbox and then pressing the “OK” button. After that, if the printer allows it, all charts will be printed in color.
MT4 USER GUIDE
9
Saving of Deleted Charts TemplatesTerminal allows restoring charts deleted from the workspace. If the “Save deleted charts to reopen” option is enabled, at deleting of a chart, its template will be saved in the /DELETED directory. Later on, any deleted chart can be restored with the “ File Open deleted” menu command.For example, it is possible to restore the four hour chart of EURUSD after it has been deleted. The restored chart will also be a four hour one and all its settings with imposed objects (indicators, line studies) will be restored, as well.
Amounts of Bars in History and in ChartsBars stored in history and those shown in charts differ from each other. This difference is determined by the fact that any amount of bars can be kept in the hard disk provided that it has enough space. But the amount of bars shown in the chart is limited by the computer resources. To calculate values of technical and custom indicators, bars shown in the chart are used, as well. When a great amount of indicators and data to be shown are used simultaneously, computer free resources (central processor load and free RAM) can exhaust very soon. To avoid such problems, one can specify the amount of data shown in the charts independently.
To do so, one must choose the suitable value from the pop up list or enter it manually in the “Max bars in chart” field. The amount of bars to be stored in the hard disk is specified in the “Max bars in history” field. In future, this value will be used for testing of expert advisors. Any amount of bars can be specified here.
Attention:• At the closing of a chart, the amount of bars to be saved will not exceed that given in the “Max bars in history” field.• At the opening of a chart, the amount of bars to be downloaded will not exceed that given in the “Max bars in chart “ field.But the amount of bars in the chart can exceed this value during pumping of quotes.• Values of “Show Ask line”, “Show OHLC” and “Show period separators” specified in this window are default parameters. These parameters can be specified independently for each specific chart in the setup window.• Values of “Show trade levels”, “Color print” and “Save deleted charts to reopen” specified in this window influence all the charts and become active immediately after the “OK” button has been pressed.
c) Objects TabSettings for working with graphical objects are grouped in this tab. Graphical objects are all line studies placed in the toolbar having the same name and in the “Insert” menu. They consist of: technical indicators (including custom indicators), line studies, geometrical figures, texts, and icons. Parameters collected in this tab facilitate the work with graphical objects and cannot causecritical changes in the terminal operation.
Show Properties after CreationAll graphical objects possess certain properties. For example, it can be thickness and color of the trend line, period of the indicator signal line, etc. The most traders use standard settings of all graphical objects, but it is sometimes necessary to set them up individually. The “Show properties after creation” option allows to set up objects immediately after they have been imposed. It is suitable when there are many objects having individual settings on the chart.
Select Objects after CreationUnlike indicators, such objects as line studies, text, icons, and geometrical figures are positioned in charts manually. After an object has been imposed, there can a need occur to move it, for example, to precise the position of the trend line. To do so, the necessary object must be selected first. The “Select object after creation” option allows doing it immediately after the object has been imposed in the chart.
Select Objects by a Single Mouse ClickGraphical objects in the terminal can be selected by single or double clicking of the left mouse button. This option allows switching between methods of objects selection. If it is enabled, all objects will be selected by a single click. At that, the double click calls the window of the object properties. If this option is disabled, all objects will be selected by a double click.
MagnetThe terminal allows to “magnet” (anchor) checkpoints of objects to different bar prices to locate them more precisely. In the “Magnet sensitivity” field, the sensitivity of this option in pixels can be defined. For example, if the value of 10 is specified, the object will automatically be anchored to the bar if a checkpoint of the object is located within a radius of 10 pixels from the nearest bar price (OHLC). To disable this option, it is necessary to input parameter 0.
MT4 USER GUIDE

10
d) Trade TabSettings used for orders opening are grouped in this tab. Parameters input here facilitate opening of orders and cannot cause critical changes in the terminal operation.
Symbol by DefaultThe “Symbol by default” option allows to define the symbol value in the “Order” window automatically when a trading operation is performed. The “Automatic” parameter means that the active chart symbol will be set in this field, the “Last used”— the symbol of the latest trade operation. For the same symbol to be set repeatedly, the “Default” parameter must be enabled, and the necessary symbol chosen from the list.
Lots by DefaultIn the similar way, the initial amount of lots can be defined (“Lots by default” option): “Last used” is a parameter used i n the previous operation, and “by default” is a constant, manually set value.
DeviationThe symbol price can change within the ordering time. As a result, the price of the prepared order will not correspond with the market one, and position will not be opened. The “Deviation” option helps to avoid this. Maximum permissible deviation from the value given in the order can be specified in this field. If prices do not correspond, the program will modify the order by itself what allows opening a new position.
e) Expert Advisors TabSettings of working with Expert Advisors are grouped in this tab. Expert Advisors in the terminal are programs written in Meta- Quotes Language 4 and allowing to analyze and trade in the automatic mode (auto trading).
The description of how to create and use experts is given in the “Auto Trading” section. The given section describes only settings common for all experts:
Enable Expert AdvisorsThis option allows enabling or disabling the use of all expert advisors. If it is disabled, the start () function will not run for all expert advisors when a new tick incomes. At that, daggers will appear instead of smileys opposite the names of experts in the upper right corner of the chart. To enable expert advisors, it must be enabled and the “OK” button must be pressed. As soon as a new tick incomes, expert advisors will start working and daggers in the upper right corner of the chart will become smileys again.
Experts can be enabled or disabled by pressing of the of the “Standard” toolbar.
Attention:• This option is intended only for expert advisors, and itdoes not allow disabling custom indicators and scriptsautomatically.• This option does not influence any experts alreadyrunning, i.e., an expert will not be stopped during itsexecution of the start () function.
Disable experts when the account has been changedThis option represents a protective mechanism disabling expert advisors when the account is changed. It is useful, for example, when one changes demo account for a real one. For the mechanism to be enabled it must be enabled and the “OK” button must be pressed.
Disable experts when the profile has been changedA large amount of information about the current settings of all charts in the workspace is stored in profiles. Particularly, pro files contain information about experts attached. Experts included into the profile will start working when a new tick in comes. Having enabled this option, one can hinder the experts launching when the profile has been changed.
Allow live tradingExpert advisors are able to work independently, without any trader’s participation. They can both analyze the price changes and trade. This option is intended for limitation of trading performed by experts. This limitation can be useful to test analytical capacity of an expert in the real-time mode (not to be confused with testing of expert advisors on history data).
Manual confirmationThe “Manual confirmation” option is enabled only if live trading is enabled for expert advisors. If manual confirmation is en abled and expert attempts to perform a trade operation, it will be possible to confirm it or to interrupt manually. In other words, manual confirmation allows controlling the trading activity of the advisor. At that, the window of trade operations with all fields filled out appears. This can be useful for testing the expert advisor trading functions in the real - time mode (not to be confused with testing of expert advisors on history data).
MT4 USER GUIDE

11
Allow DLL importsTo enlarge their functionality, expert advisors can use DLLs (dynamic-links libraries). If it is enabled, such libraries can be used without any limitations. If this option is disabled, no expert can use external DLLs. It is recommended to disable import when working with unknown experts.
Confirm DLL function callsThis option will only be enabled if DLL imports have been allowed. It allows to perform manual control over execution of each function called. If it is disabled, import from external DLLs will not be controlled. It is recommended to enable this option when working with unknown libraries.
Allow external experts importsIf there is a need to import functions from other experts or MQL4 libraries during the expert advisor operation, this option must be enabled. If it is disabled, no one of the running experts will be able to request functions from other MQL4 programs. It is recommended to disable this option when working with unknown expert advisors.
Attention:Values of options named “Allow live trading”, “Ask manual confirmation”, “Allow DLL imports”, “Confirm DLL function calls”, and “Allow external experts imports” specified in this window are default parameters for MQL4 programs newly attached. They do not influence the operation of expert advisors, custom indicators and scripts already running.
f) Email TabIn this tab, the electronic mailbox is set up. Later on, these settings will be used to send message by the expert advisor command or by a triggered alert. To start setting up of email, the “Enable” must be enabled and the following fields must be filled out:
SMTP ServerAddress of the SMTP server and port used. This server will be utilized to send the message. The record must be made in the following format “[server web address] : [port number]”. For example, “smtp.your_email_provider. com:25” where “smtp.your_email_provider.com” is the server web address, “25” is the port number.
LoginA login to be authorized on the trade server. Normally, it is an electronic mailbox. Example: your_name@your_email_provider.com
PasswordA password to be authorized (mailbox access password).
FromThe email address, from which the message will be sent. In this field, there must be name and emailing address on the mail server, the SMTP of which will be utilized. The name usually coincides with the first part of the electronic address, but the name can be omitted. Example: your_name, your_name@your_email_provider.com
ToThe email address, to which the messages will be sent. The “Your Name” part of the address can be omitted. Generally, in the “To” field, any really existing email can be specified. Example: any_name, your_name@your_email_provider.com
Attention:Only one email address may be specified for either of fields “From” and “To”. Several emails given with or without separators will not be accepted.
The “Test” sends a test message using the settings specified to test their workability. If it has been tested successfully, the “OK” button must be pressed to apply these settings. In case the test did not succeed, it is recommended to check all settings again, restart the terminal and resend the test message.
g) Publisher TabTerminal allows publishing reports about the account status in internet automatically. To do so, one has to set up internet connection parameters through FTP (File Transfer Protocol).This can be done in the “Publisher” tab:
EnableEnable support reports publishing. If disabled, other fields are inaccessible;
AccountThe account number the report for which should be published;
Attention:Reports of only active accounts can be published. If the account number given in this field does not match with the current one, the reports will not be published.
Refresh everyPeriodicity of sending reports to the web server (in minutes);
MT4 USER GUIDE
12
FTP serverFTP servers address the report to be sent to. Example: ftp. your_domain_name.com
FTP pathName of the FTP server directory where the report will be placed. The path (starting with the root directory) for sending reports must be given in this field. Example: /report_shots
FTP loginLogin for authorization at the FTP server;
FTP passwordPassword for access to the FTP server;
Passive modeSwitch between active and passive mode of data transfer. In active mode, a free port (from dynamic range of 1024 to 65535) is allotted in the client terminal to which the server will connect in order to set connection for transferring of data.
The FTP server connects to the client’s port with the given number using TCP port 20 from its part to transfer data. In passive mode, the server informs the client about the TCP port number (from the dynamic range of 1024 to 65535) to which the client can connect to set up data transfer.
The main difference between active and passive FTP mode is the part that opens connection for data transferring. In active mode, it is the client who has to accept connection from the FTP server. In passive mode, the client initiates connection, and the server accepts it.
The “Test” button sends report about the current account status using the specified settings that allows checking their workabil- ity. If it has been tested successfully, the “OK” button must be pressed to activate these settings. If the test did not succeed, it is recommended to check all settings again and retest.
h) Events TabSignals of system events can be set up in the terminal (not to be mixed up with alerts). It is a very convenient tool informing about changes in the terminal status. Signals can be set up in this tab. For this to be done, the “Enable” option must be enabled first. At that, a table containing the list of system events and corresponding actions will become active. System events are:
ConnectConnection to the server. Signal of successful connection to the server;
DisconnectNo connection to the server. Signal of interrupted connection to the server;
Email NotifyNotifying by email. If this signal has triggered, it is recommended to check the “Terminal Mailbox” window;
TimeoutA certain time range is predefined for performing trade operations. If this range has been exceeded for some reason, the operation will not be performed, and this signal will trigger;
OKTrade operation has been successfully performed. No errors occurred during performing of this operation;
NewsReceiving of news. If this signal has triggered, it is recommended to check the “Terminal News” window;
Expert AdvisorThis signal triggers when an expert advisor is performing a trade operation;
Expert ConfirmationRequest to expert for confirmation of a trade operation. Such signal can only trigger if the “Manual confirmation” option is enabled;
Alert Performing of the Alert() function by an expert advisor;
RequotePrice changed during preparation of a trade operation;
Trailing StopTriggering of the order of the same name.
If there is a need to disable any of the signals, it is necessary to double click on its name or icon with the left mouse button. Another double click will activate it again. After the signal has been triggered, the file specified in the “Action” field of the corresponding event will run. A double click on the file name allows changing the file. After double clicking a pop up list of available files to be assigned for the event will appear. Selection
MT4 USER GUIDE

13
of any file from this list and further Enter button pressing means that it is assigned to the corresponding event. To confirm all changes made, one has to press the “OK” button.
Attention:Any file executable in the operation system can be assigned to the event.
C. USER INTERFACEInterface of the terminal includes the following components:
Common Window HeadingThe program heading includes the current account number, application name, as well as the active chart window name and its period (timeframe).
Main MenuAll commands and functions that can be executed in the client terminal are collected in its main menu. It contains: “File”, “View”, “Insert”, “Charts”, “Tools”, “Window”, “Help”. More details can be found in the “Main Menu” section.
ToolbarsFour toolbars are built into the terminal: “Standard”, “Charts”, “Line Studies”, and “Periodicity”. The toolbars contain duplicated commands and functions of the main menu. However, these toolbars are customizable, so one can collect only mostly used widgets in them. More details can be found in the “Toolbars” section.
Market WatchThis window contains the symbol list. Commands of this window allow controlling trade positions and charts. More details can be found in the “Market Watch” section.
Data WindowThis window shows information about prices, as well as indicators and expert advisors imposed. This data window does not allow performing any actions. More details can be found in the “Data Window” section.
NavigatorOpen accounts, expert advisors, indicators, and scripts are grouped in the navigation window. The “Navigator” can help to control them promptly. More details can be found in the “Navigator” section.
TerminalTerminal is a multifunctional window intended for working
with trade positions, news, account history, alerts, internal mail, and logs of the program and of expert advisors, as well. Moreover, the “Terminal” window allows opening and modifying orders of different kinds and managing trade positions. More details can be found in the “Terminal” section.
TesterThis window is intended for testing of expert advisors. Besides testing and viewing of various reports, the expert parameters can be optimized in this window, as well. More details can be found in the “Tester” section.
Tick ChartsA tick chart is the basis of data analysis. Besides price changes, various analytical objects can be located in the chart: line studies, technical and custom indicators, texts, and geometrical figures. More details can be found in the “Working with Charts” section.
Status BarFor additional information to be visualized, the status bar is used in the terminal. The status bar contains indicator of the server connection, names of active template and profile, as well as command prompts and price data.
Fast Navigation ToolsHot keys, acceleration keys, and fast navigation bar are intended for quick work with the terminal. Using of keys allows executing various commands of the program promptly, and the fast navigation bar makes it possible to move the chart along its time base precisely, change its time frame, and even the symbol itself. More details can be found in the “Fast Navigation Tools”.
a) Main Menu
The main menu of the terminal is located under the program heading and represents a set of sub-menus. Commands and functions to be executed in the client terminal are collected in it. The main menu consists of:
FileWorking with charts, storing of history data and profiles, and print.
ViewSetting of toolbar, managing of command windows (“Market Watch”, “Data Window”, “Navigator”, “Terminal”, “Tester”) and the program interface language.
MT4 USER GUIDE

14
InsertManaging of technical indicators, line studies, and other objects.
ChartsSetting of bars displaying, scale, managing of the imposed objects, presence of grid, chart properties.
ToolsGeneral settings of the client terminal, History Center, global variables, and MetaEditor (MetaQuotes Language 4 editor).
Window The list of open charts and their locations.
HelpUser guide and information about the program. File Menu Commands for working with charts, managing of profiles, storing of history data and charts are collected in this menu, as well as charts printing properties. The following commands are available in the menu:
New ChartOpens a new chart window for the symbol. At the command execution, the list of available symbols will appear. Having selected a symbol from the list, one can open a new chart. The same actions can be performed by the button of the “Standard” toolbar.
Open OfflineOpen a symbol chart offline. By this command, one will be able to select a necessary file with its history data being stored. At that, the new quotes for this symbol will not be shown in the chart. Offline chart opening can be useful at testing of expert advisors.
Open DeletedRestore a deleted chart. The deleted charts will be restored if the “Save deleted charts to reopen” is enabled in the terminal settings. All deleted charts templates are stored in the /DELETED directory. At this command execution, these templates are called, and the corresponding chart will be opened.
ProfilesOpen sub-menu for managing profiles. Profiles can be stored or deleted from this sub-menu, as well as previously stored ones can be downloaded. This profile managing sub-menu can also be called by the button of the “Standard” toolbar. More details can be found in the “Profiles and Templates” section.
CloseClose the current chart.
Save AsSaves history data as a text file in “CSV”, “PRN”, or “HTM” format.
Save As Picture... Save the chart in “BMP” or “GIF” format. The same actions can be performed by the chart context menu command of the same name.
Open an AccountOpens a new demo account. Such accounts can be opened without placing of any money onto the deposit and allow to test the own trading system well. To open an account, one can also execute the context menu command of the same name of the “Navigator - Accounts” window or press the Insert button.
LoginAuthorize. At this command execution, the terminal tries to connect to the server using the account selected. After sucessful authorization, quotes and news will start to income, and one can start trading. It is possible to authorize having executed the “Login” command of the context menu of the “Navigator — Accounts” window or double-click on the account name.
Print Setup... General setup of printing parameters - printing device, page size and orientation, etc.
Print PreviewPreviews the chart before printing it. The settings of the selected printer are used at this. This command helps to preview before printing whether all desired data can be printed with the settings given. The same actions can be per formed having pressed the button of the “Standard” toolbar or having executed the chart context menu command of the same name.
Print... Print a chart. If the “Color Print” option is enabled in the program settings, the chart can be printed in color, not as a black-and-white one.The same actions can be performed by pressing of the button of the “Standard” toolbar, accelerating buttons of Ctrl+P or by execution of the “Print” chart context menu command.
ExitThe terminal shutdown.
MT4 USER GUIDE

15
Attention:If the terminal is shut down, the expert advisors and Trailing Stops will not be executed.
View MenuCommands managing signal windows, toolbars, and the program interface language, are grouped in this window. Some of these commands are duplicated in the “Standard” toolbar. The following commands are available in the menu:
LanguagesCall the sub-menu managing languages of the Client Terminal. Having selected a desired language, one can switch the terminal interface to this language. For the changes to take effect, the program must be restarted.
ToolbarsCall the sub-menu managing toolbars. Active toolbars are checked. Selection of a toolbar allows enabling or disabling it. The “Customize...” command allows assigning any buttons for any toolbars. At that, a new window containing the list of toolbar elements available. The “Insert” and “Remove” buttons allow adding or removing an element from the toolbar. The “Up” and “Down” buttons are intended for defining the location of a button in the toolbar. To reset the toolbar to appear as initially, one has to press the “Reset” button.
Status BarEnable/disable status bar located in the lower part of the terminal window. This data bar contains (from left to right): menu managing profiles, time and prices of the bar selected, and indicator of server connection and amounts of incoming/ outgoing traffic. Having pressed on the current profile name, one can open the menu managing profiles. One can store or remove profiles in this menu, as well as download those previously stored. The sub-menu for managing of profiles can also be called by the “File — Profiles” menu command.
Charts BarEnable/disable the chart window names (tabs) bar located in the lower part of the workspace. Using this bar, one can switch among open charts fast.
Market WatchOpen/close the “Market Watch” signal window where the current quotes are published. The same action can be performed by accelerating buttons of Ctrl+M or by pressing the button of the “Standard” toolbar.
Data WindowOpen/close the “Data Window”. Prices of the bar selected and information about indicators imposed are published in this window. The same action can be performed with accelerating buttons of Ctrl+D or by the button of the “Standard” toolbar.
NavigatorOpen/close the “Navigator” window. Lists of open ac-counts, technical indicators, experts, custom indicators and scripts are located in the form of tree in this window. The same action can be performed with accelerating but-tons of Ctrl+N or by the button of the “Standard” toolbar.
TerminalOpen/close the “Terminal” window. One can manage orders and signals in this window, look through the account history,news,emails,journalofeventsandthatofexpertadvi-sors.Thesameactioncanbeperformed withacceleratingbut-tonsof Ctrl+T or by the button of the “Standard” toolbar.
Strategy TesterOpen/close the “Tester” window. This window is intended for testing and optimization of expert advisors. The same action can be performed with acceleration keys of Ctrl+R or the button of the “Standard” toolbar.
Full ScreenEnable/disable the full screen mode. As soon as this option is enabled, toolbars and status bar will be disabled and all signal windows will be closed. The client terminal heading, main menu, workspace (charts) and the charts windows tabs remain in the screen. The repeated execution of the command returns the terminal to the initial appearance. The same action can be performed with F11 button or by the button of the “Standard” toolbar.
Insert MenuObjects to be imposed on the chart are collected in the “Insert” menu. Among them are line studies and technical indicators, as well as geometrical figures, arrows, and texts. In the “Indicators” sub-menu, all built-in technical indicators are grouped. Having selected a name in the list, one can impose the indicator into the active chart. Line studies are grouped in the corresponding sub-menu: “Lines” — various lines, “Channels” — a set of channels, “Gann” — Gann’s tools, “Fibonacci” — tools based on Fibonacci numbers. Besides, “Andrews’ Pitchfork” and “Cycle Lines” that do not belong to any group are placed at the end of the list. More details on working with line studies can be found in the corresponding section.
MT4 USER GUIDE

16
Besides, the following can be imposed into the chart from this menu:
ShapesGeometrical figures (rectangle, triangle, ellipse) that allow to select various areas in the chart;
ArrowsSymbols (arrows, check signs, stop signs, price signs) that allow to select the most important points in the chart;
TextTexts intended for adding of comments to the chart. They are anchored to the chart and move together with the chart when it is scrolled;
Text LabelTexts intended for adding of comments and anchored to the window coordinates, not to the chart. At the chart scrolling, the text label will not move.
Attention:All commands of the “Insert” menu, except for the sub-menu managing indicators, are duplicated in the “Line Studies” toolbar.
Charts MenuCommands managing the chart and technical indicators imposed in it are collected in the “Charts” menu. The following commands are available in this menu:
Indicators List Call window managing indicators imposed in the active chart. The full list of indicators imposed (including Custom Indicators) is given in the window appeared. Having selected an indicator, one can change its settings or remove it from the chart. The same action can be performed by the chart context menu command of the same name or by accelerating keys of Ctrl+I;
ObjectsCall sub-menu managing imposed objects. The following commands are available in the sub-menu:
• Objects List — call window managing the imposedobjects. Objects include line studies, signs, shapes, andtexts. The selected object can be modified (the “Edit” button) or deleted by pressing of the button of the samename in this window. Besides, the “Show” commandmoves the active chart to the imposed object location;
• Delete Last — delete the last imposed object fromthe chart. The same action can be performed bypressing the Backspace button;
• Delete All Selected — delete all selected objectsfrom the chart window. The same action can beperformed by pressing the Delete button;
• Delete All Arrows — delete all objects from the chartwindow;
• Unselect All — unselect all the objects imposed inthe chart;
• Undo Delete — return the deleted object back intothe chart. The same action can be performed byaccelerating keys of Ctrl+Z;
Bar ChartDisplay the chart as a sequence of bars. Execution of this command is the same as pressing of the button of the “Charts” toolbar or accelerating keys of Alt+1;
CandlesticksDisplay the chart as a sequence of “candlesticks”. Execution of this command is the same as pressing of the button of the “Charts” toolbar or accelerating keys of Alt+2;
Line ChartDisplay the chart as a broken line connecting close prices of bars. Execution of this command is the same as pressing of the button of the “Charts” toolbar or accelerating keys of Alt+3;
Foreground ChartPut the chart as a “foreground”. If this function is enabled, all analytical objects (technical indicators and graphical objects) will be placed “behind the chart”, not over it;
PeriodicityChoose the chart timeframe. After this command has been executed, a sub-menu will appear where the active chart timeframe can be selected. The chart timeframe can also be changed with help of the “Periodicity” toolbar;
TemplateCall the template managing sub-menu. From this sub-menu, one can impose any template into the active chart. Moreover, a new template can be stored based on the active chart, or an existing one can be deleted.
MT4 USER GUIDE

17
Attention:The DEFAULT template cannot be deleted.
More details about working with templates can be found in the “Profiles and Templates” section.
The sub-menu managing templates can also be called by pressing of the button of the “Charts” toolbar or by the chart context menu command of the same name;
RefreshRefresh history data. At that, all missing data within the existing history will be downloaded. The same action can be performed by the chart context menu command of the same name;
Attention:History outside the range of the existing data will not be added.
GridShow/hide grid in the chart window. The same actions can be performed by the chart context menu command of the same name and by pressing of the accelerating keys of Ctrl+G;
VolumesShow/hide volumes in the chart. The same actions can be performed by the chart context menu command of the same name or by pressing of accelerating keys of Ctrl+L;
Auto ScrollEnable/disable automatic shifting of the chart to the left after a new bar has started to form. If this option is enabled, the last bar will always be shown in the chart.Execution of this command is the same as pressing of the button of the “Charts” toolbar;
Chart ShiftShift the chart from the left window border to the shift label of the chart. The shift label of the chart (a grey triangle in the upper part of the window) can be moved with the mouse horizontally within 10 to 50% of the window size.Execution of this command is the same as pressing of the button of the “Charts” toolbar;
Zoom InZoom in the chart. The same action can be performed by pressing of the “+” key or the button of the “Charts” toolbar, as well as by moving the cursor to the right, the left mouse
button being pressed on the horizontal scale;
Zoom OutZoom out the chart. The same action can be performed by pressing of the “-” key or the button of the “Charts” toolbar, as well as by moving the cursor to the left, the left mouse button being pressed on the horizontal scale;
Step by StepShift the chart by one bar to the left. The same action can be performed by pressing of F12;
Properties...Setting up the chart parameters. At this command execution, the chart setup window will appear. The same actions can be performed by the chart context menu command of the same name or by pressing of F8.
Attention:The most of the “Charts” menu commands are duplicated in the toolbar of the same name and in the chart context menu.
Tools MenuHousekeeping instructions and terminal settings are collected in the “Tools” menu. In this menu, one can:
New OrderCall the window managing orders. One can place market or pending orders from this window. More details about working with orders can be found in the corresponding section. The “Order” window can also be called by context menu commands of the “Market Watch” and “Terminal - Trading” windows, by mouse double-click on the symbol in the “Market Watch” window, by F9 button or by pressing of the button of the “Standard” toolbar;
History CenterCall the window managing history data. Quotes used for building of charts can be edited in History Center. This window can also be called by pressing of F2 button;
Global VariablesCall the window containing the list of the terminal global variables. Global are variables common for all expert advisors, custom indicators, and scripts. More details about global variables can be found in the corresponding section. The Global Variables window can also be called by F3 button;
MT4 USER GUIDE

18
MetaQuotes Language EditorOpen MetaEditor of expert advisors. Using the MetaEditor, one can create and edit experts, custom indicators, and scripts. More details on working with MetaEditor are given in the section of the same name. The MetaEditor can also be called by F4 button;
OptionsCall the client terminal setting window. One can set up parameters for connection, trades, charts, experts, and others, in this window. More details can be found in the “Client Terminal Settings” section. The Options window can also be called by accelerating keys of Ctrl+O.
Window MenuCommands managing the chart windows are collected in this menu. The way of charts arrangement in the workspace can be chosen or a new chart window can be opened from here:
New WindowCreate a new symbol chart window. At this command execution, a sub-menu will open that contains a list of sym- bols available. Having selected a symbol name from this list, one can open the corresponding chart. A new window can also be opened by pressing the button of the “Standard” toolbar or by the command of the “File - New Chart” menu;
CascadeArrange the chart windows in stages;
Tile HorizontallyArrange the chart windows horizontally;
Tile VerticallyArrange the chart windows vertically;
Arrange IconsArrange minimized windows. At that, windows of all open charts are minimized and located in the lower part of the workspace.This is useful when one works with a number of charts at the same time
A list of all open chart windows is located in the lower part of this menu. The current window is checked. To activate another chart, one has to select the corresponding symbol from this list.
Help MenuThe “Help” menu is auxiliary. Execution of this menu commands does not influence the terminal operation in any way. One can do the following from this menu:
Help TopicsOpen the in-built help files containing this present “User guide”. All settings and functions of the Client Terminal are described in it. F1 button performs the same action;
About... Open the “About...” window where one can find information about the company, its contact details, and the terminal version, as well.
b) Toolbars
There are four toolbars in-built into the terminal. The main commands used in the terminal are duplicated in the toolbars in form of buttons. Normally, the toolbars are placed under the main menu, but they can easily be moved in any program window area. Toolbars can be shown or hidden by the “View — Toolbars” menu command. All toolbars are customizable, what allows to place only necessary, often used commands in them. To set up a toolbar, one has to open its context menu (right mouse-button click) and execute the “Customize...” command. All commands are grouped in toolbars according to their functions:
StandardGeneral commands of terminal managing;
ChartsCommands for managing of charts;
Line StudiesManaging of objects to be imposed into charts;
PeriodicityManaging of the chart timeframes.
Standard ToolbarGeneral commands managing the terminal are collected in this toolbar:
Create a new symbol chart windowThe command opens the list of financial instruments (symbols). One can open a new chart having selected a necessary name in this list. The same actions are
MT4 USER GUIDE

19
performed after the “File - New Chart” and “Window - New Window” menu commands have been executed , as well as the context menu commands of the “Market Watch - Chart Window” window;
Menu used to manage profilesOne can activate a profile having selected it in this menu. A profile can be deleted in this menu, and a new profile can be stored based on the current chart windows configuration. More details can be found in the “Profiles and Templates” section.
Attention: The DEFAULT profile cannot be deleted.
To work with profiles, one can also execute the “File - Profiles” menu command;
Open/close the “Market Watch” windowThe current quotes for all available symbols are published in this window This window allows to open symbol charts and place orders. More details about working with this window are given in the “Market Watch” section. The “View - Market Watch” menu command and accelerating keys ofCtrl+M allow to open or close this window, as well;
Open/close data window named “Market Watch”Information about prices and indicators imposed is published in this window. More details about working with this window can be found in the “Data Window” section. The “View - Data Window” menu command and accelerating keys of Ctrl+D allow to open or close this window, as well;
Open/close the “Navigator” windowAll open accounts, available experts, technical indicators, and scripts are placed in this window. More details about working with this window can be found in the “Navigator” section. The “View - Navigator” menu command and accelerating keys of Ctrl+N allow to open or close this window, as well;
Open/close the “Terminal” windowThis window allows placing trading orders, viewing the account history, getting news, and many other things. More details about working with this window can be found in the “Terminal” section. The “View - Terminal” menu command and accelerating keys of Ctrl+T allow to open or close this window, as well;
Open/close the “Tester” windowThis window is intended for testing and optimization of expert advisors. More details about working with this window can be found in the “Strategy Testing” section. The “View - Strategy Tester” menu command;
Place a new orderThe command opens the window that allows to place a market or a pending order. More details can be found in the “Trading” section. This window can also be opened by the “Tools - New Order” menu command, the “Market Watch - New Order” window or “Terminal - Trading - New Order” window context menu commands, as well as by pressing of F9;
Launch MetaEditorThis editing program allows creating and editing expert advisors, custom indicators, scripts, and MQL 4 libraries. More details about working with this editing program can be found in the “MetaEditor” section and in its own help files. This action can also be performed by the “Tools - MetaQuotes Language Editor” menu command or bypressing of F4;
Enable expertsIf this option is disabled, no expert attached to the charts will be executed. Detailed description of working with experts can be found in the “Auto Trading” section. The “Enable Experts” option in the terminal settings performs the same action;
Call the window of terminal settingsAll basic settings of the terminal are made in this window. More details can be found in the section of the same name. The window of terminal settings can also be opened by the “Tools - Options” menu command or by pressing accelerating keys of Ctrl+O;
Enable/disable the full-screen modeWhen this option is enabled, toolbars and status bar are hidden, and all service windows are closed. The client terminal name, main menu, workspace (charts), and chart windows tabs remain in the screen. The repeated execution of this command will result in return to the initial status. The same actions can be performed by pressing F11 or by the “View — Full Screen” menu command;
Print the chartIf the “Color Printing” option is enabled in the program settings, the chart can be printed out in color, not as a
MT4 USER GUIDE
20
black-and-white one. The same action can be performed by the “File - Print...” menu command or by the chart context menu command of the same name;
Chart preview before it is printed outThe settings of the selected printer will be used at that. Thus, one can check before printing whether all desired data come onto the paper. The same action can be performed by the “File - Print Preview” menu command or by the chart context menu command of the same name;
Call the help filesAfter this button has been pressed, one should click on the desired interface element to call the corresponding help section. The help can also be called by the “Help - Help Topics” menu command or by pressing of F1.
Charts ToolbarCommands for managing of charts and technical indicators imposed in the charts are grouped in this toolbar. They include:
Display the chart as a sequence of bars (transform into the bar chart)The same action can be performed by the “Charts - Bar Chart” menu command or by pressing accelerating keys of Alt+1;
Display the chart as a sequence of candlesticks (transform into the candlestick chart)The same action can be performed by the “Charts - Candlesticks” menu command or by pressing accelerating keys of Alt+2;
Display the chart as a broken line (transform into the line chart)The same action can be performed by the “Charts - Line Chart” menu command or by pressing accelerating keys of Alt+3;
Zoom in the chartThe same action can be performed by the “Charts - Zoom In” menu command, the corresponding chart context menu command, or by pressing the “+” key;
Zoom out the chartThe same action can be performed by the “Charts - Zoom Out” menu command, the corresponding chart context menu command, or by pressing the “-” key;
Automatic scrolling of the chart to the latest barsIf this option is enabled, the latest bars will always be displayed in the screen. The same action can be performed by the “Charts - Auto Scroll” menu command;
Shift the chart from the window right border to the shift label of the chartThe chart shift label (a grey triangle in the upper part of the window) can be moved horizontally with the mouse within 10 to 50% of the window size. The same action can be performed by the “Charts - Chart Shift” menu command;
Call the sub-menu to manage indicatorsAll built-in technical indicators are grouped in it. Having chosen a name in the list, one can impose the indicator into the active chart. More details can be found in the “Technical Indicators” section. The same actions can be performed by the “Insert - Indicators” menu command;
Sub-menu to manage the chart periodsWhen a period is selected in this sub-menu, the corresponding changes will appear in the active chart. Switching among chart periods can be performed by the “Charts - Periodicity” menu command, the corresponding chart context menu command, or the corresponding buttons of the “Periodicity” toolbar;
Call the sub-menu to manage templatesAny template can be imposed into the active chart from this sub-menu. Moreover, a new template can be stored based on the active chart or an existing template can be deleted. More details about working with templates can be found in the “Templates and Profiles” section. The same actions can be performed by the “Charts - Template” menu command or the corresponding chart context menu command.
Attention:The most commands of the “Charts” toolbar are published in the menu of the same name and in the chart context menu.
Line Studies ToolbarLine Studies and graphical objects (geometrical shapes, signs, and texts) to be imposed into the chart are collected in the “Line Studies” toolbar. Commands of this toolbar (excluding the “Crosshair” and “Cursor”) are duplicated in the “Insert” menu. Working with line studies is described in details in the corresponding section. Other icons in this toolbar are intended for working with graphical objects and for changing the cursor operation mode:
MT4 USER GUIDE

21
Draw an ellipseThis shape helps to select various areas in the chart. More details about working with objects can be found in the section of the same name. The “Insert - Shapes - Ellipse” menu command allows to draw this figure, as well;
Draw a triangleThis shape helps to select various areas in the chart. More details about working with objects can be found in the section of the same name. The “Insert - Shapes - Triangle” menu command allows to draw this figure, as well;
Draw a rectangleThis shape helps to select various areas in the chart. More details about working with objects can be found in the section of the same name. The “Insert - Shapes - Rectangle” menu command allows to draw this figure, as well;
Add a text labelAfter this button has been pressed, one should select a point in the chart where the label should be placed. Unlike the text (described below), the text label is attached not to the chart, but to the chart window. When the chart is scrolled, the text label does not move. The “Insert - Text Label” menu command will also add comment into the chart;
Add a comment into the chartIt will be anchored directly to the chart. When the chart is scrolled, the text will move together with it. The “Insert - Text” menu command will also add comment into the chart;
Menu to manage graphical symbolsOne can add graphical signs into the chart or delete all the imposed signs from it using this menu. These objects can also be imposed into the chart by the “Insert - Arrows” menu command;
Menu to manage graphical symbolsOne can add graphical signs into the chart or delete all the imposed signs from it using this menu. These objects can also be imposed into the chart by the “Insert - Arrows” menu command;
CrosshairCursor in this mode allows you to highlight coordinates of the selected point in the chart or indicator window. This mode can only work within the active chart window. If, being in the “Crosshair” mode, one keeps the left mouse button pressed and moves the cursor, a line connecting these two
points will be drawn. The distance between the points and the current price value will be highlighted to the right of the second point of the line. This will look as [amount of bars between two points] / [amount of points between two points] / [the current price value in the second point]. This tool is named electronic ruler. Cursor can also be switched to the crosshair mode by pressing accelerating keys of Ctrl+F or the third mouse button;
Standard cursor (selection mode)The cursor in this mode allows to select various objects in the chart
Periodicity Toolbar
Switcher among the chart periods are grouped in this toolbarThe chart period will change in the active window after this toolbar buttons have been pressed. Just after that, the uploading of data for the selected symbol and period will start what can take some time.
c) Market Watch Window
The securities (symbols) for which the Client Terminal gets quotes from the server are listed in the “Market Watch” window. The data are represented in this window as a table having several fields. The “Symbol” field contains the security name, the fields of “Bid”, “Ask”, and “Time” show the corresponding prices and time of their income from the server. Values of the “Maximum” and “Minimum” fields are calculated on basis of price changes within a day. The “Market Watch” window can be opened/closed by pressing of accelerating keys of Ctrl+M, by the “View - Market Watch” menu command, or by pressing of the button of the “Standard” toolbar.
This window allows you to place market and pending orders and open new charts. At the right mouse button click in the “Market Watch” window, the context menu will appear where the following commands are available:
New OrderOpen the “New Order” window where one can prepare and place a market or a pending order for the symbol se- lected. At the order preparation, one can specify the Stop Loss and Take Profit levels. More details can be found in the “Positions Opening” section. The “New Order” window can also be opened by double clicking on the security name in the “Market Watch” window, by the “Tools - New
MT4 USER GUIDE
22
Order” menu command, by the “Terminal - Trade - New Order” window context menu command, the button of the “Standard” toolbar, or by pressing of F9;
Chart WindowOpen the chart of the symbol selected. More details about working with chart windows are given in the section of the same name. The symbol chart can also be opened by the “File — New Chart” and “Window — New Window” menu commands and by pressing of the button of the “Standard” toolbar;
Tick ChartOpen the tick chart of the symbol selected. Unlike normal charts, the tick chart is located directly in the “Market Watch” window. The tick chart of the selected symbol can also be viewed by switching to the tab of the same name in the same window;
HideDelete (hide) the symbol from the list. To minimize the traffic, it is recommended to hide unused securities from the quotes window by this command or by pressing of the Delete button.
Attention:If there are open positions or pending orders for the symbol, or its chart is open, the symbol cannot be deleted.
Hide AllDelete all symbols from the list. This command does not apply to securities for which there are open positions or the charts of which were opened in the current working session;
Show All Show the list of all available securities. After this command has been executed, quotes will income for all these symbols;
Symbols Call the window of the same name where there is a list of all available symbols. Symbols are grouped in the window according to their types. The “Show Symbol” command allows to add necessary symbols to the quotes window, and that of “Hide Symbol” — to delete a symbol from it. The “Properties” window command allows to view the symbol parameters;
SetsOpen the sub-menu that manages the symbol sets. The current set of symbols can be stored in this sub-menu, as well as delete or select an already existing one. This is very comfortable when working with securities of different types;
High/LowAdd the highest and the lowest values of the daily price to the quotes displayed;
TimeShow time of incoming quotes;
Auto ArrangeAutomatic arranging of columns when changing the window size. Auto Arrange can also be enabled by pressing A button;
GridShow/hide the grid separating columns. The grid can also be shown by pressing G button;
Popup PricesOpen an additional quotes window. The list of symbols in this window is the same as that in the “Market Watch” window at the moment of the command execution. This means that changes in the symbol list in the “Market Watch” window does not influence that in the “Popup Prices”. It is an information window, but trading operations can also be performed from it. To do so, one has to double-click with the left mouse button on the desired security. In the context menu of this window, there are commands allowing to set up data displaying parameters, enable the full screen mode, or locate the window over all others.
d) Data Window
This window is intended for displaying of price information (OHLC), date and time of the bar, and the indicators (including custom ones) used. “Data Window” is an information window and it does not allow you to perform any actions. The desired information about a certain bar and the imposed indicators can be obtained here promptly. To do so, it is sufficient to place the cursor over the necessary bar. Context menu commands of this window allow:
CopyCopy data from this window into the clipboard for further use in other applications. The same action can be performed by pressing of accelerating keys of Ctrl+C;
MT4 USER GUIDE
23
Last DataShow/hide the latest data column. At that, an additional column containing the last bar data will appear in the window;
Auto ArrangeSet up the column size automatically when the window size changes;
GridShow/hide grid to separate columns;
ShowShow/hide information fields. Any of the bar prices (OHLC), date or volume can be selected in the sub-menu that appears. If the element has not been checked, it will not be shown.
Attention:Any indicator can be set up (the “Visualization” tab in the indicator properties window) in such a way that its data will not be shown in this window.
e) Navigator WindowThis window allows you to get a quick access to various features of the terminal. This window can be opened/closed by pressing accelerating keys of Ctrl+N, by the “View - Navigator” menu command, or by pressing of the button of the “Standard” toolbar.
The list of features is listed as a tree and contains five groups: “Accounts”, “Indicators”, “Expert Advisors”, “Custom Indicators”, and “Scripts”. The “Accounts” group includes the list of open accounts. Using a context menu, one can open a new demo account or delete the old one. An unlimited amount of demo accounts can be opened from the terminal. To do so, one has to execute the “Open an Account” context menu command or press the Insert button. More details about opening of accounts can be found in the corresponding section. To authorize an existing account (whether a demo or a real one), one has to execute the “Login” command or double-click with the left mouse button on the desired account line.
Attention:Real accounts cannot be started from the terminal; they are opened only by a brokerage company.
The “Indicators” group includes the list of built-in technical indicators. They represent the main tools for analyzing the price dynamics. Double-clicking with the left mouse button or the “Attach to a chart” context menu command
allows imposing the indicator selected into the active chart. Besides, one can impose an analytical tool in any chart or window of an indicator already imposed, using the “Drag’n’Drop” technique. More details can be found in the “Technical Indicators” section.
The “Expert Advisors” group contains the list of all available expert advisors. Expert Advisors in the terminal are programs allowing you to automate analytical and trading activities. To create and modify them, the built-in editor, MetaEditor, is used. More details about creation and working with experts can be found in the “Auto Trading” section.
The “Create” context menu command allows to create a new expert, “Modify” to modify an existing one, and “Delete” to delete an expert from the terminal. The “Attach to a Chart” command or double-click with the left mouse button allow to impose the expert into the active chart. After that, when a new tick incomes, the expert will start working. Experts can be imposed into any chart with the “Drag’n’Drop” technique. Experts’ icons colored in grey mean that these experts cannot be used. Such expert must be compiled first.
The “Custom Indicators” group includes the list of all available custom indicators (counterparts of built-in technical indicators), and the “Scripts” group contains the list of available scripts (programs executed only once). Custom indicators and scripts are managed by using of the context menu similar to that of experts. More details can be found in the sections of “Custom Indicators” and “Scripts”.
Hot keys can be assigned to call any elements of the “Navigator” window, except for those in the “Accounts” group. To set a hot key for an element, one has to execute the “Set hotkey” command of this element’s context menu. The hot keys set have a higher priority being compared to those predefined. For example, Ctrl+O is predefined to call the terminal setting window. If this pair of keys is set to call the On Balance Volume indicator, the terminal setting window will not be called by pressing of Ctrl+O anymore.
Favorites TabThe “Favorites” tab is intended for a quick access to objects mostly used. In this tab, for example, only necessary accounts, indicators, scripts, and experts can be placed. This allows you to accelerate the trader’s work, especially, if there is a need to act promptly. To move a necessary object into the “Favorites” tab, one has to execute the corresponding context menu command. If the object is not necessary anymore, it can be deleted from the tab using the
MT4 USER GUIDE

24
“Delete from favorites” context menu command.
Attention:All objects included in the “Favorites” can function without any limitations. All managing commands placed in the context menu can also be called directly from this tab.
f) Terminal Window
“Terminal” is a multifunctional window allowing to access to various terminal features. This window allows to control over trading activities, view news and account history, set up alerts, and work with the internal mail and system journal. The window can be opened by the “View - Terminals” menu command, by pressing of accelerating keys of Ctrl+T, or the button of the “Standard” toolbar. There are several tabs in the window:
TradeIn this tab, one can view the status of open positions and pending orders, as well as manage all trading activities. Besides, the total financial result for all open positions is published in this tab;
Account HistoryHistory for all performed trade operations and balance without taking open positions into consideration are published here. The efficiency of all trade activities can be estimated with the results given in this tab;
NewsAll financial news incoming in the terminal can be viewed from this tab. This prompt information is indispensable for fundamental analysis;
AlertsVarious alerts can be viewed and set here. Any files executable in the operational environment (including wave files) and messages to be sent by email can be used as alerts;
MailboxAll message income in the terminal by internal email are stored here. Electronic messages are sent from here, as well;
Expert AdvisorsInformation about functioning of the attached expert, including opening/closing of positions, order modifying, the expert’s own messages, etc., are published in this tab;
JournalInformation about terminal launching and about events during its operation, including all trade operations performed, is stored in the journal.
Attention:Some tabs of the “Terminal” window can be absent. This means that they are empty at the moment. For example, the “Expert Advisors” tab will be hidden until a message from MQL4 program incomes.
Trade TabThe “Trade” tab contains information about the current status of the trading account, about open positions and pending orders placed. All open positions can be sorted by any field. Then there is a line of the account balance and financial result of open positions followed by the list of pending orders. When a pending order triggers, a new position will be opened and the pending order line will be replaced with that of the position opened.
All trade operations are displayed as a table having the following fields (from left to right):
OrderThe operation ticket number. It is a unique number of the trade operation;
TimeTime of position opening. The time is represented as YYYY. MM.DD HH:MM (year.month.day hour: minute). This is thetime at which the position was opened;
TypeType of the trade operation. There are several types of trading operations that can appear here: “Buy” - long position, “Sell” - short position, and pending orders named Sell Stop, Sell Limit, Buy Stop, and Buy Limit;
LotsThe amount of lots participating in operation. The minimum amount of lots to participate in operations is defined by the brokerage company, and the maximum is limited by the deposit size;
SymbolThis field displays the name of the security participating in the trade operation;
MT4 USER GUIDE

25
PricePrice of position opening (no to be mixed up with the current price described below). This is the price at which the posi-tion was opened;
S/LThe placed Stop Loss order level. If the order has not been placed, a zero value will be written in this field. More details about working with orders can be found in the corresponding section;
PriceThe current price of the security (not to be mixed up with that of position opening described above);
CommissionCommissions charged by the brokerage company at preforming trade operations are written in this field;
SwapCharging of swaps is stored in this cell;
ProfitThe financial result of the transaction made will be written in this field taking the current price into consideration. Positive result means that the transaction was profitable, and negative one means that it was unprofitable;
CommentsComments on trade operations are stored in this column. A comment can only be written at the position opening or at placing of an order. Comment cannot be changed at order or position modifying. Besides, the brokerage company can store a comment to a trade operation, as well.
This tab allows not only to view the open positions and placed orders, but to manage trading activities. One can do the following here: open a new position, place a pending order, modify or delete it, and close a position. To do all this, one has to use the following context menu commands:
• New OrderA new order. The orders managing window will appearat this command. A new position can be opened and apending order can be placed in it. At that, the followingmust be specified: the security, amount of lots, ordertype (market order or a pending one), as well as StopLoss and Take Profit order levels. More details about placing of orders can be found in the “Control over TradePositions” section;
• Close OrderClose a trade position. This command becomes activeonly if the context menu has been called at an openposition. The order managing window appears at thiscommand, as well. This window displays not only “Sell”and “Buy” buttons, but also the “Close#XXXXXXX ...”button (where XXXXXXX is the position ticket number).Besides, having executed this command, one can closethe selected positions together with the hedged ones.More details about closing of positions can be found inthe corresponding section;
• Modify or Delete OrderChange the “Stop Loss” and “Take Profit” values of openpositions or the pending order price. If the Stop Loss andTake Profit levels specified are too close to the current price, the error message will appear, and the levelswill not be placed. Their values must be changed to benot so close to the current price, and then they can beplaced again. More details about modifying of orders canbe found in the section of the same name;
Trailing StopPlace, modify, or delete the “Trailing Stop” level. Having selected the corresponding level in the menu, one can activate the trailing stop with the given parameter. The “None” value is used for disabling of the order. “Delete All” disable all trailing stops. More details about trailing stops are given in the “Trailing Stop” section;
ProfitShow profit/loss as points, as term currency, or as deposit currency. Changes in this parameter are displayed in the “Profit” field. If the parameter of “show profit in the term currency” (quote currency) is selected had, there are, for example, open positions for USDJPY, the profit will be shown in Japanese Yens;
CommissionsShow/ hide the “Commissions” column where the commission for each of the performed trade operations will be displayed;
CommentsShow/ hide the “Comment” column. Comments to trade operations are written in this column. A comment can be written only if a position is being opened or an order is being placed. It cannot be changed at modifying of an order or of a position. Besides, the brokerage company can write a comment to a trade operation;
MT4 USER GUIDE
26
Auto ArrangeAutomatic arrangement of columns at changing of the window size;
Grid Show/ hide grid to separate columns.
Accelerating keys of Ctrl+F9 switch the focus in the “Terminal - Trade” window. After they have been pressed, one can trade with the keyboard
Account History Tab
Information about all trade operations performed is stored in the “Account History” tab. The entire history is displayed as a table with the following fields (from left to right):
OrderOperation ticket number. It is the unique number of a trade operation;
TimeTime of position opening. It is given in YYYY.MM.DD HH:MM (year.month.day hour: minute) format. This is the time when the position was opened;
TypeTrade operation type. Only three types of trade operations can be found here: “Balance” - entering of funds in the account, “Buy” - a long position, and “Sell” - a short position;
SymbolThis field shows the name of the security participated in the operation;
PricePrice of position opening. This is the price at which the position was opened;
S/LLevel of the Stop Loss order placed. If a trade position was closed by this order, its corresponding cell will be colored in red, and “[s/l]” will appear in the field of comments. If no order was placed, zero value will appear in this field. On the other hand, if the an order was placed, but did not trigger, its value will still be shown in this field. At that, the cell will not be colored, and no “[s/l]” will be output in the field of comments. More details about working with orders are given in the corresponding section;
T/PLevel of the Take Profit order placed. If a trade position was closed by this order, its corresponding cell will be colored in green, and “[t/p]” will appear in the field of comments. If no order was placed, zero value will appear in this field. On the other hand, if the an order was placed, but did not trigger, its value will still be shown in this field. At that, the cell will not be colored, and no “[t/p]” will be output in the field of comments. More details about working with orders are given in the corresponding section;
TimeTime of position closing. It is given in YYYY.MM.DD HH:MM (year.month.day hour: minute) format. This is the time when the position was closed;
PricePrice of position closing. This is the price at which the position was closed;
CommissionCommissions charged by the brokerage company when trade operations are performed will be stored in this field;
SwapThe swaps charged are stored in this field;
ProfitThe financial result of transaction will be written in this field. Positive number means that the transaction was profit able, and the negative one does vice versa. The profit is shown only in the deposit currency here, unlike it is in the field of the same name in the “Trade” tab.
CommentsComments on trade operations are stored in this column. A comment can be input only at opening of a position or placing an order. The comment cannot be changed when an order or a position are being modified. Besides, a comment to thetrade operation can be input by the brokerage company
Context MenuCommands allowing you to manage the history range and data performance, as well as commands of history data export are grouped in the context menu:
All HistoryShow the entire account history. At this command execution, the whole financial history of the account will appear in the screen without any limitations by time;
MT4 USER GUIDE

27
Last 3 MonthsShow only the last 3-months history;
Last MonthShow only the last month history;
Custom PeriodShow history for the selected period. At this command execution, the window that manages the history range will appear where one can select one of the pre-defined ranges (the “Period” field) or specify them manually in the fields of “From” and “to”;
Save as ReportSave the account history as a HTML file. At that, a window allowing to select a path for saving of the file will appear;
Save as Detailed ReportSave the account history as a HTML file. A detailed report differs from a normal one for an additional set of parameters. After this command has been executed, a window allowing to select a path for saving the file will appear;
CommissionsShow/hide the “Commissions” column;
CommentsShow/hide the “Comments” column. Comments to trade operations are stored in this column. A comment can only be input at opening of a position or at placing of an order. Besides, the brokerage company can write a comment to the trade operation, as well;
Auto ArrangeAutomatic arrangement of column sizes at changing of the window size;
GridShow/hide grid for separating of columns.
News TabThe list of income news is stored in the “News” tab. The news topics are represented as a table and arranged according to the incoming time. The news incoming time, its topic and category are published in the table. This list is updated automatically at incoming of the latest news.
The following commands are available in the context menu:
ViewView the selected news. One can also read news by double-click with the left mouse button on the topic;
CopyCopy the news to the clipboard;
CategoryShow/hide the “Category” column;
Auto ArrangeAutomatic arrangement of columns when changing of the window size;GridShow/hide grid to separate columns.
Attention:• If there is no “News” tab in the “Terminal” window, it meansthat no news have income yet.• If the “Enable news” option is disabled in terminal settings,news will not income.• If the given account has no appropriate rights, this can be oneof the reasons why news do not income or cannot be viewed.
Alerts TabThis tab contains information about created alerts. The alerts are intended for signaling about events in the market. Having created alerts, one may leave the monitor as the client terminal will automatically inform about the server event.
All alerts in this tab are represented as a table with the following fields:
SymbolSecurity the data on which are used to check for the condition specified. If the “Time=” parameter (alert triggering at the pre-defined time) was selected as a condition, the symbol does not matter;
ConditionCondition under which the alert will trigger. The following can be used as such a condition:
1. Bid> - the Bid price is higher than the specifiedvalue. If the current Bid price exceeds the givenvalue, the alert will trigger;
2. Bid< - the Bid price is lower than the specified
MT4 USER GUIDE

28
value. If the current Bid price goes under the given value, the alert will trigger;
3. Ask> - the Ask price is higher than the specifiedvalue. If the current Ask price exceeds the givenvalue, the alert will trigger;
4. Ask< - the Ask price is lower than the specifiedvalue. If the current Ask price goes under the givenvalue, the alert will trigger;
5. Time= - time is equal to the given value. As soonas this time comes, the alert will trigger.
Counter The amount of alert triggerings;
LimitМaximum permissible amount of the alert triggerings Having triggered this given amount of times, the alert will stop triggering;
TimeoutТhe period of time between alert triggerings;
EventТhe action to be performed. This can be an audio signal, a file executable in operational environment, or a message sent by email.
Alerts ManagementThe following context menu commands are intended for managing of alerts:
CreateCreate a new alert. The same action can be performed by pressing of the Insert key;
ModifyEdit the alert. The same action can be performed by double-clicking on the alert name in the table or by pressing of the Enter key;
Delete Delete the alert. This action can also be performed by pressing of the Delete key;
Enable On/OffEnable/disable the alert. The alert will not be deleted when disabled, but it stops to trigger. It can be enabled later. The same action can be performed by pressing the Space key or enabling in the alert setup window (described below).
Attention:To manage alerts with the keyboard, one should activate this window first. To do so, it is necessary to click with the left mouse button in the window.
One can start modifying of the alert by double-clicking of the left mouse button in the alert information line. In this case, as well as at execution of the “Modify” and “Create” context menu commands, the alert editor window will appear:
EnableAlert on/off. When the alert is off, it is not deleted, but it will stop functioning. This option is similar to the “Enable On/Off” context menu command and pressing of the Space key;ActionAssign an action to be performed when an event happens: play a sound, run a file, or send an email.
When playing a sound or running a file, one should specify the corresponding files. At sending of a message, one should specify the topic and text of the message;
SymbolSecurity the values of which will be used to check the condition;
ConditionCondition (“Time=”, “Bid<”, “Bid>”, “Ask<”, “Ask>”) under which the alert will trigger;
ValueCheck value of the condition. If the symbol price is equal to this value, the alert will trigger;
Source The alert. When a sound is played or a file is run, one should specify the path to the corresponding file. When a message is sent by email, one should input the message. It must be noted that one should set up email parameters for sending message;
TimeoutThe time period between alert triggerings;
Maximum iterationsMaximum amount of times the alert repeats triggering.
The “Test” button allows you to check the usability of the selected alert. For changes to come into effect, one must press the “OK” button.
MT4 USER GUIDE
29
Attention:To send messages about events happened, one has to set up mailbox parameters in the program settings.
MailboxThe “Mailbox” is intended for working with the internal mailing system. It is in this window of the “Terminal” where all electronic messages that income to the terminal are stored. They are represented as a table with the following fields:• Time - the time of the news incoming;• From - the sender name;• Headline - the headline of the message.
Using a double-click with the left mouse button on the necessary headline or the “View” context menu command, one can view the content of the selected message, and one can delete a message using the “Delete” command. Besides, if the brokerage company permits it, one can send messages to the systems administrator or to technical support service from this tab. To do so, one has to execute the “Create” context menu command, then select a receiver in the appearing window, head the message, write its text, and press the “Send” button.
Attention:All messages are sent by internal mailing system and do not require any additional settings. If any problems occur when using the mailbox, it is recommended to refer to the technical support service.
ExpertsThe “Experts” contains the entire information about the attached expert, including opening/closing of positions, modifying of orders, the expert’s own messages, etc. There are only latest messages in the window. To view the earlier messages, one has to execute the “Open” context menu command and select the desired file. Files of the experts logs are stored in the /EXPERTS/LOGS directory, filenames correspond with the log date - YYYYMMDD. LOG. To copy a message to the clipboard, one has to execute the context menu command of the same name.
Expert Properties WindowParameters of the virtual account and the expert advisor under test can be set up in this window. These data will later be used for testing or optimization of the expert parameters. There are three tabs in the window:
Testing Parameters common for both testing and optimizations are placed in this tab. These are volume and currency of initial deposit that are given in the fields of the corresponding names. Types of positions to be opened at testing can be selected, as well: “Only Long” open only long positions; “Only Short” only short ones; “Long and Short” open both types of positions. Whatever expert mechanisms are used, they will open positions only as set here;
InputsThe list of all inputs is given here as a table. Inputs are variables that influence the expert work and can be changed directly from the client terminal. The amount thereof can vary from expert to expert. The current data to be used at testing of an expert will be written in the “Value” field. Data to be written in the fields of “Start”, “Step” and “Stop” do not influence the expert testing, and are only used for its optimization. Initial value of the variable, step of change, and final value are written in this field. At optimization, expert with parameters within the range between initial and final values will be passed consecutively. Checking from the right of the variable names allows including the parameter into optimization process. If a variable has not been checked, it will not participate in optimization. Its value will not be changed in the optimization process, and the parameter written in the “Value” field will be used.
There is an opportunity to download a set of inputs already saved before (including the values of “Start”, “Step”, and “Stop”). This can be done by pressing of the “Load” button and after the preliminarily saved set of inputs has been selected. The actual set of external variables can be saved by pressing of the button of the same name.
Attention:It is recommended to include only necessary variables into optimization process. If too many variables are included into it, the amount of passes and total optimization time will rapidly increase.
OptimizationThis tab allows to manage optimization limits. If the real values meet those required in this tab, the current pass will be stopped and the next pass will start. Parameters limiting testing at optimization of the expert are:
1. Balance minimum — minimum balance value in thedeposit currency;
MT4 USER GUIDE

30
2. Profit maximum - maximal profit in the depositcurrency;3. Minimal margin level, % - minimal level of margin inper cents;4. Maximal drawdown, % - maximal drawdown in percents;5. Consecutive loss - maximal total loss in oneseries of trades. A loss series is a certain amount ofconsecutive loss trades;6. Consecutive loss trades - maximal amount of losstrades in one series;7. Consecutive win - maximal total win in oneseries of trades. A win series is a certain amount ofconsecutive win trades;8. Consecutive win trades - maximal amount of wintrades in one series.
More details are given in the sections of “Testing of Expert Advisors” and “Optimization”.
JournalThe “Journal” tab contains information about the stated actions of the trader and the client terminal within the current session. Information about terminal launching and about events during its working, including all trade operations, is stated in journal. There are only the latest messages in the window. To view the earlier messages, one has to execute the “Open” context menu command and select the desired file. The files of the client terminal journal are stored in the /LOGS directory, the filename corresponds with the journal date - YYYYMMDD.LOG. To copy the message to the clipboard, one has to execute the context menu command of the same name.
g) Tester Window
“Tester” is a multifunctional window that allows you to test strategies and optimize parameters of expert advisors.
When being tested, the expert is passed on the modeled data one time what allows to estimate its profitability and effectiveness. For optimization purposes, the mechanical trading system is passed many times in order to find out such parameters of the expert at which its profitability is the highest.
The window can be called by the “View - Strategy Tester” menu command, by pressing of accelerating keys of Ctrl+R, or the button of the “Standard” toolbar. There are several tabs in this window:
SettingsSettings of testing and optimization. The parameters of expert advisors, period to be tested, the method of bars modeling, and many other things, can be set up in this tab;
ResultsThe results of trade operations performed by the expert, as well as the direction of balance changes;
GraphDisplaying of testing results in a graph;
ReportThe detailed testing report. Many indications of testing and effectiveness of experts can be found here: the amount of bars modeled, the total profit, the most profitable and unprofitable positions, the amount of profit and loss trades, etc.;
JournalA log where all actions and internal messages of the expert are recorded;
Optimization ResultsInformation about every pass, including inputs, profitability, draw downs, and other data;
Optimization GraphThe results of expert optimization as a graph. Besides each pass profitability, the amount of profit and loss trades is displayed in the graph.
As in the “Terminal” window, some tabs of the “Tester” window are hidden if they are empty. So, initially, only the tabs of “Settings” and “Journal” can be seen in this window. The tabs of “Results”, “Graph”, and “Report”, will only appear after an expert has been tested. After it has also been optimized, the tabs of “Optimization Results” and “Optimization Graph” will appear. More detailed information about testing of experts can be found in the section of the same name.
SettingsTesting parameters and experts optimization parameters can be set up in this tab. At testing, the expert is passed on the modeled data one time what allows to determine the profitability and efficiency thereof. At optimization, the mechanical trading system is passed several times with the purpose of determining of such expert parameters at which its profitability is the highest. The following commands and options are available in this tab:
MT4 USER GUIDE

31
Expert AdvisorSelect the expert to be tested in the list. The expert must be compiled and placed in the /EXPERTS directory. All newly created experts will be automatically placed into this directory;
SymbolSelect one of the securities available;
PeriodSelect the symbol timeframe;
Model Select the method of bars modeling:
1. Every tick (based on all available least timeframeswith fractal interpolation of every tick);2. Control points (based on the nearest lesstimeframe with fractal interpolation of 12 control points);3. Open prices only (fastest method to analyze thebar just completed);
Use dateUse range of dates when testing. If this option is enabled, the data from the given range will be used during testing. Otherwise, all available data for the given symbol and period are used;
OptimizationEnable the expert parameters optimization mode. More details about expert parameters optimization can be found in the section of the same name;
Expert propertiesOpen the “Expert Properties” window that allows to manage the expert parameters when testing and optimizing;
Symbol propertiesView the symbol parameters. These data are given in the *.FXT file heading and used to emulate the server operation;
Open chart Create a new chart window for the symbol selected for testing. When being tested, the expert works with a virtual chart. Signs of opening and closing of positions, objects and indicators used by the expert, are imposed in this chart. This chart can be opened only after the expert has been tested. For opening of a virtual chart, the TESTER.TPL template is used, and, if it is not available, the default settings are used;
Modify expertOpen the “MetaEditor” and start to edit the selected expert. This is useful if there is a need to introduce small changes and recompile the expert fast;
StartStart testing or optimization. After this button has been pressed, one can estimate the speed of testing or optimization in progress bar in the lower part of the window. After the testing has been started, the “Start” button will be replaced with the “Stop” button. Having pressed this button during testing/optimization, one can stop the process. More details about testing of experts can be found in the section of the same name.
Results TabThe testing results are represented as a table in this tab. Information about all trade operations performed within the testing process can be found here:
#The sequence number of the trade operation;
TimeTime of the trade operation;
TypeThe type of operation performed (sell, buy, s/l, t/p, modify, close at stop, etc.);
Order The ticket number of a trading position or a pending order (not to be mixed up with the trade operation number de- scribed above);
LotsThe amount of lots that participated in the operation;
PriceThe price of the security at the operation performing;
S/LThe Stop Loss order value. No entries in this field mean that no order was placed;
T/PThe Take Profit order value. No entries in this field mean that no order was placed;
MT4 USER GUIDE

32
ProfitProfit/loss. The value of profit/loss will be entered only after positions have been closed;
BalanceThe value of balance. This value will be entered only after positions have been closed.
Having clicked with the left mouse button on any column heading, one can sort all entries in the table in descending or ascending order. Using the “Copy” context menu command or accelerating keys of Ctrl+C, one can copy the selected lines of results to the clipboard for further use in other applications. If no line has been selected, the entire table will be copied to the clipboard. To copy the entire table to the clipboard, one can execute the “Copy all” command. The report about testing results can be stored in a HTML file on the hard disk. To do so, one has to execute the “Save as Report” context menu command. The “Set Date “From”” and “Set Date “To”” commands allow to specify the time range for testing. At that, the dates of the selected operations will be written in the fields of “Use date from:” and “Use date to:” in testing settings. This useful if there is a need to test an expert thoroughly or to optimize its parameters within this given range.More details are given in the sections of “Tester” and “Optimization”.
GraphIn the “Graph” tab, the graphs of the account balance (blue line - “Balance”) and general account status considering open positions (green line - “Lots”) are drawn automatically. If only balance line is shown in the graph, it means that “Balance” and “Lots” lines coincide during the whole testing process. The graph allows you to watch the trade results more pictorially when testing. If the lot sizes have been changed during testing, the bar chart showing these changes will appear in the lower part of the graph.
Double click with the left mouse button on any point of the graph will switch to the “Results” tab and select the corresponding line. Using the “Copy” context menu command or accelerating keys of Ctrl+C, one can copy the graph to the clipboard for further use in other applications. The graph can also be stored as a GIF file on the hard disk. To do so, one has to execute the “Save as Picture” context menu command or press the accelerating keys of Ctrl+S. The “Set Date “From”” and “Set Date “To”” commands allow setting the time range of testing.
At that, the dates of operations selected are written in the fields of “Use Date From:” and “Use Date To:” in the Settings tab. This is useful if there is a need to test an expert or to optimize its parameters for this given time range.
More details are given in the sections of “Testing of Expert Advisors” and “Optimization”.
Report TabThe summarized results of experts testing and some key indices are represented in the “Report” tab. Such reports allow comparing different experts to each other in a quick mode. The following data are published in reports:
Bars in testThe amount of the modeled history data in bars;
Ticks modeledThe amount of the modeled ticks;
Modeling qualityThe quality of ticks modeled during testing in per cents. Modeling is schematically displayed as a band in the next line of the report. This band can be of one of three colors:
1. Bars in test - the amount of the modeled historydata in bars;2. Red - modeling was not performed within this subrange since no data of a smaller period were available.At that, only data from the period selected in the testersettings were used;3. Green - modeling was performed within this subrange. At that, the brighter the color is the better inquality the modeling was. For example, when testingat the period of H1, the dark-green band can meanthat M30-period data were used for testing, and thebrightest means that those of M1 period were used;
Attention:If the fastest method (“by open prices”) has been used for modeling in testing settings, the entire band will be red. At that, “n/a” - modeling has not been performed at all - will be written in the “Modeling quality” field;
Initial depositThe volume of the initial deposit;
Total net profitFinancial result of all trades. This index represents a
MT4 USER GUIDE

33
difference between the “Gross profit” and “Gross loss”;
Gross profitThe sum of all profitable trades in terms of money;
Gross lossThe sum of all unprofitable trades in terms of money;
Profit factorThe ratio between gross profit and gross loss in per cents. The one value means that profit equals to loss;
Expected payoffThe expected payoff. This statistically calculated index represents the average profit/loss factor of a trade. It can also be considered for representing the expected profit/loss factor of the next trade;
Absolute drawdownThe largest loss is lower than the initial deposit value;
Maximal drawdown (%)Maximal loss of the local maximum in the deposit currency and in percents of the deposit;
Total tradesThe total amount of trade positions;
Short positions (won %) The amount of short positions and percentage of won thereof;
Long positions (won %) The amount of long positions and percentage of won thereof;
Profit trades (% of total) The amount of profitable trade positions and their percentage in the total trades;
Loss trades (% of total) The amount of profitable trade positions and their percentage in the total trades;
Largest profit trade The largest profit among all profitable positions;
Largest loss trade The largest loss among all unprofitable positions;
Average profit trade Average profit value for a trade (the sum of profits divided by the amount of profitable trades);
Average loss tradeAverage loss value for a trade (the sum of losses divided by the amount of unprofitable trades);
Maximum consecutive wins (profit in money)The longest series of profitable trade positions and the sum of their wins;
Maximum consecutive losses (loss in money) The longest series of unprofitable trade positions and the sum of their losses;
Maximal consecutive profit (count of wins) The maximum profit of a series of profitable trades and the amount of profitable trades corresponding with it;
Maximal consecutive loss (count of losses) The maximum loss of a series of unprofitable trades and the amount of unprofitable trades corresponding with it;
Average consecutive winsThe average amount of profitable positions in consecutive profitable series;
Average consecutive lossesThe average amount of unprofitable positions in consecutive unprofitable series.
This report can be copied to the clipboard or saved in the hard disk as an HTML file. To do so, one has to execute the “Copy” context menu command or that of “Save as Report”, respectively. The report can also be copied to the clipboard by pressing of accelerating keys of Ctrl+C. More details are given in the sections of “Testing of Expert Advisors” and “Optimization”.
Journal TabMessages about the expert testing process, including all trade operations, are published in the “Journal” tab automatically. This journal is rather similar to that of the “Terminal - Expert Advisors” window, except for that messages informing about expert testing, but not its working at the market , are published in this Tester Journal. After the expert has been tested, these data will be output in the separate /TESTER/LOGS directory. The tester journal files are stored in the /EXPERTS/LOGS directory, filenames
MT4 USER GUIDE
34
being correspondent with the date of logs - YYYYMMDD. LOG. To view the stored logs, one has to execute the “Open” contest menu command and select a necessary file. To copy the message to the clipboard, one has to execute the context menu command of the same name. The “Delete All” command allows to delete all the logs from the directory and cleans this tab. This can be useful to clean the hard disk of too many files.
The “Delete All” More details can be found in the sections of “Testing of Expert Advisors” and “Optimization”.
Optimization ResultsUnlike testing, optimization is supposed to perform many passes for mechanical trading system (MTS) with different inputs. This is done to determine the expert parameters with which its profitability is the highest. To optimize, one has to flag the “Optimization” field in the tab of tester setup and press the “Start” button. After that, two new tabs will appear in the window: “Optimization Results” and “Optimization Graph”.
The “Optimization Results” tab, unlike Tester Report, publishes not the entire list of trades, but final reports of each pass. All data are represented in the table with the following fields:
PassThe pass number;
Profit Net profit (gross profit minus gross loss);
Total Trades The total amount of open trade positions;
Profit factor The ratio between total profit and total loss in per cents. One means that total profit is equal to total loss;
Expected Payoff Mathematical expectation of win. This statistically calculable figure shows average profitability/unprofit ableness of one trade. It is considered to show the estimate profitability/unprofitableness of the next trade;
Drawdown $ Maximum drawdown relating to the initial deposit in the deposit currency;
Inputs Dynamic values of inputs at each pass.
After having clicked with the left mouse button on the heading of any column, one can sort all entries of the table in decreasing or increasing order. Data of the selected pass will be entered as basic inputs of the expert (expert properties window, the “Inputs” tab) after the “Set Input Parameters” context menu command has been executed. At that, the program switches to the “Settings” tab, and optimization mode will be stopped. Having pressed the “Start” button, one can test the expert advisor having the pre-defined input parameters and variables. The same action can be done by a double click with the left mouse button on the pass line in the tab of optimization results. Using the “Copy” context menu command or accelerating keys of Ctrl+C, one can copy the selected results to the clipboard for further use in other applications. If no line has been selected, the entire table will be copied to the clipboard. The “Copy All” command can be used to copy the entire table to the clipboard, as well. The report of the optimization results can also be stored in HTML format on the hard disk. To do so, one has to execute the “Save as Report” context menu command. Other context menu commands allow you to set up displaying of results:
Skip Useless ResultsShow/hide the results of loss passes;
Show Input Parameters Show/hide the “Inputs” column;
Auto Arrange Automatic setting of column sizes when the window size changes. The same action can be done by pressing of A;
Grid Show/hide grid to separate columns. The same action can be done by pressing of G. More details are given in the sections of “Testing of Expert Advisors” and “Optimization”.
Optimization GraphUnlike testing, optimization is supposed to use many repeated passes of mechanical trading system (MTS) with different input parameters. This is performed to determine such expert parameters at which its profitability is the highest. To perform optimization, one has to flag the field of the same name in the Settings tab and press the “Start” button. After that, two new tabs, “Optimization Results” and “Optimization Graph”, will appear in the window.
MT4 USER GUIDE
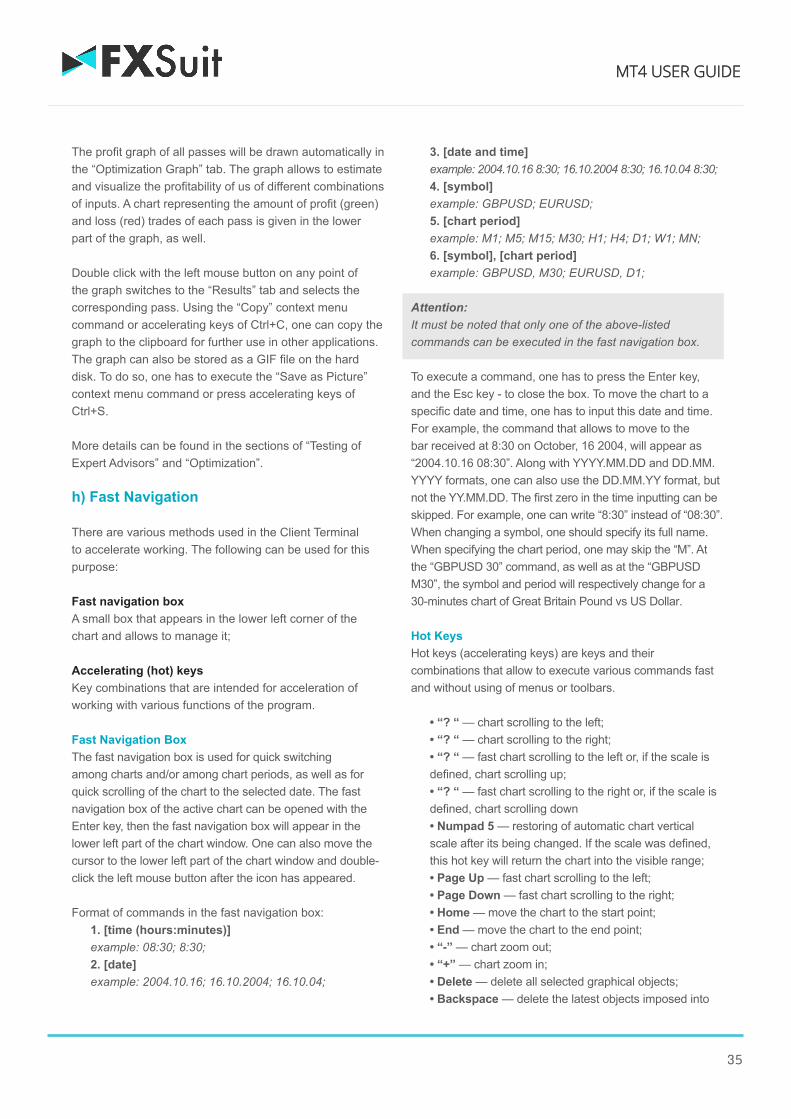
35
The profit graph of all passes will be drawn automatically in the “Optimization Graph” tab. The graph allows to estimate and visualize the profitability of us of different combinations of inputs. A chart representing the amount of profit (green) and loss (red) trades of each pass is given in the lower part of the graph, as well.
Double click with the left mouse button on any point of the graph switches to the “Results” tab and selects the corresponding pass. Using the “Copy” context menu command or accelerating keys of Ctrl+C, one can copy the graph to the clipboard for further use in other applications. The graph can also be stored as a GIF file on the hard disk. To do so, one has to execute the “Save as Picture” context menu command or press accelerating keys of Ctrl+S.
More details can be found in the sections of “Testing of Expert Advisors” and “Optimization”.
h) Fast Navigation
There are various methods used in the Client Terminal to accelerate working. The following can be used for this purpose:
Fast navigation boxA small box that appears in the lower left corner of the chart and allows to manage it;
Accelerating (hot) keys Key combinations that are intended for acceleration of working with various functions of the program.
Fast Navigation BoxThe fast navigation box is used for quick switching among charts and/or among chart periods, as well as for quick scrolling of the chart to the selected date. The fast navigation box of the active chart can be opened with the Enter key, then the fast navigation box will appear in the lower left part of the chart window. One can also move the cursor to the lower left part of the chart window and double-click the left mouse button after the icon has appeared.
Format of commands in the fast navigation box:1. [time (hours:minutes)]example: 08:30; 8:30;2. [date]example: 2004.10.16; 16.10.2004; 16.10.04;
3. [date and time]example: 2004.10.16 8:30; 16.10.2004 8:30; 16.10.04 8:30;4. [symbol]example: GBPUSD; EURUSD;5. [chart period]example: M1; M5; M15; M30; H1; H4; D1; W1; MN;6. [symbol], [chart period]example: GBPUSD, M30; EURUSD, D1;
Attention:It must be noted that only one of the above-listed commands can be executed in the fast navigation box.
To execute a command, one has to press the Enter key, and the Esc key - to close the box. To move the chart to a specific date and time, one has to input this date and time. For example, the command that allows to move to the bar received at 8:30 on October, 16 2004, will appear as “2004.10.16 08:30”. Along with YYYY.MM.DD and DD.MM. YYYY formats, one can also use the DD.MM.YY format, but not the YY.MM.DD. The first zero in the time inputting can be skipped. For example, one can write “8:30” instead of “08:30”. When changing a symbol, one should specify its full name. When specifying the chart period, one may skip the “M”. At the “GBPUSD 30” command, as well as at the “GBPUSD M30”, the symbol and period will respectively change for a 30-minutes chart of Great Britain Pound vs US Dollar.
Hot KeysHot keys (accelerating keys) are keys and their combinations that allow to execute various commands fast and without using of menus or toolbars.
• “? “ — chart scrolling to the left;• “? “ — chart scrolling to the right;• “? “ — fast chart scrolling to the left or, if the scale isdefined, chart scrolling up;• “? “ — fast chart scrolling to the right or, if the scale isdefined, chart scrolling down• Numpad 5 — restoring of automatic chart verticalscale after its being changed. If the scale was defined, this hot key will return the chart into the visible range;• Page Up — fast chart scrolling to the left;• Page Down — fast chart scrolling to the right;• Home — move the chart to the start point;• End — move the chart to the end point;• “-” — chart zoom out;• “+” — chart zoom in;• Delete — delete all selected graphical objects;• Backspace — delete the latest objects imposed into
MT4 USER GUIDE

36
the chart window; • Enter - open/close fast navigation window;• Esc - close the dialog window;• F1 - open this “Userguide”;• F2 - open the “History Center” window;• F3 - open the “Global Variables” window;• F4 - download MetaEditor;• F6 - call the “Tester” window for testing the expertattached to the chart window;• F7 - call the properties window of the expert attachedto their chart window in order to change settings; • F8 —call the chart setup window;• F9 - call the “New Order” window;• F10 - open the “Popup prices” window;• F11 - enable/disable the full screen mode;• F12 - move the chart by one bar to the left;• Shift+F12 - move the chart by one bar to the right;• Shift+F5 - switch to the previous profile;• Alt+1 - display the chart as a sequence of bars(transform into bar chart);• Alt+2 - display the chart as a sequence of candlesticks(transform into candlesticks);• Alt+3 - display the chart as a broken line (transforminto line chart);• Alt+A - copy all test/optimization results into theclipboard;• Alt+W - call the chart managing window;• Alt+F4 - close the client terminal;• Alt+Backspace or Ctrl+Z - undo object deletion;• Ctrl+A - arrange all indicator windows heights bydefault;• Ctrl+B - call the “Objects List” window;• Ctrl+C or Ctrl+Insert - copy to the clipboard;• Ctrl+E - enable/disable expert advisor;• Ctrl+F - enable “Crosshair”;• Ctrl+G - show/hide grid;• Ctrl+H - show/hide OHLC line;• Ctrl+I - call the “Indicators List” window;• Ctrl+L - show/hide volumes;• Ctrl+P - print the chart;• Ctrl+S - save the chart in a file having extensions: “CSV”, “PRN”, “HTM”;• Ctrl+W or Ctrl+F4 - close the chart window;• Ctrl+Y- show/hide period separators;• Ctrl+Z or Alt+Backspace - undo the object deletion;• Ctrl+D - open/close the “Data Window”;• Ctrl+M - open/close the “Market Watch” window;• Ctrl+N - open/close the “Navigator” window;• Ctrl+O - open the “Setup” window;• Ctrl+R - open/close the “Tester” window;
• Ctrl+T — open/close the “Terminal” window;• Ctrl+F5 — switch to the next profile;• Ctrl+F6 — activate the next chart window;• Ctrl+F9 — open the “Terminal - Trade” window andswitch the focus into it. After this, the trading activitiescan be managed with keyboard.
There is a feature allowing to defined hot keys for calling any element of the “Navigator” window, except for those of the “Accounts” group. To define a combination of keys to an element, one has to execute the “Define a hot key” command of its context menu. The defined hot keys are of higher priority being compared to those pre-defined. For example, Ctrl+O combination meant initially the calling of the Terminal setup window. If one defines calling of the On Balance Volume indicator for the same combination, it will not be possible to call the terminal setup window by pressing of Ctrl+O
D. WORKING WITH CHARTS
a) Chart Opening
A chart shows the price changes for a security with the time. Charts are necessary for performing of technical analysis, working of expert advisors and testing thereof. Up to ninety-nine charts can be opened in the terminal at the same time.
A new chart can be opened by executing of the “File - New Chart” menu, “Window - New Window” menu command, or by pressing of the button of the “Standard” toolbar. The list of securities available will appear at performing of any of the above actions. Having selected the necessary symbol from this list, one can open its chart. New charts can also be opened from the “Market Watch” window, holding Ctrl and dragging the element of the list (the symbol) from the window into any point of the workspace of the terminal, or having executed the “Chart Window” command of the context menu. All new charts are opened with the DEFAULT. TPL template created during the terminal installation. This template cannot be deleted, but it can be modified.
History data used for drawing of charts are stored on the hard disk. At opening of a chart, the data are downloaded from the disk and the last missing data are spooled from the trading server. If there are no history data for the symbol on the hard disk, the latest 512 bars of history will be downloaded. To spool the earlier data, one has to move the chart to the desired area. After the chart has been opened, information about the current quotes starts to income to the
MT4 USER GUIDE

37
terminal. Thus, the further price changes will be shown in the real-time mode. This information will be stored in the history file and used at the reopening of this chart in future.
Attention:The “Max. bars in history” and “Max. bars in chart” parameters are defined in the terminal settings. These parameters allow to control over the amount of history data displayed and stored on the hard disk.
Offline ChartsClient terminal allows you to work with offline charts. These charts are opened on basis of data saved on the hard disk in HST format. They are not updated from the server. These charts turn out as very useful for working with non-standard securities or periods.
To open a new chart in offline mode, one has to execute the “File - Open Offline” menu command. Then, a symbol must be selected in the window that appears, and the “Open” button must be pressed. The OFFLINE.TPL template is applied to the chart automatically. At that, the “(offline)” inscription will appear added in the heading of the offline chart.
At testing of an expert, the data file in FXT format is created and used. It differs from a standard chart, but it can be opened offline.
a) Chart SetupAppearance and properties of each chart in the terminalcan be set up individually. To do so, one has to execute the“Charts - Properties...” menu command, the chart contextmenu command of the same name, or press F8. Theseactions result in appearing of the “Properties” window thatcan be used for setting of the color of various elements ofthe chart (the “Colors”) tab:
• Background - chart background color;• Foreground - color of axes, scales, OHLC line;• Grid - chart grid color;• Bar Up - bar up, shades and fringing of the Bull Candlebody;• Bar Down - bar down, shades and fringing of the BearCandle body;• Bull candle - color of the Bull Candle body;• Bear candle - color of the Bear Candle body;• Line graph - line chart and doji;• Volumes - volumes and levels of open positions;• Ask line - color of the Ask line;
• Stop levels - levels of stop orders (Stop Loss and TakeProfit).
The changes made are automatically shown in the left part of the window in the preview chart. Except for manual setting of various color elements of the chart, one can choose pre-defined color diagrams in the field of the same name. There are three color diagrams available in the terminal: “Yellow on Black”, “Green on Black”, and “Black on White”. After a color diagram has been chosen, the chart elements described above will change in the chart in the left part of the window. Custom color diagrams can be stored in templates.
Other chart settings can be defined in this window, as well. To do so, one has to switch to the “Common” tab and select the desired options:
Offline chart Turn the chart offline. This option stops receiving and drawing of price data for the given chart. In future, after this option is disabled, price data will be drawn in the chart again. After the chart has been opened offline, (the “File - Open offline” menu command), this option will be enabled automatically.
Chart on foreground Place the chart in the “foreground”. If this function is enabled, all analytical objects will be placed “under” the price chart. This command is the same as that of “Charts - Foreground chart”.
Chart shift Shift the chart from the right border of the window to the shift mark. The chart shift mark (a gray triangle in the upper part of the window) can be moved with the mouse horizontally within 10 to 50% of the window size.This option can also be enabled with the button of the “Charts” toolbar or by the “Charts - Chart Shift” menu command.
Scale fix One to One Fix the chart scale as “one to one” (the size of one pip of the vertical axis in pixels is equal to the distance between the bars axes in pixels). At that, the “Scale fix” option will be enabled automatically, and a scroll bar will appear at the right side of the window that allows you to move the chart vertically. This mode is necessary for precise constructions.
Scale fix Fix the current chart scale. If the scale has not been fixed, the chart will be automatically scaled vertically. This option disables automatic scaling and fixes the current scale. When this option
MT4 USER GUIDE

38
is selected, the fields of additional scaling parameters “Fixed maximum” and “Fixed minimum” are activated.
Bar chart Display the chart as a sequence of bars. This action can also be performed with the button of the “Charts” toolbar, by the “Charts - Bar Chart” menu command or by pressing of accelerating keys of Alt+1.
Candlesticks Display the chart as a sequence of candlesticks.This action can also be performed with the button of the “Charts” toolbar, by the “Charts - Candlesticks” menu command, or by pressing of accelerating keys of Alt+2.
Line chart Display the chart as a broken line that connects the points of bar close prices. This action can also be performed by the button of the “Charts” toolbar, by the “Charts - Line Chart” menu command, or by pressing of accelerating keys of Alt+3.
Show OHLC Show/hide OHLC line. If this action is done, an additional data line will appear in the upper left part of the window. Except for symbol name and chart period, the latest bar prices are listed in it. Price are recorded in the following format: OPEN, HIGH, LOW and CLOSE (OHLC) - bar open price, the highest bar price, the lowest bar price, and bar close price, respectively. Thus, precise value of the latest bar can always be seen. This option influences the data line of sub-windows of indicators.
Show Ask line Show/hide Ask price level of the latest quote. Bars are drawn and shown only on Bid prices in the terminal. However, at opening of long positions and closing of the short ones, the Ask price is always used. It is not shown in the chart in any way, so it cannot be seen. To control one’s trading activities more precisely; one can enable the “Show Ask line” parameter. After this command has been executed, an additional horizontal line will appear in the chart that corresponds with the Ask line of the latest bar.
Show period separators Show/hide period separators. Date and time of each bar are displayed on the horizontal axis of the chart. And this horizontal scale interval is the selected timeframe. The “Show period separators” option draws additional vertical lines in the chart that correspond with the larger period (timeframe)
borders. So, daily separators will be drawn for charts with periods of M1 to H1, weekly ones - for H4, monthly ones - for D1, and yearly ones - for W1 and MN1.
Show grid Show/hide grid in the chart window. The same actions can be performed by the chart context menu and “Charts” menu command of the same name, as well as by pressing of accelerating keys of Ctrl+G.
Show volumes Show/hide the volume chart in the lower part of the window. This option does not function when the scale is fixed. The same actions can be performed by the chart context menu and “Charts” menu command of the same name, as well as by pressing of accelerating keys of Ctrl+L.
Show volumes Show Show object descriptions — show/hide object descriptions in the chart. If this option is enabled and there are descriptions of objects imposed into the chart available, they will be shown directly in the chart.
c) Chart Management
Charts allow you to analyze price changes at the market and are used for graphical analysis, building of various indicators and line studies. Charts are a very valuable instrument for analyzing of financial markets; that is why a great attention is paid to them. Chart management means:
Chart TypeA symbol chart can be of three types:
1. Bar Chart - the sequence of bars. To make a chartof this type, one has to press the button of the “Charts”toolbar, accelerating keys of Alt + 1, the correspondingoption of the Charts Setup window, or execute the“Charts - Bar Chart” menu command.
2. Candlesticks - the sequence of candlesticks. Tomake a chart of this type, one has to press the buttonof the “Charts” toolbar, accelerating keys of Alt + 2, thecorresponding option of the Charts Setup window, orexecute the “Charts - Candlesticks” menu command.
3. Line Chart - a broken line connecting the bar closeprices. To make a chart of this type, one has to press thebutton of the “Charts” toolbar, accelerating keys of Alt +3, the corresponding option of the Charts Setup window,or execute the “Charts - Line
MT4 USER GUIDE

39
SavingThe client terminal allows to save history data of the active chart as a text file in formats of “CSV”, “PRN”, and “HTM”. To save them in one of these ways, one has to execute the “File - Save As” menu command or press accelerating keys of Ctrl + S. Besides, the chart can be saved as a picture in BMP or GIF format. To do so, one has to execute the “File-Save As Picture...” menu command. The same actions can be performed by the chart context menu command of the same name.
PrintTo print the active chart in color, one has to flag “Color print” in the chart settings, then execute the “File - Print...” menu command, the chart context menu command of the same name, press the button of the “Standard” toolbar or accelerating keys of Ctrl+P. If the “Color Print” is disabled, or there is no color printer available, the chart will be printed as black-and-white.
Full ScreenExecution of the “View - Full Screen” menu command or pressing of F11 will switch the chart to the full screen mode. Only chart windows, main menu and chart switching bar will remain in the display. One can return to the initial mode using the same command.
Attaching of MQL4 ProgramsBefore MQL4 starts to execute, it must be attached to the chart. To do so, one has to select the desired MQL4 program in the “Navigator” window and double-click on it or execute the “Attach to a chart” command of the context menu. The “Drag’n’Drop” technique can be used, as well.
Working with IndicatorsIndicator is a mathematical manipulation with price and/or volumes of a security in order to forecast future price changes. Decisions about how and when to open or close a position are made on basis of signals from technical indicators. Indicators can be imposed into a chart by the “Insert - Indicators” menu commands or those of indicators managing sub-menu that can be opened by pressing of the button of the “Charts” toolbar. The “Drag’n’Drop” technique allows to impose indicators from the “Navigator” window into any open window, as well. The list of indicators imposed into the chart can be viewed in the “Data Window” by executing of the “Charts - Indicators List” menu command, the chart context menu command of the same name, or by pressing accelerating keys of Ctrl+I.
More details about working with technical indicators can be found in the section of the same name.
Working with ObjectsTo analyze the market, one can impose various graphical objects into the chart. To do it, one has to use the “Insert” menu commands or buttons of the “Line Studies” toolbar. Line Studies, geometrical shapes, signs, and texts, are grouped in the menu. More details can be found in the “Graphical Objects” section.
• Period ChangeThe client terminal allows you to use nine different dataperiods, from a minute to a month long. This variety ofperiods is necessary for analyzing the market with technicalindicators and line studies. The desired period of the chartcan be chosen with help of the “Period” toolbar, the buttonof the “Charts” toolbar, the “Charts - Period” menu, or byexecuting of the chart context menu command.
• ZoomingCharts can be zoomed horizontally, increasing ordecreasing thereby the amount of bars shown in the screensimultaneously. To do it, one can use the buttons of / of the“Charts” toolbar, keys of “+”/”-”, the commands of “ZoomIn”/”Zoom Out” of the chart context menu and of the “Charts”menu. To zoom out a chart vertically, one can hold any pointof vertical axis with the left mouse button and move it down.Double click on vertical axis or pressing of “5” in the keypadrestores the scale. Besides, the chart can be zoomedprecisely by defining of upper and lower borders in the Charts Setup window with the “Scale fix” option. The “Scalefix One to One” option of the same window allows you to set the “one-to-one”, i.e., one pip of vertical axis will correspondwith one bar of the horizontal one.
• Scrolling, Auto Scrolling, and Shifting of the ChartScrolling is moving of price data to the right/left in the chartthat can be performed by cursory keys of the keyboard.Besides, the chart can be scrolled with F12 (the “Stepby Step” mode - scrolling the chart by one bar to the left)or Shift+F12 (scrolling the chart by one bar to the right),or with the mouse: one moves the cursor to the right/leftwhen holding the left mouse button pressed on any pointof the chart. Using the fast navigation box, one can haveshown the necessary area of the chart having specified the specific date and time. If the chart has been scrolled to the area where there are no price data, the missing bars will bedownloaded automatically.
MT4 USER GUIDE

40
If the chart scale has been fixed, it can be scrolled vertically, as well. To do so, one has to move the mouse up/down while holding the slider on the vertical scale. To get the chart back into the visibility range, one has to press “5” in the keypad or double-click in the area of the chart price scale.
Auto scroll is intended for users to have the latest bars before their eyes constantly. If this option is enabled, the chart will be automatically scrolled to its end part. This function can be enabled by pressing of the button of the “Charts” toolbar or by the “Charts - Auto Scroll” menu command.
The “Chart Shift” option shifts the latest bar from the right screen border to the chart shift mark. The chart shift mark (a gray triangle in the upper part of the window) can be moved horizontally with the mouse within 10 to 50% of the window size. The chart shift can be enabled by the button of the “Charts” toolbar or by the “Charts - Chart Shift” menu command.
• Chart PositioningNormally, the chart datum point is located in the left part ofthe window. The specific time bar is anchored to it that can be moved through scrolling or with the use of fast navigationbox. When a timeframe is changed, there will be an attemptto calculate the new anchoring bar corresponding with thatof the previously used timeframe. I.e., the timeframe thatis the nearest to this given point will be shown at the leftside of the window. The datum point (a gray triangle at thelower border of the chart) can be moved within the chartwindow using the mouse. It appears only if the “Auto Scroll”is disabled. This mechanism is convenient when analyzing acertain period of time for different timeframes.
Attention:Positioning does not work if the “Auto Scroll” option is enabled.
• Working with TemplatesTemplates represent the chart window parameters storedin the memory. The following is saved in a template: charttype, period, scale, all settings of line studies, technical andcustom indicators, and experts. Templates allow to unify theappearance of many charts easily and fast. The menu thatmanages templates can be called by the “Charts - Template”menu command, the chart context menu command of thesame name and the button of the “Charts” toolbar. The“Save Template...” menu command allows to store a newtemplate and that of “Remove Template” - to delete an
existing one. More details can be found in the “Templates and Profiles” section.
• Working with ProfilesProfiles represent a convenient way of working with chart groups. At opening of a profile, each chart with all its settings will be found in the same place where it was whenthe profile was being stored. The menu that managesprofiles can be opened by the “File - Profiles” menu command, by pressing of the button of the “Standard”toolbar, or by clicking with the mouse in the status barcontaining the name of the current profile. More details can be found in the “Templates and Profiles” section.
• Data UpdatingData must be updated if any errors or “holes” occur in theprice chart. In order to update the price data, one has toexecute the “Charts - Refresh” menu command or the chartcontext menu command of the same name. After all theseactions have been performed, the missing bars will bedownloaded from the server automatically and drawn in thechart.
Use of MouseThe chart is directly managed with the mouse as follows:
• clicking with the left mouse button on any point in thechart window and holding of it with the subsequenthorizontal moving of the cursor result in the chartscrolling;• clicking with the left mouse button on the chart verticalscale and holding of it with the subsequent verticalmoving of the cursor result in vertical chart scaling, andthe double click with the mouse on the chart verticalscale will rescale the chart;• clicking with the left mouse button on the charthorizontal scale (but not the fast navigation box) andholding of it with the subsequent horizontal moving ofthe cursor will result in the chart rescaling;• clicking with the right mouse button on any point in thechart window results in calling of the chart context menu(described be low);• double-clicking with the left mouse button on elementsof technical indicators (lines, signs, histogram bars, etc.)calls the setup window of the corresponding indicator;• clicking with the right mouse button on elementsof a technical indicator calls the context menu of theindicator;• single or double, depending on the terminal settings,clicking with the left mouse button on an object (line
MT4 USER GUIDE
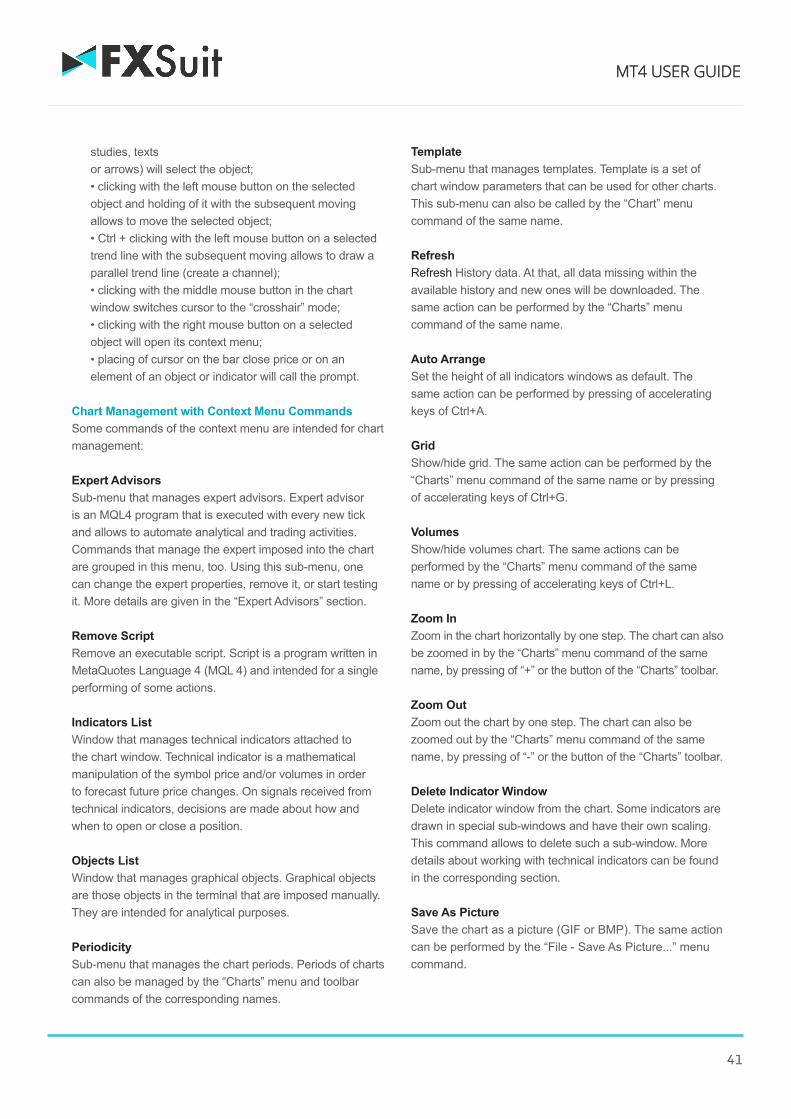
41
studies, textsor arrows) will select the object;• clicking with the left mouse button on the selectedobject and holding of it with the subsequent movingallows to move the selected object;• Ctrl + clicking with the left mouse button on a selectedtrend line with the subsequent moving allows to draw aparallel trend line (create a channel);• clicking with the middle mouse button in the chartwindow switches cursor to the “crosshair” mode;• clicking with the right mouse button on a selectedobject will open its context menu;• placing of cursor on the bar close price or on anelement of an object or indicator will call the prompt.
Chart Management with Context Menu Commands Some commands of the context menu are intended for chart management:
Expert AdvisorsSub-menu that manages expert advisors. Expert advisor is an MQL4 program that is executed with every new tick and allows to automate analytical and trading activities. Commands that manage the expert imposed into the chart are grouped in this menu, too. Using this sub-menu, one can change the expert properties, remove it, or start testing it. More details are given in the “Expert Advisors” section.
Remove Script Remove an executable script. Script is a program written in MetaQuotes Language 4 (MQL 4) and intended for a single performing of some actions.
Indicators List Window that manages technical indicators attached to the chart window. Technical indicator is a mathematical manipulation of the symbol price and/or volumes in order to forecast future price changes. On signals received from technical indicators, decisions are made about how and when to open or close a position.
Objects List Window that manages graphical objects. Graphical objects are those objects in the terminal that are imposed manually. They are intended for analytical purposes.
Periodicity Sub-menu that manages the chart periods. Periods of charts can also be managed by the “Charts” menu and toolbar commands of the corresponding names.
Template Sub-menu that manages templates. Template is a set of chart window parameters that can be used for other charts. This sub-menu can also be called by the “Chart” menu command of the same name.
RefreshRefresh History data. At that, all data missing within the available history and new ones will be downloaded. The same action can be performed by the “Charts” menu command of the same name.
Auto Arrange Set the height of all indicators windows as default. The same action can be performed by pressing of accelerating keys of Ctrl+A.
GridShow/hide grid. The same action can be performed by the “Charts” menu command of the same name or by pressing of accelerating keys of Ctrl+G.
VolumesShow/hide volumes chart. The same actions can be performed by the “Charts” menu command of the same name or by pressing of accelerating keys of Ctrl+L.
Zoom In Zoom in the chart horizontally by one step. The chart can also be zoomed in by the “Charts” menu command of the same name, by pressing of “+” or the button of the “Charts” toolbar.
Zoom Out Zoom out the chart by one step. The chart can also be zoomed out by the “Charts” menu command of the same name, by pressing of “-” or the button of the “Charts” toolbar.
Delete Indicator Window Delete indicator window from the chart. Some indicators are drawn in special sub-windows and have their own scaling. This command allows to delete such a sub-window. More details about working with technical indicators can be found in the corresponding section.
Save As Picture Save the chart as a picture (GIF or BMP). The same action can be performed by the “File - Save As Picture...” menu command.
MT4 USER GUIDE

42
Print Preview Preview the chart image before printing. The same action can be performed by the “File - Print Preview” menu command or by pressing of the button of the “Standard” toolbar.
Print... Print the chart. If the “Color print” option is checked in the program settings, chart can be printed in color. The same action can be performed by the “File - Print...” menu command, accelerating keys of Ctrl+P, or the button of the “Standard” toolbar.
Properties... Call the charts setup window. The same action can be performed by pressing of F8.
Attention:The “Expert Advisors” sub-menu, as well as the commands of “Remove Script”, “Indicators List”, and “Objects List” are activated only if the corresponding objects have been imposed into the chart.
d) Charts Print
There are means to print out charts in the client terminal. A chart can be printed in black-and-white or in color. To print it in color, one has to enable the “Color print” option in the client terminal settings window. After that, the chart will be printed out in color if the printing device allows it. Otherwise, the chart will be printed out in black-and-white format.
The present printing device sometimes needs to be set up. To do so, one has to execute the File - Print Setup...” menu command. To make sure that all desired elements are included into the printing area, one can execute the “Print Preview” command of the same menu, the same command of the chart context menu, or press the button of the “Standard” toolbar. The printing itself will be performed by the “File - Print...” menu command, by the same command of the chart context menu, by pressing of the button of the “Standard” toolbar, or accelerating keys of Ctrl+P.
e) Deleted Charts
Some charts become useless at some stages of work, and they need to be deleted. This can be done by the “File - Close” menu command or by pressing of accelerating keys of Ctrl+F4. At that, the templates of deleted windows will be
stored if “Save deleted charts to reopen” is enabled in the client terminal settings window. These templates can be used in future. So, if a chart has been deleted occasionally, it can be restored. To do so, one has to execute the “File - Open Deleted” menu command and select a symbol from the list. After that, the chart window of the selected symbol will be fully restored with all its settings and objects imposed into it.
f) Templates
A template is a set of chart window parameters that can be applied to other charts. The following can be stored in a template:
• chart type and color;• color diagram;• chart scale;• OHLC line shown or hidden;• the attached expert advisor and its parameters;• the imposed custom and technical indicators withtheir settings;• line studies;
When a template is imposed into a chart, the stored settings, as they are, will be attached to the security and period. For example, one can create a template that includes indicators of MACD, RSI, and Moving Average, and then use it for other charts. In this case, charts windows will have the same view for different symbols and periods.
Templates are stored in the /TEMPLATES directory as TPL files. A template created once can be used unlimited amount of times. A basic template (DEFAULT.TPL) is created during installation of the terminal. It will be applied automatically for creation a new chart window. In future, it can be changed by using of the active chart window properties.
To create a new template, one has to execute the “Charts - Template - Save Template...” menu command, the chartcontext menu command of the same name, or by pressingof the button of the “Charts” toolbar. As a result, a newtemplate will be created on basis of the data of active chartwindow. The same actions must be performed to modifya template, but an existing template should be selectedinstead of entering of a new filename. To impose a templateinto the chart window, one has to select the desired file in the templates managing menu or in any available folderin the “Open” window that can be called by the “Charts -Template - Load Template...” menu command. The “Charts- Template - Remove Template” menu command and the
MT4 USER GUIDE

43
chart context menu command of the same name allow to delete templates
Attention:The “DEFAULT.TPL” cannot be removed.
g) Profiles
Profiles offer a convenient way of working with groups of charts. When a profile opens, each chart with its settings is placed exactly in the same location where it was before, at the profile saving. All changes in all chart windows of the given list are automatically saved in the current profile. The list of all chart windows of the current profile can be found in the “Window” menu. The name of the current profile is displayed in one of the status bar windows and checked in the profile managing menu. When the terminal is installed, the profile by default (DEFAULT) is created. Initially, four basic currency pairs are stored in it: “EUR/USD”, “USD/CHF”, “GBP/USD”, and “USD/JPY”.
Profiles are managed from a single menu that can be called by the “File - Profiles” menu commands, by pressing of the button of the “Standard” toolbar, or by clicking with the mouse button on the current profile name in the status bar window. To use another profile, one has to select the desired name from the list in this menu. At that, the new profile will be opened and become the current. The “Save Profile” command saves the current profile in its state by the moment of the beginning of the command execution under a new name. The new profile is a copy of the previous one and becomes the current. One can delete profiles using the “Remove Profile” command.
The “Next Profile” command and Ctrl + F5 open all available profiles one by one, and the “Previous Profile” and accelerating keys of Shift + F5 allow you to search profiles in the reverse direction.
Attention: The current profile and that by default (DEFAULT) cannot be deleted.A pre-defined profile can be assigned to a trade account in the client terminal. This profile must have a name that coincides with the number of the trade account. If there is a corresponding profile when switching to the given trade account, it will be opened automatically. If there is no pre-defined profile, the current profile will remain active.
h) Analytics
Technical indicators and line studies are built into the terminal for analytical purposes. These objects are imposed directly into the chart and allow to forecast further price changes. At that, indicators are imposed automatically, and line studies are attached manually. This is why, when working with line studies, one has to draw them properly. Parameters of indicators can be set up manually, as well. Technical indicators can have different settings for different symbols or periods.
The use of technical indicators and line studies allows you to open and close reasonable trade positions, place and modify pending orders. Moreover, using of analytical means allows you to perform systematic trading activities and reduces in that way the influence of human emotions. Along with technical indicators, custom indicators written in MetaQuotes Language 4 (MQL 4) can be used for analytical purposes. No line studies or similar tools can be written in MQL 4.
Graphical ObjectsGraphical objects are objects in the terminal that are imposed manually into the chart. These objects are used for analytical purposes. They include:
Line StudiesLines and various geometrical shapes to be imposed into the price or indicators charts. They include support/ resistance lines, trend lines, as well as Fibonacci, Gann, Andrews’ tools, etc. More details about line studies can be found in the section of the same name;
ShapesGeometrical shapes (rectangle, triangle, and ellipse) that allow to mark various areas in the price chart;
ArrowsArrows and signs that allow to mark the most significant points in the chart;
TextText intended for adding of comments to the chart;
Text LabelText intended for adding of comments and anchored to the chart window coordinates. Text label does not move when the chart is scrolled.
MT4 USER GUIDE

44
All objects are grouped in the “Insert” menu and in the “Line Studies” toolbar. Having selected an object in the list and set a point in the chart (or in an indicator window), one can impose the tool.
Attention: To impose several objects, one has to set more than one point. The object will not appear in the chart until all necessary points are set.
After the object has been created, it can be moved or modified. To do so, one has to select the object first. If the “Select object by single mouse click” parameter is set in terminal settings, one has to click once with the left mouse button on any element of the object. If not, the double-click should be used. The object can be considered as selected if square markers or frames appear. The markers are intended for moving of objects and changing their drawing parameters. Thus, for example, to change the Fibonacci Fan location, one has to hold its central marker with the left mouse button and move the cursor. And moving of any of the extreme markers will result in changing of the object drawing parameters. Terminal allows you to create copies of various object very fast. To do so, one has to select the object and, holding Ctrl pressed, move it with the central marker.
All objects imposed into the chart become unnecessary sooner or later, and they can be removed by commands of the context menu. Besides, the Backspace key allows to remove objects in series. In future, all removed objects can be restored. To do so, it is necessary to execute the “Undo Delete” command of the object context menu, the “Charts - Objects - Undo Delete” menu command, or use accelerating keys of Ctrl+Z.
Object PropertiesEvery object has its specific properties. Properties can differ depending on the object. To manage the properties of an object, one has to select the object and execute its context menu command of “Properties...”, the “Charts - Objects - Objects List” menu command. After that, the window of the object name will appear that contains several tabs. General object settings are placed in the “Common” tab. The following is available here:
NameThe object unique name within one chart that is set for the object automatically. It can be changed if another name is entered in this field. Such names make it easy to mark the object out among many others of the same type;
DescriptionDescription/text contents of the object that also serve for marking it out among many others of the same type. Besides, these descriptions can be shown in the chart if the “Show object descriptions” option is enabled in the chart settings;
StyleObject lines style. Color, forms and thickness of lines can be chosen here;
Draw object as backgroundDraw object in the background, behind the chart. Being enabled, this option provides filling of the objects like shapes or channels (excluding Fibonacci Channel) with color.
Coordinates of the object control points in the chart can be changed in the “Parameters” tab. Time coordinates of the object control points should be entered in the “Time” fields, and coordinates of anchoring to vertical axis of a chart of indicator should be given in the “Value” fields. An object can have from one to three coordinates. For some objects, additional options are used in the “Parameters” tab:
Angle in degrees Angle of the object slope anticlockwise in degrees;
ScaleRatio between units of vertical (pips) and horizontal (bars) axes of the object. Normally, the number of pixels in a unit of the horizontal axis (time) differs from that of the vertical axis (prices) when chart are drawn. One-to-one scale brings them to the same value. For certain objects, changing of this parameter changes the ratio;
Arrow codeObject code;
RayShow the object trend lines as rays;
AnchorOne of the chart corners at which the text label is anchored;
X-distanceHorizontal distance between the anchor corner of thewindow and the text label in pixels;
MT4 USER GUIDE

45
Y-distanceVertical distance between the anchor corner of the windowand the text label in pixels.
The object visualization mode for different timeframes can be changed in the “Visualization” tab. The object will then be shown only for the selected timeframes. This can be useful when the tool has different settings for different timeframes. The “Fibo Levels” tab is specifically used only for Fibonacci tools. The list of the tool levels is given here in form of a table. The values of the levels can be changed or deleted (the “Delete” button). A new level can be added by pressing of the “Add” button. At that, if “(%$)” is entered in the “Description” field, the price value corresponding with this level will be shown in the chart. The “Defaults” button resets the initial values. The “Style” field that allows to set up the color, appearance, and thickness of levels of the object is located in the lower part of the tab.
Line StudiesLine studies are lines and various geometrical shapes that can be imposed into a price or indicator chart. They include support/ resistance lines, trend lines, as well as Fibonacci’s, Gann’s, and Andrews’ tools, etc.
MT4 USER GUIDE
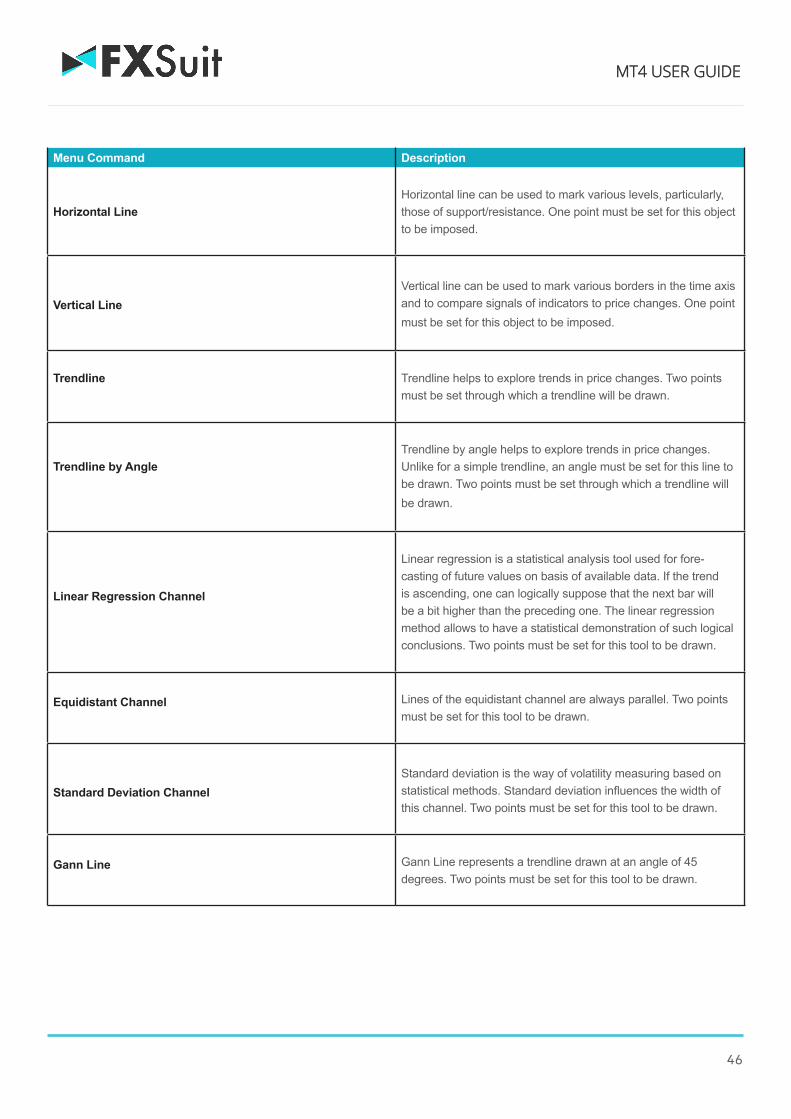
46
Menu Command Description
Horizontal LineHorizontal line can be used to mark various levels, particularly, those of support/resistance. One point must be set for this object to be imposed.
Vertical LineVertical line can be used to mark various borders in the time axis and to compare signals of indicators to price changes. One point must be set for this object to be imposed.
Trendline Trendline helps to explore trends in price changes. Two points must be set through which a trendline will be drawn.
Trendline by AngleTrendline by angle helps to explore trends in price changes. Unlike for a simple trendline, an angle must be set for this line to be drawn. Two points must be set through which a trendline will be drawn.
Linear Regression Channel
Linear regression is a statistical analysis tool used for fore- casting of future values on basis of available data. If the trend is ascending, one can logically suppose that the next bar will be a bit higher than the preceding one. The linear regression method allows to have a statistical demonstration of such logical conclusions. Two points must be set for this tool to be drawn.
Equidistant Channel Lines of the equidistant channel are always parallel. Two points must be set for this tool to be drawn.
Standard Deviation ChannelStandard deviation is the way of volatility measuring based on statistical methods. Standard deviation influences the width of this channel. Two points must be set for this tool to be drawn.
Gann Line Gann Line represents a trendline drawn at an angle of 45 degrees. Two points must be set for this tool to be drawn.
MT4 USER GUIDE
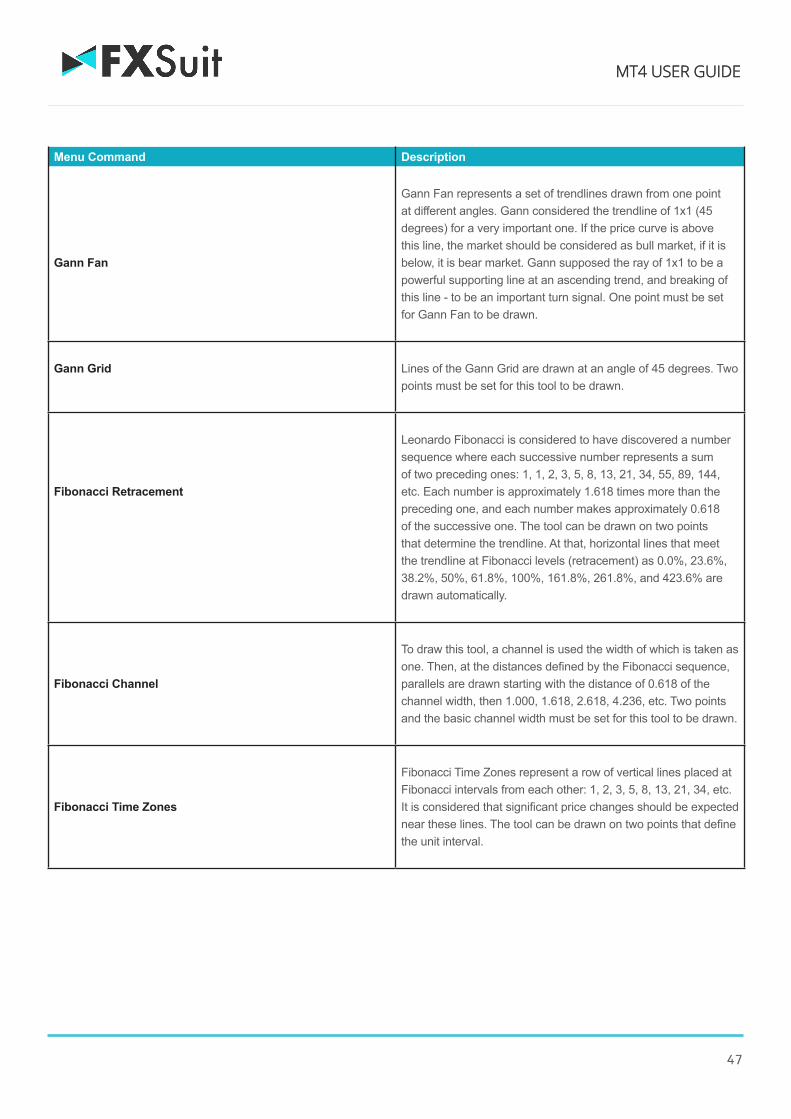
47
Menu Command Description
Gann Fan
Gann Fan represents a set of trendlines drawn from one point at different angles. Gann considered the trendline of 1x1 (45 degrees) for a very important one. If the price curve is above this line, the market should be considered as bull market, if it is below, it is bear market. Gann supposed the ray of 1x1 to be a powerful supporting line at an ascending trend, and breaking of this line - to be an important turn signal. One point must be set for Gann Fan to be drawn.
Gann Grid Lines of the Gann Grid are drawn at an angle of 45 degrees. Two points must be set for this tool to be drawn.
Fibonacci Retracement
Leonardo Fibonacci is considered to have discovered a number sequence where each successive number represents a sum of two preceding ones: 1, 1, 2, 3, 5, 8, 13, 21, 34, 55, 89, 144, etc. Each number is approximately 1.618 times more than the preceding one, and each number makes approximately 0.618 of the successive one. The tool can be drawn on two points that determine the trendline. At that, horizontal lines that meet the trendline at Fibonacci levels (retracement) as 0.0%, 23.6%, 38.2%, 50%, 61.8%, 100%, 161.8%, 261.8%, and 423.6% are drawn automatically.
Fibonacci Channel
To draw this tool, a channel is used the width of which is taken as one. Then, at the distances defined by the Fibonacci sequence, parallels are drawn starting with the distance of 0.618 of the channel width, then 1.000, 1.618, 2.618, 4.236, etc. Two points and the basic channel width must be set for this tool to be drawn.
Fibonacci Time Zones
Fibonacci Time Zones represent a row of vertical lines placed at Fibonacci intervals from each other: 1, 2, 3, 5, 8, 13, 21, 34, etc. It is considered that significant price changes should be expected near these lines. The tool can be drawn on two points that define the unit interval.
MT4 USER GUIDE

48
Menu Command Description
Fibonacci Fan
Fibonacci Fan is drawn on two points that define the trendline. Then an «invisible» vertical line is drawn through the second point. Then three trendlines are drawn from the first point, these trendlines meeting the invisible vertical line at Fibonacci levels of 38.2%, 50%, and 61.8%. It is considered that significant price changes should be expected near these lines.
Fibonacci Arcs
The tool named Fibonacci Arcs is drawn on two points that define the trendline. Then three arcs having the centers in the second point are drawn, these arcs meeting the trendline at Fibonacci levels of 38.2%, 50%, and 61.8%. It is considered that significant price changes should be expected near these arcs.
Fibonacci Expansion
Fibonacci Expansion is drawn on three points that circumscribe two waves. Then three lines meeting the third, “presumptive”, wave at Fibonacci levels of 61.8%, 100%, and 161.8%, are drawn. It is considered that significant price changes should be expected near these lines.
Andrews’ Pitchfork
This tool is drawn on three points and represents the parallel trendlines. The first trendline starts at the selected leftmost point (it is an important peak or trough) and is drawn precisely between two rightmost points. This line is the pitchfork «helve». Then, the second and the third trend- lines outgoing from the above-mentioned rightmost points (significant peak and trough) are drawn in parallel to the first trendline. These lines are the pitchfork «teeth». Andrews’ Pitchfork is interpreted as support/resistance lines are normally interpreted.
Cycle LinesThis tool represents a row of vertical lines placed at equal intervals. Normally, a unit interval corresponds with one cycle. At that, completed lines are considered to describe future cycles. The tool is drawn on two points that define the unit interval.

49
E. TECHNICAL INDICATORS
Technical indicator is a mathematical manipulation of a secu-rity price and/or volumes aimed at forecasting of future price changes. Decisions about how and when to open or close positions can be made on basis of signals from technical indicators. According to their functionalities, indicators can be divided into two groups: trend indicators and oscillators. Trend indicators help to assess the price direction and detect the turn moments synchronously or with a delay. Oscillators allow to find the turning moments ahead or synchronously.
Indicators are imposed into the chart from the “Navigator” window by means of Drag`n`Drop technique, by execution of the “Insert - Indicators” menu command, or by pressing of the button of the “Charts” toolbar. A technical indicator can be drawn in a separate indicator window that has a specific ver-tical scale (for example, MACD) or it can be imposed directly into the price chart (for example, Moving Average). At that, indicators can be drawn not only for price data and deriva-tives thereof (Median Price, Typical Price, Weighted Close), but also for other indicators. For example, Moving Average for Awesome Oscillator can be drawn, and a signal line can be obtained additionally to AO in this way. To do so, one has to draw AO indicator first, and then, using Drag`n`Drop technique, impose MA into AO and select “Previous Indicator Data” option in its settings in the “Apply to” option. If the “First Indicator Data” option is selected, MA will be drawn on basis of data of the very first imposed indicator that can be other than AO.
Besides analytical parameters, one can set colors for various elements, thickness of lines, and sizes of signs used, at setting up of the indicator. Moreover, the visualization mode of the object for different timeframes can be changed in the “Visualization” tab. At that, indicator will be shown on at time-frames that have been selected. This function can be useful if the tool has different settings for different timeframes. Using the “Show in the Data Window” option in the same tab, one can control over visualization of information about indicators in the “Data Window”.
All settings can be changed. To do so, one has to select the desired indicator in the “Indicators List” window and press the “Edit” button or execute the “Properties...” command of the indicator context menu. Indicator context menu can be called by clicking with the right mouse button on a line, sign, or diagram of the desired indicator. To remove an indicator, one has to execute the “Delete Indicator” indicator context menu command or the “Delete Indicator Window” command
in the chart or indicator context menus. The “Delete Indicator Window” command closes the indicator window.
Attention:Having placed cursor near a line, a sign, or a column border of an indicator histogram, one can determine precise value of this given indicator in this point.
1) Acceleration/Deceleration - AC
Acceleration/Deceleration Technical Indicator (AC) measures acceleration and deceleration of the current driving force. This indicator will change direction before any changes in the driving force, which, it its turn, will change its direction before the price. If you realize that Acceleration/Deceleration is a signal of an earlier warning, it gives you evident advantages. The nought line is basically the spot where the driving force is at balance with the acceleration. If Acceleration/Deceleration is higher than nought, then it is usually easier for the acceleration to continue the upward movement (and vice versa in cases when it is below nought). Unlike in case with Awesome Oscillator, it is not regarded as a signal when the nought line is crossed. The only thing that needs to be done to control the market and make decisions is to watch for changes in color. To save yourself serious reflections, you must remember: you cannot buy with the help of Acceleration/Deceleration, when the current column is colored red, and you cannot sell, when the current column is colored green.
If you enter the market in the direction of the driving force (the indicator is higher than nought, when buying, or it is lower than nought, when selling), then you need only two green columns to buy (two red columns to sell). If the driving force is directed against the position to be opened (indicator below nought for buying, or higher than nought for selling), a confirmation is needed, hence, an additional column is required. In this case the indicator is to show three red columns over the nought line for a short position and three green columns below the nought line for a long position.
CalculationAC bar chart is the difference between the value of 5/34 of the driving force bar chart and 5-period simple moving average, taken from that bar chart.
AO = SMA(median price, 5)-SMA(median price, 34)AC = AO-SMA(AO, 5)
MT4 USER GUIDE

50
Where:SMA - Simple Moving Average;AO - Awesome Oscillator.
2) Accumulation/Distribution (A/D)
Accumulation/Distribution Technical Indicator is determined by the changes in price and volume. The volume acts as a weighting coefficient at the change of price - the higher the coefficient (the volume) is, the greater the contribution of the price change (for this period of time) will be in the value of the indicator.
In fact, this indicator is a variant of the more commonly used indicator On Balance Volume. They are both used to confirm price changes by means of measuring the respective volume of sales.
When the Accumulation/Distribution indicator grows, it means accumulation (buying) of a particular security, as the overwhelming share of the sales volume is related to an upward trend of prices. When the indicator drops, it means distribution (selling) of the security, as most of sales take place during the downward price movement.
Divergences between the Accumulation/Distribution indicator and the price of the security indicate the upcoming change of prices. As a rule, in case of such divergences, the price tendency moves in the direction in which the indicator moves. Thus, if the indicator is growing, and the price of the security is dropping, a turnaround of price should be expected.
CalculationA certain share of the daily volume is added to or subtracted from the current accumulated value of the indicator. The nearer the closing price to the maximum price of the day is, the higher the added share will be. The nearer the closing price to the minimum price of the day is, the greater the subtracted share will be. If the closing price is exactly in between the maximum and minimum of the day, the indicator value remains unchanged.
A/D = SUM[((CLOSE - MINIMUM) - (MAXIMUM - CLOSE))*VOLUME/(MAXIMUM - MINIMUM), N]
Where:N — the quantity of periods used in the calculation.
3) Alligator
“Most of the time the market remains stationary. Only for some 15–30% of time the market generates trends, and traders who are not located in the exchange itself derive most of their profits from the trends. My Grandfather used to repeat: “Even a blind chicken will find its corns, if it is always fed at the same time”. We call the trade on the trend “a blind chicken market”. It took us years, but we have produced an indicator, that lets us always keep our powder dry until we reach the blind chicken market” - Bill Williams
In principle, Alligator Technical Indicator is a combination of Balance Lines (Moving Averages) that use fractal geometry and nonlinear dynamics.
The blue line (Alligator’s Jaw) is the Balance Line for the timeframe that was used to build the chart (13-period Smoothed Mov- ing Average, moved into the future by 8 bars);
The red line (Alligator’s Teeth) is the Balance Line for the value timeframe of one level lower (8-period Smoothed Moving Average, moved by 5 bars into the future);
The green line (Alligator’s Lips) is the Balance Line for the value timeframe, one more level lower (5-period Smoothed Moving Average, moved by 3 bars into the future).
Lips, Teeth and Jaw of the Alligator show the interaction of different time periods. As clear trends can be seen only 15 to 30 per cent of the time, it is essential to follow them and refrain from working on markets that fluctuate only within certain price periods.
When the Jaw, the Teeth and the Lips are closed or intertwined, it means the Alligator is going to sleep or is asleep already. As it sleeps, it gets hungrier and hungrier — the longer it will sleep, the hungrier it will wake up. The first thing it does after it wakes up is to open its mouth and yawn. Then the smell of food comes to its nostrils: flesh of a bull or flesh of a bear, and the Alligator starts to hunt it. Having eaten enough to feel quite full, the Alligator starts to lose the interest to the food/price (Balance Lines join together) — this is the time to fix the profit.
CalculationMEDIAN PRICE = (HIGH + LOW) / 2
ALLIGATORS JAW = SMMA (MEDEAN PRICE, 13, 8)
MT4 USER GUIDE
51
ALLIGATORS TEETH = SMMA (MEDEAN PRICE, 8, 5)
ALLIGATORS LIPS = SMMA (MEDEAN PRICE, 5, 3)
Where:MEDIAN PRICE - median price;
HIGH - the highest price of the bar;
LOW - the lowest price of the bar;
SMMA (A, B, C) - smoothed moving average. A parameter is for data to be smoothed, B is the smoothing period, C is shift to future. For example, SMMA (MEDIAN PRICE, 5, 3) means that the smoothed moving average will be calculated on the median price, smoothing period being equal to 5 bars and shift being 3;
ALLIGATORS JAW - Alligator’s jaws (blue line); ALLIGATORS TEETH - Alligator’s teeth (red line); ALLIGATORS LIPS - Alligator’s lips (green line).
4) Average Directional Movement Index
Average Directional Movement Index Technical Indicator (ADX) helps to determine if there is a price trend. It was developed and described in detail by Welles Wilder in his book “New concepts in technical trading systems”.
The simplest trading method based on the system of directional movement implies comparison of two direction indicators: the 14-period +DI one and the 14-period -DI. To do this, one either puts the charts of indicators one on top of the other, or +DI is subtracted from -DI. W. Wilder recommends buying when +DI is higher than -DI, and selling when +DI sinks lower than -DI.
To these simple commercial rules Wells Wilder added “a rule of points of extremum”. It is used to eliminate false signals and decrease the number of deals. According to the principle of points of extremum, the “point of extremum” is the point when +DI and -DI cross each other. If +DI raises higher than -DI, this point will be the maximum price of the day whenthey cross. If +DI is lower than -DI, this point will be theminimum price of the day they cross.
The point of extremum is used then as the market entry level. Thus, after the signal to buy (+DI is higher than -DI) one must wait till the price has exceeded the point ofextremum, and only then buy. However, if the price fails toexceed the level of the point of extremum, one should retainthe short position.
Calculation
ADX = SUM[(+DI-(-DI))/(+DI+(-DI)), N]/N
Where: N - the number of periods used in the calculation.
5) Average True Range
Average True Range Technical Indicator (ATR) is an indicator that shows volatility of the market. It was introduced by Welles Wilder in his book “New concepts in technical trading systems”. This indicator has been used as a component of numerous other indicators and trading systems ever since.
Average True Range can often reach a high value at the bottom of the market after a sheer fall in prices occasioned by panic selling. Low values of the indicator are typical for the periods of sideways movement of long duration which happen at the top of the market and during consolidation. Average True Range can be interpreted according to the same principles as other volatility indicators. The principle of forecasting based on this indicator can be worded the following way: the higher the value of the indicator, the higher the probability of a trend change; the lower the indicator’s value, the weaker the trend’s movement is.
CalculationTrue Range is the greatest of the following three values:
• Difference between the current maximum and minimum(high and low);
• Difference between the previous closing price and thecurrent maximum;
• Difference between the previous closing price and thecurrent minimum.
The indicator of Average True Range is a moving average of values of the true range.
6) Awesome Oscillator
Awesome Oscillator Technical Indicator (AO) is a 34-period simple moving average, plotted through the middle points of the bars (H+L)/2, which is subtracted from the 5-period simple moving average, built across the central points of the bars (H+L)/2. It shows us quite clearly what’s happening to the market driving force at the present moment.
MT4 USER GUIDE

52
Signals to buy
Saucer This is the only signal to buy that comes when the bar chart is higher than the nought line. One must bear in mind:
• The saucer signal is generated when the bar chart reversedits direction from the downward to upward. The secondcolumn is lower than the first one and is colored red. Thethird column is higher than the second and is colored green.
• For the saucer signal to be generated the bar chart shouldhave at least three columns.
Keep in mind that all Awesome Oscillator columns should be over the nought line for the saucer signal to be used.
Nought line crossingThe signal to buy is generated when the bar chart passes from the area of negative values to that of positive. It comes when the bar chart crosses the nought line. As regards this signal:
• for this signal to be generated, only two columns arenecessary;
• the first column is to be below the nought line, the second one is to cross it (transition from a negative value to apositive one);
• simultaneous generation of signals to buy and to sell isimpossible.
Two pikesThis is the only signal to buy that can be generated when the bar chart values are below the nought line. As regards this signal, please, bear in mind:
• the signal is generated, when you have a pike pointingdown (the lowest minimum) which is below the nought lineand is followed by another down-pointing pike which issomewhat higher (a negative figure with a lesser absolute value, which is therefore closer to the nought line), than theprevious down-looking pike.
• the bar chart is to be below the nought line between thetwo pikes. If the bar chart crosses the nought line in thesection between the pikes, the signal to buy doesn’t function.However, a different signal to buy will be generated - noughtline crossing.
• each new pike of the bar chart is to be higher (a negative
number of a lesser absolute value that is closer to the nought line) than the previous pike.
• if an additional higher pike is formed (that is closer to thenought line) and the bar chart has not crossed the nought line,an additional signal to buy will be generated.
Signals to sellAwesome Oscillator signals to sell are identical to the signals to buy. The saucer signal is reversed and is below zero. Nought line crossing is on the decrease - the first column of it is over the nought, the second one is under it. The two pikes signal is higher than the nought line and is reversed too.
CalculationAO is a 34-period simple moving average, plotted through the central points of the bars (H+L)/2, and subtracted from the 5-period simple moving average, graphed across the centralpoints of the bars (H+L)/2.
MEDIAN PRICE = (HIGH+LOW)/2
AO = SMA(MEDIAN PRICE, 5)-SMA(MEDIAN PRICE, 34)
Where:SMA - Simple Moving Average.
7) Bears Power
Every day trading represents a battle of buyers (“Bulls”) pushing prices up and sellers (“Bears”) pushing prices down. Depending on what party scores off, the day will end with a price that is higher or lower than that of the previous day. Intermediate results, first of all the highest and lowest price, allow to judge about how the battle was developing during the day.
It is very important to be able to estimate the Bears Power balance since changes in this balance initially signalize about possible trend reversal. This task can be solved using the Bears Power oscillator developed by Alexander Elder and and described in his book titled Trading for a Living. Elder based on the following premises when deducing this oscillator:• moving average is a price agreement between sellers andbuyers for a certain period of time,• the lowest price displays the maximum sellers’ power withinthe day.
On these premises, Elder developed Bears Power as the difference between the lowest price and 13-period exponential
MT4 USER GUIDE

53
moving average (LOW - EMA).
ApplicationThis indicator is better to use together with a trend indicator (most frequently Moving Average):
• if trend indicator is up-directed and the Bears Power indexis below zero, but growing, it is a signal to buy;
• it is desirable that, in this case, the divergence of baseswere being formed in the indicator chart.
CalculationThe first stage of this indicator calculation is calculation of the exponential moving average (as a rule, it is recommended to use the 13-period EMA).
BEARS = LOW - EMA
Where:BEARS — Bears Power;LOW — the lowest price of the current bar;EMA — exponential moving average.
In the down-trend, LOW is lower than EMA, so the Bears Power is below zero and histogram is located below zero line. If LOW rises above EMA when prices grow, the Bears Power becomes above zero and its histogram rises above zero line.
8) Bollinger Bands
Bollinger Bands Technical Indicator (BB) is similar to Envelopes. The only difference is that the bands of Envelopes are plotted a fixed distance (%) away from the moving average, while the Bollinger Bands are plotted a certain number of standard deviations away from it. Standard deviation is a measure of volatility; therefore Bollinger Bands adjust themselves to the market conditions. When the markets become more volatile, the bands widen and they contract during less volatile periods.
Bollinger Bands are usually plotted on the price chart, but they can be also added to the indicator chart (Custom Indicators). Just like in case of the Envelopes, the interpretation of the Bollinger Bands is based on the fact that the prices tend to remain in between the top and the bottom line of the bands. A distinctive feature of the Bollinger Band
indicator is its variable width due to the volatility of prices. In periods of considerable price changes (i.e. of high volatility) the bands widen leaving a lot of room to the prices to move in. During standstill periods, or the periods of low volatility the band contracts keeping the prices within their limits.
The following traits are particular to the Bollinger Band:
1. abrupt changes in prices tend to happen after the band hascontracted due to decrease of volatility.2. if prices break through the upper band, a continuation of thecurrent trend is to be expected.3. if the pikes and hollows outside the band are followed bypikes and hollows inside the band, a reverse of trend mayoccur.4. the price movement that has started from one of the band’slines usually reaches the opposite one. The last observation isuseful for forecasting price guideposts.
CalculationBollinger bands are formed by three lines. The middle line (ML) is a usual Moving Average.ML = SUM [CLOSE, N]/N
The top line, TL, is the same as the middle line a certain number of standard deviations (D) higher than the ML.TL = ML + (D*StdDev)
The bottom line (BL) is the middle line shifted down by the same number of standard deviations.BL = ML — (D*StdDev)
Where:N — is the number of periods used in calculation;SMA — Simple Moving Average;
StdDev — means Standard Deviation.
StdDev = SQRT(SUM[(CLOSE — SMA(CLOSE, N))^2, N]/N)
It is recommended to use 20-period Simple Moving Average as the middle line, and plot top and bottom lines two standard deviations away from it. Besides, moving averages of less than 10 periods are of little effect.
9) Bulls Power
Every day trading represents a battle of buyers (“Bulls”) pushing prices up and sellers (“Bears”) pushing prices down.
MT4 USER GUIDE

54
Depending on what party scores off, the day will end with a price that is higher or lower than that of the previous day. Intermediate results, first of all the highest and lowest price, allow to judge about how the battle was developing during the day.
It is very important to be able to estimate the Bulls Power balance since changes in this balance initially signalize about possible trend reversal. This task can be solved using the Bulls Power oscillator developed by Alexander Elder and described in his book titled Trading for a Living. Elder based on the following premises when deducing this oscillator:
• moving average is a price agreement between sellers andbuyers for a certain period of time,• the highest price displays the maximum buyers’ powerwithin the day.
On these premises, Elder developed Bulls Power as the difference between the highest price and 13-period exponential moving average (HIGH - EMA).
ApplicationThis indicator is better to use together with a trend indicator (most frequently Moving Average):
• if trend indicator is down-directed and the Bulls Powerindex is above zero, but falling, it is a signal to sell;• it is desirable that, in this case, the divergence of peakswere being formed in the indicator chart.
CalculationThe first stage of this indicator calculation is calculation of the exponential moving average (as a rule, it is recommended to use the 13-period EMA).BULLS = HIGH - EMA
Where:
BULLS — Bulls Power;
HIGH — the highest price of the current bar;
EMA — exponential moving average.
In the up-trend, HIGH is higher than EMA, so the Bulls Power is above zero and histogram is located above zero line. If HIGH falls under EMA when prices fall, the Bulls Power becomes below zero and its histogram falls under zero line.
10) Commodity Channel Index
Commodity Channel Index Technical Indicator (CCI) measures the deviation of the commodity price from its average statistical price. High values of the index point out that the price is unusually high being compared with the average one, and low values show that the price is too low. In spite of its name, the Commodity Channel Index can be applied for any financial instrument, and not only for the wares.
There are two basic techniques of using Commodity Channel Index:
Finding the divergencesThe divergence appears when the price reaches a new maximum, and Commodity Channel Index cannot grow above the previous maximums. This classical divergence is normally followed by the price correction.
As an indicator of overbuying/oversellingCommodity Channel Index usually varies in the range of ±100. Values above +100 inform about overbuying state (and about a probability of correcting decay), and the values below 100 inform about the overselling state (and about a probability of correcting increase).
Calculation1. To find a Typical Price. You need to add the HIGH, the LOW, and the CLOSE prices of each bar and then divide theresult by 3.TP = (HIGH + LOW +CLOSE)/3
2. To calculate the n-period Simple Moving Average of typicalprices.SMA(TP, N) = SUM[TP, N]/N
3. To subtract the received SMA(TP, N) from Typical Prices.D = TP — SMA(TP, N)
4. To calculate the n-period Simple Moving Average ofabsolute D values.SMA(D, N) = SUM[D, N]/N
5. To multiply the received SMA(D, N) by 0,015.M = SMA(D, N) * 0,015 6. To divide M by D
6. To divide M by DCCI = M/D
MT4 USER GUIDE

55
Where:
SMA — Simple Moving Average;
N — number of periods, used for calculation.
11) DeMarker
Demarker Technical Indicator is based on the comparison of the period maximum with the previous period maximum. If the cur- rent period (bar) maximum is higher, the respective difference between the two will be registered. If the current maximum is lower or equaling the maximum of the previous period, the naught value will be registered. The differences received for N periods are then summarized. The received value is used as the numerator of the DeMarker and will be divided by the same value plus the sum of differences between the price minima of the previous and the current periods (bars). If the current price minimum is greater than that of the previous bar, the naught value will be registered.
When the indicator falls below 30, the bullish price reversal should be expected. When the indicator rises above 70, the bearish price reversal should be expected.
If you use periods of longer duration, when calculating the indicator, you’ll be able to catch the long term market tendency. Indicators based on short periods let you enter the market at the point of the least risk and plan the time of transaction so that it falls in with the major trend.
CalculationThe value of the DeMarker for the “i” interval is calculated as follows:
• The DeMax(i) is calculated: If high(i) > high(i-1) , then DeMax(i) = high(i)-high(i-1), otherwise DeMax(i) = 0
• The DeMin(i) is calculated: If low(i) < low(i-1), then DeMin(i) = low(i-1)-low(i), otherwise DeMin(i) = 0
• The value of the DeMarker is calculated as: DMark(i) = SMA(DeMax, N)/(SMA(DeMax, N)+SMA(DeMin, N))
Where:SMA — Simple Moving Average;N — the number of periods used in the calculation.
12) Envelopes
Envelopes Technical Indicator is formed with two Moving
Averages one of which is shifted upward and another one is shifted downward. The selection of optimum relative number of band margins shifting is determined with the market volatility: the higher the latter is, the stronger the shift is.
Envelopes define the upper and the lower margins of the price range. Signal to sell appears when the price reaches the upper margin of the band; signal to buy appears when the price reaches the lower margin.
The logic behind envelopes is that overzealous buyers and sellers push the price to the extremes (i.e., the upper and lower bands), at which point the prices often stabilize by moving to more realistic levels. This is similar to the interpretation of Bollinger Bands.
CalculationUpper Band = SMA(CLOSE, N)*[1+K/1000]
Lower Band = SMA(CLOSE, N)*[1-K/1000]
Where:SMA — Simple Moving Average;
N — averaging period;
K/1000 — the value of shifting from the average (measured in basis points).
13) Force Index
Force Index Technical Indicator was developed by Alexander Elder. This index measures the Bulls Power at each increase, and the Bulls Power at each decrease. It connects the basic elements of market information: price trend, its drops, and volumes of transactions. This index can be used as it is, but it is better to approximate it with the help of Moving Average. Approximation with the help a short moving average (the author proposes to use 2 intervals) contributes to finding the best opportunity to open and close positions. If the approximations is made with long moving average (period 13), the index shows the trends and their changes.
• It is better to buy when the forces become minus (fall belowzero) in the period of indicator increasing tendency;
• The force index signalizes the continuation of the increasingtendency when it increases to the new peak;
• The signal to sell comes when the index becomes positiveduring the decreasing tendency;
• The force index signalizes the Bears Power and continuationof the decreasing tendency when the index falls to the new
MT4 USER GUIDE

56
trough;
• If price changes do not correlate to the correspondingchanges in volume, the force indicator stays on one level,which tells you the trend is going to change soon.
CalculationThe force of every market movement is characterized by its direction, scale and volume. If the closing price of the current bar is higher than the preceding bar, the force is positive. If the current closing price if lower than the preceding one, the force is negative. The greater the difference in prices is, the greater the force is. The greater the transaction volume is, the greater the force is.
FORCE INDEX (i) = VOLUME (i) * ((MA (ApPRICE, N, i) - MA (ApPRICE, N, i-1))
Where:
FORCE INDEX (i) - Force Index of the current bar;
VOLUME (i) - volume of the current bar;
MA (ApPRICE, N, i) - any Moving Average of the current bar for N period:
Simple, Exponential, Weighted or Smoothed;
ApPRICE - applied price;
N - period of the smoothing;
MA (ApPRICE, N, i-1) - any Moving Average of the previous bar.
14) Fractals
All markets are characterized by the fact that on the most part the prices do not change too much, and only short periods of time (15–30 percent) account for trend changes. Most lucrative periods are usually the case when market prices change according to a certain trend.
A Fractal is one of five indicators of Bill Williams’ trading system, which allows to detect the bottom or the top.
Fractal Technical Indicator it is a series of at least five successive bars, with the highest HIGH in the middle, and two lower HIGHs on both sides. The reversing set is a series of at least five successive bars, with the lowest LOW in the middle, and two higher LOWs on both sides, which correlates to the sell fractal. The fractals are have High and Low values and are indicated with the up and down arrows.
The fractal needs to be filtrated with the use of Alligator. In other words, you should not close a buy transaction, if the fractal is lower than the Alligator’s Teeth, and you should not close a sell transaction, if the fractal is higher than the Alligator’s Teeth. After the fractal signal has been created and is in force, which is determined by its position beyond the Alligator’s Mouth, it remains a signal until it gets attacked, or until a more recent fractal signal emerges.
15) Gator Oscillator
Gator Oscillator is based on the Alligator and shows the degree of convergence/divergence of the Balance Lines (Smoothed Moving Averages). The top bar chart is the absolute difference between the values of the blue and the red lines. The bottom bar chart is the absolute difference between the values of the red line and the green line, but with the minus sign, as the bar chart is drawn top-down.
16) Ichimoku Kinko Hyo
Ichimoku Kinko Hyo Technical Indicator is predefined to characterize the market Trend, Support and Resistance Levels, and to generate signals of buying and selling. This indicator works best at weekly and daily charts.
When defining the dimension of parameters, four time intervals of different length are used. The values of individual lines composing this indicator are based on these intervals:
• Tenkan-sen shows the average price value during the first time interval defined as the sum of maximum and minimum within this time, divided by two;
• Kijun-sen shows the average price value during the secondtime interval;
• Senkou Span A shows the middle of the distance betweentwo previous lines shifted forwards by the value of the secondtime interval;
• Senkou Span B shows the average price value during thethird time interval shifted forwards by the value of the secondtime interval.
Chinkou Span shows the closing price of the current candle shifted backwards by the value of the second time interval. The distance between the Senkou lines is hatched with another color and called “cloud”. If the price is between these lines, the market should be considered as non-trend, and then the cloud margins from the support and resistance levels.
MT4 USER GUIDE

57
• If the price is above the cloud, its upper line forms the firstsupport level, and the second line forms the second supportlevel;
• If the price is below cloud, the lower line forms the first resistance level, and the upper one forms the second level;
• If the Chinkou Span line traverses the price chart in thebottom-up direction it is signal to buy. If the Chinkou Spanline traverses the price chart in the top-down direction it issignal to sell.
Kijun-sen is used as an indicator of the market movement. If the price is higher than this indicator, the prices will probably con- tinue to increase. When the price traverses this line the further trend changing is possible. Another kind of using the Kijun-sen is giving signals. Signal to buy is generated when the Tenkan-sen line traverses the Kijun-sen in the bottom-up direction. Top-down direction is the signal to sell. Tenkan-sen is used as an indicator of the market trend. If this line increases or decreases, the trend exists. When it goes horizontally, it means that the market has come into the channel.
17) Market Facilitation Index
Market Facilitation Index Technical Indicator (BW MFI) is the indicator which shows the change of price for one tick. Absolute values of the indicator do not mean anything as they are, only indicator changes have sense. Bill Williams emphasizes the interchanging of MFI and volume:
• Market Facilitation Index increases and volume increases— this points out that: a) the number of players coming intothe market increases (volume increases) b) the new comingplayers open positions in the direction of bar development,i.e., the movement has begun and picks up speed;
• Market Facilitation Index falls and volume falls. It means themarket participants are not interested anymore;
• Market Facilitation Index increases, but the volume falls.It is most likely, that the market is not supported with thevolume from clients, and the price is changing due to traders’(brokers and dealers) “on the floor” speculations;
• Market Facilitation Index falls, but the volume increases.There is a battle between bulls and bears, characterized bya large sell and buy volume, but the price is not changingsignificantly since the forces are equal. One of the contending parties (buyers vs. sellers) will eventually win thebattle. Usually, the break of such a bar lets you know if thisbar determines the continuation of the trend or annuls the
trend. Bill Williams calls such bar “curtsying”.
CalculationTo calculate Market Facilitation Index you need to subtract the lowest bar price from the highest bar price and divide it by the volume.
BW MFI = RANGE*(HIGH-LOW)/VOLUME
Where:
RANGE — is the multiplication factor, which brings the difference in points down to whole numbers.
18) Momentum
The Momentum Technical Indicator measures the amount that a security’s price has changed over a given time span. There are basically two ways to use the Momentum indicator:
• You can use the Momentum indicator as a trend-followingoscillator similar to the Moving Average Convergence/Divergence (MACD). Buy when the indicator bottoms andturns up and sell when the indicator peaks and turns down.You may want to plot a short-term moving average of theindicator to determine when it is bottoming or peaking. Ifthe Momentum indicator reaches extremely high or lowvalues (relative to its historical values), you should assumea continuation of the current trend. For example, if theMomentum indicator reaches extremely high values and thenturns down, you should assume prices will probably go stillhigher. In either case, only trade after prices confirm the signal generated by the indicator (for example, if prices peak andturn down, wait for prices to begin to fall before selling).
• You can also use the Momentum indicator as a leadingindicator. This method assumes that market tops are typicallyidentified by a rapid price increase (when everyone expects prices to go higher) and that market bottoms typically end withrapid price declines (when everyone wants to get out). This isoften the case, but it is also a broad generalization.
As a market peaks, the Momentum indicator will climb sharply and then fall off — diverging from the continued upward or sideways movement of the price. Similarly, at a market bottom, Momentum will drop sharply and then begin to climb well ahead of prices. Both of these situations result in divergences between the indicator and prices.
MT4 USER GUIDE

58
CalculationMomentum is calculated as a ratio of today’s price to the price several (N) periods ago.
MOMENTUM = CLOSE(i)/CLOSE(i-N)*100
Where:CLOSE(i) - is the closing price of the current bar;CLOSE(i-N) - is the closing bar price N periods ago.
19) Money Flow Index
Money Flow Index (MFI) is the technical indicator, which indicates the rate at which money is invested into a security and then withdrawn from it. Construction and interpretation of the indicator is similar to Relative Strength Index with the only difference that volume is important to MFI.
When analyzing the money flow index one needs to take into consideration the following points:
• divergences between the indicator and price movement. Ifprices grow while MFI falls (or vice versa), there is a greatprobability of a price turn;
• Money Flow Index value, which is over 80 or under 20,signals correspondingly of a potential peak or bottom of themarket.
CalculationThe calculation of Money Flow Index includes several stages. At first one defines the typical price (TP) of the period in question.TP = (HIGH + LOW + CLOSE)/3
Then one calculates the amount of the Money Flow (MF): MF = TP * VOLUME
If today’s typical price is larger than yesterday’s TP, then the money flow is considered positive. If today’s typical price is lower than that of yesterday, the money flow is considered negative.
A positive money flow is a sum of positive money flows for a selected period of time. A negative money flow is the sum of negative money flows for a selected period of time.
Then one calculates the money ratio (MR) by dividing the positive money flow by the negative money flow:
MR = Positive Money Flow (PMF)/Negative Money Flow (NMF)
And finally, one calculates the money flow index using the money ratio:MFI = 100 - (100 / (1 + MR))
20) Moving Average
The Moving Average Technical Indicator shows the mean instrument price value for a certain period of time. When one calculates the moving average, one averages out the instrument price for this time period. As the price changes, its moving average either increases, or decreases.
There are four different types of moving averages: Simple (also referred to as Arithmetic), Exponential, Smoothed and Linear Weighted. Moving averages may be calculated for any sequential data set, including opening and closing prices, highest and lowest prices, trading volume or any other indicators. It is often the case when double moving averages are used.
The only thing where moving averages of different types diverge considerably from each other, is when weight coefficients, which are assigned to the latest data, are different. In case we are talking of simple moving average, all prices of the time period in question, are equal in value. Exponential and Linear Weighted Moving Averages attach more value to the latest prices.
The most common way to interpreting the price moving average is to compare its dynamics to the price action. When the instrument price rises above its moving average, a buy signal appears, if the price falls below its moving average, what we have is a sell signal.
This trading system, which is based on the moving average, is not designed to provide entrance into the market right in its lowest point, and its exit right on the peak. It allows to act according to the following trend: to buy soon after the prices reach the bottom, and to sell soon after the prices have reached their peak.
Moving averages may also be applied to indicators. That is where the interpretation of indicator moving averages is similar to the interpretation of price moving averages: if the indicator rises above its moving average, that means that the ascending indicator movement is likely to continue: if the indicator falls
MT4 USER GUIDE

59
below its moving average, this means that it is likely to continue going downward.
Here are the types of moving averages on the chart:• Simple Moving Average (SMA)
• Exponential Moving Average (EMA)
• Smoothed Moving Average (SMMA)
• Linear Weighted Moving Average (LWMA)
Calculation
Simple Moving Average (SMA)Simple, in other words, arithmetical moving average is calculated by summing up the prices of instrument closure over a certain number of single periods (for instance, 12 hours). This value is then divided by the number of such periods.
SMA = SUM(CLOSE, N) / N.
Where:N — is the number of calculation periods.
Exponential Moving Average (EMA)Exponentially smoothed moving average is calculated by adding the moving average of a certain share of the current closing price to the previous value. With exponentially smoothed moving averages, the latest prices are of more value. P-percent exponential moving average will look like:
EMA = (CLOSE(i) * P) + (EMA(i - 1) * (100 - P))
Where:CLOSE(i) - the price of the current period closure;
EMA(i-1) - Exponentially Moving Average of the previous period closure;
P - the percentage of using the price value.
Smoothed Moving Average (SMMA)The first value of this smoothed moving average is calculated as the simple moving average (SMA):
SUM1 = SUM(CLOSE, N)SMMA1 = SUM1/N
The second and succeeding moving averages are calculated according to this formula:
PREVSUM = SMMA(i - 1) * NSMMA(i) = (PREVSUM - SMMA(i - 1) + CLOSE(i)) / N
Where:
SUM1 - is the total sum of closing prices for N periods; PREVSUM - smoothed sum of previous bar;
SMMA1 - is the smoothed moving average of the first bar;
SMMA(i) - is the smoothed moving average of the current bar (except for the first one);
CLOSE(i) - is the current closing price;
N - is the smoothing period.
The formula can be simplified as a result of arithmetic manipulations:
SMMA (i) = (SMMA(i - 1) * (N - 1) + CLOSE (i)) / NLinear Weighted Moving Average (LWMA)In the case of weighted moving average, the latest data is of more value than more early data. Weighted moving average is calculated by multiplying each one of the closing prices within the considered series, by a certain weight coefficient.
LWMA = SUM(Close(i)*i, N) / SUM(i, N)
Where:SUM(i, N) - is the total sum of weight coefficients.
Moving Average Convergence/DivergenceMoving Average Convergence/Divergence is the next trend-following dynamic indicator. It indicates the correlation between two price moving averages.
The Moving Average Convergence/Divergence Technical Indicator is the difference between a 26-period and 12-period Exponential Moving Average (EMA). In order to clearly show buy/sell opportunities, a so-called signal line (9-period indicators` moving average) is plotted on the MACD chart.
The MACD proves most effective in wide-swinging trading markets. There are three popular ways to use the Moving Average Convergence/Divergence: crossovers, overbought/oversold conditions, and divergences.
CrossoversThe basic MACD trading rule is to sell when the MACD falls below its signal line. Similarly, a buy signal occurs when the Moving Average Convergence/Divergence rises above its signal line. It is also popular to buy/sell when the MACD goes above/below zero.
MT4 USER GUIDE

60
Overbought/oversold conditionsThe MACD is also useful as an overbought/oversold indicator. When the shorter moving average pulls away dramatically from the longer moving average (i.e., the MACD rises), it is likely that the security price is overextending and will soon return to more realistic levels.
DivergenceAn indication that an end to the current trend may be near occurs when the MACD diverges from the security. A bullish divergence occurs when the Moving Average Convergence/Divergence indicator is making new highs while prices fail to reach new highs. A bearish divergence occurs when the MACD is making new lows while prices fail to reach new lows. Both of these divergences are most significant when they occur at relatively overbought/oversold levels.
CalculationThe MACD is calculated by subtracting the value of a 26-period exponential moving average from a 12-periodexponential moving average. A 9-period dotted simplemoving average of the MACD (the signal line) is then plottedon top of the MACD.
MACD = EMA(CLOSE, 12)-EMA(CLOSE, 26)SIGNAL = SMA(MACD, 9)
Where:EMA - the Exponential Moving Average;
SMA - the Simple Moving Average;
SIGNAL - the signal line of the indicator.
Moving Average of OscillatorMoving Average of Oscillator is the difference between the oscillator and oscillator smoothing. In this case, Moving Average Convergence/Divergence base-line is used as the oscillator, and the signal line is used as the smoothing.
CalculationOSMA = MACD-SIGNAL
21) On Balance Volume
On Balance Volume Technical Indicator (OBV) is a momentum technical indicator that relates volume to price change. The indicator, which Joseph Granville came up with, is pretty simple. When the security closes higher than the
previous close, all of the day’s volume is considered up-volume. When the security closes lower than the previous close, all of the day’s volume is considered down-volume.
The basic assumption, regarding On Balance Volume analysis, is that OBV changes precede price changes. The theory is that smart money can be seen flowing into the security by a rising OBV. When the public then moves into the security, both the security and the On Balance Volume will surge ahead.If the security’s price movement precedes OBV movement, a “non-confirmation” has occurred. Non-confirmations can occur at bull market tops (when the security rises without, or before, the OBV) or at bear market bottoms (when the security falls without, or before, the On Balance Volume Technical Indicator).
The OBV is in a rising trend when each new peak is higher than the previous peak and each new trough is higher than the previous trough. Likewise, the On Balance Volume is in a falling trend when each successive peak is lower than the previous peak and each successive trough is lower than the previous trough. When the OBV is moving sideways and is not making successive highs and lows, it is in a doubtful trend.
Once a trend is established, it remains in force until it is broken. There are two ways in which the On Balance Volume trend can be broken. The first occurs when the trend changes from a rising trend to a falling trend, or from a falling trend to a rising trend.
The second way the OBV trend can be broken is if the trend changes to a doubtful trend and remains doubtful for more than three days. Thus, if the security changes from a rising trend to a doubtful trend and remains doubtful for only two days before changing back to a rising trend, the On Balance Volume is considered to have always been in a rising trend.
When the OBV changes to a rising or falling trend, a “breakout” has occurred. Since OBV breakouts normally precede price breakouts, investors should buy long on On Balance Volume upside breakouts. Likewise, investors should sell short when the OBV makes a downside breakout. Positions should be held until the trend changes.
CalculationIf today’s close is greater than yesterday’s close then:OBV(i) = OBV(i-1)+VOLUME(i)
If today’s close is less than yesterday’s close then:OBV(i) = OBV(i-1)-VOLUME(i)
MT4 USER GUIDE

61
If today’s close is equal to yesterday’s close then:OBV(i) = OBV(i-1)
Where:
OBV(i) - is the indicator value of the current period; OBV(i-1) - is the indicator value of the previous period; VOLUME(i) - is the volume of the current bar.
22) Parabolic SAR
Parabolic SAR Technical Indicator was developed for analyzing the trending markets. The indicator is constructed on the price chart. This indicator is similar to the Moving Average Technical Indicator with the only difference that Parabolic SAR moves with higher acceleration and may change its position in terms of the price. The indicator is below the prices on the bull market (Up Trend), when it’s bearish (Down Trend), it is above the prices.
If the price crosses Parabolic SAR lines, the indicator turns, and its further values are situated on the other side of the price. When such an indicator turn does take place, the maximum or the minimum price for the previous period would serve as the starting point. When the indicator makes a turn, it gives a signal of the trend end (correction stage or flat), or of its turn.
The Parabolic SAR is an outstanding indicator for providing exit points. Long positions should be closed when the price sinks below the SAR line, short positions should be closed when the price rises above the SAR line. It is often the case that the indicator serves as a trailing stop line.
If the long position is open (i.e., the price is above the SAR line), the Parabolic SAR line will go up, regardless of what direction the prices take. The length of the SAR line movement depends on the scale of the price movement.
Calculation
SAR(i) = SAR(i-1)+ACCELERATION*(EPRICE(i-1)-SAR(i-1))
Where:
SAR(i-1) - is the value of the indicator on the previous bar; ACCELERATION - is the acceleration factor;
EPRICE(i-1) - is the highest (lowest) price for the previous period (EPRICE=HIGH for long positions and EPRICE=LOW
for short positions).
The indicator value increases if the price of the current bar is higher than previous bullish and vice versa. The acceleration factor (ACCELERATION) will double at the same time, which would cause Parabolic SAR and the price to come together. In other words, the faster the price grows or sinks, the faster the indicator approaches the price.
23) Relative Strength Index
The Relative Strength Index Technical Indicator (RSI) is a price-following oscillator that ranges between 0 and 100. When Wilder introduced the Relative Strength Index, he recommended using a 14-day RSI. Since then, the 9-day and 25-day Relative Strength Index indicators have also gainedpopularity.
A popular method of analyzing the RSI is to look for a divergence in which the security is making a new high, but the RSI is failing to surpass its previous high. This divergence is an indication of an impending reversal. When the Relative Strength Index then turns down and falls below its most recent trough, it is said to have completed a “failure swing”. The failure swing is considered a confirmation of the impending reversal.
Ways to use Relative Strength Index for chart analysis:
Tops and bottomsThe Relative Strength Index usually tops above 70 and bottoms below 30. It usually forms these tops and bottoms before the underlying price chart;
Chart FormationsThe RSI often forms chart patterns such as head and shoulders or triangles that may or may not be visible on the price chart;
Failure swing ( Support or Resistance penetrations or breakouts)This is where the Relative Strength Index surpasses a previous high (peak) or falls below a recent low (trough);
Support and Resistance levelsThe Relative Strength Index shows, sometimes more clearly than price themselves, levels of support and resistance.
DivergencesAs discussed above, divergences occur when the price makes a new high (or low) that is not confirmed by a new high (or low)
MT4 USER GUIDE

62
in the Relative Strength Index. Prices usually correct and move in the direction of the RSI.
Calculation
RSI = 100-(100/(1+U/D))
Where:U - is the average number of positive price changes;
D - is the average number of negative price changes.
24) Relative Vigor Index
The main point of Relative Vigor Index Technical Indicator (RVI) is that on the bull market the closing price is, as a rule, higher, than the opening price. It is the other way round on the bear market. So the idea behind Relative Vigor Index is that the vigor, or energy, of the move is thus established by where the prices end up at the close. To normalize the index to the daily trading range, divide the change of price by the maximum range of prices for the day. To make a more smooth calculation, one uses Simple Moving Average. 10 is the best period. To avoid probable ambiguity one needs to construct a signal line, which is a 4-period symmetrically weighted moving average of Relative Vigor Index values. The concurrence of lines serves as a signal to buy or to sell.
Calculation
RVI = (CLOSE-OPEN)/(HIGH-LOW)
Where:OPEN - is the opening price;
HIGH - is the maximum price;
LOW - is the minimum price;
CLOSE - is the closing price.
25) Standard Deviation
Standard Deviation - value of the market volatility measurement. This indicator describes the range of price fluctuations relative to simple moving average. So, if the value of this indicator is high, the market is volatile, and prices of bars are rather spread relative to the moving average. If the indicator value is low, the market can described as having a low volatility, and prices of bars are rather close to the moving average.
Normally, this indicator is used as a constituent of other indicators. Thus, when calculating Bollinger Bands, one has to add the symbol standard deviation value to its moving average.
Calculation
StdDev = SQRT (SUM (CLOSE - SMA (CLOSE, N), N)^2)/N
Where:
SQRT - square root;
SUM (..., N) - sum within N periods;
SMA (..., N) - simple moving average having the period of N;
N - calculation period.
26) Stochastic Oscillator
The Stochastic Oscillator Technical Indicator compares where a security’s price closed relative to its price range over a given time period. The Stochastic Oscillator is displayed as two lines. The main line is called %K. The second line, called %D, is a Moving Average of %K. The %K line is usually displayed as a solid line and the %D line is usually displayed as a dotted line.
There are several ways to interpret a Stochastic Oscillator. Three popular methods include:
• Buy when the Oscillator (either %K or %D) falls below aspecific level (for example, 20) and then rises above that level. Sell when the Oscillator rises above a specific level (forexample, 80) and then falls below that level;
• Buy when the %K line rises above the %D line and sell whenthe %K line falls below the %D line;
• Look for divergences. For instance: where prices are makinga series of new highs and the Stochastic Oscillator is failing tosurpass its previous highs.
CalculationThe Stochastic Oscillator has four variables:
• %K periods. This is the number of time periods used in thestochastic calculation;
• %K Slowing Periods. This value controls the internalsmoothing of %K. A value of 1 is considered a fast stochastic; avalue of 3 is considered a slow stochastic;
• %D periods. his is the number of time periods used whencalculating a moving average of %K; c;
MT4 USER GUIDE

63
• %D method. The method (i.e., Exponential, Simple,Smoothed, or Weighted) that is used to calculate %D.
The formula for %K is:%K = (CLOSE-LOW(%K))/(HIGH(%K)-LOW(%K))*100
Where:CLOSE - is today’s closing price;
LOW(%K) - is the lowest low in %K periods;
HIGH(%K) - is the highest high in %K periods.
The %D moving average is calculated according to the formula: %D = SMA(%K, N)
Where:N - is the smoothing period;
SMA - is the Simple Moving Average.
27) Williams’ Percent Range
Williams’ Percent Range Technical Indicator (%R) is a dynamic technical indicator, which determines whether the market is overbought/oversold. Williams’ %R is very similar to the Stochastic Oscillator. The only difference is that %R has an upside down scale and the Stochastic Oscillator has internal smoothing.
To show the indicator in this upside down fashion, one places a minus symbol before the Williams Percent Range values (for example -30%). One should ignore the minus symbol when conducting the analysis.
Indicator values ranging between 80 and 100% indicate that the market is oversold. Indicator values ranging between 0 and 20% indicate that the market is overbought.
As with all overbought/oversold indicators, it is best to wait for the security’s price to change direction before placing your trades. For example, if an overbought/oversold indicator is showing an overbought condition, it is wise to wait for the security’s price to turn down before selling the security.An interesting phenomenon of the Williams Percent Range indicator is its uncanny ability to anticipate a reversal in the underlying security’s price. The indicator almost always forms a peak and turns down a few days before
the security’s price peaks and turns down. Likewise, Williams Percent Range usually creates a trough and turns up a few days before the security’s price turns up.
CalculationBelow is the formula of the %R indicator calculation, which is very similar to the Stochastic Oscillator formula:
%R = (HIGH(i-n)- CLOSE)/(HIGH(i-n)-LOW(i-n))*100
Where:CLOSE - is today’s closing price;
HIGH(i-n) - is the highest high over a number (n) of previous periods;
LOW(i-n) - is the lowest low over a number (n) of previous periods.
F. TRADING
The fundamental and simple rule of profitable trading at finan-cial markets is to buy cheaper and sell dearer. Thus, the entire trading activities at financial markets come to the successive operations performed to sell or buy securities. To do so, one has to open, modify, and close trade positions. Trade position is a market commitment (order), the number of bought or sold contracts for which no set-off transactions have been made. The entire trading in the terminal is implemented through trade positions.
To open a trade position, one has to make a transaction, and to close a position, one has to make an inverse operation. A position can be opened by a brokerage company at a market order or at execution of a pending order. An open position can be modified if values of the Stop Loss and Take Profit orders levels attached to the position are changed. Positions can be closed on the trader’s demand or at execution of Stop Loss or Take Profit orders. Besides, positions can be opened, modified, or closed with an expert advisor — this mechanism is described in another section.
a) Order Types
Client terminal allows to prepare requests and request the broker for execution of trading operations. Moreover, terminal allows to control and manage open positions. For these purposes, several types of trading orders are used. Order is a client’s commitment to brokerage company to perform a trade operation. The following orders are used in the terminal: Market order, Pending order, Stop Loss and Take Profit.
MT4 USER GUIDE
64
Market OrderMarket order is a commitment to the brokerage company to buy or sell a security at the current price. Execution of this order results in opening of a trade position. Securities are bought at ASK price and sold at BID price. Stop Loss and Take Profit orders (described below) can be attached to a market order. Execution mode of market orders depends on security traded.
Pending OrderPending order is the client’s commitment to the brokerage company to buy or sell a security at a pre-defined price in the future. This type of orders is used for opening of a trade position provided the future quotes reach the pre-defined level. There are four types of pending orders available in the terminal:
1. Buy Limit - buy provided the future “ASK” price is equalto the predefined value. The current price level is higher thanthe value of the placed order. Orders of this type are usuallyplaced in anticipation of that the security price, having fallento a certain level, will increase;
2. Buy Stop - buy provided the future “ASK” price is equalto the predefined value. The current price level is lower than the value of the placed order. Orders of this type are usuallyplaced in anticipation of that the security price, havingreached a certain level, will keep on increasing;
3. Sell Limit - sell provided the future “BID” price is equal tothe predefined value. The current price level is lower than the value of the placed order. Orders of this type are usuallyplaced in anticipation of that the security price, havingincreased to a certain level, will fall;
4. Sell Stop - sell provided the future “BID” price is equalto the predefined value. The current price level is higher than the value of the placed order. Orders of this type areusually placed in anticipation of that the security price,having reached a cer tain level, will keep on falling. Ordersof Stop Loss and Take Profit can be attached to a pending order. After a pending order has triggered, its Stop Lossand Take Profit levels will be attached to the open position automatically.
Stop LossThis order is used for minimizing of losses if the security price has started to move in an unprofitable direction. If the security price reaches this level, the position will be closed automatically. Such orders are always connected to an open position or a pending order. The brokerage company can place them only together with a market or a pending order.
Terminal checks long positions with BID price for meeting of this order provisions, and it does with ASK price for short positions.
To automate Stop Loss order following the price, one can use Trailing Stop.
Take ProfitTake Profit order is intended for gaining the profit when the security price has reached a certain level. Execution of this order results in closing of the position. It is always connected to an open position or a pending order. The order can be requested only together with a market or a pending order. Terminal checks long positions with BID price for meeting of this order provisions, and it does with ASK price for short positions.
Attention:• execution prices for all trade operations are defined by the broker;• Stop Loss and Take Profit orders can only be executed for an open position, but not for pending orders;• history charts are drawn only for BID prices in the terminal.At that, a part of orders shown in charts is drawn for ASKprices. To enable displaying of the latest bar ASK price, onehas to flag the “Show Ask line” in the terminal settings.
Trailing StopStop Loss is intended for reducing of losses where the symbol price moves in an unprofitable direction. If the position becomes profitable, Stop Loss can be manually shifted to a break-even level. To automate this process, Trailing Stop was created. This tool is especially useful when price changes strongly in the same direction or when it is impossible to watch the market continuously for some reason.
Trailing Stop is always attached to an open position and works in client terminal, not at the server like Stop Loss, for example. To set the trailing stop, one has to execute the open position context menu command of the same name in the “Terminal” window. Then one has to select the desirable value of distance between the Stop Loss level and the current price in the list opened. Only one trailing stop can be set for each open position.
After the above actions have been performed, at incoming of new quotes, the terminal checks whether the open position is profitable. As soon as profit in points becomes equal to or
MT4 USER GUIDE

65
higher than the specified level, command to place the Stop Loss order will be given automatically. The order level is set at the specified distance from the current price. Further, if price changes in the more profitable direction, trailing stop will make the Stop.
Loss level follow the price automatically, but if profitability of the position falls, the order will not be modified anymore. Thus, the profit of the trade position is fixed automatically. After each automatic Stop Loss order modification, a record will be made in the terminal journal.
Trailing stop can be disabled by setting “None” in managing menu. And trailing stops of all open positions and pending orders will be disabled if the “Delete All” command of the same menu has been executed.
Attention:Trailing Stop works in the client terminal, not in the server (like Stop Loss or Take Profit). This is why it will not work, unlike the above orders, if the terminal is off. In this case, only the Stop Loss level will trigger that has been set by trailing stop.
b) Types of Execution
There are three order execution modes in the client terminal:
Instant ExecutionIn this mode, the order is executed at the price offered to the broker. At sending the order to be executed, terminal sets the current prices in the order. If broker accepts the prices, the order will be executed. If not, the so-called “Requote” will occur: Broker returns prices at which the order can be executed.
Execution on RequestIn this mode, the market order is executed at the price previously received from the broker. Prices for a certain market order are requested from the broker before the order is sent. After the prices have income, order execution at the given price can be either confirmed or rejected.
Execution by MarketIn this order execution mode, broker makes a decision about the order execution price without any additional discussion with the trader. Sending of the order in such a mode means advance consent to its execution at this price.
Attention:Execution mode for each security is defined by the brokerage company.
c) Open Positions
Opening of a position, or entering the market, is the first buying or selling of a certain amount of the security traded. Position can be opened either by execution of a market order or by automatic triggering of a pending order.
Market OrderTo open a position using a market order, one has to execute the “Tools - New Order” menu command, press the button of the “Standard” toolbar, press F9, or double-click on the symbol name in the “Market Watch” window. One can also execute the “New Order” context menu command of the windows of “Market Watch” and “Terminal - Trade”. At that, the “Order” window will open that is used for managing of trade positions. When opening a position, one has to:
• Symbol - select a security symbol for which the position isto be opened;• Volume - specify the trade volume (amount of lots);• Stop Loss - set the Stop Loss level (optionally);• Take Profit - set the Take Profit level (optionally);
Attention:Zero values of Stop Loss/Take Profit orders mean that the orders have not been placed at all
• Comment - write a comment (optionally). The commentlength may not exceed 25 characters. The brokeragecompany may add a comment not above 6 characters long,or it can completely replace the existing one. After a positionhas been opened, the comment cannot be changed;
• Enable maximum deviation from quoted price - enable/disable the use of deviation. If a broker requotes the priceof order execution, the deviation of the new price from thequoted before will be calculated. At that, if the deviation isbelow or equal to the specified parameter, the order will beexecuted at the new price without any additional notifying.Otherwise, the broker returns new prices at which the ordercan be executed;
• Maximum deviation — the value of maximum permissibledeviation in pips.
MT4 USER GUIDE
66
Attention:Price deviation at placing of orders is used only in the instant execution mode.
After all necessary data have been specified, one has to press the “Sell” or “Buy” button. At that, the order for opening of a short or long position, respectively, will be sent to the broker.
Attention:If orders for a given symbol are executed at request, it is necessary to press the “Request” button to receive quotes first. Quotes offered after requesting will be active for just a few seconds. If no decision is made within these seconds, “Sell” and “Buy” buttons will be locked again.
If the Stop Loss or Take Profit level is too close to the current price at opening of a position, the message of “Invalid S/L or T/P” will appear. It is necessary to shift levels from the current price and re-request for placing of the order. A trade position will be opened after the brokerage company has made a trade and set Stop Loss and Take Profit. At that, the status bar of the opened position will appear in the “Terminal - Trade” tab, and open price, Stop Loss and Take Profit levels will be shown in the chart (if the “Show trade levels” option is enabled).
• Pending orders. To open a position with a pending order,one has to place it first as described in the “Placing of Pending Order” section. If the current prices meet its provi-sions, the pending order will be executed automatically, i.e.,a new trade position will be opened. At that, the status barof the pending order will be deleted in the “Terminal - Trade”tab, and the newly opened position status bar will appear.If Stop Loss and Take Profit orders were attached to the pending order, they will be attached to the new positionautomatically.
d) Trade Positions
The fundamental and simple rule of profitable trading at financial markets is to buy cheaper and sell dearer. Thus, the entire trading activities at financial markets come to the successive operations performed to sell or buy secu-rities. To do so, one has to open, modify, and close trade positions. Trade position is a market commitment (order), the number of bought or sold contracts for which no set-off transactions have been made. The entire trading in the terminal is implemented through trade positions. Client
Terminal gives a large amount of opportunities in controlling and managing of trade positions. Trader gives instructions (orders), and Brokerage Company opens or closes a posi-tion. Managing of trade positions consists in:
• Opening of a position - buying or selling of a security as aresult of a market or a pending order execution;
• Modifying of a position - changing of the Stop Loss andTake Profit levels attached to the open position;
• Placing of pending orders - placing of pending orders likeBuy Limit, Buy Stop, Sell Limit, or Sell Stop;
• Modifying and deletion of pending orders - modifying ordeletion of pending orders that did not trigger;
• Closing of a position - buying or selling a security in orderto close the existing open position.
Modifying of PositionsModifying of the current position consists in setting of new levels of Stop Loss or Take Profit attached to it. To modify a position, one has to execute the “Modify or Delete Order” command of the opened position context menu or double-click with the left mouse button in the fields of “Stop Loss” or “Take Profit” of the opened position line in the “Terminal” window. Then, one has to set new values of Stop Loss or Take Profit and press the “Modify” button.
To change the Stop Loss or Take Profit values, one has to enter the new values in the corresponding fields. To place the order in points from the current price, one has to set the desired value in the “Level” field and press the “Copy as” but-ton. If values of these fields are zero, the minimum permissi-ble deviation is used to be set by broker.
If Stop Loss or Take Profit level is too close to the current price, the “Modify” button will be locked. It is necessary to shift levels from the current price and re-request for position modifying. A trade position will be modified after the broker-age company has set a new value for Stop Loss or Take Profit, or both. Values in the fields of “S/L” and “T/P” will be changed in the opened position status bar in the “Terminal - Trade” tab. At that, levels of the modified orders will be changed if the “Show trade levels” option is enabled.
Attention:Zero values in the fields of “Stop Loss” and “Take Profit” mean that these orders were not placed.
MT4 USER GUIDE

67
Position CloseBuying or selling of a security opens a trade position. Then, in order to gain profit of the bid-and-ask price differences, one has to close the position. The latter trade operation is reverse towards to former one. For example, if the former operation consisted in buying of one lot of GOLD, then one lot of the same symbol must be sold to close the position. Positions can be closed differently in the client terminal: It can be closing of a single position, closing of a position by an opposite position, and multiple close by several positions.
Single Position ClosingA single open trade position will be closed automatically if prices equal to values of Stop Loss or Take Profit.
Attention:When a long position is being closed, the Bid price must equal to the value of Stop Loss or Take Profit, and Ask price must do for short positions.
To close a position manually, one has to execute the opened position context menu command of the “Terminal - Trade” window or double-click with the left mouse buttonon this position. If trade operations for a certain symbol areexecuted on request, one has first to receive quotes by pressing of the “Request” button. This activates the buttonthat allows closing position.
Attention:• in the “Execution on request” mode, the offered quoteswill be active for just a few seconds. If no decision hasbeen made within these seconds, the “Close... “ button willbe locked again;
• client terminal allows to close positions partially. To do so,one has to specify the amount of lots less than that givenfor the opened position in the “Volume” field before press-ing of the “Close... “ button;
• broker can close positions, as well. For example, it can bedone when prices reach the “Stop Out” level that was setby the broker;
• history charts are drawn only on BID prices in the termi-nal. At that, a part of orders shown in charts is drawn onASK prices. To get ASK price of the latest bar shown, onehas to flag “Show Ask line” option in the terminal settings.
Close by Opposite PositionsOpposite position towards the given one is a reverse posi-
tion for the same symbol. If there is one or more opposite posi-tions among the open positions, one can close the selected po-sition by and together with an opposite one. To do so, one has first to open the “Order” window (as described above). Then, the “Close by the opposite” must be selected in the “Type” field. After that, the list of all opposite positions will appear in the low-er part of the window. One has to select an opposite position in this list and after that the “Close... “Button will be activated. It allows you to close two positions at the same time. Only one of two opposite positions with different amounts of lots to be trad-ed will remain. The volume (amount of lots) of this position will equal to the difference between lots of the two closed positions, and its direction and open price (short or long) will correspond with those of the larger (in volume) of two closed positions.
Multiple Close by Opposite PositionsMultiple close of several opposite positions allows to close more than two opposite positions at the same time. To per-form this operation, one has also to open the “Order” window (as described above). Then the “Multiple close by” must be selected in the “Type” window. At that, the list of all opposite positions will appear in the lower part of the window, and the “Multiple close by... “ button will be active. It allows you to close opposite positions. Positions will be closed in pairs, according to the open time, and they will be closed as described above for two opposite positions. If the difference between the sums of volumes is not zero, a new position will be opened as a result of the operation, the volume being equal to this difference. The newly opened position will participate in the multiple close processes, but according to its open time, and so on until all positions are closed or the last resulting position is opened.
Attention:After opposite positions have been closed, the correspond-ing records will be made in the “Terminal - Account History” window. At that, overhead information about closing of opposite positions will be entered in the “Comment” field.
e) Placing of Pending Orders
To place a pending order, one has to open the “Order” window. This can be done by the “Tools — New Order” menu command, the button of the “Standard” toolbar, by pressing of F9, by the “New Order” command of the “Market Watch” and “Terminal - Trade” window context menus, as well as by double-clicking on the symbol name in the “Market Watch” window. “Pending Order” must be selected in the “Type” field of this window.
Further, a security (symbol) must be selected; the volume and
MT4 USER GUIDE
68
values of Stop Loss and Take Profit orders must be speci-fied. If necessary, a comment can be written in the field of the same name. In the “Pending Order” fields one has to:
• Type - select a type of pending order: Buy Limit, BuyStop, Sell Limit, or Sell Stop;
• at price - set the price level at which the order musttrigger;
• Expiry - set the expiry time of the order. If the order hasnot triggered by this time, it will be deleted automatically.
Attention:Order may not expire earlier than in 10 minutes!
The “Place” button will send the order to be executed what is performed in two stages. First, the brokerage compa-ny places the order after it has been sent. At that, a line containing the number and status of the pending order will appear in the “Terminal - Trade” tab. If the “Show trade levels” option is enabled, levels of the placed pending order (including levels of Stop Loss and Take Profit) will be shown in the chart. At the second stage, if prices corre-spond with the order provisions, it will be deleted and a trade position will be opened instead of it. The trade posi-tion ticket will coincide with the pending order ticket. These changes will be shown in the “Terminal - Trade” window.
Attention:Stop Loss and Take Profit orders trigger only at open posi-tions, but not at pending orders.
Modifying of Pending OrdersWhen working at the market, one often needs to modify or delete the placed pending order. To do so, one has to exe-cute the pending order context menu command of “Modify or Delete Order” or double-click with the left mouse button on the pending order status bar in the “Terminal - Trade” window. The window for order managing will open. New price of the pending order triggering, new levels of Stop Loss and Take Profit, as well as expiry time of the order can be set in this window. After the order has been modified, one has to press the “Modify” button.
Attention:Setting of zero values for Stop Loss and Take Profit equals to disabling of these orders.
If the pending order has been successfully modified, the values of the corresponding fields in the “Terminal - Trade” window will be changed. If the “Show trade levels” option in the terminal settings has been enabled, the pending order levels and those of Stop Loss and Take Profit attached to it will be shifted correspondingly in the chart, as well.
Deletion of a Pending OrderIf market situation has been changed, there can occur a necessity to delete a pending order. To do so, one has to execute the “Modify or Delete Order” pending order context menu command or double-click with the left mouse button on the status bar of the pending order in the “Terminal - Trade” window. The window that manages orders will open. To delete an order, the button of the same name must be pressed in it. Pending orders can also be deleted automat-ically at the time that has been given in the “Expiry” field. When a pending order has been deleted, the correspond-ing record will appear in the “Terminal - Account History” window.
G. AUTO TRADING
To work at financial markets more effectively, one can develop one’s own successful system of trading. It is very difficult to act within a chosen system of trading in the manual mode due to significant influence of normal human emotions. Mechanical trading systems do not suffer from this disadvantage.
Client Terminal gives a large range of means for devel-opment and use of mechanical trading systems (MTS, experts, advisors). The development environment allows to create, debug, and test expert advisors. Experts are able not only alert about recommendation trading signals, but undertake the complete control over trading activities online.
MetaQuotes Language 4, MetaEditor and strategy testing tools are built in the terminal. One can create the following using these means:
• Expert Advisors - mechanical trading systems that allowcomplete automation of analytical and trading activities;
• Custom Indicators - independently written technicalindicators intended for analyzing of price changes;
• Scripts - programs to be executed only once, on request.
MT4 USER GUIDE

69
a) Meta Quotes Language 4
MetaQuotes Language 4 (MQL 4) is the language for pro-gramming of trade strategies built in the client terminal. It allows to write custom expert advisors that automate trade processes and ideally suit for implementation of traders’ own strategies. Moreover, traders’ own custom indicators, scripts and DLL’s can be created in MQL 4.
Syntax of MQL 4 is quite similar to that of C language. A large amount of functions necessary to analyze quotes, manage positions, call technical indicators, and others, are included in MQL 4. The MetaEditor, an editor for expert advisors, is used for writing the source code of programs. The MetaQuotes Language Dictionary that contains descriptions of all lan-guage constructions and functions is built in the editor.
Programs written in MQL 4 are different in tasks and properties:
• Expert Advisor is a mechanical trading system (MTS) tobe run when a new tick incomes. It can work not only in themode alerts, but also perform trade operations independent-ly. Terminal allows to test trading strategies on history datain order to detect the expert features under different marketconditions;
• Custom Indicator is a technical indicator written individu-ally. Custom indicators are used only for analyzing of pricechanges;
• Script is a program that is intended for a single execution ofsome actions. Unlike experts, scripts are launched not tick bytick, but on a command.
b) Meta Editor
MetaEditor is a constituent of the client terminal. It is intend-ed for creation, editing, and compilation of program source codes written in MetaQuotes Language 4 (MQL4). It can be used in developing of experts, custom indicators, scripts and DLL’s.Expert Advisors Wizard is built in the editor to assist in fast creation of new MQL4 programs. The new file will be saved in the corresponding folder of the client terminal automatical-ly. Templates can be used in creation of an MQL4 program, as well. After that, one can start writing of the program text. The supplemental information can be found in MQL4 Dic-tionary. The full description of the language with examples of how to use it is given there. After the program has been written, one has to compile it in MetaEditor. As a result of
successful compiling, the executable program code will be created that can be launched or tested in the terminal.
A detailed description of MetaEditor can be found in its Help Files.
c) Expert Advisors
Expert Advisors (experts) are programs in the terminal that have been developed in MetaQuotes Language 4 (MQL 4) and used for automation of analytical and trading processes. They allow you to perform prompt technical analysis of price data and manage trading activities on basis of signals re-ceived. The entire routine work of technical analysis and trad-ing can be given to experts. An expert can perform analytical and trading operations for any symbols or periods independ-ent on whether the corresponding chart was opened or not.
Working with experts means:
Creation of an ExpertTo create and compile an expert, one has to use the built-in “MetaEditor”. It is a constituent of the client terminal and represents a convenient development environment of MQL4 programs.
Expert SetupBefore using of experts, one has to set up them first. Working parameters common for all experts are set in the client termi-nal settings. Besides, each expert can have its own settings. Launch of an ExpertTo launch an expert, one has to impose it into the chart. As soon as a new tick incomes, the expert will start executing.
Expert ShutdownAn expert advisor is shut down after it has been removed from the chart.
Creation of an ExpertTo create experts, one has to use MetaQuotes Language 4 (MQL 4) and MetaEditor. To launch the expert editing program, one has to execute the “Create” command of the “Navigator - Expert Advisors” window context menu, or the “Tools - MetaQuotes Language Editor” menu command, or press F4 or the button of the “Standard” toolbar. After that, the Expert Creation Wizard will be opened automatically that allows to immediately start working at a new MQL4 program. One has to flag the “Expert Advisor” as a type of object to be created and fill out the following fields:
MT4 USER GUIDE

70
• Name - expert name;• Developer - the developer’s name;• Link - link to the developer’s site;• Inputs - the list of expert inputs. To add a new parameter,one has to press the “Add” button or the “Delete” button todelete a parameter.
After that the new expert window with the defined inputs will open in editor. The source file (*.MQ4) of the expert will be saved in the /EXPERTS folder of the client terminal auto-matically. At this moment, one can start to write the expert code.
After the expert development has been completed, it must be compiled. To do so, one has to execute the “File - Com-pile” command in the expert editor, or press F5 or the button of the toolbar. As a result of successful compilation an executable program file with *.EX4 extension will be created and saved in the /EXPERTS folder automatically. The list of compiled experts can be viewed in the “Navigator - Expert Advisors” window in the client terminal. If the expert has not been compiled successfully, its icon will be gray. This means that this expert cannot be used.
Editing of ExpertsTo start editing of the existing expert from the terminal, one has to execute the “Modify” command of the “Navigator - Expert Advisors” window context menu. At that, the experts editor will open where the source code of the selected expert. After the expert source code has been modified, one has to recompile it and get a new executable EX4 file. Oth-erwise, terminal will use the previous version of the expert, the non-modified one
Attention:If the expert has not been compiled successfully, its icon will be gray. This means that this expert cannot be used.
Expert SetupBefore using of experts, one has to set them up first. Work-ing parameters common for all experts are defined in the client terminal settings window. This window can be opened by the “Tools - Options” menu command or by pressing of accelerating keys of Ctrl+O. To set up expert parameters, one has to select the “Expert Advisors” tab. The following settings are available in it:
Enable Expert AdvisorsThis option allows to enable or disable the use of all experts. If it is disabled, the start() function will stop execute for all experts when a new tick incomes. At that, the smileys at the expert names in the upper right corners of charts will be replaced with daggers. To enable experts, one has to flag this option and press “OK”. They will start functioning when a new tick in-comes, and daggers in the upper right corners will be replaced with smileys again.
Attention:• the expert will start function when a new tick incomes, and itoften completes its work before the next tick incomes. Disablingof experts does not interrupt working of those that are activealready;• this options covers only expert advisors and does not allow todisable custom indicators and scripts automatically.
Disable experts when the account has been changedThis option represents a safety tool that disables experts when the account has been changed. It can be useful, for example, when one switches from a demo account to a real one. To enable it, one has to flag it and press “OK”.
Disable experts when the profile has been changedA large amount of information about the current settings of all charts of the workspace is saved in profiles. Particularly, information about the attached experts is saved in profiles. Experts included into a profile will start working when a new tick incomes. Having enabled this option, one can disable launching of experts when the profile has been changed.
Allow live tradingExperts can work automatically, without trader’s participation. They can both analyze price changes and trade. This option is intended for limiting of trading functions of experts. These limitations can be useful for testing of analytical capacities of an expert in the real-time mode (not to be mixed up with testing of an expert on history data).
Ask manual confirmationThis option will only be enabled if experts are allowed to trade. If this option is enabled and the expert tries to trade, one will be able to confirm the trade or interrupt it manually. In other words, trading activities of experts can be managed through this manu-al confirmation option. This can be useful for testing of trading functions of an expert in the real-time mode (not to be mixed up with testing of an expert on history data).
MT4 USER GUIDE

71
Allow DLL importsExperts can use DLLs to enlarge their functionalities. If this option is enabled, the libraries can be used without any lim-itations. Disabling of the option results in that no expert can use any external DLLs. It is recommended not to allow DLL imports when working with unknown experts.
Confirm DLL function callsThis option will only be enabled if DLL imports are allowed. It allows to control over execution of each called function man ually. If it is disabled, the imports from external libraries will not be controlled. This option is recommended to be enabled when working with unknown experts.
Allow external experts importsIf there is a need to export functions from other experts or MQL4 libraries during the expert functioning, one has to en-able this option. If it is disabled, no expert already launched will be able to call functions from other MQL4 programs. This option is recommended to be disabled when working with unknown experts.
Launch of an Expert AdvisorAfter general parameters have been set up, experts can be launched. To do so, it is enough just to attach the expert to the chart. The “Attach to a chart” command of the “Navigator — Expert Advisors” window context menu or double click with the left mouse button on the selected expert in the same win-dow allows to impose it into the active chart. “Drag’n’Drop” technique allows to impose the expert into any chart. At that, the window of the expert special settings will appear. In its “Common” tab, it is possible:
• Positions - select the direction of position opening:
1. Long & Short - in both directions;
2. Only Long - only for buying;
3. Only Short - only for selling.
• Enable alerts - enable/disable the expert to alert;
• Disable alert once hit - disable alerts after the first alert has been given;
• Allow live trading - enable/disable live trading;
• Ask manual confirmation - request for manual confirma-tion of position opening when trading;
• Allow DLL imports - enable/disable imports of functionsfrom DLL files;
• Confirm DLL function calls - request for confirmations at each function call from DLL files;
• Allow import of external experts — enable/disable callingof functions from external experts.
External variables of the expert can be changed in the “Inputs” tab. these are variables of extern class. To save an input, one has to double-click with the left mouse button on its value and write the new one. At that, one can change the value of each variable or download the set of inputs already saved (the “Load” button). One can save the current set of external varia-bles using the button of the same name.
The “Reset” button returns all default settings. Parameters defined in the terminal settings are given in the “Common” tab. And parameters defined in the program source code are set as inputs. To attach the expert with the new parameters to a chart, one has to press “OK”. To cancel the expert imposing, one has to press the button of the same name.
Attention:Only attached experts can be set up individually. However, while current executing, the window of the expert properties cannot be opened. This can be done only during intervals between calls of the start() function. At that, the expert will not be launched until its properties window is closed. If the expert inputs were changed, the expert will be re-initialized with its new inputs at pressing of “OK”.
After an expert has been set up, it will be initialized and, as soon as a new tick incomes, execute. Expert is attached if its name and a smiley can be seen in the upper right corner of the chart. If live trading is disabled in the expert settings, a ? will appear instead of the smiley. A dagger (?) means that all experts are disabled.
Attention:Only one expert can be attached to a chart. If another expert is imposed, the previous one will be deleted from the chart.
Expert ShutdownTo shut down an expert, one has to remove it from the chart. Expert must have been reinitialized before it is shut down. To remove an expert from the chart, one has to execute the chart context menu “Expert Advisors — Delete” command or attach another expert to the same chart. Besides, the expert can be removed from the chart at profile or template change.
MT4 USER GUIDE

72
Attention:• at client terminal shutdown, all experts are shut down, too;• at chart closing, the expert attached to this chart will be shutdown;• at imposing of another expert, the previous one will beremoved after confirmation;• detetion of the expert from the “Navigator“ window doesnot shut down the expert of the same name imp[osed in thechart;• disabling of experts in the cleint terminal settings does notprovide complete disabling of experts. This option stopslaunching of the start () function of each expert, byt the init()will continue to execute.
d) Strategy Testing
The terminal allows not only write expert advisors, but also test them before using. This useful function allows to check operativeness and efficiency of the trading system on history data. Testing allows to start automated trading with the full knowledge about expert conduct under different market conditions. The special “Tester” window was built into the ter-minal for this purpose. Using this window, one can optimize expert inputs, as well.
Setup of Testing ParametersBefore starting to test expert advisors, one has to perform the setup. This means that one has to:
• select an expert and set up its inputs• select a symbol and its period• select one of three modeling methods• set the testing time range
To test and optimize experts, a special “Tester” window is used in the terminal. All above parameters are set in the “Settings” tab of this window.
An Expert Advisor and its ParametersOne has to select an expert to be tested in the “Tester - Expert Advisor” field. One cannot select any expert file in this field. Only those experts that are available in the client terminal can be selected here. To be selected, they must be compiled and located in the /EXPERTS folder.
After an expert has been selected, one has to perform additional setting of testing parameters and inputs. This can be done by pressing of the “Expert properties” button. A new window with three tabs will appear then:
TestingGeneral testing parameters are set in this tab. These are volume and currency of the initial deposit to be givenin the corresponding fields. It is this deposit that will be op-erated by the expert during testing. Types of positions to be opened at testing are defined here, as well: Only Long - open only long positions; Only Short - open only short ones; Long and Short - open both long and short positions. Whatever expert algorithm is, it will open positions only in the defined directions. One can include an optimization genetic algorithm and select a parameter to be optimized (maximization by the balance value, the profit factor, expected payoff, or minimiza-tion by the maximal drawdown value or drawdown percent.
InputsThe list of all inputs is given here as a table. Inputs are variables that influence the expert operation and can be changed directly from the client terminal. There is no need to change the expert code in order to change these parameters. The amount of input variables can change depending on the expert. At testing, the expert inputs are defined in the “Value” field. Data written in the fields of “Start”, “Step”, and “Stop” do not influence expert testing and are necessary just for optimization of its parameters. How to work with these parameters is described in the “Optimization Setup” section.
OptimizationSettings in this tab allow to limit testing passes at optimization. Changing of parameters in this tab does not influence single testing passes of the expert.
Symbol and its PeriodTo start testing, it is not enough just to select an expert and set it up. One has to select a symbol and a period (time-frame) for testing. These are data that will be used for testing. At testing, one can select an available in terminal symbol or use an external data file. History data files of *.FXT format stored in the /TESTER directory are used in testing. These file are created automatically at testing if an available in the terminal symbol was selected.
The symbol is defined in the field of the same name, and timeframe is in the “Period” field. If no data file for this sym-bol, period and modeling method does not exist yet, it will be created automatically. If there are no history data for the symbol or period, the tester will download the last 512 history bars automatically.
MT4 USER GUIDE

73
Attention:If there are some data outside the latest 512 bars for the symbol, the history data will be downloaded automatically, up to the last available one. This can cause sharp increase of the incoming traffic.
Methods of ModelingHistorical data are saved in the terminal only as bars and represent records appearing as TOHLCV (HST format). These data can be used for modeling of price changes at testing of experts. In some cases, such information is not enough for testing. For example, for the daily timeframe, price changes within a bar can result in triggering of the ex-pert. At the same time, no triggering can occur at testing. In other words, testing of an expert based on only bars can be inaccurate and give a false idea about the expert efficiency.
The trading terminal allows to test experts by various meth-ods of historical data modeling. Using historical data from smaller periods, it is possible to see price fluctuations within bars, i.e., price changes will be emulated more precisely. For example, when an expert is tested on one-hour data, price changes for a bar can be modeled on one-minute data. Thus, modeling brings historical data near the real price fluctuations and makes expert testing more authentic.
One of three methods of historical data modeling can be chosen for testing:
Open prices only(fastest method to analyze the bar just completed) Some automated trading systems do not depend on prop-erties of modeling within a bar, they trade on completed bars. The bar is completed if the next one has appeared. These are such experts for that this modeling method was developed. In this mode, the bar opening is modeled first (Open = High = Low = Close, Volume=1) what allows the expert to identify the completion of the preceding bar pre-cisely. It is this incipient bar that is used to start testing of the expert. At the next step, the fully com pleted current bar will be given, but no testing is performed on it!
Control points(the nearest less timeframe is used)The control points modeling method is intended for a crude estimate of experts efficiency that trade within the bar. The historical data of the nearest less timeframe must be available to apply this method. In some cases, the availa-ble data of the less timeframe do not completely cover the
time range of the timeframe under test. If the data of the less timeframe are missing, the bar evolution is generated on the basis of predefined wave templates as it was in the preced-ing, third version of MetaTrader 3 Client Terminal.
As soon as historical data of the less timeframe appear, these new data will be interpolated. However, the really exist-ing OHLC prices appear as control points. In the most cases, the results of testing experts by method of control points can also be considered as estimated ones, not as final ones. Such results are of intermediate, estimated nature.
Every tick(based on all available least timeframes)This is the most accurate method of modeling prices within a bar. Unlike that of “control points”, this method uses for generation not only data of the nearest less timeframe, but also those of all available nearest timeframes. At that, if there are data of more than one period for the same timeframe at the same time, the data of the least timeframe will be used for modeling. Like in the preceding method, control points are generated on the basis of OHLC data of the least available timeframe. To generate price movements between control points, interpolation based on predefined templates is also used, so one-minute data are highly desirable to be available that would cover the entire testing range. It is possible that several similar ticks are modeled one after another. In this case, the doubled quotes will be filtered out, and the volume of the last of them will be fixed.
One has to consider the possible large amount of tick data modeled. This can influence the consumed resources of the oper ation system and testing speed.
Attention:• it is not recommended to launch testing on every tick if thereare no available less time frames that completely cover theperiod under test, otherwise, the results will not be accurate;
• modeling on control points is basically used at optimizationof experts, and all ticks modeling is for a close testing.
The modeling quality can be checked in the “Report” window. The “Modeling quality” field and a colored band are intended for this. The band is a scheme of the modeling process. It can be of three colors:
1. Gray - this part of available data did not participate intesting. Gray color can appear if the date range was specified for testing (described below);
MT4 USER GUIDE

74
2. Red - modeling was not performed in this space becauseof missing data of a less timeframe. At that, only data of thetime frame selected for testing were used;
3. Green - modeling was performed in this space. And thebrighter is the color, the higher the modeling quality was.For exam ple, at testing on H1 period, the deep-green bandcan mean that data of M30 period were used for testing,and the brightest one does that M1-period data are used.
After modeling parameters and date range (described below) have been changed, the data file must be created afresh. To do so, one has to flag the “Recalculate”. If the above setting were not changed, there is no need to recal-culate. In this case, it is recommended to disable the above option in order to reduce the testing time.
Time RangeThe range of dates allows to test experts not on all availa-ble data, but within a certain time space only. This can be useful if there is a need to test a certain part of history data. Date range can be used not only for expert testing, but also for modeling of the testing succession of bars (file of data modeled to be used for testing). It is often no need to model data of the entire history, especially for every-tick modeling where the amount of unused data can be very large. That is why, if data range was allowed to be set at the initial mod-eling of testing succession, bars that are beyond this range will not be modeled, but just transcribed into the output suc-cession. The data will not be excluded from the succession in order the correct calculation of indicators on the entire received history to be possible. It must be noted that the first 100 bars will not be modeled either. This limitation does not depend on the date range defined.
To enable date range limitation, one has to flag “Use date” and specify the necessary values in the fields of “From” and “To”. After all settings have been made, one can press the “Start” button and start testing. After testing has started, the approximate time of completing of this process can be viewed in the lower part of the window.
Testing VusializationIf the ”Visualization” is flagged, after the “Start” button has been clicked, the chart will be opened automatically, on which the modeled tick sequence will be played. The play-back speed can be regulated. The playback can be sus-pended by clicking the “||” button. The repeated click on this button resumes the income of the modeled ticks. Pressing
of F12 causes immediate appearance of the next tick even in the suspension mode. Visualization can be skipped up to a certain date. After the desired date is set and the “Skip to” button is clicked, visualizing will stop and then resumed after the tester reaches the defined date.
Attention:If “Optimization” is enabled, expert parameters will be opti-mized, not tested, after the “Start” button has been pressed.
e) Testing Results
After the testing has been completed, one can see the results thereof in the tabs of “Results”, “Graph”, “Report”, and “Journal”.
ResultsInformation about all trade operations performed is given in this tab as a table:# - the trade operation sequence number;
Time - time at which the operation was performed;
Type - type of the operation (sell, buy, s/l, t/p, modify, close at stop, etc.);
Order - ticket number of trade position or pending order (not to be mixed up with the trade operation sequence number described above);
Lots - amount of lots traded;
Price - symbol price during operation;
S/L - the Stop Loss order value. No entries in this field mean that the order was notplaced;
T/P - the Take Profit order value. No entries in this field mean that the order was not placed;
Profit - profit/loss. The profit/loss value is entered only at closing of positions;
Balance - balance value. The balance value is recorded only at closing of positions.
Having clicked with the left mouse button on any column header, onl can sort out all entries in the table in increasing or decreasing order. Using the “Copy” context menu com-mand or accelerating keys of Ctrl+C, one can copy the se-lected lines of results to the clipboard for further use in other applications. If no line has been selected, the entire table will be copied to the clipboard. As well, to copy the entire table to the clipboard, one can execute the “Copy All” command. The report of results can be saved in the hard disk as an HTML file. To do so, one has to execute the “Save as Report” con-
MT4 USER GUIDE

75
text menu command. The commands of “Set Date “From”” and “Set Date “To”” allow to set the time span for testing. At that, the selected operations dates will be written in the fields of “Use date from:” and “Use date to:” in the testing settings. This can be useful if there is a need to test an expert closely or to optimize its parameters within this range of dates.
GraphThe graph representing the account balance (the blue line is “Balance”) and general account status considering open positions (the green line is “Lots”) is drawn in the “Graph” tab automatically. If only balance line is displayed in the graph, it means that the lines of “Balance” and “Lots” coincide during the entire testing period. Graph allows changes in trading results during testing even more visualized. If lot sizes were changed during testing, the chart of lot size changes will be shown in the bottom of the graph.
A double click with the left mouse button on any point in the graph will switch to the “Results” button, the corresponding line being selected. Using the “Copy” context menu com-mand or accelerating keys of Ctrl+C, one can copy the graph to the clipboard to be used in other applications. A graph can also be saved in the hard disk as a GIF file. To do so, one has to execute the “Save as Picture” context menu command or press the accelerating keys of Ctrl+S. The commands of “Set Date “From”” and “Set Date “To”” allow to set the time span for testing. At that, the selected operations dates will be written in the fields of “Use date from:” and “Use date to:” in the testing settings. This can be useful if there is a need to test an expert closely or to optimize its parameters within this range of dates.
ReportGeneralized results of the expert testing and some key data are represented in the “Report” tab. Such reports allow to quickly compare various experts to each other. The following data are published in reports:
• Bars in test - the amount of history data modeled in bars;
• Ticks modeled - the amount of ticks modeled;
• Modeling quality - the quality of ticks modeled duringtesting, in per cents. Modeling is shown elementarily as aband in the next line of the report. The band can be of one ofthree colors:
1. Gray - this part of available data was not involved intotesting. Gray color can appear if there was a date rangespeci fied in the testing settings;
2. Red — modeling was not performed in this space be-cause of missing available data of a less timeframe. At that,only data of the timeframe selected in the testing settingswere used;
3. Green — modeling was performed in this space. And thebrighter is the color, the higher modeling quality was. Forexample, at testing on the H1 period, the deep-green bandmeans that data of M30 period were used for testing, andthe brightest one does that M1 data were used;
Attention:If the fastest method (“Open prices only”) was selected in the testing settings, the entire band will be red. At that, “n/a” (no modeling was performed) will be written in the “Modeling qual-ity” field;
• Initial deposit - the amount of initial deposit;
• Total net profit - financial result of all trades. This parameterrepresents the difference between “Gross profit” and “Gross loss”;
• Gross profit - the sum of all profitable trades in monetary units;
• Gross loss - the sum of all unprofitable trades in monetary units;
• Profit factor - the ratio between the gross profit and the gross loss in per cents. One means that these sums are equal;
• Expected payoff - mathematical expectation of win. This pa-rameter to be calculated statistically represents average profit/loss factor of one trade. It can also be considered as showingthe expected profitability/unprofitability of the next trade;
• Absolute drawdown - the largest loss is below initial depositvalue;
• Maximal drawdown - the largest loss of the local maximumin the deposit currency and in per cents of the deposit;
• Total trades - total amount of trade positions;
• Short positions (won %) - amount of short positions and theprofit percentage thereof;
• Long positions (won %) - amount of long positions and theprofit percentage thereof;
• Profit trades (% of total) - the amount of profitable trade positions and their part in the total trades, in per cents;
• Loss trades (% of total) - the amount of unprofitable trade positions and their part in the total trades, in per cents;
• Largest profit trade - the largest profit among all profitable positions;
MT4 USER GUIDE
76
• Largest loss trade - the largest loss among all unprofitable positions;
• Average profit trade - average profit value within a trade (sum of profits divided into the amount of profitable trades);
• Average loss trade - average loss value within a trade(sum of losses divided into the amount of unprofitable trades);
• Maximum consecutive wins (profit in money) - the long-est series of profitable trade positions and sum of their wins;
• Maximum consecutive losses (loss in money) - thelongest series of unprofitable trade positions and sum of their losses;
• Maximum consecutive profit (count of wins) - themaximal profit within one series of profitable trades and the corresponding amount of profitable trades;
• Maximum consecutive loss (count of losses) - themaximal loss within one series of unprofitable trades and the corresponding amount of unprofitable trades;
• Average consecutive wins - average amount of profitable positions in consecutive profitable series;
• Average consecutive loss - average amount of unprofita-ble positions in consecutive unprofitable series.
The report can be copied to the clipboard or saved in the hard disk as an HTML file. To do so, one has to execute the context menu commands of “Copy” and “Copy as Report”, respectively. The report can also be copied to the clipboard by pressing of accelerating keys of Ctrl+C.
“Journal“ TabInformation about testing process with all trade operations is automatically published in the “Journal” tab. This journal is the same as that of the “Terminal — Experts” window, except for that messages published in the tester window inform about testing of the expert, but not about its operation at the market. After testing has been completed, these data will be output in a separate directory named /TESTER/LOGS. The testing journal files are stored in the /EXPERTS/LOGS directory, file names corresponding with the data of journal - YYYYMMDD.LOG. To view the journals stored, one has toexecute the “Open” context menu command and select thedesired file. To copy the message to the clipboard, one hasto execute the corresponding command of the context menu.The “Clear All Journals” command allows you to remove alljournals from the directory and clears the tab. This can beuseful to clear the hard disk of too many files.
f) History Files in FXT Format
After the testing has been completed, one can see the results thereof in the tabs of “Results”, “Graph”, “Report”, and “Jour-nal”.
A short description of the format is given below. It begins with the header:
MT4 USER GUIDE

77
//+------------------------------------------------------------------+//| |//+------------------------------------------------------------------+struct TestHistoryHeader{int version; // 404char copyright[64]; // copyrightchar symbol[12];int period;int model; // for what modeling type was the ticks sequence generatedint bars; // amount of bars in historytime_t fromdate; // ticks generated from this datetime_t todate; // ticks generated stopped at this datedouble modelquality; // modeling quality//---- general parameterschar currency[12]; // currency baseint spread;int digits;double point;int lot_min; // minimum lot sizeint lot_max; // maximum lot sizeint lot_step;int stops_level; // stops level valueint gtc_pendings; // instructions to close pending orders at the end of day //------- profit calculation parametersdouble contract_size; //contract sizedouble tick_value; // value of one tickdouble tick_size; // size of one tickint profit_mode; // profit calculation mode { PROFIT_CALC_FOREX, PROFIT_CALC_CFD, PROFIT_CALC_FU-TURES }//---- swap calculationint swap_enable; // enable swapint swap_type; // type of swap { SWAP_BY_POINTS, SWAP_BY_DOLLARS, SWAP_BY_INTEREST }double swap_long;double swap_short; // swap overnight valueint swap_rollover3days; // three-days swap rollover//---- margin calculationint leverage; // leverageint free_margin_mode; // free margin calculation mode { MARGIN_DONT_USE, MARGIN_USE_ALL, MARGIN_USE_PROFIT, MARGIN_USE_LOSS }int margin_mode; // margin calculation mode { MARGIN_CALC_FOREX,MARGIN_CALC_CFD,MARGIN_CALC_FUTURES, MARGIN_CALC_CFDINDEX };int margin_stopout; // margin stopout levelint margin_stopout_mode; // stop out check mode { MARGIN_TYPE_PERCENT, MARGIN_TYPE_CURRENCY }double margin_initial; // margin requirements double margin_maintenance; // margin maintenance requirementsdouble margin_hedged; // margin requirements for hedged positionsdouble margin_divider; // margin dividerchar margin_currency[12]; // margin currency//---- commission calculation double comm_base; // basic commission
MT4 USER GUIDE
78
int comm_type; // basic commission type { COMM_TYPE_MONEY, COMM_TYPE_PIPS, COMM_TYPE_PERCENT }int comm_lots; // commission per lot or per deal { COMMISSION_PER_LOT, COMMISSION_PER_DEAL }//---- for internal useint from_bar; // fromdate bar numberint to_bar; // todate bar numberint start_period[6]; // number of bar at which the smaller period modeling started int set_from // begin datefrom tester settingsint set_to; // end date from tester settings//----int freeze_level; // end date from tester settings//----int reserved[61];};
Then, the array of modeled bars follows:
#pragma pack(push,1)struct TestHistory{time_t otm; // bar timedouble open; // OHLCV valuesdouble low;double high;double close;double volume;time_t ctm; // the current time within a barint flag; // flag to launch an expert (0 - bar will be modified, but the expert will not be launched) };
#pragma pack(pop)
MT4 USER GUIDE

79
g) Optimization of Experts
Optimization represents successive passes of the same expert advisor with different inputs on the same data. At that, such parameters can be sorted out at which the expert efficiency will be maximal. Terminal possesses some built-in means that allow to automate this process. To optimize an expert, one has to flag the option of the same name in the “Tester” window and press the “Start” button.
Optimization SetupOptimization represents consecutive passes of the same expert with different inputs on the same data. At that, such parameters can be taken that make the expert efficiency maximal. The terminal possesses in-built means that allow to automate this process. Before beginning to optimize expert parameters, one has to set them up. It means that one has to:
• select an expert and its inputs• select a symbol and its timeframe• select one of three bar modeling methods• set up the time span for optimization (optional)
A special window named “Tester” is used for testing and op-timization of experts in the terminal. All settings listed above can be made in the “Settings” tab of this window.
Expert Advisor and its ParametersOne has to select expert the parameters of which should be optimized in the “Tester - Experts” window. Not any expert file can be selected in this field, but only those that are avail-able in the client terminal. For this, they must be compiled and placed in the /EXPERTS folder.
After the expert has been selected, one has to make an additional setup and set the inputs. This can be done by pressing of the “Expert properties” button. At that, a new window containing the following three tabs will appear:
TestingGeneral optimization parameters are set in this tab. They in-clude the initial deposit volume and currency to be specified in the corresponding fields. It is this deposit that will be oper-ated by the expert during optimization. Types of positions to be opened are selected in this tab, as well: Only Long, Only Short, or Long and Short. Whatever expert algorithm is used, it will open positions only in the directions defined here; One can include an optimization genetic algorithm and select a parameter to be optimized (maximization by the balance
value, the profit factor, expected payoff, or minimization by the maximal drawdown value or drawdown percent.
InputsAll inputs are listed here as a table. Inputs are variables that in-fluence the expert operation and can be changed directly from the client terminal. For these parameters to be changed, there is no need to change the expert code. The amount of inputs can vary depending of experts. At optimization, the expert in-puts are set in the fields of “Start”, “Step”, and “Stop”. Initial val-ues, change interval, and final values of external variables will be set in these fields, respectively. There are checkboxes to the left of variable names that include the parameter into optimiza-tion process. If a variable is not checked in this checkbox, it will not be involved into optimization. Its value will not be changed within the optimization process, and the parameter given in the “Value” field will be written here. The amount of expert pass-es depends on these parameters directly. Data written in the “Value” field do not influence the expert optimization and are necessary only for its testing.The set of inputs already saved before (including those given in the fields of “Start”, “Step”, and “Stop”) can be downloaded. This can be done by pressing of the “Load” button and having selected the preliminarily saved set of parameters. The current set of external variables can be saved by pressing of the corresponding button.
OptimizationThis tab allows to manage limitations during optimization. If any of conditions is met during a separate pass, this pass of the expert will be interrupted. Limiting parameters are:
1. Balance minimum - the smallest balance value in thedeposit currency;
2. Profit maximum - the largest profit in the deposit curren-cy;
3. Minimal margin level % - the lowest margin level in percents;
4. Maximal drawdown % - the largest drowdown in percents;
5. Consecutive loss - the largest loss within a series. Lossseries is a number of consecutive loss trades;
6. Consecutive loss trades - the largest amount of losstrades within a series;
7. Consecutive win - the largest total profit within a series. Profitable series is a number of consecutive profitable trades;
8. Consecutive win trades - the largest amount of profita-
MT4 USER GUIDE

80
ble trades within a series.
To enable a limit in condition, one has to flag it in the checkbox to the left of it. Double click with the left mouse button in the “Value” field can be used to change the existing parameter.
Symbol and its PeriodIt is not enough just to select an expert and set it up to start optimization: a symbol and its period (timeframe) must be selected for tests. These are the data on which all tests will be made. A symbol available in the terminal or an external data file can be used for tests. History data files in *.FXT format to be stored in the /TESTER directory are used in tests. These files are created at tests automatically if the corresponding symbol available in the terminal was selected.
Symbol is defined in the “Symbol” field, and timeframe is in the “Period”. If there is no data file for this symbol, period, and modeling method, it will be created automatically. If there are no history data for the symbol and period, the tester will down-load 512 latest history bars automatically.
Attention:If there are any data outside the latest 512 bars for a symbol, the data will be downloaded automatically up to the last availa-ble bar. This can cause sharp increase of incoming traffic.
Modelling methodsHistory data are saved in the terminal only as bars and rep-resent records appearing as TOHLCV (HST format). These data can be used for modeling of price changes at testing of experts. In some cases, such information is not enough for testing. For example, for the daily timeframe, price changes within a bar can result in triggering of the expert. At the same time, no triggering can occur at testing. In other words, testing of an expert based on only bars can be inaccurate and give a false idea about the expert efficiency.
Terminal allows to test experts by various methods of history data modeling. Using history data from smaller periods, it is possible to see price fluctuations within bars, i.e., price chang-es will be emulated more precisely. For example, when an expert is tested on one hour data, price changes for a bar can be modeled on one-minute data. Thus, modeling brings history data near the real price fluctuations and makes expert testing more authentic.One of three history data modeling methods can be chosen for testing:
Open prices only(fastest method to analyze the bar just completed)Some mechanical trading systems do not depend on proper-ties of modeling within a bar, they trade on completed bars. The bar is completed if the next one has appeared. These are such experts for which this modeling method was developed.In this mode, the bar opening is modeled first (Open = High = Low = Close, Volume=1) what allows the expert to identify the completion of the preceding bar precisely. It is this incipient bar that is used to start testing of the expert. At the next step, the fully completed current bar will be given, but no testing is performed on it!
Control points(based on the nearest less timeframe with fractal interpolation of 12 control points)The control points modeling method is intended for a crude estimate of experts efficiency that trade within the bar. The his tory data of the nearest less timeframe must be available to apply this method. In the most cases, the available data of the less timeframe do not completely cover the time range of the timeframe under test. If the data of the less timeframe are missing, the further bar development will be generated on close prices of 12 preceding bars. It means that the changes within the bar are the same as those of price within the last 12 periods. It is fractal interpolation.
As soon as history data of the less timeframe appear, fractal interpolation will be applied to these new data. But there will be used not 12, but just 6 preceding bars. It means that really existing Open, High, Low, Close prices are reproduced, and two generated prices more. Values and locations of these two generated prices depend on that on 6 preceding bars.
Every tick(based on all available least timeframes with fractal interpolation of every tick)This is the most accurate method of modeling prices within a bar. Unlike that of “control points”, this method uses for generation not only data of the nearest less timeframe, but also those of all available nearest timeframes. At that, if there are data of more than one period for the same timeframe at the same time, the data of the least timeframe will be used for modeling. Like in the preceding method, control points are generated by fractal interpolation. It is also used for modelingof price changes between control points. It is possible that several similar ticks are modeled one after another. In this case, the doubled quotes will be filtered out, and the volume of the last of them will be fixed.One has to consider the possible large amount of tick data modeled. This can influence the con-
MT4 USER GUIDE
81
sumed resources of the operation system and testing speed.
Attention:• it is not recommended to launch testing on every tick if thereare no available less time frames that completely cover theperiod under test, otherwise, the results will not be accurate;• modeling on control points is basically used at optimization ofexperts, and all ticks modeling is for a close testing.
Time RangeThe range of dates allows to test experts not on all available data, but within a certain time space only. This can be useful if there is a need to test a certain part of history data. Date range can be used not only for expert testing, but also for modeling of the testing succession of bars (file of data modeled to be used for testing). It is often no need to model data of the entire history, especially for every-tick modeling where the amount of unused data can be very large. That is why, if data range was allowed to be set at the initial modeling of testing succession, bars that are beyond this range will not be modeled, but just transcribed into the output succession. The data will not be ex-cluded from the succession in order the correct calculation of indicators on the entire received history to be possible. It must be noted that the first 100 bars will not be modeled either. This limitation does not depend on the date range defined.
To enable date range limitation, one has to flag “Use date” and specify the necessary values in the fields of “From” and “To”. After all settings have been made, one can press the “Start” button and start testing. After testing has started, the approx-imate time of completing of this process can be viewed in the lower part of the window.
Attention:• if “Optimization“ is disabled, the expert will be tested notoptimized at pressing of the “Start“ button;• at optimization, like at testing, one can use one’s history files.
h) Optimization Results
After optimization has been completed, its results can be viewed in the tabs of “Optimization Results” and “Optimiza-tion Graph”.
Optimization ResultsUnlike testing, optimization is supposed to perform many passes of the mechanical trading system (MTS) with different inputs. This is aimed at determining of such expert parameters at which its efficiency will be the highest. To optimize an ex-
pert, one has to flag “Optimization” in the testing settings tab and press “Start”. After that, two new tabs will appear in the window: “Optimization Results” and “Optimization Graph”.
There are not all operations listed in the tab of “Optimization Results”, unlike that of testing results, but only final reports about each pass. The entire information is represented as a table with the following fields:
• Pass - the pass number;
• Profit - the pure profit (gross profit minus gross loss);
• Total trades - the total amount of open trade positions;
• Profit factor - ratio between gross profit and gross loss in per cents. One means that these values are equal;
• Expected payoff - mathematical expectation of win. This valueto be calculated statistically represents the average profit/ lossfactor of one trade. It can also be considered to represent theexpected profit/ loss factor of the next trade;
• Drawdown $ - the largest drawdown related to the initial de-posit, in the deposit currency;
• Drawdown % - the largest drawdown related to the initialdeposit, in per cents;
• Inputs - changeable values of inputs at each pass.
Having clicked with the left mouse button on any column header, one can sort out all records in the table in increasing or decreas-ing order. At execution of the “Set Input Parameters” context menu command, the data of the selected pass will be written as the expert basic inputs (expert properties window, “Inputs” tab). At that, it will be switched to the “Settings” tab, and the optimiza-tion will be disabled. Having pressed the “Start” button, one can start to test the expert with the selected inputs. Double click with the left mouse button on the pass line in the Optimization Results tab allows to do the same. Using the “Copy” context menu com-mand or accelerating keys of Ctrl+C, one can copy the selected results lines to the clipboard for further use in other applications. If no line has been selected, the entire table will be copied to the clipboard. To do the same, one can also execute the “Copy All” command. The report about optimization results can be saved on the hard disk as an HTML file. To do so, one has to execute the “Copy As Report” context menu command. Other context menu commands allow to set up representation of results:
• Skip Useless Results - show/ hide the results of unprofitable passes;
• Show Input Parameters - show/ hide the “Inputs” column;
• Auto Arrange - arrange the column sizes automatically whenthe window size has been changed. The same action can be
MT4 USER GUIDE

82
done by pressing of A;
• Grid - show/ hide grid to separate the columns. The sameactions can be done by pressing of G.
F. CUSTOM INDICATORS
Custom indicator is a program independently developed in MetaQuotes Language 4 by the user and functioning as a technical indicator. Technical indicator is a mathematical transformation of security price and/or volume in order to forecast future price changes. The use of indicators allows you to answer the question about whether the current trend will remain the same and where it will turn. Indicators are intended for relative simplifying of the complicated process of trading decision making. Algorithms of indicators are also used for development of trading tactics and expert advisors.
Attention:Custom indicators are intended only for analyzing of sym-bol price changes, but not for trading itself.
Working with custom indicators means:
Creation of an IndicatorTo create and compile custom indicators, one has to use the built-in “MetaEditor”. It is a constituent of the client ter-minal and represents a convenient development environ-ment of MQL4 programs.
Indicator SetupBefore using of custom indicators, one has to set them up first. Working parameters common for all indicators are defined in the window of client terminal settings. Besides, every indicator can have its own settings.
Imposing of an IndicatorParameters of the indicator are calculated and the indicator itself is drawn when imposed into the chart.
Deletion of an IndicatorIf there is no need of an indicator anymore, the indicator can be deleted from the chart.
a) Creation of Custom Indicators
To create custom indicators, one has to use MetaQuotes Language 4 (MQL 4) and MetaEditor. To launch the editor,
one has to execute the “Create” command of the “Navigator — Custom Indicators” window context menu, or the “Tools — MetaQuotes Language Editor” menu command, or press F4 or the button of the “Standard” toolbar. At creation of the MQL4 program, the Experts Wizard that allows you to create new MQL4 programs will open automatically. “Custom Indicator” must be selected in it as the object to be created, and the necessary fields must be filled out:
• Name - indicator name;• Developer - developer’s name;• Link - the developer’s website;• Inputs - the list of indicator inputs. To add a new parameter,one has to press the “Add” button, and for deletion, one has topress the “Delete”.
Then it is necessary to decide whether the new indicator will be created in a separate sub- window and what range it will have. Besides, it is necessary to define the amount and pa-rameters of the indicator arrays. Values of their elements are used to draw lines in the chart. In other words, when indicator arrays are defined, the lines of the future indicator are defined, too. After that, the window of the new indicator with the defined settings will open. A file with the source code (*.MQ4) of the in-dicator will be placed into the /EXPERTS/INDICATORS folder of the client terminal automatically. From this point onwards, one can start to write the text of the custom indicator.
After the indicator has been developed, it must be compiled. To do so, one has to execute the “File — Compile” editor menu command, press F9 or the button of the toolbar. After the indicator has been successfully compiled, an executable program file with *.EX4 extension will be created to be auto-matically placed into the /EXPERTS/INDICATORS folder. The list of custom indicators can be viewed in the “Navigator — Custom Indicators” window of the client terminal.
b) Modifying of Custom Indicators
To start modifying of the existing indicator from terminal, one has to execute the “Modify” command of the “Navigator — Custom Indicator” window context menu. At that, the MetaE-ditor will open where the selected indicator source code has already been downloaded. After this code has been changed, one will have to recompile it and get a new executable EX4 file. Otherwise, the previous, non-modified version of the indi-cator will be used in the terminal.
MT4 USER GUIDE

83
Attention:If the indicator has been compiled with errors, it is impossi-ble to attach it to the chart. At that, the indicator properties window will not appear, and a record about impossibility to open a file with an executable code will appear in the experts journal.
c) Custom Indicators Setup
Indicators must have been set up before they are used. Working parameters common for all custom indicators (and experts) are set up in the client terminal settings. The corresponding window can be opened by the “Tools — Op-tions” menu command or by pressing of accelerating keys of Ctrl+O. To set up working parameters of indicators, one has to select the “Expert Advisors” tab. Only two options influence working of custom indicators:
Allow DLL importsCustom indicators can use DLLs to enlarge their functionali-ties. If this option is enabled, the libraries can be used without any limitations. Disabling of the option results in that no MQL4 program can use any external DLLs.
Allow external experts imports If there is a need to export functions from other experts or MQL4 libraries during the indicators work, this option must be enabled. If it is disabled, no launched indicator will be able to request for functions from other MQL4 programs.
d) How to Attach Custom Indicators to a Chart
After general setup has been completed, one can attach custom indicators to the chart. A custom indicator can be imposed into the active chart by a double click with the left mouse button on it in the “Navigator — Custom Indicators” window or by execution of the context menu command “Attach to a chart”. The “Drag’n’Drop” technique allows to impose the analytical tool into any chart. At that, the setup window will appear automatically that has several tabs:
CommonImport from DLLs and MQL4 can be managed in the “Com-mon” tab. Besides, if indicator is drawn in a separate window, one can set up its range from here. To do so, one has to flag the corresponding options and set the desired values in the fields.
InputsExternal variables that can be managed directly from the terminal are grouped in the “Inputs” tab. To modify the desired variable, one has to double-click on its value in the table and write a new one.
ColorsThe “Colors” tab is intended for managing of the indicator elements to be shown in the screen. Besides colors, one can also modify thickness and style of lines.
LevelsHorizontal lines at any level can be set from the “Levels” tab in the indicator window. To create a new level, one has to press the “Add” button, and to delete it, one has to press the “Delete” button. Colors, thickness and style of levels can also be changed from this tab.
Attention:This tab is not available for indicators drawn directly in the price chart.
VisualizationOne can limit the use of an indicator by timeframes in the “Vis-ualization” tab. This can be useful if the same indicator must have different settings for different timeframes. One can, for example, impose two copies of the same indicator with differ-ent settings into the same chart and limit their use by time-frames: the first indicator will work only for smaller timeframes, and the second one will do for larger timeframes. The “Show in the Data Window” option allows to hide/show data about the given indicator in the Data Window.
Immediately after that, recalculation if the indicator values and drawing thereof in the chart will start. Custom indicators, like technical ones, can be drawn in a separate indicator window with its own vertical scale (for example, MACD) or imposed directly into the price chart (for example, Moving Average).
e) Removing of a Custom Indicator from the Chart
To shut down an indicator, one has to remove it from the chart. At that, its drawing and recalculation of its values will stop. To remove an indicator from the chart, one has to execute its con-text menu commands of “Delete Indicator” or “Delete Indicator Window”, or the chart context menu command of “Indicators List - Delete”.
MT4 USER GUIDE

84
Attention: Removing of a custom indicator from the “Navigator” window will not shut down the indicator of the same name imposed in the chart.
G. SCRIPTS
Script is a program written in MetaQuotes Language 4 (MQL 4) and intended for a single performing of any actions. A script can fulfil both analytical and trading functions. Unlikeexperts, scripts are executed on request, not by ticks. Inother words, where an expert works almost continuously, ascript, having completed the function once, stops functioningby itself.
Working with scripts means:
Creation of a ScriptThe built-in “MetaEditor” is used to create and compile a script. It is a constituent of the client terminal and represents a convenient development environment of MQL4 programs.
Script SetupOne has to set up scripts first before using them. Working parameters common for all scripts are defined in the client terminal setup window. Every script has its own settings, as well.
Launching of a ScriptTo launch a script, one has to attach it to the chart. The script algorithm will be launched immediately after that.
Deletion of a ScriptThe script completes its working after it has been deleted from the chart.
a) Creation of a Script
To create a script, one has to use MetaQuotes Language 4 (MQL 4) and MetaEditor. To launch the experts editing program, one has to execute the “Create” command of the “Navigator - Scripts” window context menu, or the “Tools - MetaQuotes Language” menu command, or press F4 orthe button of the “Standard” toolbar. At an MQL4 programcreation, Expert Creation Wizard will open automatically thatallows to create new MQL4 programs promptly. “Script” mustbe selected in it as the object to be created, and all neces-
sary fields must be filled out:
• Name- script name;• Developer- developer’s name;• Link- the developer’s website.
After that, the new script window will open in the editor. File containing the script source code (*.MQ4) will be placed into the / EXPERTS/SCRIPTS folder of the client terminal automatically. Then one can start to write the source code of the program.
After the script has been created, it must be compiled. To do so, one has to execute the “File - Compile” menu command in the experts editor, press F5 or the button in the toolbar. After the script has been successfully compiled, the execut-able file with *.EX4 extension will be created and placed into the /EXPERTS/SCRIPTS folder automatically. The list of all scripts can be viewed in the “Navigator - Scripts” window of the client terminal.
b) Editing of Script
To start editing of the existing script from the terminal, one has to execute the “Modify” command of the “Navigator - Scripts” window context menu. At that, the experts editor with the selected script source code already downloaded will open. After the source code has been modified, one has to recompile it and get a new executable EX4 file. Otherwise, the previous, non-modified version of the MQL4 program will be used in the terminal.
c) Scripts Setup
Before starting to use scripts, one has to set them up. Working parameters common for all scripts are stated in the terminal settings window. This window can be opened by the “Tools - Options” menu command or by pressing of accelerating keys of Ctrl+O. To set up script parameters, one has to open the “Expert Advisors” tab. Only five options influence the operation of scripts:
Allow live tradingLike experts, scripts can work in automated mode. They can both analyze price changes and trade. This option is intended for limiting of trading functions of scripts and expert advisors.
MT4 USER GUIDE
85
Ask manual confirmationThe “Ask manual confirmation” option is only activated if scripts are allowed to trade. If this option is enabled and the script tries to perform a trade operation, one will be able to either confirm it or stop it manually. In other words, manu-al confirma tion allows to control over trading activities of experts and scripts.
Allow DLL importsTo have their functionalities enlarged, scripts can use DLLs. If this option is enabled, the libraries can be used without any limitations. If this option is disabled, no script will be able to use any external DLLs.
Confirm DLL function callsThis option can only be enabled if DLLs are allowed to be im-ported. It assist to control over each called function execution manually. If it is disabled, import from external libraries will not be controlled.
Allow external experts importsIf, at the script operation, there is a need to import functions from other expert or MQL4 libraries, this option must be enabled. If it is disabled, no script will be able to call functions from other MQL4 programs.
d) Launch of Scripts
After general parameters have been set up, the script can be launched. To do so, it is enough just to attach it to the chart. At that, of there is a “#property show_inputs” instruction in the program source code, the script setup window will appear automatically. In the “Common” tab of this window, one can:
• Positions - select direction of position opening:
1. Long&Short - both long and short;
2.Only Long - only to buy;
3. Only Short - only to sell.
• Enable charts - enable/disable script alerts;
• Disable alert once hit - disable alerting after the first alert has been made;
• Allow live trading - enable/disable live trading;
• Ask manual confirmation - request for manual confirma-tion of position opening when performing trade operations;
• Allow DLL imports - enable/disable importing of functionsfrom DLL files;
• Confirm DLL function calls - request for confirmation at
each call of functions from DLL files;
• Allow import of external experts — enable/disablecalling of functions from external experts.
External variables of the script can be changed in the “Inputs” tab. They are variables of extern class. To change a parameter, one has to double-click with the left mouse button on its value and write the new one. At that, one can change the value of each variable or download the set of inputs already saved before (the “Load” button). One can save the current set of inputs with the button of the same name.
The “Reset” button returns all default settings. Parameters defined in the terminal settings are set in the “Common” tab. And parameters set in the source code of the program are defined as inputs. The script with the defined parame-ters can be confirmed by pressing of “OK” and canceled by pressing of button of the same name.
Attention:Unlike those of experts or custom indicators, special properties of the script are set only at its launch. Script will be launched immediately after that. Double click with the left mouse button on the selected script in the “Navigator — Scripts” window or execution of the “Execute on Chart” command of the script context menu will attach the script to the active chart. The “Drag’n’Drop” technique will allow to attach the script to any chart. If the “Remove Script” command appears in the chart context menu, it means that script is working. This command is active only while this MQL4 program is working.
Attention:Only one script can be attached to a chart.
e) Script Shutdown
Normally, a script shuts down by itself. But it can be removed manually. At that, it must be deinitialized first and then rolled out from the memory. To remove a script from the chart, one has to execute the chart contest menu “Remove Script” command or attach another script to the chart. Besides, a script will be removed from the chart after symbol or timeframe has been changed.
MT4 USER GUIDE

86
Attention:• all scripts will be removed after terminal has been shutdown;• removing of script from the “Navigator“ window will not shutdown the MQL4 program of the same name imposed in thechart.
H. CONFIGURATION AT STARTUP
The client terminal can be launched with some predefined settings. For this purpose, the configuration file name will be passed to the client terminal as a parameter.
For example:
terminal.exe config\start.initerminal.exe test1.txtterminal.exe “C:\Program Files\MetaTrader 4\config\set-tings25.ini”
If the full path to the file (Drive:\SubDirectory\FileName) is not given, the file will be searched for in the client terminal directory. The configuration file contains lines of the following appearance:
[Parameter] = [Value]
Comments start with a semicolon (;) and are not processed.
The configuration file parameters can be divided into several groups: common settings, proxy server settings (the “Server” tab in the terminal settings), FTP settings (the “Publisher” tab in the server settings), EA settings (the “Expert Advisors” tab in the server settings), the expert or script single-launch settings, settings of the Strategy Tester launch.
a) Common Settings
ProfileThe subdirectory name in the /profiles directory. The charts will be opened in the client terminal according to the given profile. If this parameter is not specified, the current profile will be opened.
Market WatchFile name (the \symbolsets directory) that contains the symbol list to be shown in the Market Watch window. A file like this can be obtained using the window context menu command of the “Market Watch - Sets - Save As...”.
LoginThe number of the account to connect to at startup. If this pa-rameter is not specified, the current login will be used.
PasswordThe password that allows entering the system. This parameter will be ignored if the client terminal stores personal data on the disk and the account to be connected is in the list.
ServerThe name of the trade server to be connected to. The server name is the same as the name of the corresponding .srv file stored in the /config directory. This patameter will be ignored if the information about the account to be connected was stored on the disk.
AutoConfiguration“True” or “false” depending on whether the autoconfiguration setting should be enabled or not. If this parameter is not speci-fied, the value from the current server settings will be used.
DataServerAddress of the data center. This record can be ignored if the server autoconfiguration s enabled. If this pa rameter is not specified, the value from the current server settings will be used.
EnableDDE“True” or “false” depending on whether DDE server should be enabled or not. If this parameter is not specified, the value from the current server settings will be used.
EnableNews“True” or “false” depending on whether receiving of news should be allowed or not. If this parameter is not specified, the value from the current server settings will be used.
Example:; common settingsProfile=test 3MarketWatch=set2.setLogin=12345 Password=xxxxxxServer=MetaQuotes-demoAutoConfiguration=falseDataServer=192.168.0.1:443EnableDDE=trueEnableNews=false
MT4 USER GUIDE
87
b) Proxy Server Settings
• ProxyEnable - “true” or “false” depending on whether ornot a proxy server should be used for connection to the tradeserver.• ProxyServer - proxy server address.• ProxyType - proxy server type.It can be “HTTP”,“SOCKS4”, or “SOCKS5”.• ProxyLogin - login to be authorized on proxy server.• ProxyPassword - password to access to proxy server.
If any of the above parameters are not specified, the current settings of the client terminal are used (proxy settings in the “Server” tab of the client terminal settings).
Example:; proxy settingsProxyEnable=trueProxyServer=proxy.company.com:3128ProxyType=HTTPProxyLogin=user45ProxyPassword=xxx
c) FTP Settings
• FTPEnable - enable/ disable publishing. The possible val-ues are “true” or “false”.
• FTPPassiveMode - enable/ disable the passive mode ofdata transfer. The possible values are “true” or “false”.
• FTPAccount - the number of the account the state of whichto be sent to the FTP.
• FTPServer - FTP server address.
• FTPLogin - the login for authorization on the FTP server.
• FTPPassword - the password to access to the FTP server.
• FTPPath - the name of the FTP server directory in whichthe report is placed.
• FTPPeriod - the periodicity, in minutes, of the reporting tothe FTP server.
If any of the above-listed parameters are not specified, the current client terminal settings are used (the “Publisher” tab in the server settings).
Example:; ftp settingsFTPEnable=trueFTPPassiveMode=false
FTPAccount=12345 FTPServer=ftp.company.com FTPLogin=admin FTPPassword=pAssWOrd123 FTPPath=/inetpub FTPPeriod=10
d) EA Settings
• ExpertsEnable - enable/ disable experts.
• ExpertsDllImport - enable/ disable DLL imports.
• ExpertsDllConfirm - enable/ disable manual confirmation of DLL- finctions calling.
• ExpertsExpImport - enable/ disable import of functionsfrom external experts or MQL4 libraries.
• ExpertsTrades - enable/ disable the experts trading.
• ExpertsTradesConfirm - enable/ disable manual confirma-tion of the trade operation performed by the expert.
Attention:All parameters of an experts group can take values of either “true” or “false”.
If any of the above-listed parameters is not specified, the current client terminal settings will be used (the “Expert Advi-sors” in the server settings).
Example:; experts settingsExpertsEnable=true ExpertsDllImport=true ExpertsDllConfirm=true ExpertsExpImport=true ExpertsTrades=true ExpertsTradesConfirm=false
e) The Expert and/or Script Single - LaunchSettings
SymbolThe symbol of the security the chart of which should be opened immediately after the terminal startup. After the client terminal has been closed, the information about this extra chart is not saved. At the terminal restart, without the config-uraiton file, this chart will not be opened. If this parameter is not specified, no extra chart will be opened.
MT4 USER GUIDE

88
PeriodThe chart timeframe (M1, M5, M15, M30, H1, H4, D1, W1, MN). If this parameter is not specified, H1 is used.
TemplateThe name of the template file (the \templates directory), which should be applied to the chart.
ExpertThe name of the expert that should be launched after the cli-ent terminal has started. The expert is launched in the chart, which has been opened according to the data specified in Symbol and Period. If the Symbol parameter has not been not specified, no extra chart opens, and the expert will be launched in the first chart of the current profile. If there are no charts in the current profile, the expert will not be launched. If this parameter has not been specified, no expert is launched.
ExpertParametersThe name of the file containing the expert parameters (the \ experts\presets directory). This file can be created in the expert properties window by pressing of the “Inputs - Save” button. It is normally used to save the inputs other than the default ones. If this parameter has not been specified, the default inputs are used.
ScriptThe name of the script, which must be launched after the client terminal startup. The script is launched according to the same rules that are eligible for the expert (described above).
ScriptParametersThe name of the file containing the script parameters (the \ experts\presets directory). This file is made in the same way as that for the expert.
Example:; open chart and run expert and/or scriptSymbol=EURUSDPeriod=H4Template=popular.tplExpert=MACD Sample ExpertParameters=macd.set Script=period_converter ScriptParameters=
f) Settings of the Strategy Tester Launch
TestExpertThe name of the expert to be launched for testing. If this param-
eter has not been specified, no testing is launched.
TestExpertParametersThe name of the file containing parameters (the \tester direc-tory). The file can be created in the Properties window of the expert under test by clicking the “Inputs - Save” button. It is normally used to save parameters other than the default ones. Other parameters of the expert under test in the “Testing” and “Optimization” tabs (as well as in the “Inputs” tab if this parame-ter has not been specified) are filled up with the values auto-matically saved in the \ tester\[the expert name].ini file after the latest test.
TestSymbolThe name of the symbol used for the expert testing. If this parameter has not been specified, the latest value used in the tester is used.
TestPeriodThe chart period (M1, M5, M15, M30, H1, H4, D1, W1, MN). If this parameter has not been specifies, H1 is used.
TestModel0,1 or 2, depending on the testing model (Every tick, Control points, Openprices only). If this parameter has not been speco-foed, 0 i used (Every tick).
TestOptimizationEnable/ disable optimization. The values that can be taken are “true” or “false”. If this parameter had not been specified, the “false” value is used.
TestDateEnableEnable/ disable the “Use date“ flag. The values that can be taken are “true“ or “false“. If this parameter had not been specified, the “false“ value is used.
TestFromDateThe date, from which to start testing, appeared as YYYY.MM.DD. If this parameter has not been specified, this date is 1970.01.01.
TestToDateThe date, on which to finish testing, appeared as YYYY.MM.DD. If this parametr has not been specified, this date is 1970.01.01.
TestReportThe name of the test report file. The file will be created in the client terminal directory. A relative path can be specified,
MT4 USER GUIDE

89
for example: tester\MovingAverageReport”. If the extension has not been specified in the file name, the “.htm” will be set automatically. If this parameter has not been specified, the test report will not be formed.
TestReplaceReportEnable/ disable the repeated report file record. The values that can be taken are “true“ or “false“. If the “false” value is specified and a report file named in the same way exists al-ready, the number in square brackets will be added to the file name. For example, “MovingAverageReport[1].htm”. If this parameter had not been specified, the “false” value is used.
TestShutdownTerminalEnable/ disable shutdown of the terminal after the testing has been finished. The values that can be taken are “true” or “false”. If this parameter had not been specified, the “false” value is used. If the user has pressed the “Stop” button, the value of this parameter will be flushed to “false” since the control has been given to the user.
Example:; start strategy tester TestExpert=Moving AverageTestExpertParameters=ma0.set TestSymbol=EURUSD TestPeriod=H1TestModel=2 TestOptimization=false TestDateEnable=trueTestFromDate=1970.01.01 TestToDate=2006.06.06 TestReport=MovingAverageReport TestReplaceReport=false TestShutdownTerminal=true
I. HISTORY CENTER
Technical analysis is the market movements research made in order to forecast future price movements. the market is often analyzed using charts. So it is very important to have available historical data for all symbols and timeframes used. Historical data are constantly formed and stored on the server. Connecting to it, the client terminal downloads all necessary data. They will be then used for drawing of charts, testing and optimization of Expert Advisors. To control historical data, the terminal has a special window named “History Center”. This window can be opened by executing the command “Tools - History Center” or by pressing F2.
After the terminal has been shut down, all accumulated historical data will be stored in the “History Center”. Sizes of files containing historical quotes do not exceed values defined in settings. If the amount of historical data accu-mulated exceeds the value set in the field of “ Max. bars in history:”, the oldest bars will be deleted when storing. For each timeframe, a separate history file is formed named as SSSSSSPP.hst (where SSSSSS - symbol name, PP - time-frame in minutes) and saved in the /HISTORY. Later on, the saved data will be used to draw charts, as well as for testing of trading strategies.
In the “History Center” window, the available data can be changed. For this, it is necessary to select the desired symbol and timeframe in the left part of the window. The corresponding data will be loaded in form of a table. To add a record about a new bar, it is necessary to press the button of the same name, fill out all necessary fields in the new window and press “OK”. After that, the new bar will appear in the history. One can modify the bar by selecting the corre-sponding record and pressing the “Modify” button. To delete a bar, it is necessary to select it and press the button of the same name.
a) Load of Historical Data
It is possible to load quotes for basic currency pairs starting with year 1999 from the historical data server. To do it, it is necessary to select the desired symbol and press “Down-load”.
Attention: The loaded data can differ from historical data stored on the broker’s trade server.
Upon pressing the button, data of M1 timeframe will be loaded. Other timeframes will be automatically recalculated from M1. At that, the time of the downloaded data will be automatically recalculated according to the active account time zone.When downloading historical data, it is recommended to control amount of bars in history and in charts.
Attention:The deeper is the history used, the more PC resources are needed.
Quotes are weekly updated on the server of historical data. Further, at restarts, only updated quotes will be downloaded.
MT4 USER GUIDE

90
b) Exports and Imports of Historical Data
Historical data can be exported into files formatted as CSV, PRN and HTM. For this, it is necessary to select the desired symbol in the left part of the “History Center” window and press “Export”. Then it is necessary to select on of three file formats and specify the path of location on the hard disk.
Historical data as CSV, PRN, TXT, HTM and HST can also be imported into terminal.
Historical data in the file can be represented as follows (any other separator can be used instead of space):
• YYYY.MM.DD HH:MM O H L C V• YYYY-MM-DD HH:MM O H L C V• YYYY/MM/DD HH:MM O H L C V• DD.MM.YYYY HH:MM O H L C V• DD-MM-YYYY HH:MM O H L C V• DD/MM/YYYY HH:MM O H L C V
First of all, it is necessary to select a symbol and a time-frame, for which the import will be performed, in the left part of the “History Center” window. Then it is necessary to set up import parameters by pressing “Import”:
• Separator - data separator in the file to be imported. Com-ma, semicolon, space or tabulation character can be used asseparators;
• Skip columns - skip columns when importing. This can behelpful when the imported file contains more data types than necessary;
• Skip lines - skip rows (lines) when importing;
• Time shift - shift data by several hours in time;
• Selected only - import only selected data. Data are select-ed by lines using “Ctrl” and“Shift”;
• Volumes - enable/disable importing of volumes.
After historical data have been imported, they can be used to show charts and test Expert Advisors.
c) Historical File Format (HST Files)
The database header is the first
struct HistoryHeader{int version; // database version
char copyright[64]; // copyright infochar symbol[12]; // symbol nameint period; // symbol timeframeint digits; // the amount of digits after decimal point in the symboltime_t timesign; // timesign of the database creationtime_t last_sync; // the last synchronization timeint unused[13]; // to be used in future };then goes the bars array (single-byte justification)#pragma pack(push,1)//---- standard representation of the quote in the database struct RateInfo {time_t ctm; // current time in seconds double open;double low;double high;double close;double vol;};#pragma pack(pop)
J. EXPORT OF QUOTES
Source data serving as a basis for the entire analytical work of the terminal user are those about security price changes. This information is provided by the brokerage company. Price data allow to draw symbol charts, research in financial markets, use various trading tactics, and make trade decisions. Quotes repre-sent files with records in format of “SYMBOL, BID, ASK, DATE” (security symbol, bid price, ask price, date and time) and income in the terminal automatically as soon as connection to the server has been established.
The terminal allows to export the current quotes to other programs in the real-time mode through “DDE” (Dynamic Data Exchange) protocol. This is a protocol of operational systems of MS Windows used for dynamic data exchange among various applications. Quotes are given through DDE only at incoming of new ticks (ADVISE mode), but not immediately on request (REQUEST mode) where the latest price is shown. N/A is shown on the first REQUEST, and after the new price has been income, quotes will appear.
To activate the export of quotes from the terminal through DDE, one has to enable the “Enable DDE server” option in the terminal settings.
MT4 USER GUIDE

91
Attention:For data to be shown properly in MS Excel, one has to enable “Tools — Options... — Translation — Translation formula entry” menu option of MS Excel.
K. GLOBAL VARIABLES
Several experts can be launched in the client terminal at the same time. Sometimes, there is a need them to interchange with information. To provide possibility of prompt transfer of moderate amounts of information among experts, as well as organize conflict-free simultaneous working of several experts, there are global variables in the terminal. Unlike variables claimed at a global level in the expert source code and avail-able only within the corresponding module, global variables exists independently on experts. Their values are saved between terminal launches, unlike those of variables claimed at a global level (they are set at every expert launch and lost at expert remove). Global variables are available within four weeks since their last call from experts or manual modifying.
There is a special window in terminal that manages global var-iables. It can be opened by execution of the “Tools — Global Variables” menu command or by pressing of F3. All global variables, their values and times of their last calls are listed in a table in this window. Using buttons located in the right part of the window, one can add a new global variable or delete an existing one. To change the name or value of a global variable, one has to double-click with the left mouse button on the corresponding cell of the table. The last call time will be changed automatically for this variable.
DDE request formats and their possible results by the example of “DDE-sample.xls” file:
BID request: = ASK request: = HIGH request: = LOW request: = TIME request: = QUOTE request: =
MT4|BID!USDCHFMT4|ASK!USDCHFMT4|HIGH!USDCHFMT4|LOW!USDCHFMT4|TIME!USDCHFMT4|QUOTE!USDCHF
result: 1.5773result: 1.5778result: 1.5801result: 1.5741result: 21.05.02 9:52result: 21.05.02 9:52 1.5773 1.5778 1.5776
L. CONTACT SPECIFICATIONThis message window allows to view securities contract specifications. The main parameters are grouped in table with following fields:
• Spread — difference between Bid and Ask prices inpoints;
• Digits — the amount of digits after decimal point in theprice representation;
• Stops level — minimum distance to the current price inpoints at which Stop Loss and Take Profit orders can beplaced;
• Pending are good till cancel — forced closing ofpending orders at the end of a session. “Yes” means thatpending orders will not be closed forcedly;
• Contract size — one-lot price in deposit currency;
• Tick price — the size of minimal price change in quotecurrency;
• Tick size — minimal symbol price change interval inpoints;
• Profit calculation mode — accepted profit calculation technique (Forex, CFD, Futures);
• Swap type — rollover calculation type (in points, indeposit currency, or in per cents);
• Swap long — rollover size for a long position;
• Swap short — rollover size for a short position;
• Margin calculation mode — accepted free margincalculation technique (Forex, CFD, Futures)
• Margin hedge — size of margin for hedged positions.
The symbol specification window can be called by press-ing of “Properties” button in the Market Watch window or the “Symbol properties” of the “Tester — Settings” window.
Attention: History Data cannot be exported through DDE protocol. The current quotes are exported only when the client terminal is online.
MT4 USER GUIDE

92
M. LANGUAGES SUPPORT
The Client Terminal interface is multilingual. It can be represented in any available language. This feature makes the program not only easy-to-use, but also allows to reduce the amount of errors that occur during trading because of lack of understanding of foreign terms and notions. The list of all available languages can be found in the “View — Languages” menu. One can switch one’s terminal to a language by selecting of this language in the list. The language can be changed actually only after restart of the terminal.
N. DATACENTER.INI
Administrators of dealing centers who would like to redirect the clients’ traffic forcedly have a new opportunity now. The Data Center used by the client terminal can be strictly defined using the configuration file named datacenter.ini. This file must be placed in the /config directory of the client terminal.
If the “Data Center auto configuration” is flagged in the serv-er settings, there will be an attempt to open and analyze the datacenter.ini file. If a data center for the server will be found in this file, the connection will be performed exactly to it. No more than one data center can be defined for one server.
The string format of the datacenter.ini: [server name][delimiter][data center address]
Where:• server name is the name of the corresponding .srv file;• delimiter is a comma or any quantity of spaces;• data center address is the IP address : port number.
Lines that start with a semicolon (;) are considered to be a comment and are not processed.
Exemplary datacenter.ini file:;----------------;comment;----------------MetaQuotes-demo1 192.168.1.4:443 MetaQuotes-demo2, 192.168.1.4:444 ;----------------MetaQuotes-demo3 192.168.1.5:445 MetaQuotes-demo4, 192.168.1.5:446
MT4 USER GUIDE