metallic materials properties development and
TRANSCRIPT
1
Casting Solutions for Readiness
Metallic Materials Properties Development and Standardization (MMPDS)
Cast High-Integrity Alloy Mechanical Property Standards (CHAMPS)
American Foundry Society
1605 N. Penny Lane
Schaumburg, IL 60173
November 17, 2017
DISTRIBUTION STATEMENT A. Approved for public release: distribution unlimited
2
Abstract
The Cast High-Integrity Alloy Mechanical Property Standards (CHAMPS) Statistical Properties Project goal is incorporation of material property design data for additional cast alloys, A206 high strength aluminum for sand casting in the initial phase and then 15-5PH and 17-4PH stainless steels for investment casting in the second phase, into the Metallic Materials Properties Development and Standardization (MMPDS) handbook, which replaced Mil-handbook 5, so that this material can be specified and used to design and manufacture flight critical components in military and civilian aircraft. This builds on the original American Metalcasting Consortium (AMC) E357 effort of establishing a framework to design a series of test specimens that encompass the various section thicknesses used in these applications utilizing process simulation software, validating the approach metallographically, coordinating the collection of required samples from a consortium of qualified foundries, and submitting the data for statistical analysis and approval by the MMPDS board for incorporation into the MMPDS standards. The benefit to the Defense Logistics Agency (DLA) is the development of statistical-based property data to permit the use of castings across a broader range of applications and will allow the Engineering Support Activities (ESA) at the DLA to make cast alloy conversion / replacement decisions with assurance using statistical data on tensile, compressive, shear, and bearing properties from the Federal Aviation Authority (FAA) recognized source, the MMPDS Handbook. This will also reduce lead times with cast components competing on an equal basis with forging and assemblies from sheet, plate, and extruded mill products.
As with the E357 project, the intended outcome is cast A&B design property allowables for the alloys selected for inclusion in the MMPDS to meet FAA requirements. This allows aerospace design engineers to specify castings without using design safety factors. Various working groups actively looked at melt practices, test casting gating and filling, heat treatment parameters, testing protocol and weld repair standards. The initial casting trials followed the approach taken for E357 and conducted for 1.5 x 2.5-in plate cast in both horizontal and vertical gating approaches, and a heat treat study was conducted at various participating foundries. These plates were tested for tensile properties and microstructural evaluation was conducted. For the A206, the plate was 16” x 8” and the section thicknesses were ½ - 2”.
Some of the benefits of listing A206 high strength aerospace alloy are: • Adds additional cast high strength aluminum alloy into available materials that can be
specified and procured.• Using higher strength, light-weight aluminum alloys results in weight reduction• Overcomes part-by-part validation process• Aligns with the goal of the Joint Defense Manufacturing Technology Panel (JDMTP):
“Encourage community to collect and store data to build pedigreed data for MMPDS design allowables.”
--Stephen Luckowski, 17 April, 2014
DISTRIBUTION STATEMENT A. Approved for public release: distribution unlimited

3
It is noteworthy that as a result of the work performed on this project, the solution heat treatment specified for sand cast A206-T4 per AMS 4236B and A206-T71 per AMS 4235B was modified making the step solution treatment required.
Introduction/Background Design engineers need properties that are not based upon typical or average properties but ones that are representative of the type of sample population and variation in manufacturing techniques that would be encountered as a function of different processes and different section thickness (cooling rates) encountered in complex casting designs and also from multiple supply sources. The requirements for components that are considered flight critical are even more demanding as the Federal Aviation Administration (FAA) Federal Acquisition Regulation (FAR) 25.613 requires statistically validated properties for structural materials and FAR 25.621 compels the use of casting factors, which means that a more conservative design approach is used which adds section thickness and weight. Currently, most casting alloys have no statistical validation and cannot be considered for replacement or new design without developing this data on a component by component basis. This expensive process requires an extraordinary business case analysis to justify this added expense and time delay. Yet this is routinely done in the jet engine business and is documented in the Metallic Materials Properties Development and Standardization (MMPDS) Handbook.
The approach taken in this project was to develop statistical basis A & B design allowables for sand cast aluminum A206 T4 and T71 in the first phase and then 15-5PH/17-6PH investment cast stainless steel in the second phase to supplement statistically based allowables. A consortium of casting users, foundries, suppliers, and organizations that support metalcasting assisted in design of the test castings, devising the gating and rigging practice, manufacturing the tooling and test parts, establishing the melt and metal treatment, heat treatment and evaluation practice for the plates produced to develop these properties. Also critical was to demonstrate the utilization of Computer Aided Engineering and Modeling tools to create the tooling design as an approach to design reliability and repeatability into the process and collect valuable information on the repeatability of inspection validation systems.
Cast airframe components provide a unique opportunity for taking full advantage of incorporating modern finite element designs with non-conventional shapes with uniform loading in addition to the opportunity of simplifying a supply chain to remove manufacturing choke points. With more than three million components (excluding rivets and fasteners) typically assembled into a single airplane, each casting consolidation offers the potential for significant savings in tooling, inventory, labor, rework, materials, design, testing and manufacturing. Effective utilization of cast components is estimated to reduce tooling costs alone by 25-35%.
DISTRIBUTION STATEMENT A. Approved for public release: distribution unlimited
4
Statistically based mechanical properties of A206 metalcasting alloy used in the airframe industry and 17-4PH and 15-5PH stainless steels were qualified, tested, and collected following the MMPDS procedures and practices. The metalcasting industry, like the polymer composite industry, must prove multiple suppliers can meet delivery with consistent properties. This requires that foundries use well-defined alloy specifications with tight process control like composites that are also highly manufacturing sensitive and are now accepted in airframe structures. The successful application of castings in airframes requires statistically validated mechanical and physical property data associated with value added structural casting alloys.
In-process welding is an economical means to rectify localized cosmetic or processing damage. Individual studies show that proper heat treatment and inspection after welding does not compromise the structural integrity of cast aluminum. Defining the best practice for in-process welding provides a tool that results in a quality casting that can save cost and time especially during short production runs.
This project was also to consolidate weld knowledge to develop an American Foundry Society (AFS) Recommend Practice for the in-process weld repair of aluminum-silicon hypo-eutectic alloys and develop mechanical properties to demonstrate the efficacy of the practice, and develop statistical data that facilitates acceptance of weld practice. It was determined there is no suitable weld wire available for welding A206. AFS Aluminum and Light Metals Division has obtained funding from AFS to continue this study with a weld wire that has a high probability of success.
The MMPDS handbook provides standardized design values and related design information for metallic materials and structural elements used in aerospace structures. The MMPDS is the only publicly available source in the U.S. for material allowables that the FAA generally accepts for compliance with Code of Federal Regulations (CFR) for material strength properties and design values for aircraft certification and continued airworthiness.
Experimental Procedures
A206-T4 and A206-T71 MMPDS Data Project
The MMPDS handbook calls for mandatory and secondary mechanical property data along with minimum test counts supported by lot and heat requirements. (Table 1) Testing was performed in accordance with the ASTM test standards as required by MMPDS.
DISTRIBUTION STATEMENT A. Approved for public release: distribution unlimited

5
TEST Type ASTM Test Statistical Basis * Min. Test Count # of Heats # of Lots Mandatory Tension E8 and B557 A- and B-Basis 100 10 10 Tensile Elongation
E8 and B557 S-Basis 30 (Part of the 100 above)
3 10
Elastic Modulus Tensile
E111 Typical 9 3 Multiple
Compression E9 S-Basis 20 3 10 Elastic Modulus Compression
E111 Typical 9 3 Multiple
Shear Pin B769 S-Basis 20 3 10 Pin Bearing (1.5) E238 S-Basis 20 3 10 Pin Bearing (2.0) E238 S-Basis 20 3 10 Secondary Fatigue –StrainC E606 Raw Data 16 (10 at R= -1, and 6 other R ratios) Fatigue – LoadC E466 Raw Data 18 (6 tests at 3 R ratios)
Table 1. MMPDS handbook test requirements *The MMPDS definitions of the statistical basis terms (A-Basis, B-Basis, and S-Basis) are includedin Appendix A.
The MMPDS specifically states that no metal alloy can be accepted unless it is covered by a commercial or government specification (MMPDS Paragraphs 9.1.5 and 9.2.2). Tables 2 and 3 list the properties for both sand cast A206 alloys with 4.6Cu-0.35Mn-0.25Mg-0.22Ti solution heat treated and naturally aged per AMS specifications:
AMS 4236B Tensile Property Specifications for A206 Aluminum T4
Designated Area –Minimum Value Non-Designated Area – Minimum Value
Tensile Strength (ksi) 50.0 45.0 2% Offset Yield (ksi) 30.0 26.0 Elongation in 4D gage 10% 8%
Table 2. Mechanical Property Requirements for A206-T4
DISTRIBUTION STATEMENT A. Approved for public release: distribution unlimited

6
AMS 4235B Tensile Property Specifications for A206 Aluminum T71
Designated Area –Minimum Value Non-Designated Area – Minimum Value
Tensile Strength (ksi) 54.0 50.0 2% Offset Yield (ksi) 45.0 40.0 Elongation in 4D gage 3% 1.5%
Table 3. Mechanical Property Requirements for A206-T71
Mechanical Testing Procedures The following mechanical tests as given in Table 4 were planned and coordinated with Westmoreland Mechanical Testing and Research (WMTR) Laboratory, Youngstown, PA.
Test and Mechanical Properties Minimum # of Tests per thickness ASTM Test Method Tensile Standard (UTS, YS, %E, %RA) 100 E8 Tensile Full Range (UTS, YS, %E, %RA) 30 E8 Tensile Modulus 9 E111 Compression Standard (CYS) 20 E9 Compression Modulus 9 E111 Double Shear (USS) 20 B769 Pin Bearing (1.5 E/D) UPB, YPB 20 E238 Pin Bearing (2.0 E/D) UPB, YPB 20 E238 Fatigue – Strain Control 16 E606 Fatigue – Load Control 18 E466
Table 4. Testing Minimums and Specifications
All tests (tensile, compression, shear, fatigue, and pin-bearing) were performed per ASTM mechanical test standards referenced in the MMPDS and were followed by WMTR. The mechanical testing was performed at room temperature. WMTR reported the full range of test data (test specimen ID, test log number, test conditions and all required mechanical data) in paper and spreadsheet format. For the A206, the percent elongation was reported based on three measurements:
1. Fitback elongation by caliper measurements of gauge marks 2. Total elongation at failure by extensometer 3. Plastic elongation at failure by extensometer
DISTRIBUTION STATEMENT A. Approved for public release: distribution unlimited

7
15-5PH/17-4PH Investment Cast Alloys
The testing procedures for the Investment Cast Alloys were similar to those used for the A206 alloy. Molds for the Investment Cast process were made and validated by simulation at PDA LLC. The objective was to develop statistically based mechanical property data (tensile, compression, modulus, shear, pin bearing, Charpy, and fatigue) to qualify investment cast 15-5PH and 17-4PH across a range of castings thickness Tempers (H900, H935, H1000, H1100) for the Metallic Materials Properties and Standardization (MMPDS) handbook.
For the 15-5PH and 17-4PH, the percent elongation was reported based on the following: 1. Total elongation at failure by extensometer 2. Plastic elongation at failure by extensometer
As with the A206 material, stress strain data was also included alongside the measurements.
Results/Discussion A207-T4 and A206-T71 Currently, the MMPDS Handbook does not include A206 related properties. Sand cast A206 is widely used for high strength at elevated temperature applications in aerospace.
The American Foundry Society (AFS) A206 aluminum alloy mechanical property data program has one primary objective: to develop statistically based mechanical property data (tensile, compression, modulus, shear, pin bearing, and fatigue) to qualify sand cast A206-T4 per AMS 4236B and A206-T71 per AMS 4235B aluminum across a range of castings thickness (0.5”, 1”, and 2”) for the Metallic Materials Properties and Standardization (MMPDS) handbook.
The publication of qualified property data in the MMPDS handbook will enable and promote the use of sand-cast A206 aluminum for aerospace components.
During the initial part of the A206 MMPDS project, extensive casting design studies were done to develop tooling, rigging, and casting parameters for three different thicknesses of the A206 aluminum castings. These studies evaluated the full range of casting parameter
1. Design of the mold [orientation, rigging (gating and risers) and chills] for non-turbulent fill, rapid solidification rates, optimization of microstructure, and minimization of
DISTRIBUTION STATEMENT A. Approved for public release: distribution unlimited
8
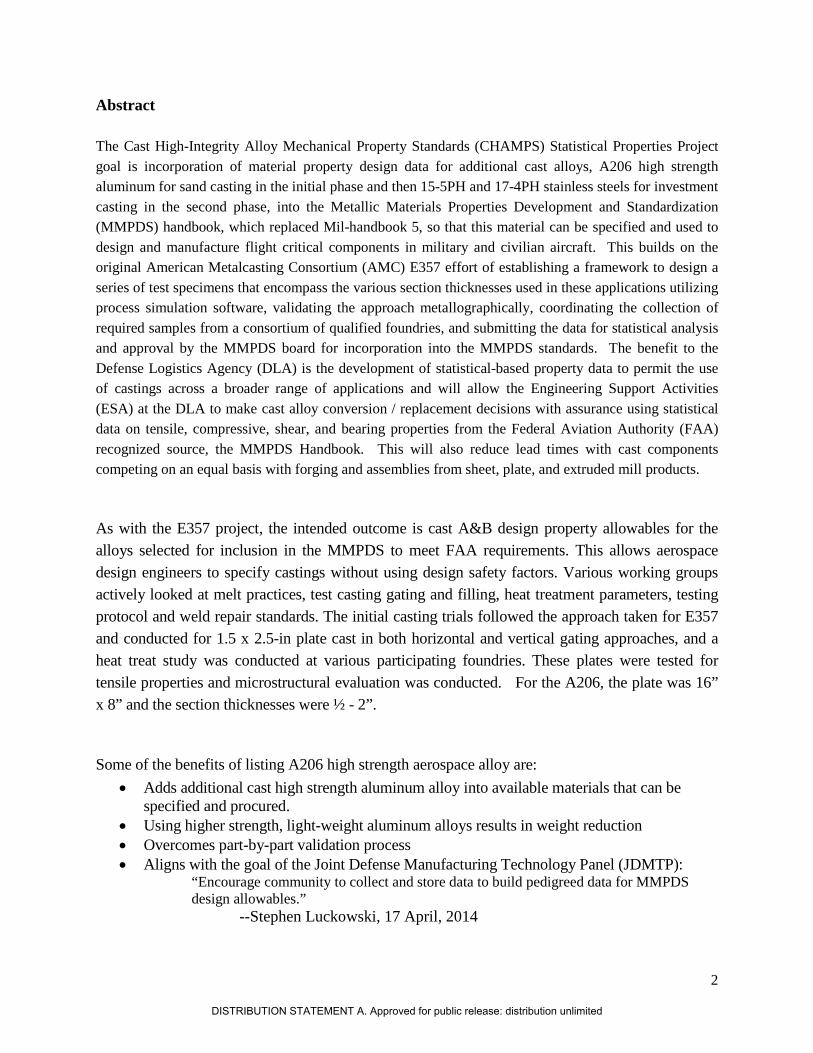
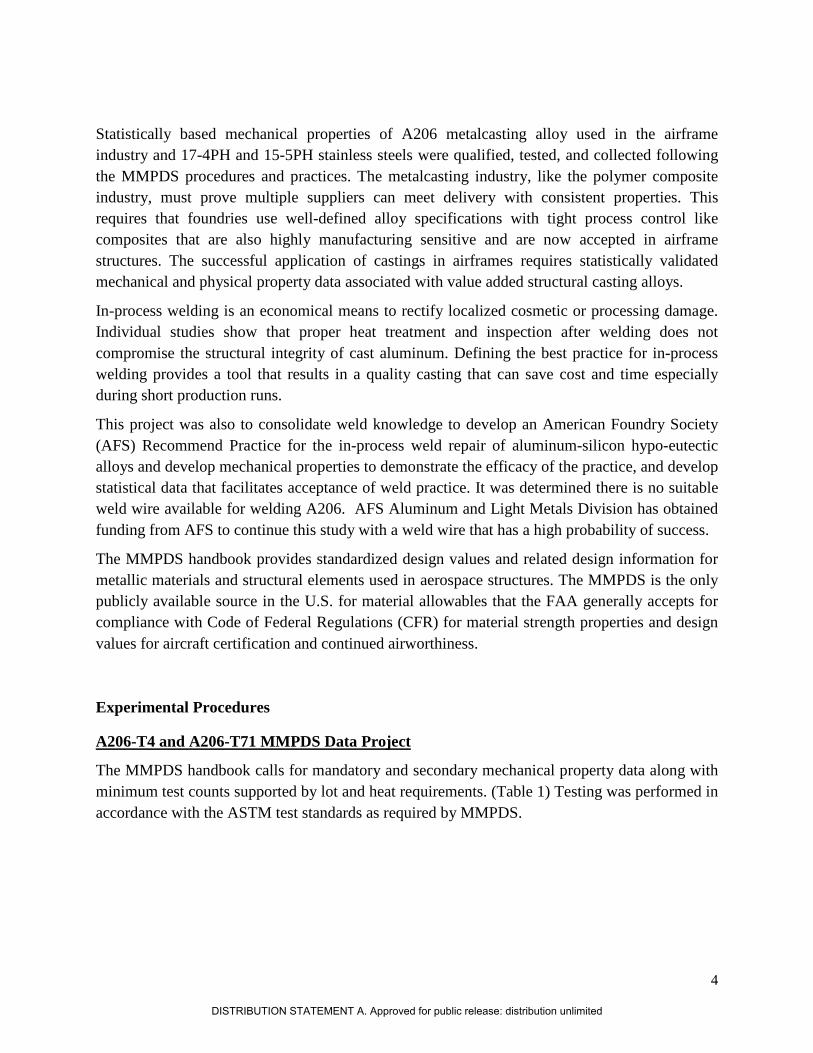
porosity and shrinkage. See Figures 1 and 2 below, showing casting process simulation results performed by PDA LLC during the rigging refinement for these test castings; temperate profile after 100% mold filled in Plate#1 and predicted shrinkage in Plate #2 respectively.
Figure 1 Temperature profile after filling completion in Plate #1 A206 sand test casting
Figure 2. Predicted primary shrinkage in Plate #2 A206 test casting
2. Best industry practice was used for melting and pouring by the participating foundries including degassing and grain refinement to achieve proper microstructure and properties.
DISTRIBUTION STATEMENT A. Approved for public release: distribution unlimited
9
3. Optimization of the heat treatment parameters to meet the mechanical properties specifications A206-T71 to include step solution and aging at 390F, which resulted in making modification to the AMS 4535 specification. Finalized heat treatment followed is enclosed in Appendix B.
4. Spatial variation in mechanical properties and microstructure within a single casting.
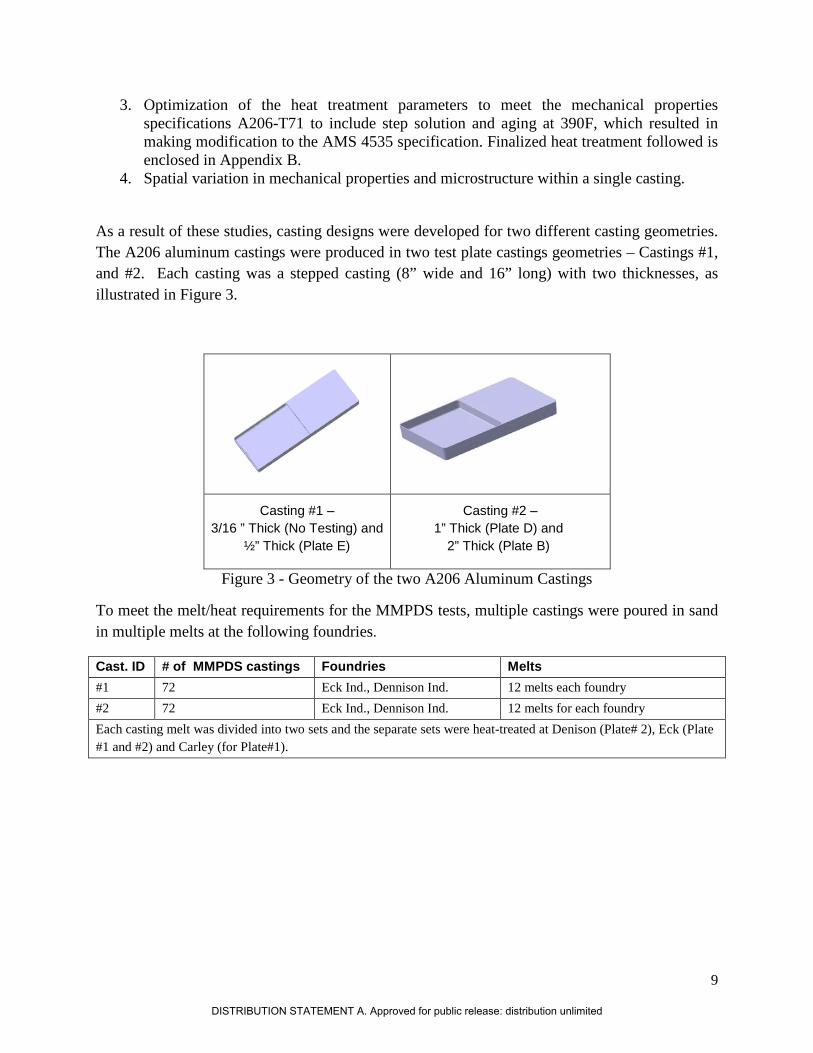
As a result of these studies, casting designs were developed for two different casting geometries. The A206 aluminum castings were produced in two test plate castings geometries – Castings #1, and #2. Each casting was a stepped casting (8” wide and 16” long) with two thicknesses, as illustrated in Figure 3.
Casting #1 – 3/16 ” Thick (No Testing) and
½” Thick (Plate E)
Casting #2 – 1” Thick (Plate D) and
2” Thick (Plate B)
Figure 3 - Geometry of the two A206 Aluminum Castings
To meet the melt/heat requirements for the MMPDS tests, multiple castings were poured in sand in multiple melts at the following foundries.
Cast. ID # of MMPDS castings Foundries Melts #1 72 Eck Ind., Dennison Ind. 12 melts each foundry #2 72 Eck Ind., Dennison Ind. 12 melts for each foundry Each casting melt was divided into two sets and the separate sets were heat-treated at Denison (Plate# 2), Eck (Plate #1 and #2) and Carley (for Plate#1).
DISTRIBUTION STATEMENT A. Approved for public release: distribution unlimited

10
The casting tool geometry (with chills), mold design, rigging, melt chemistry and procedures, casting methodology, x-ray results and heat-treat parameters for the two different geometries are well documented. Internal soundness requirement was established prior to the test castings were poured to be Grade B per AMS 2175 and were validated by x-ray, to ensure a shrinkage free casting in the test specimen area. No visual slag or pin holes were accepted. Any test plates not meeting basic AMS specification requirements for mechanical properties, in particularly, elongation, were removed from the statistical analysis.
Each casting section was stamped to identify key tracking identification elements – foundry, melt number, casting number, plate geometry, and heat treat number.
Tensile Strength Data The tensile tests were performed at room temperature per ASTM E8 and B557. Both the 1” and 2” thick plate sections used a standard 0.500”Ø tensile round for this testing. The 0.5” thick plate sections used a standard 0.250” Ø tensile round for testing. The tensile tests results (mean UTS and YS strengths, standard deviation, coefficient of variation, test count, and high and low values) for all three thicknesses of plates are given in Tables 5 and 6. The mean values for the ultimate stress (UTS) and the 0.2% offset yield stress (YS) are plotted in Figures 4 and 5 for all three different casting thicknesses along with and addition set of the combined totals.
DISTRIBUTION STATEMENT A. Approved for public release: distribution unlimited

11
Aluminum A206-T4 Tensile
All Castings (0.5", 1", & 2") UTS 0.2%
YS Total Elong at
Failure RA Modulus Tensile ksi ksi % % MSI Mean 62.18 39.06 19.62 29.53 10.65 SDev 2.26 1.46 5.92 8.12 0.62 CoV 3.63% 3.74% 30.15% 27.51% 5.82%
Count 321 321 321 321 321 High 67.70 43.30 34.92 55 14.8 Low 56.10 36.70 10.36 11 9.3
0.5"Castings UTS 0.2%
YS Total Elong at
Failure RA Modulus Tensile ksi ksi % % MSI Mean 63.79 40.39 24.56 33.53 10.46 SDev 2.53 1.60 6.07 9.45 0.38 CoV 3.97% 3.96% 24.73% 28.17% 3.64%
Count 111 111 111 111 111 High 67.70 43.30 34.92 55 12.3 Low 57.80 37.10 10.56 11 9.6
1"Castings UTS 0.2%
YS Total Elong at
Failure RA Modulus Tensile ksi ksi % % MSI Mean 60.82 38.18 16.23 26.28 10.73 SDev 1.33 0.67 3.03 5.69 0.75 CoV 2.18% 1.76% 18.69% 21.67% 6.95%
Count 105 105 105 105 105 High 64.10 39.90 29.51 41 14.80 Low 57.80 36.70 10.76 15 9.30
2"Castings UTS 0.2%
YS Total Elong at
Failure RA Modulus Tensile ksi ksi % % MSI Mean 61.84 38.53 17.79 28.18 10.78 SDev 1.53 0.68 4.27 6.83 0.64 CoV 2.47% 1.75% 23.98% 24.24% 5.91%
Count 105 105 105 105 105
High 63.80 41.60 27.36 42 14.10 Low 56.70 37.00 10.36 13 9.70
Table 5. A206-T4 average tensile test properties
DISTRIBUTION STATEMENT A. Approved for public release: distribution unlimited

12
Table 6. A206-T71 tensile test properties
DISTRIBUTION STATEMENT A. Approved for public release: distribution unlimited

13
Figure 4: Tensile Properties of A206-T4 Figure 5: Tensile Properties of A206-T71
An analysis of the data in Tables 5 and 6 and Figures 4 and 5 shows the following:
1. The A206 tempers meet or exceed the minimum requirements per Aerospace Material Specification (AMS 4235B and 4236B).
2. Both 1” and 2” cast thicknesses for the T4 and the T71 tempers show equivalent ultimate tensile strengths (UTS ~ 57.35 ksi for T71 and 61.33 ksi for T4) and 0.2% offset yields (YS ~ 46.51 ksi for T71 and 38.36 ksi for T4) with coefficient of variations on the order of 2.53% or less.
3. The 0.5” thickness for the T4 and the T71 tempers shows higher ultimate tensile strengths (UTS ~ 62.75 ksi for T71 and 63.79 ksi for T4) and 0.2% offset yields (YS ~ 50.22 ksi for T71 and 40.39 ksi for T4) with coefficient of variations on the order of 8% or less than the 1” and 2” material.
4. The 0.5”, 1”, and 2” cast thicknesses for the T4 temper meet or exceed the minimum requirements for A206-T4 per Aerospace Material Specification 4236 (AMS 4236). AMS 4236 has a UTS minimum of 50 ksi and a YS minimum of 30 ksi.
5. The 0.5”, 1”, and 2” cast thickness for the T71 temper meet or exceed the minimum requirements for A206-T71 per Aerospace Material Specification 4235 (AMS 4235). AMS 4235 has a UTS minimum of 54 ksi and a YS minimum of 45 ksi.
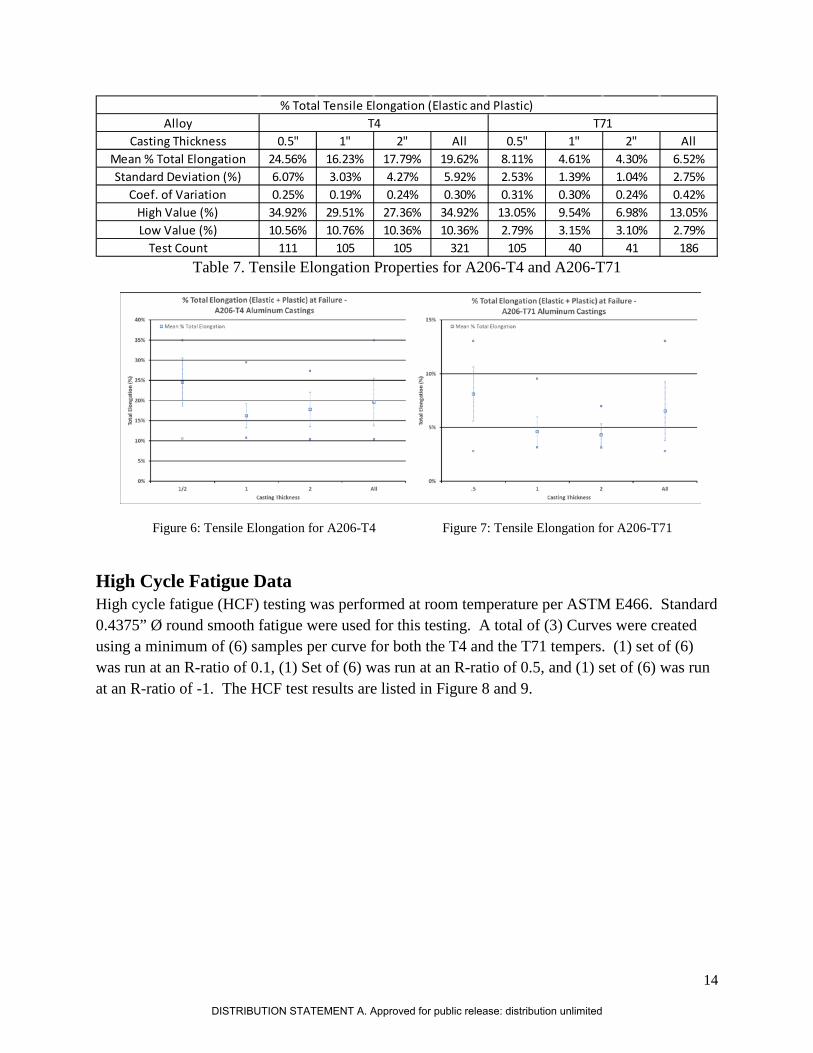
6. The total tensile elongation values for the three different thicknesses varied significantly as shown in Table 7 and Figures 6 and 7. All values listed meet or exceed the minimum requirements for A206-T71 per AMS 4235 (3% Elongation) and A206-T4 per AMS 4236 (10% Elongation)
DISTRIBUTION STATEMENT A. Approved for public release: distribution unlimited
14
AlloyCasting Thickness 0.5" 1" 2" All 0.5" 1" 2" All
Mean % Total Elongation 24.56% 16.23% 17.79% 19.62% 8.11% 4.61% 4.30% 6.52%Standard Deviation (%) 6.07% 3.03% 4.27% 5.92% 2.53% 1.39% 1.04% 2.75%
Coef. of Variation 0.25% 0.19% 0.24% 0.30% 0.31% 0.30% 0.24% 0.42%High Value (%) 34.92% 29.51% 27.36% 34.92% 13.05% 9.54% 6.98% 13.05%Low Value (%) 10.56% 10.76% 10.36% 10.36% 2.79% 3.15% 3.10% 2.79%
Test Count 111 105 105 321 105 40 41 186
% Total Tensile Elongation (Elastic and Plastic)T4 T71
Table 7. Tensile Elongation Properties for A206-T4 and A206-T71
Figure 6: Tensile Elongation for A206-T4 Figure 7: Tensile Elongation for A206-T71
High Cycle Fatigue Data High cycle fatigue (HCF) testing was performed at room temperature per ASTM E466. Standard 0.4375” Ø round smooth fatigue were used for this testing. A total of (3) Curves were created using a minimum of (6) samples per curve for both the T4 and the T71 tempers. (1) set of (6) was run at an R-ratio of 0.1, (1) Set of (6) was run at an R-ratio of 0.5, and (1) set of (6) was run at an R-ratio of -1. The HCF test results are listed in Figure 8 and 9.
DISTRIBUTION STATEMENT A. Approved for public release: distribution unlimited

15
Figure 8: High Cycle Fatigue for A206-T4
Figure 9: High Cycle Fatigue for A206-T71
DISTRIBUTION STATEMENT A. Approved for public release: distribution unlimited

16
An analysis of the data in Figures 8 and 9 shows consistent results for both cast thicknesses for the T4 and the T71 with the R-ratio of 0.5 yielding the highest cycle counts, the R-ratio of 0.1 yielding the second highest cycle counts, and the R-ratio of -1 yielding the lowest cycle counts.
Low Cycle Fatigue Data Low cycle fatigue (LCF) was done at room temperature per ASTM E606 for the 1” cast thickness. Standard 0.4375” Ø round smooth fatigue were used for this testing. A total of (2) curves were created using a minimum of (10) samples per curve at an R-ratio of -1 and a minimum of (6) samples per curve at an R-ratio of 0.1 for both the T4 and the T71 tempers. The LCF test results are listed below in Figures 10 and 11.
Figure 10. Low Cycle Fatigue for A206-T4
DISTRIBUTION STATEMENT A. Approved for public release: distribution unlimited

17
Figure 11: Low Cycle Fatigue for A206-T71
An analysis of the data in Figures 10 and 11 shows consistent results for both cast thicknesses for the T4 and T71 with both R-ratios yielding cycle counts at roughly equivalent values. Similar analysis was performed for compressive strength, elastic modulus, shear strength and pin bearing strength.
15-5PH/17-4PH Investment Cast Alloys
As with the A206 alloy, the MMPDS Handbook does not currently include 15-5PH/17-4PH investment cast alloy related properties for all grades. WMTR has completed all the MMPDS mechanical tests on provided castings for 15-5PH and 17-4PH material that was supplied by 14 foundries. 1,181 mechanical strength tests were done on the Stainless Steel 15-5PH and 17-4PH – 413 tensile, 54 tensile modulus, 120 compression, 55 compression modulus, 120 shear, 162 pin bearing, 182 Charpy, and 75 fatigue (load and strain control).
Tensile Strength Data The tensile tests were done at room temperature per ASTM E8 and B557. All alloys tested used a standard 0.250” Ø (diameter) tensile round for this testing. The tensile tests results (mean UTS and YS strengths, standard deviation, coefficient of variation, test count, and high and low
DISTRIBUTION STATEMENT A. Approved for public release: distribution unlimited

18
values) for all alloys and tempers are given in Table 8. The mean values for the ultimate stress (UTS) and the 0.2% offset yield stress (YS) are plotted in Figure 12 for all alloys and tempers along with and addition set of the combined totals.
Stainless Steel 15-5PH H935 Temper UTS 0.2% YS Total Elong at Failure RA Modulus
Tensile ksi Ksi % % MSI Mean 180.91 169.41 13.46 36.28 28.95 SDev 4.23 4.75 2.62 9.29 1.06 CoV 2.34% 2.81% 19.48% 25.60% 3.67%
Count 72 72 72 72 72 High 194.30 184.20 18.4 54 31.1 Low 174.30 163.40 7.06 14 25.9
H1000 Temper UTS 0.2% YS Total Elong at Failure RA Modulus Tensile ksi Ksi % % MSI Mean 168.04 161.1 14.51 41.00 29.26 SDev 5.02 6.43 2.85 8.29 1.38 CoV 2.99% 3.99% 19.62% 20.23% 4.73%
Count 83 83 83 83 83 High 182.10 176.20 18.7 56 38.4 Low 162.60 139.90 6.34 19 27.2
H1100 Temper UTS 0.2% YS Total Elong at Failure RA Modulus Tensile ksi Ksi % % MSI Mean 152.91 146.6 15.72 45.01 29.06 SDev 2.63 5.60 2.79 9.33 1.08 CoV 1.72% 3.82% 17.72% 20.74% 3.73%
Count 75 75 75 75 75 High 160.80 156.30 20.5 61 32.9 Low 148.60 121.00 6.03 20 26.9
Stainless Steel 17-4PH H900 Temper UTS 0.2% YS Total Elong at Failure RA Modulus
Tensile ksi Ksi % % MSI Mean 192.26 168.33 11.35 18.65 28.75 SDev 4.07 2.73 2.83 6.39 1.18 CoV 2.12% 1.62% 24.91% 34.26% 4.11%
Count 31 31 31 31 31 High 200.70 176.30 15.7 38 30.8 Low 187.20 165.10 5.2 12 36.7
H1000 Temper UTS 0.2% YS Total Elong at Failure RA Modulus Tensile ksi Ksi % % MSI Mean 163.32 154.44 12.43 33.53 29.39 SDev 2.33 3.06 3.93 11.17 1.66
DISTRIBUTION STATEMENT A. Approved for public release: distribution unlimited

19
Table 8. Tensile Properties of 15-5PH and 17-4 PH
Figure 12. Tensile Properties of 15-5PH and 17-4PH Stainless Steel
An analysis of the data in Table 8 and Figure 12 shows the following.
1. The 15-5PH cast for H935 tempers meets or exceeds the minimum requirements per Aerospace Material Specification 5400 (AMS 5400). AMS 5400 has UTS minimum of 170 ksi, a YS minimum of 150 ksi, a minimum Elongation of 6%, and a Reduction in Area minimum of 14%.
2. The 15-5PH cast for H1000 tempers meets or exceeds the minimum requirements per Aerospace Material Specification 5347 (AMS 5347). AMS 5347 has UTS minimum of 150 ksi, a YS minimum of 130 ksi, a minimum Elongation of 6%, and a Reduction in Area minimum of 15%.
3. The 15-5PH cast for H1100 tempers meets or exceeds the minimum requirements per Aerospace Material Specification 5356 (AMS 5356). AMS 5356 has UTS minimum of 130 ksi, a YS minimum of 120 ksi, a minimum Elongation of 6%, and a minimum Reduction in Area of 18%.
DISTRIBUTION STATEMENT A. Approved for public release: distribution unlimited
20
4. The 17-4PH cast for H900 tempers meets or exceeds the minimum requirements per Aerospace Material Specification 5344 (AMS 5344). AMS 5344 has UTS minimum of 180 ksi, a YS minimum of 160 ksi, a minimum Elongation of 4%, and a Reduction of Area minimum of 12%.
5. The 17-4PH cast for H1000 tempers meets or exceeds the minimum requirements per Aerospace Material Specification 5343 (AMS 5343). AMS 5343 has UTS minimum of 150 ksi, a YS minimum of 130 ksi, a minimum Elongation of 4%, and a Reduction of Area minimum of 12%.
6. The 17-4PH cast for H1100 tempers meets or exceeds the minimum requirements per Aerospace Material Specification 5342 (AMS 5342). AMS 5342 has UTS minimum of 130 ksi, a YS minimum of 120 ksi, a minimum Elongation of 6%, and a Reduction of Area minimum of 15%.
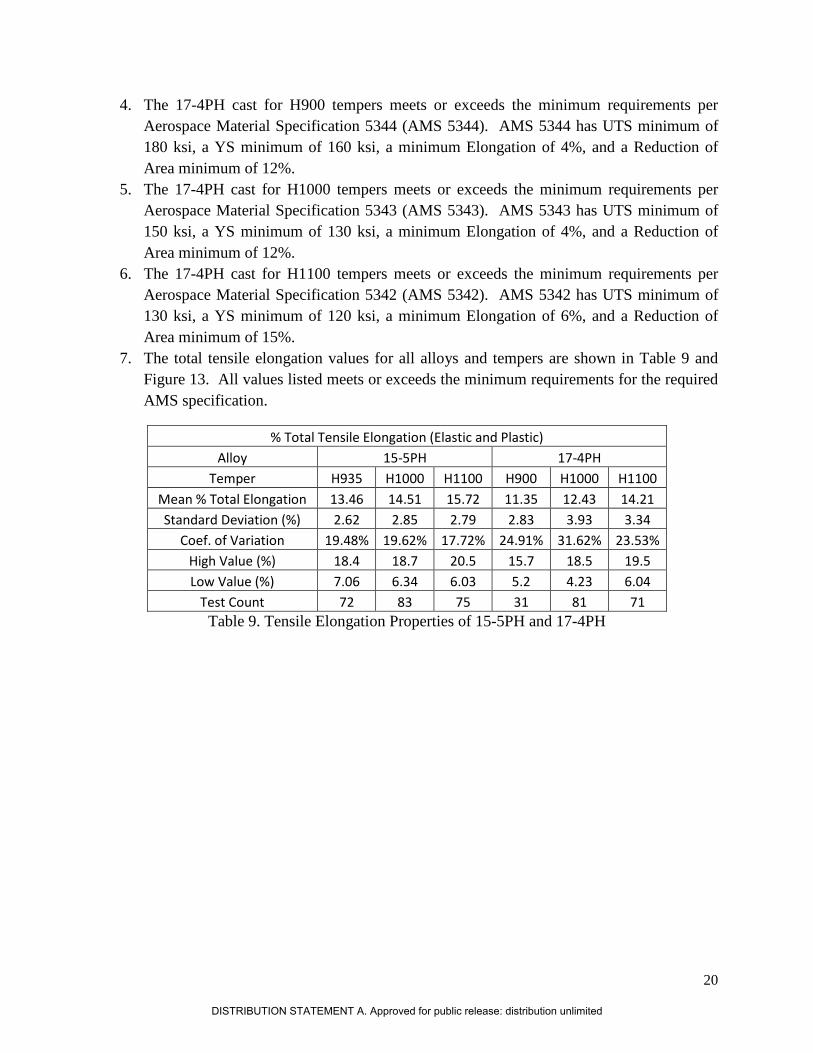
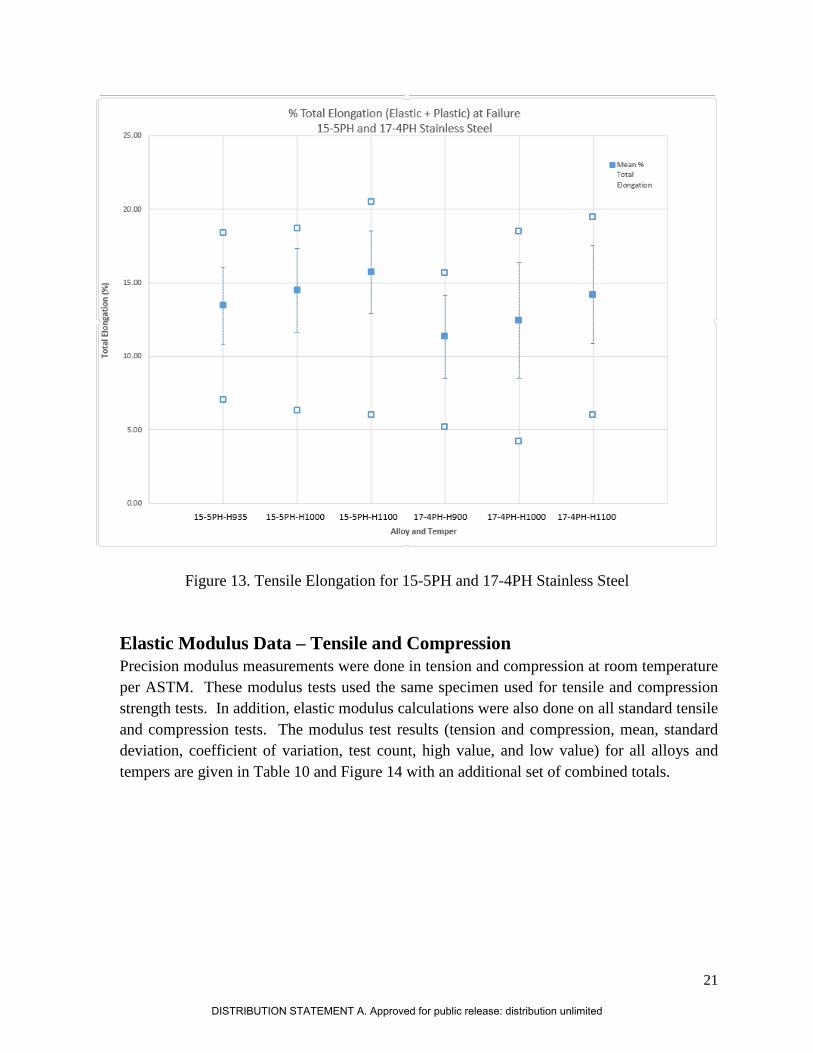
7. The total tensile elongation values for all alloys and tempers are shown in Table 9 and Figure 13. All values listed meets or exceeds the minimum requirements for the required AMS specification.
% Total Tensile Elongation (Elastic and Plastic) Alloy 15-5PH 17-4PH
Temper H935 H1000 H1100 H900 H1000 H1100 Mean % Total Elongation 13.46 14.51 15.72 11.35 12.43 14.21 Standard Deviation (%) 2.62 2.85 2.79 2.83 3.93 3.34
Coef. of Variation 19.48% 19.62% 17.72% 24.91% 31.62% 23.53% High Value (%) 18.4 18.7 20.5 15.7 18.5 19.5 Low Value (%) 7.06 6.34 6.03 5.2 4.23 6.04
Test Count 72 83 75 31 81 71 Table 9. Tensile Elongation Properties of 15-5PH and 17-4PH
DISTRIBUTION STATEMENT A. Approved for public release: distribution unlimited
21
Figure 13. Tensile Elongation for 15-5PH and 17-4PH Stainless Steel
Elastic Modulus Data – Tensile and Compression Precision modulus measurements were done in tension and compression at room temperature per ASTM. These modulus tests used the same specimen used for tensile and compression strength tests. In addition, elastic modulus calculations were also done on all standard tensile and compression tests. The modulus test results (tension and compression, mean, standard deviation, coefficient of variation, test count, high value, and low value) for all alloys and tempers are given in Table 10 and Figure 14 with an additional set of combined totals.
DISTRIBUTION STATEMENT A. Approved for public release: distribution unlimited

22
Table 10. Precision Modulus Properties of 15-5PH and 17-4PH
DISTRIBUTION STATEMENT A. Approved for public release: distribution unlimited

23
Figure14 Precision Modulus Properties of 15-5PH and 17-4PH Stainless Steel
An analysis of the data in Table 10 and Figure 14 shows all 15-5PH having a relative modulus across all tempers of 28.5 Msi with a coefficient of variation on the order of 2.4% or less. All 17-4PH show a relative modulus across all tempers of 28.82 Msi with a coefficient of variation on the order of 2.4% or less.
Similar analysis was performed for compressive strength, shear strength, pin bearing strength and Charpy strength. High Cycle Fatigue Data High cycle fatigue (HCF) was done at room temperature per ASTM E466 for both 15-5PH-H935 and 17-4PH-H1000. Standard 0.250” Ø round smooth fatigue and standard 0.200” Ø round smooth were used for this testing. The smaller diameter was added due to grip slippage on higher load samples. A total of (3) Curves were created using a minimum of (6) samples per curve for both alloys tested. (1) Set of (6) were run at an R-ratio of 0.1, (1) Set of (6) were run at an R-ratio of 0.5, and (1) set of (6) were run at an R-ratio of -1. The HCF test results are listed below in Figures 15 and 16.
DISTRIBUTION STATEMENT A. Approved for public release: distribution unlimited

24
Figure 15. High Cycle Fatigue for 15-5PH-H935 Stainless Steel
Figure 16. High Cycle Fatigue for 17-4PH-H1000 Stainless Steel
DISTRIBUTION STATEMENT A. Approved for public release: distribution unlimited

25
An analysis of the data in Figures 15 and 16 shows both the 15-5PH-H935 and the 17-4PH-H1000 castings show an expected result with the R-ratio of 0.5 yielding the highest cycle counts, the R-Ratio of 0.1 yielding the second highest cycle counts, and the R-Ratio of -1 yielding the lowest cycle counts.
Low Cycle Fatigue Data
Low cycle fatigue (LCF) was done at room temperature per ASTM E606 for both 15-5PH-H935 and 17-4PH-H1000. Standard 0.250” Ø round smooth fatigue and standard 0.200” Ø were used for this testing. The small diameter was added due to grip slippage on higher load samples. A total of (2) Curves were created using a minimum of (10) sample per curve for an R-ratio of -1 and minimum of (6) samples per curve at an R-ratio of 0.1 for both alloys. The LCF test results are listed below in Figure 17 and 18.
Figure 17. Low Cycle Fatigue for 15-5PH-H935 Stainless Steel
DISTRIBUTION STATEMENT A. Approved for public release: distribution unlimited
26
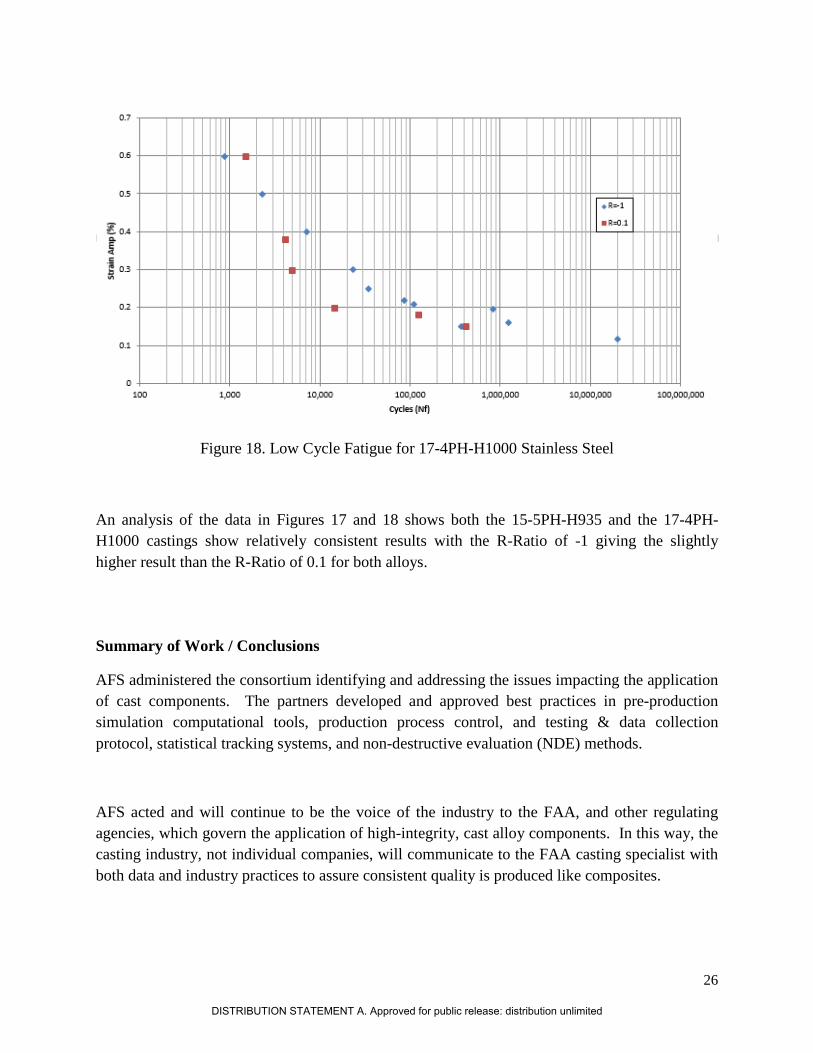
Figure 18. Low Cycle Fatigue for 17-4PH-H1000 Stainless Steel
An analysis of the data in Figures 17 and 18 shows both the 15-5PH-H935 and the 17-4PH-H1000 castings show relatively consistent results with the R-Ratio of -1 giving the slightly higher result than the R-Ratio of 0.1 for both alloys.
Summary of Work / Conclusions
AFS administered the consortium identifying and addressing the issues impacting the application of cast components. The partners developed and approved best practices in pre-production simulation computational tools, production process control, and testing & data collection protocol, statistical tracking systems, and non-destructive evaluation (NDE) methods.
AFS acted and will continue to be the voice of the industry to the FAA, and other regulating agencies, which govern the application of high-integrity, cast alloy components. In this way, the casting industry, not individual companies, will communicate to the FAA casting specialist with both data and industry practices to assure consistent quality is produced like composites.
DISTRIBUTION STATEMENT A. Approved for public release: distribution unlimited
27
Full implementation of project deliverables will be complete when the data is full incorporated into MMPDS as design allowables and available to casting designers and users. The incorporation into MMPDS is still in process at the time of this report. The A206 material has been submitted to MMPDS and will be discussed at the Spring 2018 MMPDS meeting. The 15-5ph and 17-4ph material will be submitted to Battelle for the MMPDS review in December 2017. The information produced in the project, technical discoveries and developments and lessons learned will be distributed to the public for the use and improvement of the broader metalcasting industry through AFS technology transfer venues (such as Metalcasting Congress and workshop presentations) and AFS publication sources (such as the International Journal of Metalcasting). AFS will continue working with the project members, MMPDS and other aerospace and defense venues to coordinate further technology transfer opportunities.
A206-T4 and A206-T71 sand castings
1 The tensile ultimate strength and yield strength for the A-Basis and B-Basis results show a close relation between the 1” and 2” thickness while the 0.5” thickness shows a small increase in both UTA and YS for both the T4 and T71 Tempers. This is consistent with the mean average results.
2 All S-Basis testing shows a larger variance in the design allowable due in part to the combination on higher standard deviations matched with higher Kn values. Both of these values are in a direct relation to number of samples tested and can be potentially lowered with the addition of more samples.
3 The revised AMS 4236B for A206-T4 and AMS 4235B for A206-T71 is a very significant result of this work. The Principal Investigator believes the step solution heat treatment is more effective because it more efficiently eliminates the coring effect for this copper containing aluminum alloy; however, this has not been investigated or verified. The previous solution heat treat requirement was to heat to 985o F +/-10 (530o C+/-5), hold at heat not less than 8 hours, and quench. The revised step solution heat treatment is giving in Appendix B.
17-4PH/15-5PH investment castings 1 All S-Basis testing shows an as expected drop in design allowable results over the mean
results. With all coefficients of variations being roughly 5% or less yielding only small overall dips in value.
2 The design allowable values have the potential to be increased if a larger number of samples are run due to the direct link between a lower Kn value versus number of samples tested.
3 The potential for any results being lowered then anticipated could be the result of achieving full homogenization during solution heat treatment causing less ductility than expected across all samples, in particular on the 17-4PH-H900.
4 All alloys and tempers show an as expected result for UTS and YS with Coefficient of Variations on the order of 4.82% or less.
DISTRIBUTION STATEMENT A. Approved for public release: distribution unlimited
28
Acknowledgements
AMC’s Casting Solutions for Readiness program is funded through the U.S. Department of Defense (DoD), the Defense Supply Center Philadelphia, Philadelphia, PA and the Defense Logistics Agency (DLA) Research & Development Group, Ft. Belvoir, VA. Notably, AFS acknowledges Jiten Shah, PDA LLC for his contributions to this program. AFS recognizes Steve Robison, AFS Senior Technical Director, and Tom Prucha, former AFS Vice President Technical Services (retired), for their expertise and project management skills to this project.
AFS wishes to thank their participating partners for their generous support: Precision Casting Eck Industries Carley Foundry Eagle Precisio Casting Signicast MCM Precision Castings Inc. MetalTek International Tech Cast DAFCO Aerospace Intercast-Fansteel Kovatch Castings Aerotec Alloys Wisconsin Precision Casting AristoCast Bescast Inc. Paramelt AppliedThermal Technologies Precision Propeller Ind,/Yamaha Motors Boose Aluminum MPI Product Development & Analysis (PDA) LLC Tom Prucha Westmoreland Mechanical Testing & Research Wolf Aerospace Corp
Zayna Connor, Ph.D. AFS consultant
Doug Kurkul, CEO
DISTRIBUTION STATEMENT A. Approved for public release: distribution unlimited
29
American Foundry Society
Appendix A – MMPDS Definitions and Data Requirements for Statistical Basis
Each type of data in the MMPDS is classified statistically as typical, S-Basis, B-Basis, or A-Basis.
A-Basis – The lower of either a statistically calculated T99 or specification minimum. T99 is the value at which at least 99% of population is expected to equal or exceed with 95% confidence. A-basis for static design properties are based on minimum population of 100.
B-Basis – Same as T90; at least 90% of population is expected to equal or exceed with 95% confidence. B-basis for static design properties are based on minimum population of 100.
S-Basis – Specification minimum, or value based on specification minimum. S-basis is typically based on a minimum population of 30 for AMS specifications.
Basis Value = Mean Value – (Kn*Standard Deviation)
Kn – One-sided tolerance limit factor. The value of Kn depends on the population limit, the confidence coefficient, and the number of data points.
DISTRIBUTION STATEMENT A. Approved for public release: distribution unlimited
30
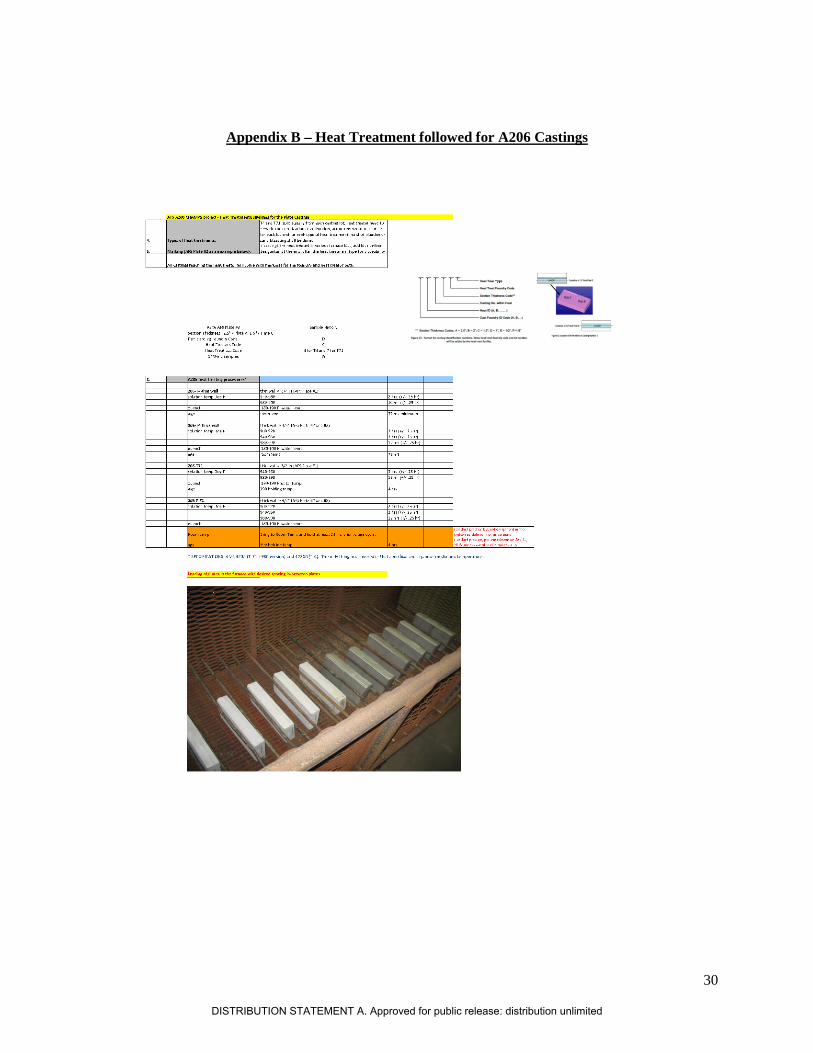
Appendix B – Heat Treatment followed for A206 Castings
DISTRIBUTION STATEMENT A. Approved for public release: distribution unlimited