metal foam electrode as a cathode for copper electrowinning
TRANSCRIPT
coatings
Article
Metal Foam Electrode as a Cathodefor Copper Electrowinning
Modestas Vainoris 1 , Henrikas Cesiulis 2,* and Natalia Tsyntsaru 1
1 Department of Physical Chemistry, Vilnius University, LT-01513 Vilnius, Lithuania;[email protected] (M.V.); [email protected] (N.T.)
2 JSC Elektronikos Perdirbimo Technologijos, LT-06140 Vilnius, Lithuania* Correspondence: [email protected]; Tel.: +370-(5)-2193178
Received: 31 July 2020; Accepted: 22 August 2020; Published: 25 August 2020
Abstract: The geometry of porous materials is complex, and the determination of the true surfacearea is important because it affects current density, how certain reactions will progress, their rates,etc. In this work, we have investigated the dependence of the electrochemical deposition of coppercoatings on the geometry of the copper substrate (flat plates or 3D foams). Chronoamperometricmeasurements show that copper deposition occurs 3 times faster on copper foams than on a flatelectrode with the same geometric area in the same potential range, making metal foams greatelectrodes for electrowinning. Using electrochemical impedance spectroscopy (EIS), the mechanismof copper deposition was determined at various concentrations and potentials, and the capacities ofthe double electric layer (DL) for both types of electrodes were calculated. The DL capacity on thefoam electrodes is up to 14 times higher than that on the plates. From EIS data, it was determinedthat the charge transfer resistance on the Cu foam electrode is 1.5–1.7 times lower than that on the Cuplate electrode. Therefore, metal foam electrodes are great candidates to be used for processes that arecontrolled by activation polarization or by the adsorption of intermediate compounds (heterogeneouscatalysis) and processes occurring on the entire surface of the electrode.
Keywords: metal foam; surface area; electrowinning; Cu electrodeposition; EIS; double electriclayer capacitance
1. Introduction
The ever-increasing need for electronics, especially, handheld and portable electronics, and theneed to reduce their size and increase their efficiency, generates a lot of various electronics wasteall over the globe [1–3]. There are many ways to reclaim used metals in electronic waste; however,electrowinning is a very efficient and quite selective process allowing the recovery of high amountsof various pure metals [4–6]. Metallic foams and porous electrodes have an outstanding potentialto be used as a cathode to collect deposited metals because of the functionality of their combinedmaterial properties resulting from their specific morphology. There already is great interest in thesynthesis of various porous materials such as metal foams, nanowires, porous coatings, thin porousfilms, etc. [7–15]. Depending on the materials, type of pores (open or closed cells), the porosity and sizeof pores, such materials have broad application capabilities, from simple ones such as heat transfer orelectrodes to more complicated cases of various redox reactions, catalysis, sensing, supercapacitors, oreven gas storage because of the high surface area and low density available [9,16–29].
Any solid metal surface that acts as a substrate for electrochemical reactions possesses a certainroughness that can affect in different ways the values of the limiting diffusion current and the exchangecurrent density. On the other hand, if the surface coarseness is relatively small, the limiting diffusioncurrent density does not depend on the surface roughness, and it can be only correlated to the apparent
Coatings 2020, 10, 822; doi:10.3390/coatings10090822 www.mdpi.com/journal/coatings

Coatings 2020, 10, 822 2 of 15
surface of the electrodes. If the surface roughness of electrodes increases, the effective values of theexchange current density are also increased for the process under consideration, which is standardizedto the apparent electrode surface area. At the same time, the limiting diffusion current density dependson the surface coarseness due to the decrease of the effective value of the diffusion layer thickness. If thelevel of the electrode surface coarseness remains low, the change of the limiting diffusion current densitycan be neglected [30]. In addition, it has been shown that when the metal deposition is controlled bydiffusion (particularly silver), the surface with the highest surface roughness had a lower numberof active sites but higher deposition efficiency and a higher efficiency of charge transfer [31]. Thedependence between surface roughness and deposition efficiency is non-linear; the surface roughnessneeds to be quite high to affect the deposition efficiency [31,32]. It was proven that when the depositionreaction is controlled by the diffusion, the geometry of the electrode has no significant influence on thereaction [33]. Using very porous or surfaces with high roughness, one can eliminate activation anddiffusion overpotentials, making the reaction process controlled by Ohmic effects and thus makingthe reaction much faster [30,31]. All these effects make porous metal electrodes with pore diametershigher than 50 µm high-performance cathodes for deposition reactions under diffusion control.
The estimation of the active surface area of highly porous conducting materials is also veryimportant. Thus, various in situ or ex situ techniques can be used for these purposes. In situ techniquesare preferred, since drying the sample can cause changes in the surface area and/or oxidation ofthe surface, changing its characteristics. Depending on the material and its porosity, one can usetechniques for double electric layer estimations (cyclic voltammetry, initial charge-up dependencies,electrochemical impedance spectroscopy (EIS)), or adapt various adsorption/redox reactions thatoccur on the surface (underpotential depositions, adsorption measurements, reduction of variousdyes, etc.) [29,34–39]. The classical techniques for surface area estimation—liquid permeability, gasadsorption (Brunauer–Emmett–Teller technique)—in some cases can also be used [34,35,39]. However,these techniques require higher amounts of materials and can have quite large error margins, dependingon the geometry of the pores and the sample itself. For porous materials that are quite level, andwith ordered pores, more sophisticated techniques could be used for porosity estimation such asatomic force microscopy (AFM) or spectroscopic ellipsometry; the latter requires a rather complexmodeling [40–42].
EIS is a very powerful and versatile in situ technique that allows not only estimating the truesurface area of conducting materials but also investigating the surface and the processes happening atthe surface [9,20,23,27,29]. Using the EIS technique, one can investigate both Faradaic and non-Faradaicprocesses on the surface simultaneously [27,29,34,35,43–47]. Even the size and distribution of the porescan be characterized by employing the EIS technique [45,46]. However, the surface area determined byEIS or any other electrochemical method is not the true surface area, but rather the electrochemicallyactive surface area, which can be much more useful when trying to determine the activity of porousmaterials for a hydrogen evolution reaction (HER) or other electrochemical reaction [39–47].
In this work, we investigated the deposition of copper on the plate (2D) and foam (3D) coppersubstrates using voltammetry and EIS. The comparison of 2D and 3D electrodes has been carried outto determine differences in double electric layer formation, charge transfer, diffusion, and depositionrates. These results are important for trying to enhance the potential application of foam electrodes inindustry, and particularly for the electrowinning of copper from electronics waste.
2. Materials and Methods
2.1. Materials and Sample Preparation
All of the chemicals used for analysis were of analytical grade (Carl Roth, Karlsruhe,Germany). Solutions have been prepared using deionized water (DI). Solution compositions used forelectrochemical experiments are shown in Table 1. The pH of solutions was adjusted using sulfuric acidand controlled by a benchtop pH-meter ProLine Plus (Prosence B.V., Oosterhout, The Netherlands).
Coatings 2020, 10, 822 3 of 15
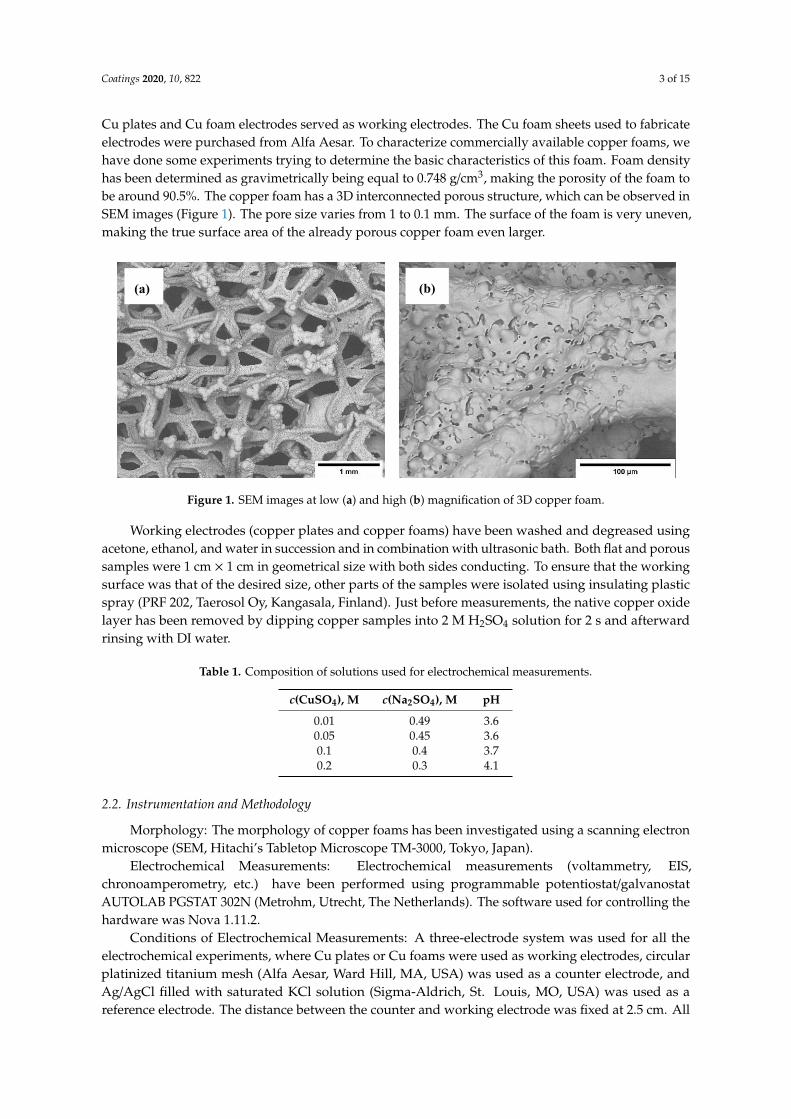
Cu plates and Cu foam electrodes served as working electrodes. The Cu foam sheets used to fabricateelectrodes were purchased from Alfa Aesar. To characterize commercially available copper foams, wehave done some experiments trying to determine the basic characteristics of this foam. Foam densityhas been determined as gravimetrically being equal to 0.748 g/cm3, making the porosity of the foam tobe around 90.5%. The copper foam has a 3D interconnected porous structure, which can be observed inSEM images (Figure 1). The pore size varies from 1 to 0.1 mm. The surface of the foam is very uneven,making the true surface area of the already porous copper foam even larger.
Coatings 2020, 10, x FOR PEER REVIEW 3 of 15
used to fabricate electrodes were purchased from Alfa Aesar. To characterize commercially available copper foams, we have done some experiments trying to determine the basic characteristics of this foam. Foam density has been determined as gravimetrically being equal to 0.748 g/cm³, making the porosity of the foam to be around 90.5%. The copper foam has a 3D interconnected porous structure, which can be observed in SEM images (Figure 1). The pore size varies from 1 to 0.1 mm. The surface of the foam is very uneven, making the true surface area of the already porous copper foam even larger.
Figure 1. SEM images at low (a) and high (b) magnification of 3D copper foam.
Working electrodes (copper plates and copper foams) have been washed and degreased using acetone, ethanol, and water in succession and in combination with ultrasonic bath. Both flat and porous samples were 1 cm × 1 cm in geometrical size with both sides conducting. To ensure that the working surface was that of the desired size, other parts of the samples were isolated using insulating plastic spray (PRF 202, Taerosol Oy, Kangasala, Finland). Just before measurements, the native copper oxide layer has been removed by dipping copper samples into 2 M H2SO4 solution for 2 s and afterward rinsing with DI water.
Table 1. Composition of solutions used for electrochemical measurements.
c(CuSO4), M c(Na2SO4), M pH 0.01 0.49 3.6 0.05 0.45 3.6 0.1 0.4 3.7 0.2 0.3 4.1
2.2. Instrumentation and Methodology
Morphology: The morphology of copper foams has been investigated using a scanning electron microscope (SEM, Hitachi’s Tabletop Microscope TM-3000, Tokyo, Japan).
Electrochemical Measurements: Electrochemical measurements (voltammetry, EIS, chronoamperometry, etc.) have been performed using programmable potentiostat/galvanostat AUTOLAB PGSTAT 302N (Metrohm, Utrecht, The Netherlands). The software used for controlling the hardware was Nova 1.11.2.
Conditions of Electrochemical Measurements: A three-electrode system was used for all the electrochemical experiments, where Cu plates or Cu foams were used as working electrodes, circular platinized titanium mesh (Alfa Aesar, Ward Hill, MA, USA) was used as a counter electrode, and Ag/AgCl filled with saturated KCl solution (Sigma-Aldrich, St. Louis, MO, USA) was used as a reference electrode. The distance between the counter and working electrode was fixed at 2.5 cm. All electrochemical experiments have been performed at room temperature. Voltammetry measurements were done using the potential sweep voltammetry technique on Cu plates and Cu
(b) (a)
Figure 1. SEM images at low (a) and high (b) magnification of 3D copper foam.
Working electrodes (copper plates and copper foams) have been washed and degreased usingacetone, ethanol, and water in succession and in combination with ultrasonic bath. Both flat and poroussamples were 1 cm × 1 cm in geometrical size with both sides conducting. To ensure that the workingsurface was that of the desired size, other parts of the samples were isolated using insulating plasticspray (PRF 202, Taerosol Oy, Kangasala, Finland). Just before measurements, the native copper oxidelayer has been removed by dipping copper samples into 2 M H2SO4 solution for 2 s and afterwardrinsing with DI water.
Table 1. Composition of solutions used for electrochemical measurements.
c(CuSO4), M c(Na2SO4), M pH
0.01 0.49 3.60.05 0.45 3.60.1 0.4 3.70.2 0.3 4.1
2.2. Instrumentation and Methodology
Morphology: The morphology of copper foams has been investigated using a scanning electronmicroscope (SEM, Hitachi’s Tabletop Microscope TM-3000, Tokyo, Japan).
Electrochemical Measurements: Electrochemical measurements (voltammetry, EIS,chronoamperometry, etc.) have been performed using programmable potentiostat/galvanostatAUTOLAB PGSTAT 302N (Metrohm, Utrecht, The Netherlands). The software used for controlling thehardware was Nova 1.11.2.
Conditions of Electrochemical Measurements: A three-electrode system was used for all theelectrochemical experiments, where Cu plates or Cu foams were used as working electrodes, circularplatinized titanium mesh (Alfa Aesar, Ward Hill, MA, USA) was used as a counter electrode, andAg/AgCl filled with saturated KCl solution (Sigma-Aldrich, St. Louis, MO, USA) was used as areference electrode. The distance between the counter and working electrode was fixed at 2.5 cm. All

Coatings 2020, 10, 822 4 of 15
electrochemical experiments have been performed at room temperature. Voltammetry measurementswere done using the potential sweep voltammetry technique on Cu plates and Cu foams as workingelectrodes, starting at open circuit potential and going up to −1.2 V versus Ag/AgCl at a 2 mV/s scanrate. Voltammetry measurements have been performed using all the solutions shown in Table 1.Chronoamperometry experiments were performed at 4 distinct potentials (−0.1, −0.2, −0.4 and −0.6 Vversus Ag/AgCl) using different substrates as working electrodes (Cu plates or foams) in 0.1 M CuSO4
and 0.4 M Na2SO4 solution. The same amount of electric charge was used to deposit coatings, i.e., 30 C.The current efficiency was calculated using chronoamperometry data and change in substrate massafter deposition.
Electrochemical Impedance Spectroscopy (EIS): Electrochemical impedance spectroscopy (EIS)measurements have been done using a standard three-electrode system, carried out in a frequencyrange of 10 kHz to 0.1 Hz, using perturbation amplitude of 10 mV. Obtained data were fitted to theequivalent electric circuit model (EEC) using ZView 2.8d software.
3. Results and Discussion
3.1. Copper Foam Characterization
In order to determine how the behavior of copper foams differs from flat surfaces in solutions,voltammetry experiments with different copper sulfate concentrations were carried out; thecompositions of the solutions are shown in Table 1. The concentration of the sulfate anion waskept at 0.5 M to maintain the same buffering power in all of the solutions. The obtained polarizationcurves for the plate and foam electrode are shown in Figure 2, where the ordinate axis is displayed in alogarithmic scale because of a big difference in the current values between tested concentrations. Toestimate the influence of porosity on the copper deposition, the geometrical sample size was the samefor both Cu plates and Cu foams (1 cm × 1 cm). As can be seen from Figure 2, Cu deposition startssomewhere around −0.075 V versus Ag/AgCl and did not depend on the substrate used. After the peakrepresenting the Cu2+ reduction to Cu0, the current on both surfaces and all the concentrations turnsinto an almost constant one. The reason for this could be the mass transport limitations because theleveling off of the current depends on the concentration of Cu(II) in the solution. This is also supportedby the slight increase of the current with the rise of polarization at higher concentrations (50 mM to0.2 M), showing that with higher potential, the positive ions are attracted from further away, and thedeposition rate increases.
In addition, voltammetry tests also showed that independently of the substrate used, the hydrogenevolution reaction (HER) started in the range of −1.0 to −1.1 V versus Ag/AgCl in the solutionscontaining 10 and 50 mM of CuSO4. This fact could be attributed to the governing role of pH change inthe pre-electrode layer during electrodeposition, and this change seems to be similar for both solutions.However, in the solution containing 0.2 M CuSO4, the HER started around −0.75 V versus Ag/AgClon both surfaces. It can be linked to the higher rate of copper electrodeposition, and in turn, the pHdecrease near the working electrode. Thus, the major difference between the two surfaces can benoted from voltammetry experiments: there was an approximately 3 times higher current on the foamsubstrate at all potentials in comparison to the flat surface. This difference can be explained by thebetter hydrodynamic conditions of copper foams substrate: the porous surface allows for faster masstransport and exchange.
For further investigation, the solution containing a similar amount of Cu(II) as in solutions usedfor the metals recovery from the electronic waste was chosen. Regarding the influence of the surfacetype on the Cu electrochemical deposition, chronoamperometric measurements have been done in0.1 M CuSO4 and 0.4 M Na2SO4 solution at four fixed potentials: −0.1, −0.2, −0.4, and −0.6 V versus,Ag/AgCl, and at a fixed amount of charge passed through the cell (30 C). The results have beensummarized and are shown in Table 2.

Coatings 2020, 10, 822 5 of 15Coatings 2020, 10, x FOR PEER REVIEW 5 of 15
Figure 2. Cathodic voltammograms on Cu plate (a) and foam (b) obtained in the electrolytes with various concentrations of CuSO4 (the compositions of solutions are shown in Table 1), potential scan rate 2 mV/s.
Table 2. Cu deposition rates on 2D and 3D electrodes in the solution containing 0.1 M CuSO4 and 0.4 M Na2SO4.
Cu Plate Cu Foam
E, V versus Ag/AgCl
Deposition Time (s)
Cu Deposition Rate (mg/min)
E, V versus Ag/AgCl
Deposition Time (s)
Cu Deposition
Rate (mg/min)
−0.1 1763 0.33 −0.1 643 0.94 −0.2 1681 0.35 −0.2 574 1.1 −0.4 1603 0.36 −0.4 593 1.0 −0.6 1571 0.37 −0.6 518 1.2
Chronoamperometric measurements (Table 2) clearly show an approximately 3 times faster copper deposition rate on the foam at all tested potentials. In this case, there was no hydrogen evolution, and the deposition efficiency was almost 100% on both substrates. A considerably higher deposition rate on the cooper foam substrate supports the idea that the deposition is controlled by diffusion to the electrode having a higher specific surface area. In addition, a higher metal deposition rate on the foam electrodes makes them an attractive substrate for the electrowinning of metals
0.2
1
5
25
125
-1.2-1-0.8-0.6-0.4-0.20
Cat
hodi
c cu
rren
t, m
A
E, V vs Ag/AgCl
(a)
10 mM 50 mM 0.1 M 0.2 M
1.00
10.00
100.00
1,000.00
-1.2-1-0.8-0.6-0.4-0.20
Cat
hodi
c cu
rren
t, m
A
E, V vs Ag/AgCl
(b)
10 mM 50 mM0.1 M 0.2 M
Figure 2. Cathodic voltammograms on Cu plate (a) and foam (b) obtained in the electrolytes withvarious concentrations of CuSO4 (the compositions of solutions are shown in Table 1), potential scanrate 2 mV/s.
Table 2. Cu deposition rates on 2D and 3D electrodes in the solution containing 0.1 M CuSO4 and 0.4M Na2SO4.
Cu Plate Cu FoamE, V versus
Ag/AgClDeposition
Time (s)Cu DepositionRate (mg/min)
E, V versusAg/AgCl
DepositionTime (s)
Cu DepositionRate (mg/min)
−0.1 1763 0.33 −0.1 643 0.94−0.2 1681 0.35 −0.2 574 1.1−0.4 1603 0.36 −0.4 593 1.0−0.6 1571 0.37 −0.6 518 1.2
Chronoamperometric measurements (Table 2) clearly show an approximately 3 times faster copperdeposition rate on the foam at all tested potentials. In this case, there was no hydrogen evolution,and the deposition efficiency was almost 100% on both substrates. A considerably higher depositionrate on the cooper foam substrate supports the idea that the deposition is controlled by diffusion tothe electrode having a higher specific surface area. In addition, a higher metal deposition rate on thefoam electrodes makes them an attractive substrate for the electrowinning of metals compared to other

Coatings 2020, 10, 822 6 of 15
materials having a similar geometric area. The morphology of deposits is influenced by the potentialand type of substrate, as it is shown in the SEM images in Figure 3.
Coatings 2020, 10, x FOR PEER REVIEW 6 of 15
compared to other materials having a similar geometric area. The morphology of deposits is influenced by the potential and type of substrate, as it is shown in the SEM images in Figure 3.
−E, V vs Ag/AgCl Cu Plate Cu Foam
0.2
0.6
Figure 3. SEM images of potentiostatically electrodeposited Cu coatings at different cathodic potentials on flat and foam copper substrates after 30 C passed charge. The bath was 0.1 M CuSO4 and 0.4 M Na2SO4.
The copper deposits have globules shapes on the flat electrodes, and the morphology did not differ at these two potentials. This is related to the very similar electrochemical deposition rates at these potentials, and as it can be seen from the voltammetry data (Figure 2) and efficiency of deposition, there were no side reactions, and the current was similar at these two potentials. Another case is the deposition on the porous substrate. At −0.2 V versus Ag/AgCl, copper forms cauliflower-like crystalline agglomerates with well-defined edges. At higher potential, the copper forms smoother surfaces that are still cauliflower-like structures. The coverage of both surface geometries was good even without external agitation, even at low potentials.
3.2. Surface Area and Diffusion Rate Estimations
To characterize copper foams and estimate the active surface areas for the charge and mass transfer processes that occur during the electrochemical deposition of copper, we utilized the EIS technique. EIS measurements have been done for all the solutions listed in Table 1. EIS measurements were performed at cathodic potentials of −0.125, −0.15, −0.175, and −0.2 V versus Ag/AgCl on flat and porous copper substrates. These potentials were chosen based on chronoamperometric data. At such low potentials, the change of surface morphology during deposition is still minimal and can be ignored in this case. Typical EIS scans on the copper plate at various potentials are shown in Figure 4. From the EIS data plots, we can see that at investigated potentials, the data plot can be divided into two zones: the high-frequency semicircle and the low-frequency (starting around 75–100 Hz) 45° angle line. The high-frequency semicircle can be attributed to charge up of the double layer and charge transfer to the copper ions, whilst the low-frequency line is attributed to the formation of the
Figure 3. SEM images of potentiostatically electrodeposited Cu coatings at different cathodic potentialson flat and foam copper substrates after 30 C passed charge. The bath was 0.1 M CuSO4 and 0.4 MNa2SO4.
The copper deposits have globules shapes on the flat electrodes, and the morphology did notdiffer at these two potentials. This is related to the very similar electrochemical deposition rates atthese potentials, and as it can be seen from the voltammetry data (Figure 2) and efficiency of deposition,there were no side reactions, and the current was similar at these two potentials. Another case isthe deposition on the porous substrate. At −0.2 V versus Ag/AgCl, copper forms cauliflower-likecrystalline agglomerates with well-defined edges. At higher potential, the copper forms smoothersurfaces that are still cauliflower-like structures. The coverage of both surface geometries was goodeven without external agitation, even at low potentials.
3.2. Surface Area and Diffusion Rate Estimations
To characterize copper foams and estimate the active surface areas for the charge and mass transferprocesses that occur during the electrochemical deposition of copper, we utilized the EIS technique.EIS measurements have been done for all the solutions listed in Table 1. EIS measurements wereperformed at cathodic potentials of −0.125, −0.15, −0.175, and −0.2 V versus Ag/AgCl on flat andporous copper substrates. These potentials were chosen based on chronoamperometric data. At suchlow potentials, the change of surface morphology during deposition is still minimal and can be ignoredin this case. Typical EIS scans on the copper plate at various potentials are shown in Figure 4. From theEIS data plots, we can see that at investigated potentials, the data plot can be divided into two zones:the high-frequency semicircle and the low-frequency (starting around 75–100 Hz) 45 angle line. Thehigh-frequency semicircle can be attributed to charge up of the double layer and charge transfer to thecopper ions, whilst the low-frequency line is attributed to the formation of the concentration gradientof the copper ions. To better evaluate ongoing processes, EIS data were fitted to the equivalent electric

Coatings 2020, 10, 822 7 of 15
circuit (EEC) that is shown as an inset in Figure 4 of the Nyquist plot (a). The elements of applied EEChave the following physical meaning: R0 is resistance at the electrode/electrolyte interface, CPE(DL) isa double-layer capacitance modeled via the constant phase element (CPE), R(CT) is a charge transferresistance, CPE(W) stands for the capacitance caused by the concentration gradient, and R(Diff) is aresistance caused by the concentration gradient. The element CPE(W) is attributed to the diffusionbecause of the signature 45 angle seen in the Nyquist plots at low frequencies (Figure 4), and the valuen in this CPE element was very close to 0.5 in all the experiments. This constant phase element actingonly in the low-frequency region represents diffusion, and it can be used as a Warburg element whenn = 0.5 [48,49]. The values of the constant phase element CPE(DL) have been recalculated into truecapacitance using Hsu and Mansfeld’s equation [50]. All values of components of the fitted EEC areindicated in Table 3.
Coatings 2020, 10, x FOR PEER REVIEW 7 of 15
concentration gradient of the copper ions. To better evaluate ongoing processes, EIS data were fitted to the equivalent electric circuit (EEC) that is shown as an inset in Figure 4 of the Nyquist plot (a). The elements of applied EEC have the following physical meaning: R0 is resistance at the electrode/electrolyte interface, CPE(DL) is a double-layer capacitance modeled via the constant phase element (CPE), R(CT) is a charge transfer resistance, CPE(W) stands for the capacitance caused by the concentration gradient, and R(Diff) is a resistance caused by the concentration gradient. The element CPE(W) is attributed to the diffusion because of the signature 45° angle seen in the Nyquist plots at low frequencies (Figure 4), and the value n in this CPE element was very close to 0.5 in all the experiments. This constant phase element acting only in the low-frequency region represents diffusion, and it can be used as a Warburg element when n = 0.5 [48,49]. The values of the constant phase element CPE(DL) have been recalculated into true capacitance using Hsu and Mansfeld’s equation [50]. All values of components of the fitted EEC are indicated in Table 3.
-70
-60
-50
-40
-30
-20
-10
00 10 20 30 40 50 60 70
Z'',
Ω
Z', Ω
-0.125 V plate-0.15 V plate-0.175 V plate-0.2 V plate
0153045607590
0.1 1 10 100 1000 10000
|Z|,
Ω
f, Hz
-0.125 V plate -0.15 V plate -0.175 V plate -0.2 V plate
-60
-45
-30
-15
00.1 1 10 100 1000 10000
θ, °
f, Hz
-0.125 V plate -0.15 V plate -0.175 V plate -0.2 V plate(c)
(a) RO CPE(DL)
R(CT) CPE(W)
R(Diff)
(b)
Figure 4. Cont.
Coatings 2020, 10, 822 8 of 15Coatings 2020, 10, x FOR PEER REVIEW 8 of 15
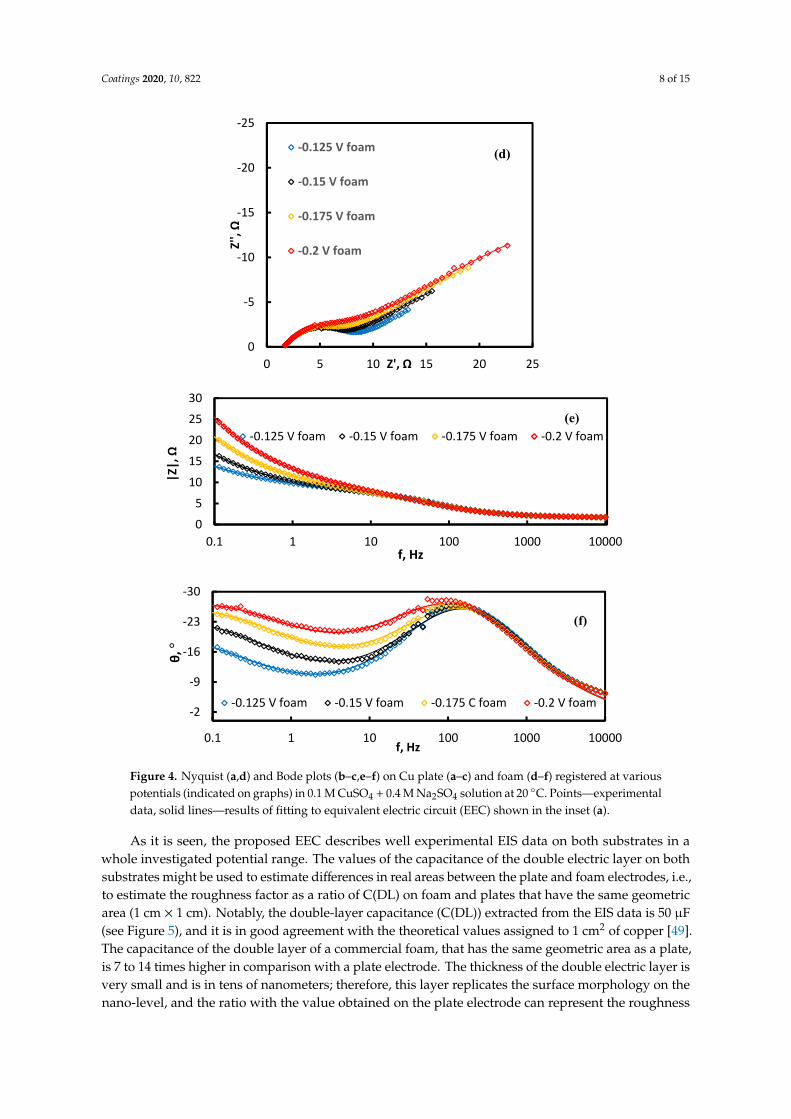
Figure 4. Nyquist (a,d) and Bode plots (b–c,e–f) on Cu plate (a–c) and foam (d–f) registered at various potentials (indicated on graphs) in 0.1 M CuSO4 + 0.4 M Na2SO4 solution at 20 °C. Points—experimental data, solid lines—results of fitting to equivalent electric circuit (EEC) shown in the inset (a).
As it is seen, the proposed EEC describes well experimental EIS data on both substrates in a whole investigated potential range. The values of the capacitance of the double electric layer on both substrates might be used to estimate differences in real areas between the plate and foam electrodes, i.e., to estimate the roughness factor as a ratio of C(DL) on foam and plates that have the same geometric area (1 cm × 1 cm). Notably, the double-layer capacitance (C(DL)) extracted from the EIS data is 50 µF (see Figure 5), and it is in good agreement with the theoretical values assigned to 1 cm² of copper [49]. The capacitance of the double layer of a commercial foam, that has the same geometric area as a plate, is 7 to 14 times higher in comparison with a plate electrode. The thickness of the double electric layer is very small and is in tens of nanometers; therefore, this layer replicates the surface morphology on the nano-level, and the ratio with the value obtained on the plate electrode can represent the roughness factor, and it matches the ratio of C(DL) of both surfaces –(C(DLfoam); C(DL
-25
-20
-15
-10
-5
00 5 10 15 20 25
Z'',
Ω
Z', Ω
-0.125 V foam
-0.15 V foam
-0.175 V foam
-0.2 V foam
05
1015202530
0.1 1 10 100 1000 10000
|Z|,
Ω
f, Hz
-0.125 V foam -0.15 V foam -0.175 V foam -0.2 V foam(e)
-30
-23
-16
-9
-2
0.1 1 10 100 1000 10000
θ, °
f, Hz
-0.125 V foam -0.15 V foam -0.175 C foam -0.2 V foam
(f)
(d)
Figure 4. Nyquist (a,d) and Bode plots (b–c,e–f) on Cu plate (a–c) and foam (d–f) registered at variouspotentials (indicated on graphs) in 0.1 M CuSO4 + 0.4 M Na2SO4 solution at 20 C. Points—experimentaldata, solid lines—results of fitting to equivalent electric circuit (EEC) shown in the inset (a).
As it is seen, the proposed EEC describes well experimental EIS data on both substrates in awhole investigated potential range. The values of the capacitance of the double electric layer on bothsubstrates might be used to estimate differences in real areas between the plate and foam electrodes, i.e.,to estimate the roughness factor as a ratio of C(DL) on foam and plates that have the same geometricarea (1 cm × 1 cm). Notably, the double-layer capacitance (C(DL)) extracted from the EIS data is 50 µF(see Figure 5), and it is in good agreement with the theoretical values assigned to 1 cm2 of copper [49].The capacitance of the double layer of a commercial foam, that has the same geometric area as a plate,is 7 to 14 times higher in comparison with a plate electrode. The thickness of the double electric layer isvery small and is in tens of nanometers; therefore, this layer replicates the surface morphology on thenano-level, and the ratio with the value obtained on the plate electrode can represent the roughness

Coatings 2020, 10, 822 9 of 15
factor, and it matches the ratio of C(DL) of both surfaces –(C(DLfoam); C(DL plate) is 7–14:1). However,the increase of double-layer capacitances with the increase of applied cathodic potential on both flatand porous surfaces is different. On the porous electrode, the C(DL) increase is much higher whencompared to the change in capacitances of the flat electrode. This increase is related to the much highersurface area, and the distribution of current on the surface of the foam. With higher potential, thecurrent distributes more evenly on the whole foam surface, and the edge effect is less apparent, whichalso influences the surface area estimations [51,52].
When looking at the effect that the concentration of copper ions has on the EIS parameters (Table 3),we can divide the results into three sections: high concentration (0.2 M), mid-level concentrations (0.1and 0.05 M), and low concentrations (0.01 M). The double electric layer (DL) capacitance values do notdiffer that much with the change of the concentration on both surface geometries. However, whenlooking at charge transfer resistance, the differences between concentrations are significant. At lowconcentrations, the charge transfer resistance is very high; this is caused by the lack of copper ions. Incontrast, this resistance at mid-level concentrations is around 6–9 Ω, which depends on the surfacegeometry as well as applied potential (Figure 5). At high concentrations (0.2 M and higher), the chargetransfer resistance values decrease approximately 3 times on both surfaces, because of an abundance ofconducting particles. Nevertheless, this charge transfer resistance is lower at all investigated potentialsand all concentrations on the foam electrode, showing that the reduction reaction occurs faster on thecopper foams.
When taking a look at the charge transfer resistance dependence on potential (Figure 5) with bothtypes of electrodes, it is clear that the 3D electrode displays approximately 1.5–1.7 times lower chargetransfer resistance than the 2D electrode, agreeing with the results of voltammetry (see Figure 2). Thedifferences in the charge transfer resistance on plate and foam electrodes are lower than the differencesin the capacitances of DL, because the reaction layer is thicker than the DL, and in some areas ofthe foam electrode, it overlaps. As it can be seen from Figure 5, the difference between 2D and 3Delectrodes in charge transfer resistance is higher at low potentials; thus, the charge transfer reaction onthe foam occurs easier, and it partially explains the higher Cu deposition rate (see Table 2). However,lowering the charge transfer resistance, or in turn, the increase of the rate of the charge transfer reactionby approximately 2 times, does not result in increases in the Cu deposition rate by approximately3 times.
Coatings 2020, 10, x FOR PEER REVIEW 9 of 15
plate) is 7–14:1). However, the increase of double-layer capacitances with the increase of applied cathodic potential on both flat and porous surfaces is different. On the porous electrode, the C(DL) increase is much higher when compared to the change in capacitances of the flat electrode. This increase is related to the much higher surface area, and the distribution of current on the surface of the foam. With higher potential, the current distributes more evenly on the whole foam surface, and the edge effect is less apparent, which also influences the surface area estimations [51,52].
When looking at the effect that the concentration of copper ions has on the EIS parameters (Table 3), we can divide the results into three sections: high concentration (0.2 M), mid-level concentrations (0.1 and 0.05 M), and low concentrations (0.01 M). The double electric layer (DL) capacitance values do not differ that much with the change of the concentration on both surface geometries. However, when looking at charge transfer resistance, the differences between concentrations are significant. At low concentrations, the charge transfer resistance is very high; this is caused by the lack of copper ions. In contrast, this resistance at mid-level concentrations is around 6–9 Ω, which depends on the surface geometry as well as applied potential (Figure 5). At high concentrations (0.2 M and higher), the charge transfer resistance values decrease approximately 3 times on both surfaces, because of an abundance of conducting particles. Nevertheless, this charge transfer resistance is lower at all investigated potentials and all concentrations on the foam electrode, showing that the reduction reaction occurs faster on the copper foams.
When taking a look at the charge transfer resistance dependence on potential (Figure 5) with both types of electrodes, it is clear that the 3D electrode displays approximately 1.5–1.7 times lower charge transfer resistance than the 2D electrode, agreeing with the results of voltammetry (see Figure 2). The differences in the charge transfer resistance on plate and foam electrodes are lower than the differences in the capacitances of DL, because the reaction layer is thicker than the DL, and in some areas of the foam electrode, it overlaps. As it can be seen from Figure 5, the difference between 2D and 3D electrodes in charge transfer resistance is higher at low potentials; thus, the charge transfer reaction on the foam occurs easier, and it partially explains the higher Cu deposition rate (see Table 2). However, lowering the charge transfer resistance, or in turn, the increase of the rate of the charge transfer reaction by approximately 2 times, does not result in increases in the Cu deposition rate by approximately 3 times.
Figure 5. Dependence of double-layer capacitance (ordinate at the right) and charge transfer resistance (ordinate at the left) on potential applied for Cu plate and foam electrodes in 0.1 M CuSO4 + 0.4 M Na2SO4 solution.
To further characterize the difference in copper deposition reactions on flat and porous copper surfaces, the components of EEC related to diffusion have been investigated in detail (Figure 6). The foam has lower charge transfer resistance, meaning faster reactions and better hydrodynamic qualities, allowing for faster diffusion and in turn the much faster deposition, even with a larger surface and in turn, lower current density.
5
6
7
8
9
10
11
0
150
300
450
600
750
-0.21 -0.17 -0.13
C(D
L), µ
F
R(C
T), Ω
E, V vs Ag/AgCl
C(DL) plateC(DL) foamR(CT) plate
Figure 5. Dependence of double-layer capacitance (ordinate at the right) and charge transfer resistance(ordinate at the left) on potential applied for Cu plate and foam electrodes in 0.1 M CuSO4 + 0.4 MNa2SO4 solution.
To further characterize the difference in copper deposition reactions on flat and porous coppersurfaces, the components of EEC related to diffusion have been investigated in detail (Figure 6). Thefoam has lower charge transfer resistance, meaning faster reactions and better hydrodynamic qualities,
Coatings 2020, 10, 822 10 of 15
allowing for faster diffusion and in turn the much faster deposition, even with a larger surface and inturn, lower current density.Coatings 2020, 10, x FOR PEER REVIEW 10 of 15
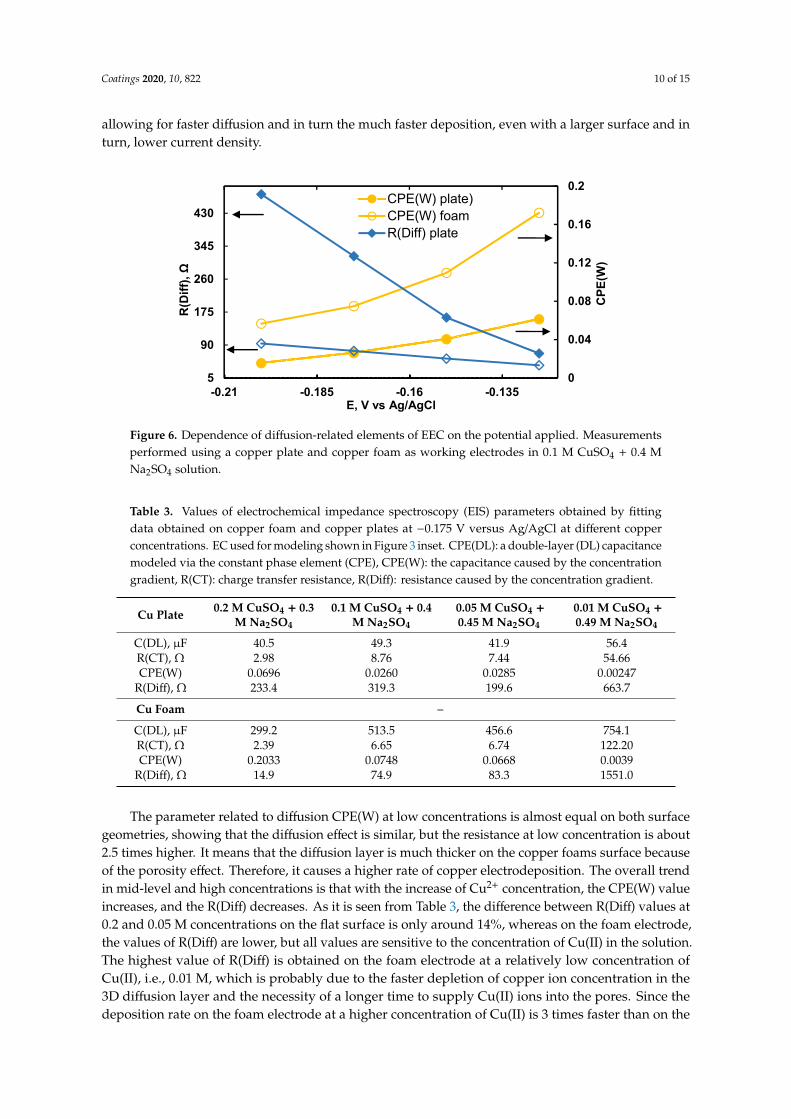
Figure 6. Dependence of diffusion-related elements of EEC on the potential applied. Measurements performed using a copper plate and copper foam as working electrodes in 0.1 M CuSO4 + 0.4 M Na2SO4 solution.
Table 3. Values of electrochemical impedance spectroscopy (EIS) parameters obtained by fitting data obtained on copper foam and copper plates at −0.175 V versus Ag/AgCl at different copper concentrations. EC used for modeling shown in Figure 3 inset. CPE(DL): a double-layer (DL) capacitance modeled via the constant phase element (CPE), CPE(W): the capacitance caused by the concentration gradient, R(CT): charge transfer resistance, R(Diff): resistance caused by the concentration gradient.
Cu Plate 0.2 M CuSO4 + 0.3 M Na2SO4
0.1 M CuSO4 + 0.4 M Na2SO4
0.05 M CuSO4 + 0.45 M Na2SO4
0.01 M CuSO4 + 0.49 M Na2SO4
C(DL), µF 40.5 49.3 41.9 56.4 R(CT), Ω 2.98 8.76 7.44 54.66 CPE(W) 0.0696 0.0260 0.0285 0.00247
R(Diff), Ω 233.4 319.3 199.6 663.7
Cu Foam –
C(DL), µF 299.2 513.5 456.6 754.1 R(CT), Ω 2.39 6.65 6.74 122.20 CPE(W) 0.2033 0.0748 0.0668 0.0039
R(Diff), Ω 14.9 74.9 83.3 1551.0
The parameter related to diffusion CPE(W) at low concentrations is almost equal on both surface geometries, showing that the diffusion effect is similar, but the resistance at low concentration is about 2.5 times higher. It means that the diffusion layer is much thicker on the copper foams surface because of the porosity effect. Therefore, it causes a higher rate of copper electrodeposition. The overall trend in mid-level and high concentrations is that with the increase of Cu2+ concentration, the CPE(W) value increases, and the R(Diff) decreases. As it is seen from Table 3, the difference between R(Diff) values at 0.2 and 0.05 M concentrations on the flat surface is only around 14%, whereas on the foam electrode, the values of R(Diff) are lower, but all values are sensitive to the concentration of Cu(II) in the solution. The highest value of R(Diff) is obtained on the foam electrode at a relatively low concentration of Cu(II), i.e., 0.01 M, which is probably due to the faster depletion of copper ion concentration in the 3D diffusion layer and the necessity of a longer time to supply Cu(II) ions into the pores. Since the deposition rate on the foam electrode at a higher concentration of Cu(II) is 3 times faster than on the flat electrode, this is mirrored by the behavior of CPE(W), showing that the diffusion occurs 3 times faster on the foam. The efficiency of charge transfer on the porous surfaces
5
90
175
260
345
430
0
0.04
0.08
0.12
0.16
0.2
-0.21 -0.185 -0.16 -0.135
CPE
(W)
R(D
iff),
Ω
E, V vs Ag/AgCl
CPE(W) plate)CPE(W) foamR(Diff) plate
Figure 6. Dependence of diffusion-related elements of EEC on the potential applied. Measurementsperformed using a copper plate and copper foam as working electrodes in 0.1 M CuSO4 + 0.4 MNa2SO4 solution.
Table 3. Values of electrochemical impedance spectroscopy (EIS) parameters obtained by fittingdata obtained on copper foam and copper plates at −0.175 V versus Ag/AgCl at different copperconcentrations. EC used for modeling shown in Figure 3 inset. CPE(DL): a double-layer (DL) capacitancemodeled via the constant phase element (CPE), CPE(W): the capacitance caused by the concentrationgradient, R(CT): charge transfer resistance, R(Diff): resistance caused by the concentration gradient.
Cu Plate 0.2 M CuSO4 + 0.3M Na2SO4
0.1 M CuSO4 + 0.4M Na2SO4
0.05 M CuSO4 +0.45 M Na2SO4
0.01 M CuSO4 +0.49 M Na2SO4
C(DL), µF 40.5 49.3 41.9 56.4R(CT), Ω 2.98 8.76 7.44 54.66CPE(W) 0.0696 0.0260 0.0285 0.00247
R(Diff), Ω 233.4 319.3 199.6 663.7
Cu Foam –
C(DL), µF 299.2 513.5 456.6 754.1R(CT), Ω 2.39 6.65 6.74 122.20CPE(W) 0.2033 0.0748 0.0668 0.0039
R(Diff), Ω 14.9 74.9 83.3 1551.0
The parameter related to diffusion CPE(W) at low concentrations is almost equal on both surfacegeometries, showing that the diffusion effect is similar, but the resistance at low concentration is about2.5 times higher. It means that the diffusion layer is much thicker on the copper foams surface becauseof the porosity effect. Therefore, it causes a higher rate of copper electrodeposition. The overall trendin mid-level and high concentrations is that with the increase of Cu2+ concentration, the CPE(W) valueincreases, and the R(Diff) decreases. As it is seen from Table 3, the difference between R(Diff) values at0.2 and 0.05 M concentrations on the flat surface is only around 14%, whereas on the foam electrode,the values of R(Diff) are lower, but all values are sensitive to the concentration of Cu(II) in the solution.The highest value of R(Diff) is obtained on the foam electrode at a relatively low concentration ofCu(II), i.e., 0.01 M, which is probably due to the faster depletion of copper ion concentration in the3D diffusion layer and the necessity of a longer time to supply Cu(II) ions into the pores. Since thedeposition rate on the foam electrode at a higher concentration of Cu(II) is 3 times faster than on the

Coatings 2020, 10, 822 11 of 15
flat electrode, this is mirrored by the behavior of CPE(W), showing that the diffusion occurs 3 timesfaster on the foam. The efficiency of charge transfer on the porous surfaces is higher as well, which isin good agreement with other studies of metal depositions on porous surfaces [31].
To even better understand the diffusion peculiarities on 2D and 3D electrodes, the diffusionimpedance using extracted values from total impedance data (presented in Table 4) was calculated.As it is shown in Figure 4, the copper deposition occurs under diffusion control at low frequencies(below 100 Hz) on both foam and plate electrodes, and diffusion is modeled by a parallel connection ofCPE(W) and R(Diff) elements (see Figure 4). In this case, diffusion impedance, Zdiff, as a function offrequency is calculated by the equation:
Zdi f f (ω) =RDi f f
1 + ( jω)αQRDi f f(1)
where Q and α are parameters of CPE(W), R(Diff) is resistance caused by diffusion, and ω is the phaseangle (ω = 2πf ). However, when α = 1 − Q is pure capacitance, in our case, α = 0.5, and the CPErepresents diffusion [53].
The calculated diffusion impedance data are presented in Figure 7. As it is seen, the diffusionimpedance on the plate Cu electrode is 2–4 times higher than that on the foam Cu electrodes, which isdependent on the frequency and potential applied.
Coatings 2020, 10, x FOR PEER REVIEW 11 of 15
is higher as well, which is in good agreement with other studies of metal depositions on porous surfaces [31].
To even better understand the diffusion peculiarities on 2D and 3D electrodes, the diffusion impedance using extracted values from total impedance data (presented in Table 4) was calculated. As it is shown in Figure 4, the copper deposition occurs under diffusion control at low frequencies (below 100 Hz) on both foam and plate electrodes, and diffusion is modeled by a parallel connection of CPE(W) and R(Diff) elements (see Figure 4). In this case, diffusion impedance, Zdiff, as a function of frequency is calculated by the equation:
( )( )1
Diffdiff
Diff
RZ
j QRαω =+ ω
(1)
where Q and α are parameters of CPE(W), R(Diff) is resistance caused by diffusion, and ω is the phase angle (ω = 2πf). However, when α = 1 − Q is pure capacitance, in our case, α = 0.5, and the CPE represents diffusion [53].
The calculated diffusion impedance data are presented in Figure 7. As it is seen, the diffusion impedance on the plate Cu electrode is 2–4 times higher than that on the foam Cu electrodes, which is dependent on the frequency and potential applied.
Figure 7. Bode plots of extracted diffusion impedance at various potentials on flat Cu substrate (a); and Cu foam substrate (b).
These results once again confirm the chronopotentiometric data obtained on both 2D and 3D Cu electrodes. For chronopotentiometry experiments, current values have been chosen higher than the limiting current values seen in Figure 8. In this case, the transition time at which the concentration of metal ions on the electrode becomes equal to zero is visual on the chronopotentiograms, and the effective diffusion coefficient can be calculated by the Sand equation:
0
2effnFAC D
iπ
τ = (2)
where τ is a transition time (s), i is a current (A), C0 is the concentration of Cu(II) ions (mol/cm3), Deff is the effective diffusion coefficient (cm2·s−1), F is Faraday’s constant, n is the number of electrons participating in the electrochemical reaction; and A is a geometrical surface area.
075
150225300375
0.001 0.01 0.1 1 10 100
|Z| di
ff, Ω
f, Hz
(a)-0.125 V-0.15 V-0.175 V-0.2 V
01530456075
0.001 0.01 0.1 1 10 100
|Z| di
f, Ω
f, Hz
(b)-0.125 V
-0.15 V
-0.175 V
-0.2 V
Figure 7. Bode plots of extracted diffusion impedance at various potentials on flat Cu substrate (a); andCu foam substrate (b).
These results once again confirm the chronopotentiometric data obtained on both 2D and 3D Cuelectrodes. For chronopotentiometry experiments, current values have been chosen higher than thelimiting current values seen in Figure 8. In this case, the transition time at which the concentrationof metal ions on the electrode becomes equal to zero is visual on the chronopotentiograms, and theeffective diffusion coefficient can be calculated by the Sand equation:
i√τ =
nFAC0√πDe f f
2(2)

Coatings 2020, 10, 822 12 of 15
where τ is a transition time (s), i is a current (A), C0 is the concentration of Cu(II) ions (mol/cm3), Deff
is the effective diffusion coefficient (cm2·s−1), F is Faraday’s constant, n is the number of electrons
participating in the electrochemical reaction; and A is a geometrical surface area.Coatings 2020, 10, x FOR PEER REVIEW 12 of 15
Figure 8. Chronopotentiograms on flat (continuous lines) and porous (dashed lines) electrodes at various current densities in 50 mM CuSO4 and 0.45 M Na2SO4 solution. All the densities have been calculated for the geometrical area of the substrate of 1 cm².
In our case 𝑖√~𝑐𝑜𝑛𝑠𝑡, so the maximal deposition rate is controlled by the mass transfer. The values of the effective diffusion coefficient of Cu2+ ions on both plate and foam Cu electrodes were calculated by Equation (2), and the data are shown in Table 4. The effective diffusion coefficient on the plate electrode is almost three times lower than on the foam electrode, and it is in good agreement with EIS data.
Table 4. Effects of electrode geometry on effective Cu(II) ions diffusion coefficient.
Applied Current Effective Diffusion Coefficient
Plate Foam I, mA 106 D, cm2·s−1 106 D, cm2·s−1
–10 6.79 18.06
–12 6.72 19.70
–14 6.73 20.16
–16 6.62 20.77
Average Deff 6.72 19.67
So, copper foams are great substrates for reactions that are either limited by the mass transfer (electrochemical depositions, etc.) or the ones that are restricted by adsorption or activation (HER and similar), making them great candidates to reduce the size of electrodes, but not to lose out on the efficiency and activity of electrodes.
4. Conclusions
A comprehensive investigation of the electrochemical deposition of copper onto 2D (plate) and 3D (foam) Cu substrates has been done. Using various electrochemical methods, it was determined that the rate-determining step in a copper deposition is diffusion. The main processes occurring on the electrode are the charge-up of double electric layer, charge transfer, and diffusion. The specific electrochemically active area of Cu foam was estimated from EIS data, and based on the values of the double electric layer, it was determined to be 7–14 times higher than that for the plate electrode. Based on the EIS data, it was determined that the charge transfer resistance on the Cu foam electrode is 1.5–1.7 times lower than that on the Cu plate electrode, which results in an increase in a charge transfer rate of approximately 2 times. Based on the analysis of the diffusion impedance and chronopotentiometry data, it was found that Cu2+ mass transfer and the copper deposition rate is up to 3 times faster on the foam surface in comparison with a flat surface having the same geometric area in the same potential range. In addition, effective diffusion coefficients have been calculated from
-1
-0.8
-0.6
-0.4
-0.2
00 5 10 15 20
E, V
vs
Ag/
AgC
l/KC
l
t, s
-16 mA-16 mA-14 mA-14 mA-12 mA-12 mA-10 mA
Figure 8. Chronopotentiograms on flat (continuous lines) and porous (dashed lines) electrodes atvarious current densities in 50 mM CuSO4 and 0.45 M Na2SO4 solution. All the densities have beencalculated for the geometrical area of the substrate of 1 cm2.
In our case i√τ ∼ const, so the maximal deposition rate is controlled by the mass transfer. The
values of the effective diffusion coefficient of Cu2+ ions on both plate and foam Cu electrodes werecalculated by Equation (2), and the data are shown in Table 4. The effective diffusion coefficient on theplate electrode is almost three times lower than on the foam electrode, and it is in good agreement withEIS data.
Table 4. Effects of electrode geometry on effective Cu(II) ions diffusion coefficient.
Applied Current Effective Diffusion Coefficient
Plate Foam
I, mA 106 D, cm2·s−1 106 D, cm2
·s−1
−10 6.79 18.06−12 6.72 19.70−14 6.73 20.16−16 6.62 20.77
Average Deff 6.72 19.67
So, copper foams are great substrates for reactions that are either limited by the mass transfer(electrochemical depositions, etc.) or the ones that are restricted by adsorption or activation (HERand similar), making them great candidates to reduce the size of electrodes, but not to lose out on theefficiency and activity of electrodes.
4. Conclusions
A comprehensive investigation of the electrochemical deposition of copper onto 2D (plate) and3D (foam) Cu substrates has been done. Using various electrochemical methods, it was determinedthat the rate-determining step in a copper deposition is diffusion. The main processes occurring onthe electrode are the charge-up of double electric layer, charge transfer, and diffusion. The specificelectrochemically active area of Cu foam was estimated from EIS data, and based on the values of thedouble electric layer, it was determined to be 7–14 times higher than that for the plate electrode. Basedon the EIS data, it was determined that the charge transfer resistance on the Cu foam electrode is 1.5–1.7times lower than that on the Cu plate electrode, which results in an increase in a charge transfer rate of

Coatings 2020, 10, 822 13 of 15
approximately 2 times. Based on the analysis of the diffusion impedance and chronopotentiometrydata, it was found that Cu2+ mass transfer and the copper deposition rate is up to 3 times faster on thefoam surface in comparison with a flat surface having the same geometric area in the same potentialrange. In addition, effective diffusion coefficients have been calculated from chronopotentiometry datausing Sand’s equation. These findings make Cu foam an attractive material for metal electrowinningprocesses as well as for processes controlled by adsorption (e.g., hydrogen evolution reaction).
Author Contributions: Investigation, M.V. and N.T.; methodology, M.V. and H.C.; supervision, H.C. and N.T.;visualization, M.V.; writing—original draft preparation, M.V.; writing—review and editing, M.V., H.C. and N.T.All authors have read and agreed to the published version of the manuscript.
Funding: This work was funded by the Lithuanian Business Support Agency (LVPA); project J05-LVPA-K-01-0022.
Conflicts of Interest: The authors declare no conflict of interest.
References
1. Liu, X.; Tanaka, M.; Matsui, Y. Generation amount prediction and material flow analysis of electronic waste:A case study in Beijing, China. Waste Manag. Res. 2006, 24, 434–445. [CrossRef] [PubMed]
2. Jain, A.; Sareen, R. E-waste assessment methodology and validation in India. J. Mater. Cycles Waste Manag.2006, 8, 40–45. [CrossRef]
3. Eurostat, Statistics Explained. Available online: https://ec.europa.eu/eurostat/statistics-explained/index.php/
Waste_statistics_-_electrical_and_electronic_equipment (accessed on 7 August 2020).4. Vegliò, F.; Quaresima, R.; Fornari, P.; Ubaldini, S. Recovery of valuable metals from electronic and galvanic
industrial wastes by leaching and electrowinning. Waste Manag. 2003, 23, 245–252. [CrossRef]5. Grimshaw, P.; Calo, J.M.; Hradil, G. Cyclic electrowinning/precipitation (CEP) system for the removal of
heavy metal mixtures from aqueous solutions. Chem. Eng. J. 2011, 175, 103–109. [CrossRef] [PubMed]6. Bertuol, D.A.; Amado, F.D.R.; Veit, H.; Ferreira, J.Z.; Bernardes, A.M. Recovery of nickel and cobalt from
spent nimh batteries by electrowinning. Chem. Eng. Technol. 2012, 35, 2084–2092. [CrossRef]7. Kim, J.H.; Kim, R.H.; Kwon, H.S. Preparation of copper foam with 3-dimensionally interconnected spherical
pore network by electrodeposition. Electrochem. Commun. 2008, 10, 1148–1151. [CrossRef]8. Niu, J.; Liu, X.; Xia, K.; Xu, L.; Xu, Y.; Fang, X.; Lu, W. Effect of electrodeposition parameters on the
morphology of three-dimensional porous copper foams. Int. J. Electrochem. Sci. 2015, 10, 7331–7340.9. Shahbazi, P.; Kiani, A. Fabricated Cu2O porous foam using electrodeposition and thermal oxidation as a
photocatalyst under visible light toward hydrogen evolution from water. Int. J. Hydrogen Energy 2016, 41,17247–17256. [CrossRef]
10. Shin, H.C.; Dong, J.; Liu, M. Nanoporous structures prepared by an electrochemical deposition process.Adv. Mater. 2003, 15, 1610–1614. [CrossRef]
11. Zhang, W.; Ding, C.; Wang, A.; Zeng, Y. 3-D Network pore structures in copper foams by electrodepositionand hydrogen bubble templating mechanism. J. Electrochem. Soc. 2015, 162, D365–D370. [CrossRef]
12. Nam, D.; Kim, R.; Han, D.; Kim, J.; Kwon, H. Effects of (NH4)2SO4 and BTA on the nanostructure of copperfoam prepared by electrodeposition. Electrochim. Acta 2011, 56, 9397–9405. [CrossRef]
13. Li, D.; Podlaha, E.J. Template-assisted electrodeposition of porous Fe–Ni–Co nanowires with vigoroushydrogen evolution. Nano Lett. 2019, 19, 3569–3574. [CrossRef] [PubMed]
14. Raoof, J.B.; Ojani, R.; Kiani, A.; Rashid-Nadimi, S. Fabrication of highly porous Pt coated nanostructuredCu-foam modified copper electrode and its enhanced catalytic ability for hydrogen evolution reaction. Int. J.Hydrogen Energy 2010, 35, 452–458. [CrossRef]
15. Luo, Z.-H.; Feng, M.; Lu, H.; Kong, X.-X.; Cao, G.-P. Nitrile butadiene rubber hydrogenation over a monolithicPd/CNTs@Nickel foam catalysts: Tunable CNTs morphology effect on catalytic performance. Ind. Eng.Chem. Res. 2019, 58, 1812–1822. [CrossRef]
16. Ashby, M.F.; Evans, A.; Fleck, N.A.; Gibson, L.J.; Hutchinson, J.W.; Wadley, H.N. Metal foams: A designguide. Mater. Des. 2002, 23, 119. [CrossRef]
17. Abdel-karim, R.; El-raghy, S. Electrochemical Deposition of Nanoporous Metallic Foams for EnergyApplications. pp. 69–91. Available online: http://www.onecentralpress.com/wp-content/uploads/2017/
08/Chapter-4-AMA-.pdf (accessed on 22 August 2020).

Coatings 2020, 10, 822 14 of 15
18. Eugénio, S.; Demirci, U.B.; Silva, T.M.; Carmezim, M.J.; Montemor, M.F. Copper-cobalt foams as active andstable catalysts for hydrogen release by hydrolysis of sodium borohydride. Int. J. Hydrogen Energy 2016, 41,8438–8448. [CrossRef]
19. Liu, W.; Hu, E.; Jiang, H.; Xiang, Y.; Weng, Z.; Li, M.; Fan, Q.; Yu, X.; Altman, E.I.; Wang, H. A highly activeand stable hydrogen evolution catalyst based on pyrite-structured cobalt phosphosulfide. Nat. Commun.2016, 7, 10771. [CrossRef]
20. Lange, G.A.; Eugénio, S.; Duarte, R.G.; Silva, T.M.; Carmezim, M.J.; Montemor, M.F. Characterisationand electrochemical behaviour of electrodeposited Cu–Fe foams applied as pseudocapacitor electrodes.J. Electroanal. Chem. 2015, 737, 85–92. [CrossRef]
21. Murakami, T.; Akagi, T.; Kasai, E. Development of porous iron based material by slag foaming and itsreduction. Procedia Mater. Sci. 2014, 4, 30–35. [CrossRef]
22. Kelpšaite, I.; Baltrušaitis, J.; Valatka, E. Electrochemical deposition of porous cobalt oxide films on AISI 304type steel. Medziagotyra 2011, 17, 236–243.
23. Mattarozzi, L.; Cattarin, S.; Comisso, N.; Gerbasi, R.; Guerriero, P.; Musiani, M.; Vazquez-Gomez, L.;Verlato, E. Electrodeposition of Cu-Ni alloy electrodes with bimodal porosity and their use for nitratereduction. ECS Electrochem. Lett. 2013, 2, D58–D60. [CrossRef]
24. Rehman, T.U.; Ali, H.M.; Saieed, A.; Pao, W.; Ali, M. Copper foam/PCMs based heat sinks: An experimentalstudy for electronic cooling systems. Int. J. Heat Mass Transf. 2018, 127, 381–393. [CrossRef]
25. Zhao, J.; Zou, X.; Sun, P.; Cui, G. Three-dimensional Bi-continuous nanoporous Gold/Nickel foam supportedMnO2 for high performance supercapacitors. Sci. Rep. 2017, 7, 1–8. [CrossRef] [PubMed]
26. Liu, Y.; Hangarter, C.M.; Garcia, D.; Moffat, T.P. Self-terminating electrodeposition of ultrathin Pt films on Ni:An active, low-cost electrode for H2 production. Surf. Sci. 2015, 631, 141–154. [CrossRef]
27. Vainoris, M.; Tsyntsaru, N.; Cesiulis, H. Modified electrodeposited cobalt foam coatings as sensors fordetection of free chlorine in water. Coatings 2019, 9, 306. [CrossRef]
28. Ma, S.; Zhou, H.C. Gas storage in porous metal-organic frameworks for clean energy applications.Chem. Commun. 2010, 46, 44–53. [CrossRef] [PubMed]
29. Karimi Shervedani, R.; Lasia, A. Evaluation of the surface roughness of microporous Ni–Zn–P electrodes byin situ methods. J. Appl. Electrochem. 1999, 29, 979–986. [CrossRef]
30. Popov, K.I.; Nikolic, N.D.; Živkovic, P.M.; Brankovic, G. The effect of the electrode surface roughness at lowlevel of coarseness on the polarization characteristics of electrochemical processes. Electrochim. Acta 2010, 55,1919–1925. [CrossRef]
31. Miranda-Hernández, M.; González, I.; Batina, N. Silver electrocrystallization onto carbon electrodes withdifferent surface morphology: Active sites vs surface features. J. Phys. Chem. B 2001, 105, 4214–4223.[CrossRef]
32. Menshykau, D.; Streeter, I.; Compton, R.G. Influence of electrode roughness on cyclic voltammetry. J. Phys.Chem. C 2008, 112, 14428–14438. [CrossRef]
33. Kostevšek, N.; Rožman, K.Ž.; Pecko, D.; Pihlar, B.; Kobe, S. 33NN A comparative study of the electrochemicaldeposition kinetics of iron-palladium alloys on a flat electrode and in a porous alumina template.Electrochim. Acta 2014, 125, 320–329. [CrossRef]
34. Gira, M.J.; Tkacz, K.P.; Hampton, J.R. Physical and electrochemical area determination of electrodepositedNi, Co, and NiCo thin films. Nano Converg. 2015, 3, 6. [CrossRef] [PubMed]
35. Zankowski, S.P.; Vereecken, P.M. Electrochemical determination of porosity and surface area of thin films ofinterconnected nickel nanowires. J. Electrochem. Soc. 2019, 166, D227–D235. [CrossRef]
36. Tadros, T.F.; Lyklema, J. Adsorption of potential—determining ions at the silica—aqueous electrolyte interfaceand the role of some cations. J. Electroanal. Chem. Interf. Electrochem. 1968, 17, 267–275. [CrossRef]
37. Schneider, I.A.; Kramer, D.; Wokaun, A.; Scherer, G.G. Effect of inert gas flow on hydrogen underpotentialdeposition measurements in polymer electrolyte fuel cells. Electrochem. Commun. 2007, 9, 1607–1612.[CrossRef]
38. Green, C.L.; Kucernak, A. Determination of the platinum and ruthenium surface areas in platinum-rutheniumalloy electrocatalysts by underpotential deposition of Copper. I. Unsupported catalysts. J. Phys. Chem. B2002, 106, 1036–1047. [CrossRef]

Coatings 2020, 10, 822 15 of 15
39. Yamaguchi, R.; Kurosu, S.; Suzuki, M. Hydroxyl radical generation by zero-valent iron/Cu (ZVI/Cu) bimetalliccatalyst in wastewater treatment: Heterogeneous Fenton/Fenton-like reactions by Fenton reagents formedin-situ under oxic conditions. Chem. Eng. J. 2018, 334, 1537–1549. [CrossRef]
40. Macht, F.; Eusterhues, K.; Pronk, G.J.; Totsche, K.U. Specific surface area of clay minerals: Comparisonbetween atomic force microscopy measurements and bulk-gas (N2) and -liquid (EGME) adsorption methods.Appl. Clay Sci. 2011, 53, 20–26. [CrossRef]
41. Sharifi-Viand, A.; Mahjani, M.G.; Jafarian, M. Determination of fractal rough surface of polypyrrole film:AFM and electrochemical analysis. Synth. Met. 2014, 191, 104–112. [CrossRef]
42. Wongmanerod, C.; Zangooie, S.; Arwin, H. Determination of pore size distribution and surface area of thinporous silicon layers by spectroscopic ellipsometry. Appl. Surf. Sci. 2001, 172, 117–125. [CrossRef]
43. Damian, A.; Omanovic, S. Ni and Nisingle bondMo hydrogen evolution electrocatalysts electrodepositedin a polyaniline matrix. J. Power Sources 2006, 158, 464–476. [CrossRef]
44. Kandalkar, S.G.; Lee, H.M.; Chae, H.; Kim, C.K. Structural, morphological, and electrical characteristics ofthe electrodeposited cobalt oxide electrode for supercapacitor applications. Mater. Res. Bull. 2011, 46, 48–51.[CrossRef]
45. Song, H.; Song, H.; Jung, Y.; Jung, Y.; Lee, K.; Lee, K.; Dao, L.H.; Dao, L.H. Electrochemical impedancespectroscopy of porous electrodes: The effect of pore size distribution. Electrochim. Acta 1999, 44, 3513–3519.[CrossRef]
46. Ogihara, N.; Itou, Y.; Sasaki, T.; Takeuchi, Y. Impedance spectroscopy characterization of porous electrodesunder different electrode thickness using a symmetric cell for high-performance lithium-ion batteries. J. Phys.Chem. C 2015, 119, 4612–4619. [CrossRef]
47. Yan, B.; Li, M.; Li, X.; Bai, Z.; Dong, L.; Li, D. Electrochemical impedance spectroscopy illuminatingperformance evolution of porous core-shell structured nickel/nickel oxide anode materials. Electrochim. Acta2015, 164, 55–61. [CrossRef]
48. Kaufmann, B.Y.K. Transfer function simulation for electrochemical impedance spectroscopy (EIS).Rev. Colomb. Fis. 2005, 37, 25–27.
49. Mahato, N.; Singh, M.M. Investigation of passive film properties and pitting resistance of AISI 316in aqueous ethanoic acid containing chloride ions using electrochemical impedance spectroscopy(EIS).Port. Electrochim. Acta 2011, 29, 233–251. [CrossRef]
50. Hsu, C.H.; Mansfeld, F. concerning the conversion of the constant phase element parameter Y0 into acapacitance. Corrosion 2001, 57, 747–748. [CrossRef]
51. Krzewska, S. Impedance investigation of the mechanism of copper electrodeposition from acidic perchlorateelectrolyte. Electrochim. Acta 1997, 42, 3531–3540. [CrossRef]
52. Halsey, T.C. Frequency dependence of the double-layer impedance at a rough surface. Phys. Rev. A 1987, 35,3512–3521. [CrossRef]
53. Hirschorn, B.; Orazem, M.E.; Tribollet, B.; Vivier, V.; Frateur, I.; Musiani, M. Determination of effectivecapacitance and film thickness from constant-phase-element parameters. Electrochim. Acta 2010, 55, 6218–6227.[CrossRef]
© 2020 by the authors. Licensee MDPI, Basel, Switzerland. This article is an open accessarticle distributed under the terms and conditions of the Creative Commons Attribution(CC BY) license (http://creativecommons.org/licenses/by/4.0/).