stability characteristics of pt1ni1/c as cathode catalysts ...heeman/paper/stability... ·...
TRANSCRIPT
Sa
YYa
b
c
d
a
ARRAA
KP(PXeC
1
(tcdtaNafdFiPi
0d
Electrochimica Acta 59 (2012) 264– 269
Contents lists available at SciVerse ScienceDirect
Electrochimica Acta
j ourna l ho me pag e: www.elsev ier .com/ locate /e lec tac ta
tability characteristics of Pt1Ni1/C as cathode catalysts in membrane electrodessembly of polymer electrolyte membrane fuel cell
ong-Hun Choa, Tae-Yeol Jeonb, Sung Jong Yooc, Kug-Seung Leec, Minjeh Ahnb, Ok-Hee Kimb,oon-Hwan Chob, Ju Wan Limb, Namgee Jungb, Won-Sub Yoond, Heeman Choea, Yung-Eun Sungb,∗,1
School of Advanced Materials Engineering, Kookmin University, Seoul 136-702, South KoreaSchool of Chemical and Biological Engineering, College of Engineering, Seoul National University (SNU), Seoul, South KoreaCenter for Fuel Cell Research, Korea Institute of Science and Technology, Seoul 136-791, South KoreaDepartment of Energy Science, Sungkyunkwan University, Suwon 440-746, South Korea
r t i c l e i n f o
rticle history:eceived 6 July 2011eceived in revised form 19 October 2011ccepted 21 October 2011vailable online 29 October 2011
a b s t r a c t
To understand the difference in degradation characteristics between carbon-supported platinum (Pt/C)and platinum–nickel alloy (Pt1Ni1/C) cathode catalysts in membrane electrode assemblies (MEAs) of apolymer electrolyte membrane fuel cell (PEMFC), constant current operation of MEA in a single cell wasconducted for 1100 h. A significant change in cell potential for the Pt1Ni1/C MEA was observed throughoutthe test. High-resolution transmission electron microscopy showed that sintering and detachment ofmetal particles in the Pt1Ni1/C catalyst occurred more sparingly than in the Pt/C catalyst. Instead, X-ray
eywords:olymer electrolyte membrane fuel cellPEMFC)latinum–nickel alloy-ray photoelectron spectroscopy (XPS)lement mappingonstant current operation
photoelectron spectroscopy element mapping revealed dissolution of Ni atoms in the Pt1Ni1 catalystseven when the Pt1Ni1/C catalyst used in the MEA was well synthesized.
© 2011 Elsevier Ltd. All rights reserved.
. Introduction
Studies on the lifespan of membrane electrode assembliesMEAs) have been conducted extensively over the past decade forhe purpose of polymer electrolyte membrane fuel cell (PEMFC)ommercialization. From prior investigations, it is obvious thatecay of MEA cathode catalysts is one of the most crucial factors inhe life expectancy of the PEMFC [1–3]. Use of carbon-supported Ptlloy (Pt alloy/C) in conjunction with transition metals such as Co,i, and Fe as cathode catalysts in PEMFCs reduces Pt consumptionnd increases the oxygen reduction reaction (ORR) activity. There-ore, minimizing the degradation of MEA performance caused byeactivation of the Pt alloy is necessary for commercializing PEM-
Cs [4,5]. The half-cell test and accelerated durability test (ADT) aremportant for evaluating the electrochemical catalyst performance.revious studies on catalyst degradation have been based primar-ly on the half-cell test and on ADTs such as load cycling, start/stop∗ Corresponding author. Tel.: +82 2 880 1889; fax: +82 2 888 1604.E-mail address: [email protected] (Y.-E. Sung).
1 International Society of Electrochemistry member.
013-4686/$ – see front matter © 2011 Elsevier Ltd. All rights reserved.oi:10.1016/j.electacta.2011.10.060
cycling, and RH cycling [6,7]. Those studies examined the effectof Pt alloy/C on the degradation of PEMFC performance, but theyprovided inconsistent results [8–12]. Those inconsistencies mayresult from the different operating conditions of each durabilitytest. Nevertheless, it is widely accepted that Pt alloy/C catalystsare electrochemically unstable compared to carbon-supported Pt(Pt/C) catalysts under half-cell and ADT conditions. From a practi-cal standpoint, the MEA test is the ultimate evaluation criterion forcharacterization of catalysts [13–15]. Investigations of the durabil-ity of catalysts in MEAs are more complex and difficult than thosein half-cells because the temperature, pressure, and gas flow condi-tions play pivotal roles in determining accurate MEA performance.Generally, constant current test has been recognized as traditionaldurability test mode. In this paper, to overcome prior limitations,catalyst-coated membranes (CCM) used as MEAs were fabricatedusing Pt/C or Pt1Ni1/C as cathode catalysts, and they were operatedfor 1100 h in constant current mode using a single cell. A compar-ison is reported between the performance degradation behaviorsof MEAs containing Pt/C or Pt1Ni1/C as cathode catalysts. In addi-
tion, X-ray photoelectron spectroscopy element mapping was usedto characterize degradation of the catalyst layer over a wide area(above 0.78 mm2); this is a novel approach for analyzing degrada-tion of the catalyst layer in a PEMFC. The unique transition of cell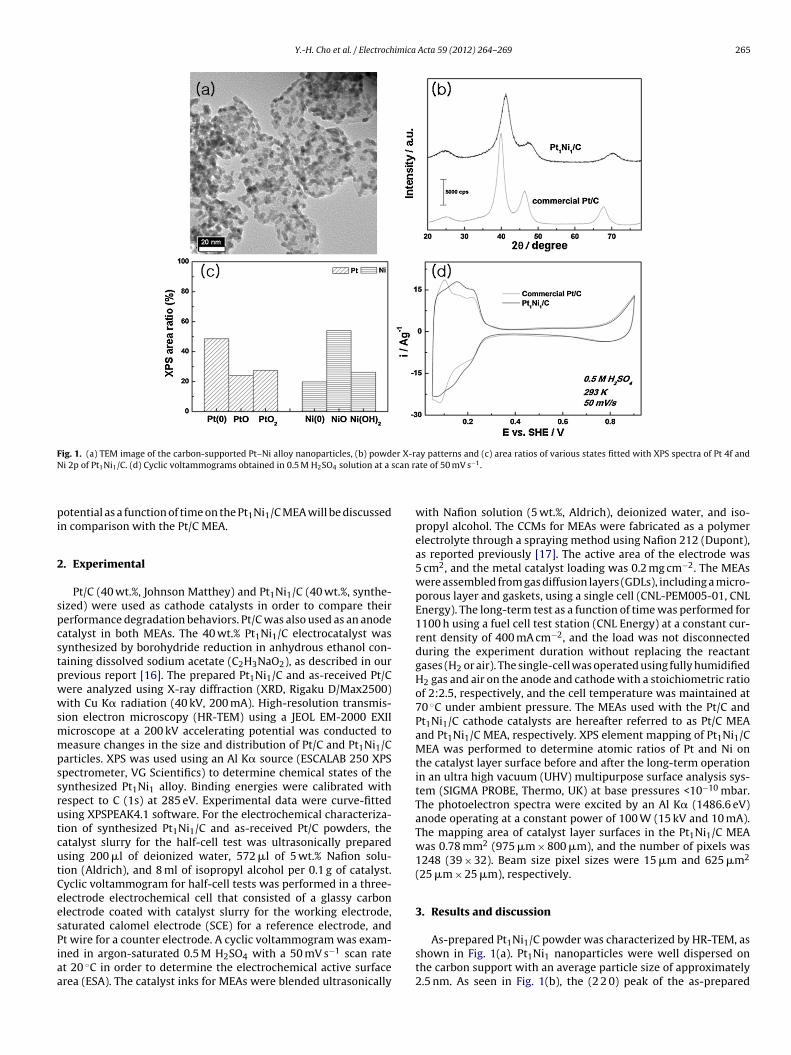
Y.-H. Cho et al. / Electrochimica Acta 59 (2012) 264– 269 265
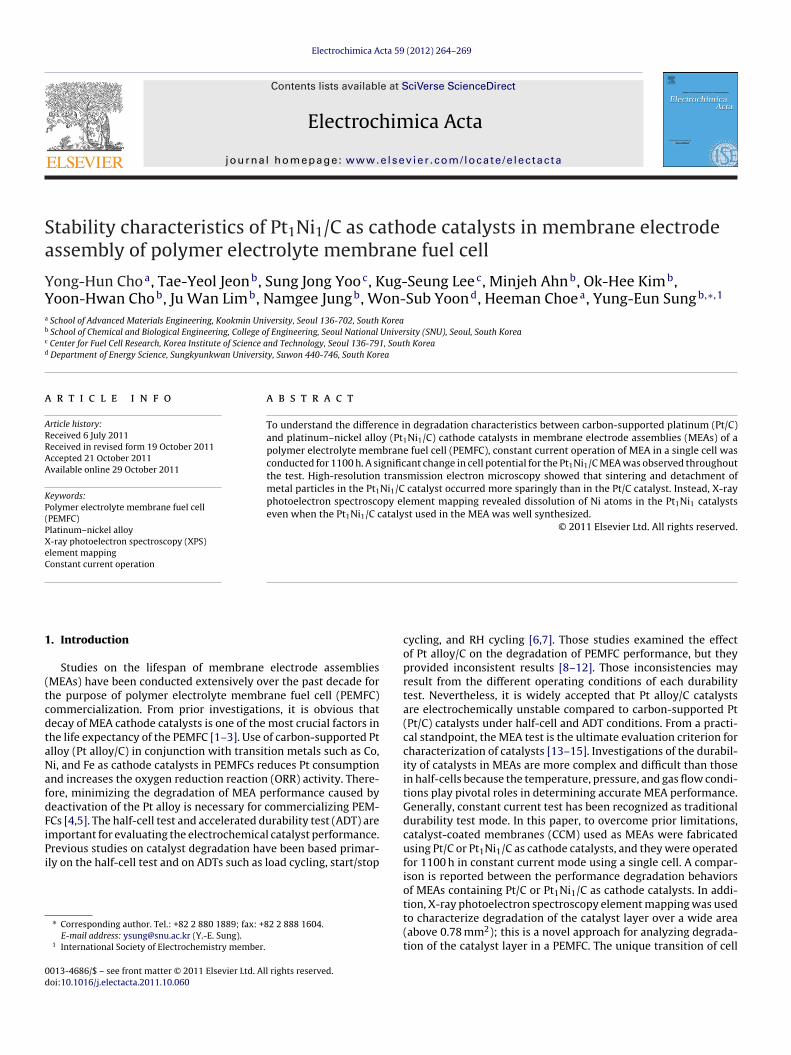
Fig. 1. (a) TEM image of the carbon-supported Pt–Ni alloy nanoparticles, (b) powder X-ray patterns and (c) area ratios of various states fitted with XPS spectra of Pt 4f andN scan r
pi
2
spcstpwwsmmpssrutcutCeesPiaa
i 2p of Pt1Ni1/C. (d) Cyclic voltammograms obtained in 0.5 M H2SO4 solution at a
otential as a function of time on the Pt1Ni1/C MEA will be discussedn comparison with the Pt/C MEA.
. Experimental
Pt/C (40 wt.%, Johnson Matthey) and Pt1Ni1/C (40 wt.%, synthe-ized) were used as cathode catalysts in order to compare theirerformance degradation behaviors. Pt/C was also used as an anodeatalyst in both MEAs. The 40 wt.% Pt1Ni1/C electrocatalyst wasynthesized by borohydride reduction in anhydrous ethanol con-aining dissolved sodium acetate (C2H3NaO2), as described in ourrevious report [16]. The prepared Pt1Ni1/C and as-received Pt/Cere analyzed using X-ray diffraction (XRD, Rigaku D/Max2500)ith Cu K� radiation (40 kV, 200 mA). High-resolution transmis-
ion electron microscopy (HR-TEM) using a JEOL EM-2000 EXIIicroscope at a 200 kV accelerating potential was conducted toeasure changes in the size and distribution of Pt/C and Pt1Ni1/C
articles. XPS was used using an Al K� source (ESCALAB 250 XPSpectrometer, VG Scientifics) to determine chemical states of theynthesized Pt1Ni1 alloy. Binding energies were calibrated withespect to C (1s) at 285 eV. Experimental data were curve-fittedsing XPSPEAK4.1 software. For the electrochemical characteriza-ion of synthesized Pt1Ni1/C and as-received Pt/C powders, theatalyst slurry for the half-cell test was ultrasonically preparedsing 200 �l of deionized water, 572 �l of 5 wt.% Nafion solu-ion (Aldrich), and 8 ml of isopropyl alcohol per 0.1 g of catalyst.yclic voltammogram for half-cell tests was performed in a three-lectrode electrochemical cell that consisted of a glassy carbonlectrode coated with catalyst slurry for the working electrode,aturated calomel electrode (SCE) for a reference electrode, and
t wire for a counter electrode. A cyclic voltammogram was exam-ned in argon-saturated 0.5 M H2SO4 with a 50 mV s−1 scan ratet 20 ◦C in order to determine the electrochemical active surfacerea (ESA). The catalyst inks for MEAs were blended ultrasonicallyate of 50 mV s−1.
with Nafion solution (5 wt.%, Aldrich), deionized water, and iso-propyl alcohol. The CCMs for MEAs were fabricated as a polymerelectrolyte through a spraying method using Nafion 212 (Dupont),as reported previously [17]. The active area of the electrode was5 cm2, and the metal catalyst loading was 0.2 mg cm−2. The MEAswere assembled from gas diffusion layers (GDLs), including a micro-porous layer and gaskets, using a single cell (CNL-PEM005-01, CNLEnergy). The long-term test as a function of time was performed for1100 h using a fuel cell test station (CNL Energy) at a constant cur-rent density of 400 mA cm−2, and the load was not disconnectedduring the experiment duration without replacing the reactantgases (H2 or air). The single-cell was operated using fully humidifiedH2 gas and air on the anode and cathode with a stoichiometric ratioof 2:2.5, respectively, and the cell temperature was maintained at70 ◦C under ambient pressure. The MEAs used with the Pt/C andPt1Ni1/C cathode catalysts are hereafter referred to as Pt/C MEAand Pt1Ni1/C MEA, respectively. XPS element mapping of Pt1Ni1/CMEA was performed to determine atomic ratios of Pt and Ni onthe catalyst layer surface before and after the long-term operationin an ultra high vacuum (UHV) multipurpose surface analysis sys-tem (SIGMA PROBE, Thermo, UK) at base pressures <10−10 mbar.The photoelectron spectra were excited by an Al K� (1486.6 eV)anode operating at a constant power of 100 W (15 kV and 10 mA).The mapping area of catalyst layer surfaces in the Pt1Ni1/C MEAwas 0.78 mm2 (975 �m × 800 �m), and the number of pixels was1248 (39 × 32). Beam size pixel sizes were 15 �m and 625 �m2
(25 �m × 25 �m), respectively.
3. Results and discussion
As-prepared Pt1Ni1/C powder was characterized by HR-TEM, asshown in Fig. 1(a). Pt1Ni1 nanoparticles were well dispersed onthe carbon support with an average particle size of approximately2.5 nm. As seen in Fig. 1(b), the (2 2 0) peak of the as-prepared
266 Y.-H. Cho et al. / Electrochimica
Fig. 2. Cell potentials of the single cell with (a) Pt/C and (b) Pt1Ni1/C MEAs as afunction of time on load operated at constant current of 400 mA cm−2 for 1100 h.
Pta(TrmiiaaP(tatw
P(afit0o
butions of Pt/C and Pt Ni /C before and after the long-term test.
t1Ni1/C (70.6◦) shifted to a higher angle compared to that ofhe commercial Pt/C (67.7◦), which suggests that Pt1Ni1 was welllloyed. The degree of alloying for Pt1Ni1 was calculated using the2 2 0) peak position according to Vegard’s law, yielding 69% [18].his degree of alloying is relatively high compared with previouslyeported results [19]. Fig. 1(c) shows the ratio of the Pt and Nietallic phases to oxides. The ratio of Pt and Ni metallic phases
s higher than that in a previous study [20]. As the alloying levelncreases, the resulting alloy approaches toward homogeneouslloying of Pt and Ni without Ni-loss or unalloyed Ni phases suchs NiO and Ni(OH)2, as seen in Fig. 1(c). The ESA of the as-preparedt1Ni1/C (28.2 m2/gPt–Ni) was larger than that of commercial Pt/C24.4 m2/gPt) due to an increase in the surface/volume ratio andhe relatively small particle size for the Pt–Ni alloy nanoparticles,s shown in Fig. 1(d). Consequently, all data shown in Fig. 1 led tohe conclusion that the as-prepared Pt1Ni1/C was well synthesizedith a high degree of alloying.
Fig. 2 shows performance degradation trends of (a) Pt/C and (b)t1Ni1/C as cathode catalysts in MEAs during long-term operation1100 h). For the Pt/C MEA (Fig. 2(a)), cell potential was initiallypproximately 0.69 V and decreased to approximately 0.45 V in thenal stage of the long-term test (1100 h). For Pt Ni /C (Fig. 2(b)),
1 1he initial cell potential of 0.67 V decreased to a final potential of.35 V. In other words, the Pt/C MEA showed the performance decayf approximately 35%, whereas the performance of the Pt1Ni1/CActa 59 (2012) 264– 269
MEA declined by roughly 48% at a constant operating current of400 mA cm−2, which indicates that Pt1Ni1/C is less electrochemi-cally stable than the Pt/C catalyst. As shown in Fig. 2, the initialcell potential of the Pt1Ni1/C MEA was slightly lower than thatof the Pt/C MEA. We think that comparing the durability of Pt/Cand Pt1Ni1/C MEA would be worth although the composition ofionomer and solvent in catalyst ink and the annealing conditionof synthesized catalysts were not optimized. Fig. 2 shows thatthe performances of both Pt/C MEA and Pt1Ni1/C MEA drasticallydecreased during the initial 300 h. After 300 h of operation, the cellpotential peak for the Pt/C MEA repeated itself at rest times dur-ing the replacement of gases until the end of the long-term test,whereas the performance of the Pt1Ni1/C MEA remained steadyfrom 300 h to 700 h and then continuously declined until 1100 h.Pivovar and co-workers [21] demonstrated that the performancedecay could be classified as recoverable or unrecoverable. Theunrecoverable values could be attributed to irreversible changesin MEA compositions such as the loss of electrochemical surfacearea and decrease of ionic conductivity in the membrane and cat-alyst layer. Conversely, the recoverable values could be relatedto reversible changes in the MEA such as partial flooding, plat-inum surface oxidation, and catalyst poison by impurities. The cellpotential recovery for the Pt/C MEA at approximately 300 h sug-gests that severe unrecoverable degradation of Pt/C did not occurafter 300 h and that subsequent performance was subsequentlymaintained. This also suggests that the potential of the Pt/C MEAdeclined owing to recoverable properties after 300 h. In contrast,continuously declining cell potential with unrecoverable perfor-mance decay was observed for the Pt1Ni1/C MEA after 700 h, whichindicates that irreversible destruction of Pt1Ni1/C continued overtime. In addition, the Pt1Ni1/C MEA experienced larger fluctuationsin cell potential than the Pt/C MEA over the entire test period,as shown in Fig. 2(b). This result indicates that Pt1Ni1/C used asthe cathode catalyst in MEA is less electrochemically stable thanthe Pt/C catalyst and causes continuous degradation of the MEAinduced by deactivation of the alloy catalyst, which manifests asunrecoverable catalyst degradation. On the other hand, recoveredperformance of Pt/C MEA and Pt1Ni1/C MEA during the durabil-ity test period might be caused by removing accumulated waterand impurities in the catalyst layer owing to shut-down and re-start procedure. Fig. 3(a and c) shows HR-TEM images of Pt/C andPt1Ni1/C from the MEAs before the long-term operation. The meanparticle sizes of Pt and Pt1Ni1 were 4.0 and 2.7 nm, respectively,as measured from HR-TEM images. Further, the metal particles inboth the MEAs were highly dispersed on the carbon supports. How-ever, some Pt and PtNi nanoparticles agglomerated near junctionsamong the primary carbon particles, whereas certain areas on thesurfaces of carbon supports had no metal particles. These defectsin catalysts might occur due to ultrasonication during the fabri-cation of catalyst inks. Fig. 3(b) shows a HR-TEM image of Pt/Cfrom the MEA after the long-term test. The image shows scatteredPt cluster particles (particle agglomeration) on carbon supports aswell as detached Pt particles; the average particle size increased to5.9 nm. Remarkably, as shown in Fig. 3(d), the mean particle sizeof Pt1Ni1/C in MEA after the test was 3.7 nm, with apparent struc-ture of the catalyst remaining essentially the same; there was noparticle aggregation owing to Pt1Ni1 particles falling from carbonsupports. These results clearly indicate that Pt1Ni1 particles havemore resistance to the sintering of metal particles on the carbonsupports than pure Pt particles. A similar result prompted authorsto refer to “the anchor effects of Ni to Pt on carbon supports” byPopov and co-workers [22]. Fig. 4 shows the particle size distri-
1 1For Pt/C, as seen in Fig. 4(a), the width of the curve for Pt particlesize distribution before the test was relatively narrow, whereas thewidth of the curve for the Pt/C MEA broadened and shifted to a

Y.-H. Cho et al. / Electrochimica Acta 59 (2012) 264– 269 267
t1Ni1/
hplnIwauoaamttePPttrwcdtaI
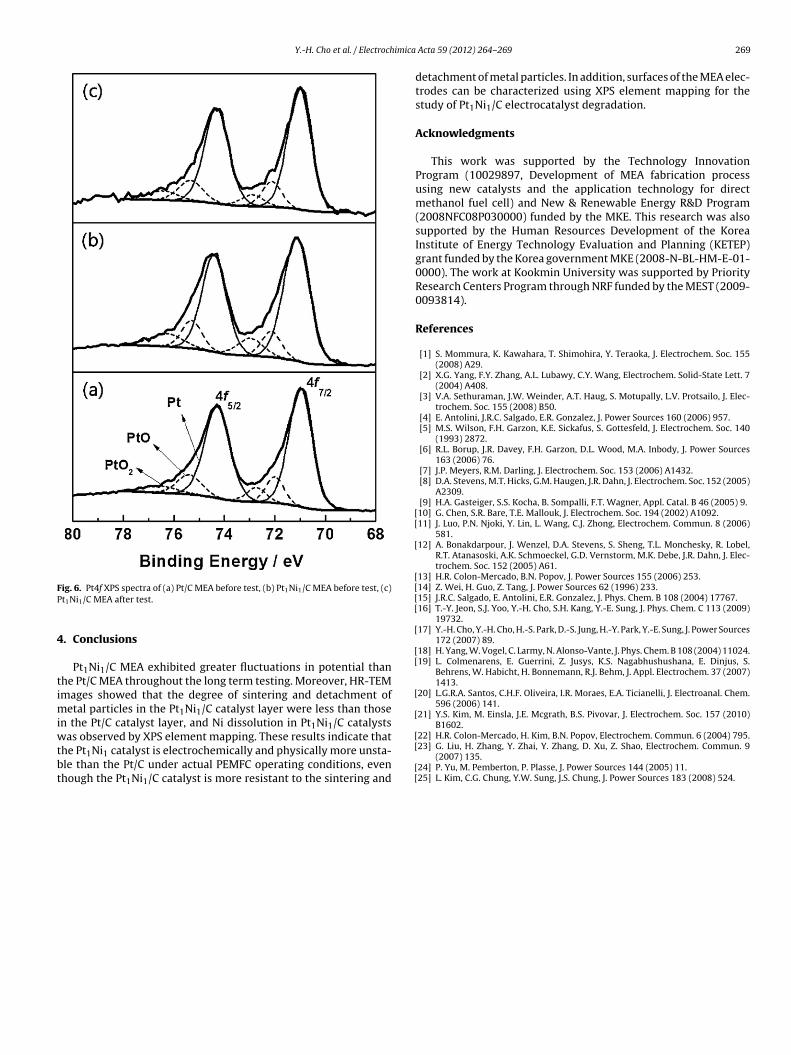
Pt1Ni1 alloy. XPS was performed to determine the de-alloying ofPt1Ni1 catalyst surface before and after durability test. Fig. 6(a–c)shows the Pt 4f core-level peaks of Pt/C MEA before durability test,Pt1Ni1/C MEA before durability test, and Pt1Ni1/C MEA after dura-
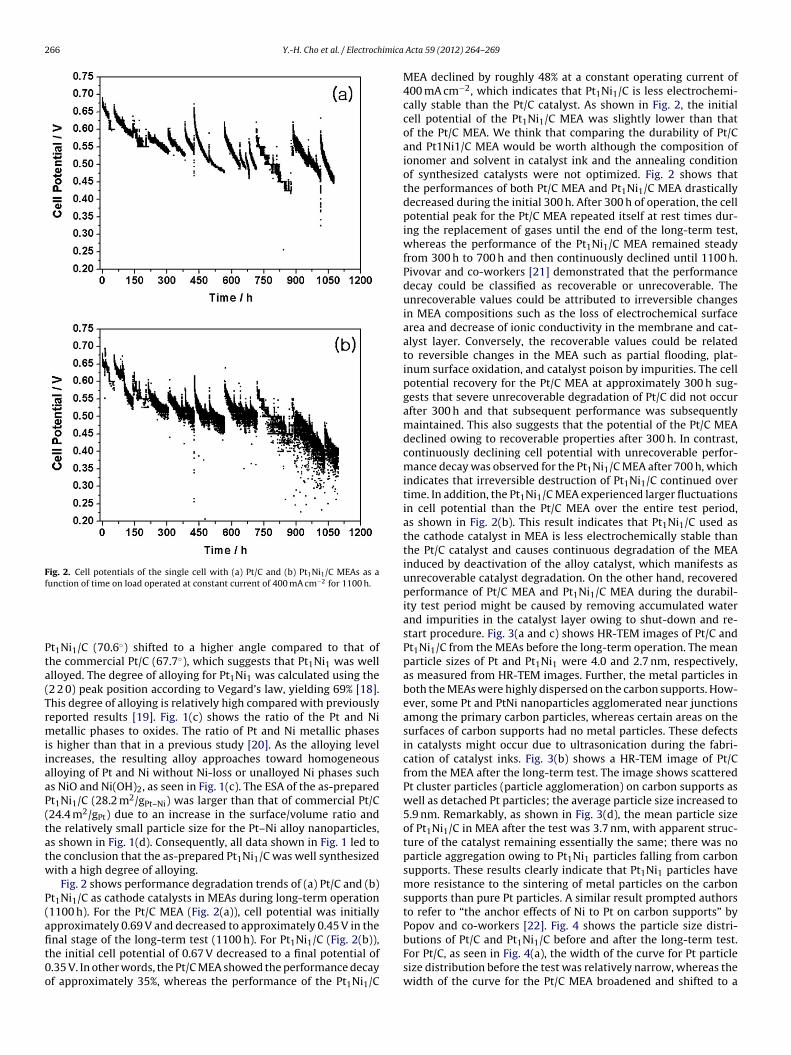
Table 1The binding energy from XPS results with Pt chemical states in each MEA.
Oxidation state Binding energy(eV)
Pt 70.98Pt/C MEA before test PtO 72.00
PtO2 72.73Pt 71.14
Pt Ni /C MEA before test PtO 72.13
Fig. 3. HR-TEM micrographs of (a–b) Pt/C and (c–d) P
igher value after the test. This result is originated from the typicalarticle growth mechanisms of Ostwald ripening and particle coa-
escence. Conversely, the particle size distribution of Pt1Ni1/C wasarrower than that of Pt/C before the test, as shown in Fig. 4(c).
n addition, the width of the curve for Pt1Ni1/C after the test alsoas smaller than that of Pt/C after the test. Fig. 5 compares the
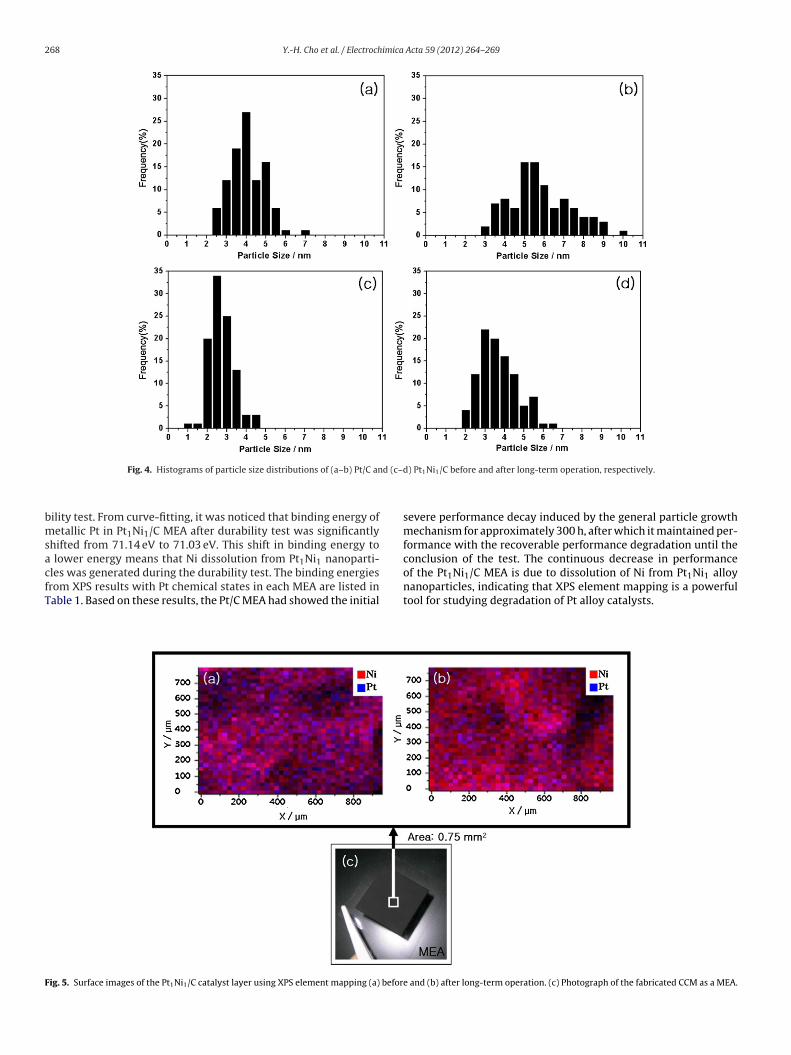
tomic ratios of surface Pt and Ni in the Pt1Ni1/C catalyst layer MEAsing XPS element mapping (a) before and (b) after the long-termperation. XPS element mapping visualized the atomic ratios of Ptnd Ni and also showed that the screen turns red when the cat-lyst layer surface has a higher Ni ratio. Fig. 5(a) shows the XPSapping image of the Pt1Ni1/C MEA catalyst layer surface before
esting; the atomic ratio of Pt to Ni was 41.1:58.9. XPS showed thathe low fraction of Pt on the catalyst surface was due to a differ-nce in the reduction rates of Pt and Ni during the synthesis of thet1Ni1 alloy phase. Since Pt has a faster reduction time than Ni,t1Ni1 nanoparticles have a higher surface composition of Ni. Onhe other hand, Fig. 5(b) shows an XPS element mapping image ofhe Pt1Ni1/C MEA catalyst layer surface after testing; the atomicatio of Pt to Ni was 17.4:82.6. Changes in the ratio of Pt to Niere caused by dissolution of Ni from the Pt1Ni1 alloy phase. The
ause for the increased Ni ratio might be that dissolved Ni was re-
eposited on the catalyst layer surface. It was previously reportedhat dissolution of transition metals such as Ni and Co from a Ptlloy catalyst is a common phenomenon in PEMFC operation [23].t is well known that dissolved metal ion from the PEMFC catalystC before and after long-term operation, respectively.
migrates to the polymer electrolyte or ionomer on the catalyst layerand is subsequently re-deposited [24,25]. However, our XPS map-ping results clearly show the re-deposition of Ni on the catalystlayer surface with no observation of Ni migration to the polymerelectrolyte, suggesting that dissolved Ni moves to the gas diffusionlayer, but not to the polymer electrolyte. Nevertheless, it is diffi-cult to determine exactly which phase (PtNi, Ni, Pt) of the catalystswill be placed on the catalyst layer surface, though the mappingimage after testing obviously shows that Ni was dissolved from the
1 1
PtO2 72.97Pt 71.03
Pt1Ni1/C MEA after test PtO 72.12PtO2 72.89
268 Y.-H. Cho et al. / Electrochimica Acta 59 (2012) 264– 269
d (c–d
bmsacfT
F
Fig. 4. Histograms of particle size distributions of (a–b) Pt/C an
ility test. From curve-fitting, it was noticed that binding energy ofetallic Pt in Pt1Ni1/C MEA after durability test was significantly
hifted from 71.14 eV to 71.03 eV. This shift in binding energy to lower energy means that Ni dissolution from Pt1Ni1 nanoparti-
les was generated during the durability test. The binding energiesrom XPS results with Pt chemical states in each MEA are listed inable 1. Based on these results, the Pt/C MEA had showed the initialig. 5. Surface images of the Pt1Ni1/C catalyst layer using XPS element mapping (a) befor
) Pt1Ni1/C before and after long-term operation, respectively.
severe performance decay induced by the general particle growthmechanism for approximately 300 h, after which it maintained per-formance with the recoverable performance degradation until theconclusion of the test. The continuous decrease in performance
of the Pt1Ni1/C MEA is due to dissolution of Ni from Pt1Ni1 alloynanoparticles, indicating that XPS element mapping is a powerfultool for studying degradation of Pt alloy catalysts.e and (b) after long-term operation. (c) Photograph of the fabricated CCM as a MEA.
Y.-H. Cho et al. / Electrochimica
FP
4
timiwtbt
[[
[
[[[[
[
[[
[
[
ig. 6. Pt4f XPS spectra of (a) Pt/C MEA before test, (b) Pt1Ni1/C MEA before test, (c)t1Ni1/C MEA after test.
. Conclusions
Pt1Ni1/C MEA exhibited greater fluctuations in potential thanhe Pt/C MEA throughout the long term testing. Moreover, HR-TEMmages showed that the degree of sintering and detachment of
etal particles in the Pt1Ni1/C catalyst layer were less than thosen the Pt/C catalyst layer, and Ni dissolution in Pt1Ni1/C catalysts
as observed by XPS element mapping. These results indicate thathe Pt1Ni1 catalyst is electrochemically and physically more unsta-le than the Pt/C under actual PEMFC operating conditions, evenhough the Pt1Ni1/C catalyst is more resistant to the sintering and
[[
[[
Acta 59 (2012) 264– 269 269
detachment of metal particles. In addition, surfaces of the MEA elec-trodes can be characterized using XPS element mapping for thestudy of Pt1Ni1/C electrocatalyst degradation.
Acknowledgments
This work was supported by the Technology InnovationProgram (10029897, Development of MEA fabrication processusing new catalysts and the application technology for directmethanol fuel cell) and New & Renewable Energy R&D Program(2008NFC08P030000) funded by the MKE. This research was alsosupported by the Human Resources Development of the KoreaInstitute of Energy Technology Evaluation and Planning (KETEP)grant funded by the Korea government MKE (2008-N-BL-HM-E-01-0000). The work at Kookmin University was supported by PriorityResearch Centers Program through NRF funded by the MEST (2009-0093814).
References
[1] S. Mommura, K. Kawahara, T. Shimohira, Y. Teraoka, J. Electrochem. Soc. 155(2008) A29.
[2] X.G. Yang, F.Y. Zhang, A.L. Lubawy, C.Y. Wang, Electrochem. Solid-State Lett. 7(2004) A408.
[3] V.A. Sethuraman, J.W. Weinder, A.T. Haug, S. Motupally, L.V. Protsailo, J. Elec-trochem. Soc. 155 (2008) B50.
[4] E. Antolini, J.R.C. Salgado, E.R. Gonzalez, J. Power Sources 160 (2006) 957.[5] M.S. Wilson, F.H. Garzon, K.E. Sickafus, S. Gottesfeld, J. Electrochem. Soc. 140
(1993) 2872.[6] R.L. Borup, J.R. Davey, F.H. Garzon, D.L. Wood, M.A. Inbody, J. Power Sources
163 (2006) 76.[7] J.P. Meyers, R.M. Darling, J. Electrochem. Soc. 153 (2006) A1432.[8] D.A. Stevens, M.T. Hicks, G.M. Haugen, J.R. Dahn, J. Electrochem. Soc. 152 (2005)
A2309.[9] H.A. Gasteiger, S.S. Kocha, B. Sompalli, F.T. Wagner, Appl. Catal. B 46 (2005) 9.10] G. Chen, S.R. Bare, T.E. Mallouk, J. Electrochem. Soc. 194 (2002) A1092.11] J. Luo, P.N. Njoki, Y. Lin, L. Wang, C.J. Zhong, Electrochem. Commun. 8 (2006)
581.12] A. Bonakdarpour, J. Wenzel, D.A. Stevens, S. Sheng, T.L. Monchesky, R. Lobel,
R.T. Atanasoski, A.K. Schmoeckel, G.D. Vernstorm, M.K. Debe, J.R. Dahn, J. Elec-trochem. Soc. 152 (2005) A61.
13] H.R. Colon-Mercado, B.N. Popov, J. Power Sources 155 (2006) 253.14] Z. Wei, H. Guo, Z. Tang, J. Power Sources 62 (1996) 233.15] J.R.C. Salgado, E. Antolini, E.R. Gonzalez, J. Phys. Chem. B 108 (2004) 17767.16] T.-Y. Jeon, S.J. Yoo, Y.-H. Cho, S.H. Kang, Y.-E. Sung, J. Phys. Chem. C 113 (2009)
19732.17] Y.-H. Cho, Y.-H. Cho, H.-S. Park, D.-S. Jung, H.-Y. Park, Y.-E. Sung, J. Power Sources
172 (2007) 89.18] H. Yang, W. Vogel, C. Larmy, N. Alonso-Vante, J. Phys. Chem. B 108 (2004) 11024.19] L. Colmenarens, E. Guerrini, Z. Jusys, K.S. Nagabhushushana, E. Dinjus, S.
Behrens, W. Habicht, H. Bonnemann, R.J. Behm, J. Appl. Electrochem. 37 (2007)1413.
20] L.G.R.A. Santos, C.H.F. Oliveira, I.R. Moraes, E.A. Ticianelli, J. Electroanal. Chem.596 (2006) 141.
21] Y.S. Kim, M. Einsla, J.E. Mcgrath, B.S. Pivovar, J. Electrochem. Soc. 157 (2010)B1602.
22] H.R. Colon-Mercado, H. Kim, B.N. Popov, Electrochem. Commun. 6 (2004) 795.23] G. Liu, H. Zhang, Y. Zhai, Y. Zhang, D. Xu, Z. Shao, Electrochem. Commun. 9
(2007) 135.24] P. Yu, M. Pemberton, P. Plasse, J. Power Sources 144 (2005) 11.25] L. Kim, C.G. Chung, Y.W. Sung, J.S. Chung, J. Power Sources 183 (2008) 524.