metabolites in maize roots by lc-ms
TRANSCRIPT

molecules
Article
Identification of Azoxystrobin Glutathione ConjugateMetabolites in Maize Roots by LC-MS
Giuseppe Dionisio 1,*,† , Maheswor Gautam 2,†,‡ and Inge Sindbjerg Fomsgaard 2
1 Department of Molecular Biology and Genetics, Research Center Flakkebjerg, Aarhus University,Forsøgsvej 1, 4200 Slagelse, Denmark
2 Department of Agroecology, Research Center Flakkebjerg, Aarhus University, Forsøgsvej 1,4200 Slagelse, Denmark; [email protected] (M.G.); [email protected] (I.S.F.)
* Correspondence: [email protected]† These authors have contributed equally to the development of this manuscript.‡ Current address: Department of Biological Sciences, University of Alberta, Canada.
Academic Editor: Thomas LetzelReceived: 9 June 2019; Accepted: 3 July 2019; Published: 5 July 2019
�����������������
Abstract: Xenobiotic detoxification in plant as well as in animals has mostly been studied inrelationship to the deactivation of the toxic residues of the compound that, surely for azoxystrobin,is represented by its β-methoxyacrylate portion. In maize roots treated for 96 h with azoxystrobin,the fungicide accumulated over time and detoxification compounds or conjugates appeared timewise.The main detoxified compound was the methyl ester hydrolysis product (azoxystrobin free acid,390.14 m/z) thought to be inactive followed by the glutathione conjugated compounds identifiedas glutathione conjugate (711.21 m/z) and its derivative lacking the glycine residue from the GSH(654.19 m/z). The glycosylated form of azoxystrobin was also found (552.19 m/z) in a minor amount.The identification of these analytes was done by differential untargeted metabolomics analysisusing Progenesis QI for label free spectral counting quantification and MS/MS confirmation of thecompounds was carried out by either Data Independent Acquisition (DIA) and Data DependentAcquisition (DDA) using high resolution LC-MS methods. Neutral loss scanning and comparison withMS/MS spectra of azoxystrobin by DDA and MSe confirmed the structures of these new azoxystrobinGSH conjugates.
Keywords: azoxystrobin; glutathione; glutathione conjugate; untargeted metabolomics
1. Introduction
Azoxystrobin is one of the widely used fungicides in plants. The metabolism of azoxystrobin inplants is well described [1] and recently our laboratory has reported mass spectrometric methods toidentify and quantify azoxystrobin metabolites in plants [2–4]. However, glutathione conjugation ofazoxystrobin in plants has not been reported yet [1,5]. The only known report on GSH conjugation ofazoxystrobin comes from an animal metabolism study where azoxystrobin was reported to conjugatewith glutathione in the cyanophenyl aromatic ring with the electrophilic carbon in the –ortho positionto the cyano group [6]. However, a later in vitro experiment undertaken to conjugate azoxystrobinwith glutathione by plant-derived glutathione transferase was unsuccessful [5]. Glutathione (GSH)conjugation is a crucial step in the detoxification process of xenobiotics in living organisms [5–7].GSH conjugation occurs in the cytoplasm of plant cells when electrophilic centers in xenobioticsare attacked by the nucleophilic thiol (–SH) group of glutathione [5]. This process increases thesolubility of xenobiotics, which can thus be transported from cytoplasm to vacuoles. As increasingconcentration of GSH-xenobiotic could be potentially harmful for plant cells, the conjugates aresequentially degraded in vacuoles by enzymatic actions thereby enabling plants to tackle harmful
Molecules 2019, 24, 2473; doi:10.3390/molecules24132473 www.mdpi.com/journal/molecules
Molecules 2019, 24, 2473 2 of 14
effects of xenobiotics [7]. During the degradation of GSH-xenobiotic conjugate in vacuoles, glycineresidue from GSH is cleaved off enzymatically, which results in glutamic acid and cysteine residue ofGSH attached to the xenobiotic [5,7].
GSH detoxification has been shown to occur in xenobiotics compound by conjugation, at a structurallevel, to aliphatic, aromatic, benzylic, disulfide, and thioester groups [8]. However, no otherconjugation than aromatic conjugation of azoxystrobin with GSH has been reported or studiedso far. We hypothesized that the carbon in the –CN group of azoxystrobin is a favorable candidatefor the nucleophilic attack by the –SH group in GSH. The synthesis of analytical standards of suchconjugates of GSH with azoxystrobin was out of the scope of the present study. Thus, we aimed toverify the presence of GSH-azoxystrobin conjugates at the –CN group by suspect screening of suchmetabolites and others possible ones by using high-resolution mass spectrometry. Our initial candidatestructure for GSH conjugates were aromatic and cyano conjugation with azoxystrobin. However,the algorithm used here to detect GSH conjugates of azoxystrobin, a priori of its structure determination,is to detect at MS/MS level the simultaneous presence of GSH fragments neutral loss and the mainazoxystrobin MS/MS fragments. Untargeted LC-MS/MS analysis was automated by using Progenesis QIfor metabolomics where the candidate MS scans were compared also over time for increased appearancedue to the plant detoxification of azoxystrobin. Once we had identified by MS/MS spectral matchingwe did confirm its reproducibility in detection by setting up a method to use in future for targeteddetection by quadrupole-linear ion trap mass spectrometry to develop sensitive triple-quadrupolemass spectrometry-based methods for quantification of GSH-azoxystrobin conjugates.
The conjugation of GSH to xenobiotics is operated enzymatically by plant Glutathione Transferases(GSTs), which is a multi-functional superfamily of detoxification enzymes [9]. They possessa hydrophobic binding domain (H-site) and the ability to bind glutathione (G-site). The greatestsimilarity between members of the GST family is observed in the GSH binding domain containinga motif of four highly conserved amino acids [10]. Here, a catalytically essential tyrosine or serineactivates glutathione by lowering the pKa of the thiol group from around pH 9 to approximately pH6, thus enhancing the rate of nucleophilic attack by the resulting thiolate anion toward electrophilicsubstrates at physiological pH [11–13]. The H site is more variable, accounting for the broad range ofendogenous and xenobiotic substrates utilized by this family of GSH dependent enzymes [13].
Despite the fact that reduced glutathione (GSH) is capable of undergoing spontaneous conjugationwith compounds containing electrophilic centers for the detoxification of several xenobiotics compounds,different classes of GSTs are, in fact, involved because they can lower by several fold the Km relatedto the nucleophilic thiolate anion attack of GSH to the electrophilic substrates, with concomitantdisplacement of a leaving group (i.e., a proton) which more rarely takes part in addition reactions [14].
In our former study, we established a maize root culture model system to study thebiotransformation of azoxystrobin in plants [3]. In the current study, we report on more resultsfrom the use of maize root culture as a model system to study not only the demethylated metabolite,azoxystrobin free acid (AzFA), which represents the main plant metabolite but also, in lower extent ofabundancy, the GSH-azoxystrobin conjugates.
2. Results
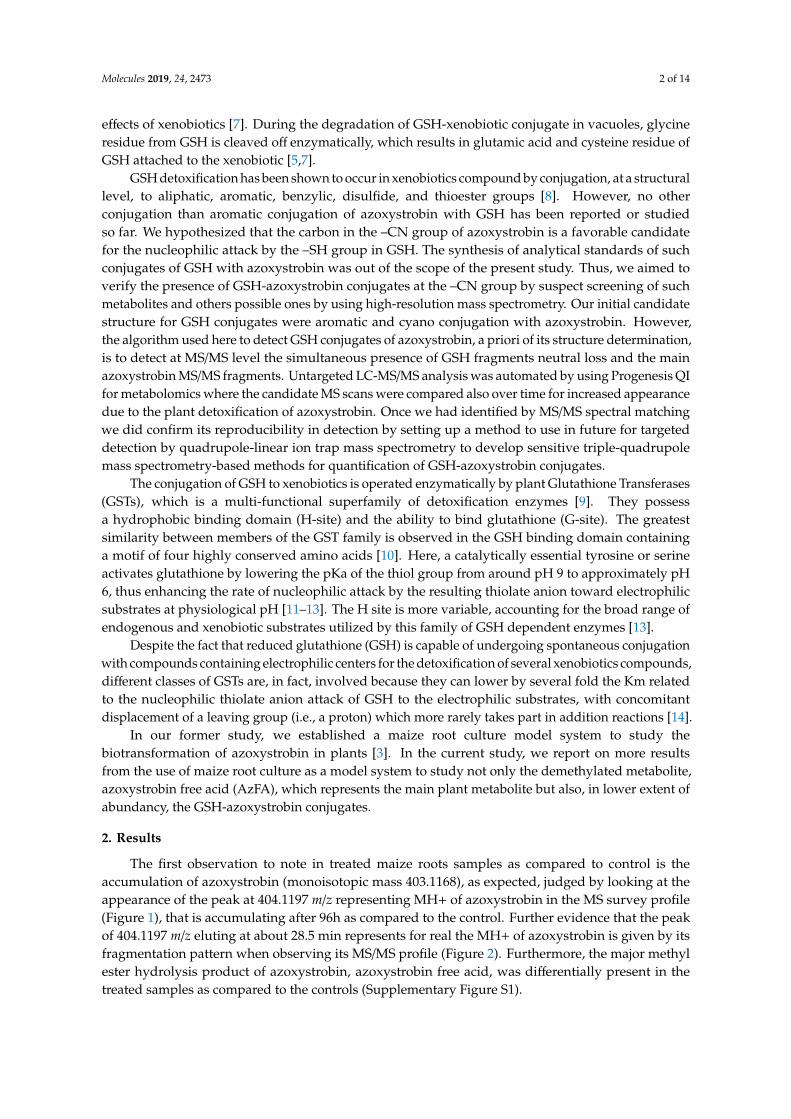
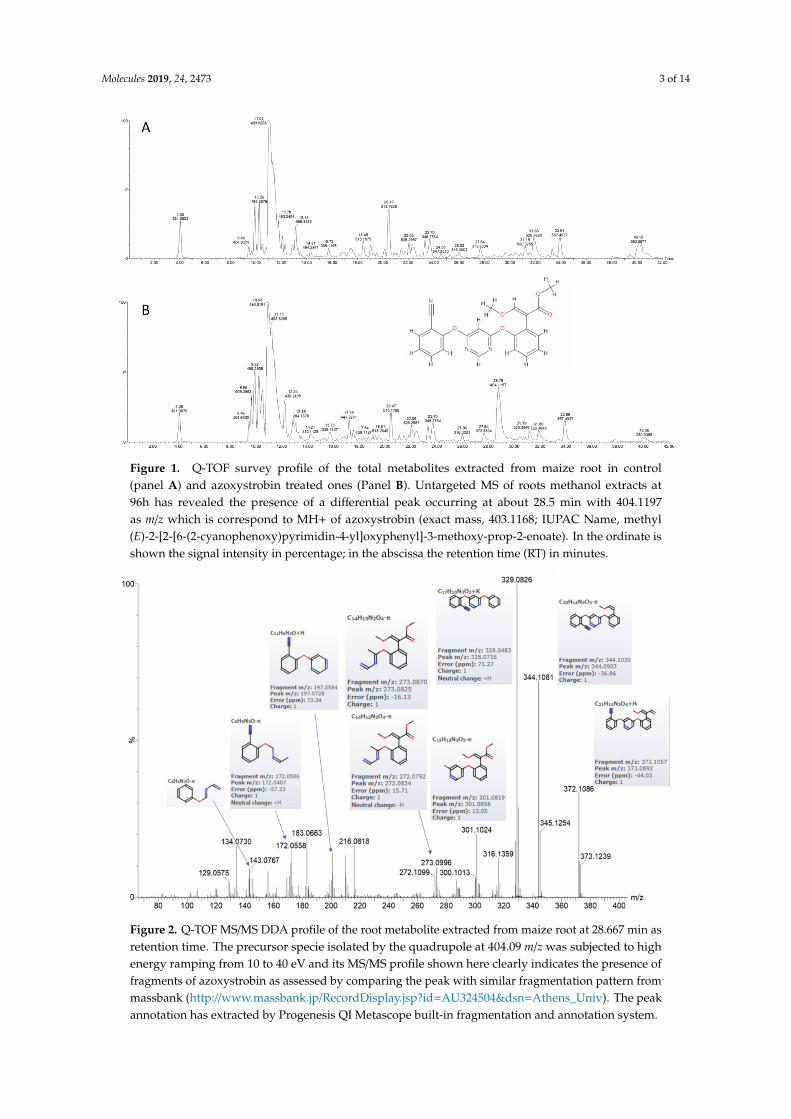
The first observation to note in treated maize roots samples as compared to control is theaccumulation of azoxystrobin (monoisotopic mass 403.1168), as expected, judged by looking at theappearance of the peak at 404.1197 m/z representing MH+ of azoxystrobin in the MS survey profile(Figure 1), that is accumulating after 96h as compared to the control. Further evidence that the peakof 404.1197 m/z eluting at about 28.5 min represents for real the MH+ of azoxystrobin is given by itsfragmentation pattern when observing its MS/MS profile (Figure 2). Furthermore, the major methylester hydrolysis product of azoxystrobin, azoxystrobin free acid, was differentially present in thetreated samples as compared to the controls (Supplementary Figure S1).
Molecules 2019, 24, 2473 3 of 14Molecules 2019, 24, x FOR PEER REVIEW 3 of 14
Figure 1. Q-TOF survey profile of the total metabolites extracted from maize root in control (panel A) and azoxystrobin treated ones (Panel B). Untargeted MS of roots methanol extracts at 96h has revealed the presence of a differential peak occurring at about 28.5 min with 404.1197 as m/z which is correspond to MH+ of azoxystrobin (exact mass, 403.1168; IUPAC Name, methyl (E)-2-[2-[6-(2-cyanophenoxy)pyrimidin-4-yl]oxyphenyl]-3-methoxy-prop-2-enoate). In the ordinate is shown the signal intensity in percentage; in the abscissa the retention time (RT) in minutes.
Figure 2. Q-TOF MS/MS DDA profile of the root metabolite extracted from maize root at 28.667 min as retention time. The precursor specie isolated by the quadrupole at 404.09 m/z was subjected to high energy ramping from 10 to 40 eV and its MS/MS profile shown here clearly indicates the presence of fragments of azoxystrobin as assessed by comparing the peak with similar fragmentation pattern
Figure 1. Q-TOF survey profile of the total metabolites extracted from maize root in control(panel A) and azoxystrobin treated ones (Panel B). Untargeted MS of roots methanol extracts at96h has revealed the presence of a differential peak occurring at about 28.5 min with 404.1197as m/z which is correspond to MH+ of azoxystrobin (exact mass, 403.1168; IUPAC Name, methyl(E)-2-[2-[6-(2-cyanophenoxy)pyrimidin-4-yl]oxyphenyl]-3-methoxy-prop-2-enoate). In the ordinate isshown the signal intensity in percentage; in the abscissa the retention time (RT) in minutes.
Molecules 2019, 24, x FOR PEER REVIEW 3 of 14
Figure 1. Q-TOF survey profile of the total metabolites extracted from maize root in control (panel A) and azoxystrobin treated ones (Panel B). Untargeted MS of roots methanol extracts at 96h has revealed the presence of a differential peak occurring at about 28.5 min with 404.1197 as m/z which is correspond to MH+ of azoxystrobin (exact mass, 403.1168; IUPAC Name, methyl (E)-2-[2-[6-(2-cyanophenoxy)pyrimidin-4-yl]oxyphenyl]-3-methoxy-prop-2-enoate). In the ordinate is shown the signal intensity in percentage; in the abscissa the retention time (RT) in minutes.
Figure 2. Q-TOF MS/MS DDA profile of the root metabolite extracted from maize root at 28.667 min as retention time. The precursor specie isolated by the quadrupole at 404.09 m/z was subjected to high energy ramping from 10 to 40 eV and its MS/MS profile shown here clearly indicates the presence of fragments of azoxystrobin as assessed by comparing the peak with similar fragmentation pattern
Figure 2. Q-TOF MS/MS DDA profile of the root metabolite extracted from maize root at 28.667 min asretention time. The precursor specie isolated by the quadrupole at 404.09 m/z was subjected to highenergy ramping from 10 to 40 eV and its MS/MS profile shown here clearly indicates the presence offragments of azoxystrobin as assessed by comparing the peak with similar fragmentation pattern frommassbank (http://www.massbank.jp/RecordDisplay.jsp?id=AU324504&dsn=Athens_Univ). The peakannotation has extracted by Progenesis QI Metascope built-in fragmentation and annotation system.

Molecules 2019, 24, 2473 4 of 14
The conjugated azoxystrobin metabolite analysis relied on the fact that the MS/MS spectra of themain peaks of azoxystrobin-conjugates should contain, at least, one of the most abundant MS/MS peakas shown in Figure 2. Using Masslynx function for extracting selected peaks from a chromatogram, it ispossible to create one extracted chromatogram profile at survey as well as at MS/MS level. By scanningthe MS/MS fragment in order to filter out peaks with 372 m/z from the MS/MS spectra of the treatedversus untreated controls it was possible to visualize the presence of four main peaks at MS/MSlevel that contains the species 372 m/z (Figure 3). Four potential azoxystrobin metabolites containingat MS/MS level the 372 m/z species were found at retention time (RT) respectively: (a) 18.36 min;(b) 18.68 min; (c) 19.72 min; and (d) 30.5 min, while RT 28.79 min was related to the azoxystrobin itself.
Molecules 2019, 24, x FOR PEER REVIEW 4 of 14
from massbank (http://www.massbank.jp/RecordDisplay.jsp?id=AU324504&dsn=Athens_Univ). The peak annotation has extracted by Progenesis QI Metascope built-in fragmentation and annotation system.
The conjugated azoxystrobin metabolite analysis relied on the fact that the MS/MS spectra of the main peaks of azoxystrobin-conjugates should contain, at least, one of the most abundant MS/MS peak as shown in Figure 2. Using Masslynx function for extracting selected peaks from a chromatogram, it is possible to create one extracted chromatogram profile at survey as well as at MS/MS level. By scanning the MS/MS fragment in order to filter out peaks with 372 m/z from the MS/MS spectra of the treated versus untreated controls it was possible to visualize the presence of four main peaks at MS/MS level that contains the species 372 m/z (Figure 3). Four potential azoxystrobin metabolites containing at MS/MS level the 372 m/z species were found at retention time (RT) respectively: a) 18.36 min; b) 18.68 min; c) 19.72 min; and d) 30.5 min, while RT 28.79 min was related to the azoxystrobin itself.
Figure 3. Extracted MS chromatograms at MS/MS (MSe) level of the precursor specie 372 m/z. A comparative extracted chromatogram for control untreated (top MS/MS trace) and treated with azoxystrobin (lower MS/MS trace) extracted and analyzed after 96 h. Four potential azoxystrobin metabolites are differentially displayed containing the 372 m/z species as visualized by the related extracted chromatogram at m/z 372 with different retention times: a) RT 18.36 min; b) RT 18.68 min; c) RT 19.72 min; and d) RT 30.5 min, being RT 28.79 min related to the azoxystrobin itself.
Matches were found in relation to the metabolites proposed to be azoxystrobin-glutathione conjugates at the cyano group due to the bonding of sulphur with the electrophilic carbon with monoisotopic mass 710.200 (M + H 711.30 m/z) and after glycil neutral loss 653.1792 (M + H 654.19 m/z) (Figure 4). The peak eluting at retention time (RT) 18.36 min is therefore compatible with precursor ion 711.30 m/z (Figure 5) and the peak eluting at RT 18.67 min could be represented by the same azoxystrobin-glutathione conjugate with glycil neutral loss, represented by the precursor ion 654.19 m/z (Supplementary Figure 2). The correct identification of potential azoxystrobin conjugate at RT 19.72 min was indicated by the neutral loss of 162 Da (glucosyl) and corresponds to azoxystrobin free acid glucoside with a monoisotopic mass of 551.1540 Da (M + H 552.19 m/z) (Supplementary Figure 3). An analysis with QTRAP IDA method revealed similarity in MS/MS spectra for 711.3 m/z including the evidence for a neutral loss of 129 corresponding to the loss of
Figure 3. Extracted MS chromatograms at MS/MS (MSe) level of the precursor specie 372 m/z.A comparative extracted chromatogram for control untreated (top MS/MS trace) and treated withazoxystrobin (lower MS/MS trace) extracted and analyzed after 96 h. Four potential azoxystrobinmetabolites are differentially displayed containing the 372 m/z species as visualized by the relatedextracted chromatogram at m/z 372 with different retention times: (a) RT 18.36 min; (b) RT 18.68 min;(c) RT 19.72 min; and (d) RT 30.5 min, being RT 28.79 min related to the azoxystrobin itself.
Matches were found in relation to the metabolites proposed to be azoxystrobin-glutathioneconjugates at the cyano group due to the bonding of sulphur with the electrophilic carbon withmonoisotopic mass 710.200 (M + H 711.30 m/z) and after glycil neutral loss 653.1792 (M + H 654.19 m/z)(Figure 4). The peak eluting at retention time (RT) 18.36 min is therefore compatible with precursorion 711.30 m/z (Figure 5) and the peak eluting at RT 18.67 min could be represented by the sameazoxystrobin-glutathione conjugate with glycil neutral loss, represented by the precursor ion 654.19 m/z(Supplementary Figure S2). The correct identification of potential azoxystrobin conjugate at RT19.72 min was indicated by the neutral loss of 162 Da (glucosyl) and corresponds to azoxystrobin freeacid glucoside with a monoisotopic mass of 551.1540 Da (M + H 552.19 m/z) (Supplementary Figure S3).An analysis with QTRAP IDA method revealed similarity in MS/MS spectra for 711.3 m/z includingthe evidence for a neutral loss of 129 corresponding to the loss of glutamic acid residue as shown inSupplementary Figure S4. Finally, the correct identification of potential azoxystrobin conjugate at RT30.55 min was revealed by the neutral loss discovery of demethylated azoxystrobin-GSH conjugate ofthe precursor specie 697.48 m/z (Supplementary Figure S5).

Molecules 2019, 24, 2473 5 of 14
Molecules 2019, 24, x FOR PEER REVIEW 5 of 14
glutamic acid residue as shown in Supplementary Figure 4. Finally, the correct identification of potential azoxystrobin conjugate at RT 30.55 min was revealed by the neutral loss discovery of demethylated azoxystrobin-GSH conjugate of the precursor specie 697.48 m/z (Supplementary Figure 5).
Figure 4. Neutral loss discovery of azoxystrobin-GSH conjugate at MS survey conditions of the precursor specie 711 m/z. Possible identification of potential azoxystrobin conjugate at RT 18.10–18.36 min. The analysis of MS survey profile for untreated (panel A) and treated sample (panel B) reveals that both 711.25 and 654.22 m/z species are present only in the treated sample. The glycil neutral loss (654.22 m/z) is already occurring at +5eV low energy level (MS1 or MS survey). The azoxystrobin-glutathione conjugate (panel C) at the cyano group has the MS/MS signature of azoxystrobin alongside the evidence of neutral loss of the glycil residue (neutral loss 57).
Figure 4. Neutral loss discovery of azoxystrobin-GSH conjugate at MS survey conditions of the precursorspecie 711 m/z. Possible identification of potential azoxystrobin conjugate at RT 18.10–18.36 min.The analysis of MS survey profile for untreated (panel A) and treated sample (panel B) reveals that both711.25 and 654.22 m/z species are present only in the treated sample. The glycil neutral loss (654.22 m/z)is already occurring at +5eV low energy level (MS1 or MS survey). The azoxystrobin-glutathioneconjugate (panel C) at the cyano group has the MS/MS signature of azoxystrobin alongside the evidenceof neutral loss of the glycil residue (neutral loss 57).

Molecules 2019, 24, 2473 6 of 14Molecules 2019, 24, x FOR PEER REVIEW 6 of 14
Figure 5. Analysis of the precursor specie 711 m/z. The identification of potential azoxystrobin conjugate at RT 18.36 min was possible by the analysis of MS survey profile (panel A) of azoxystrobin treated roots and its DDA MS/MS profile (panel B). The isolated MS/MS fragmentation profile reveals that the precursor of this azoxystrobin-conjugate/metabolite fits well with the azoxystrobin glutathione conjugate (panel C) at the cyano group compatible with the compound 711.30 m/z as confirmed by the presence of 372 m/z in MS/MS of the isolated peak at 711.30 m/z (panel B). Further confirmation of this compound has been done by studying the neutral losses.
The presence of these metabolites of azoxystrobin in maize roots was also investigated by differential untargeted metabolomics using Progenesis QI ver. 2.0. A database of SDF structures to search such metabolites was custom made from known and possible metabolites and validation of such metabolites was performed by the internal Metascope theoretical fragmentation engine using DDA MS/MS fragmentation profile both at MS1 and the most abundant MS/MS fragments.
The top relative maximum abundance is shown in Table 1 and it was recorded respectively for compounds at m/z 404.1068, 372.0798, 549.1369, 549.1715, 654.1935, 711.2189, 557.1727, and 552.1740. The validation of each peak was performed by looking at the control versus the treated root MS/MS profile for each m/z species above which a signature of azoxystrobin MS/MS spectra could be found.
Figure 5. Analysis of the precursor specie 711 m/z. The identification of potential azoxystrobin conjugateat RT 18.36 min was possible by the analysis of MS survey profile (panel A) of azoxystrobin treatedroots and its DDA MS/MS profile (panel B). The isolated MS/MS fragmentation profile reveals thatthe precursor of this azoxystrobin-conjugate/metabolite fits well with the azoxystrobin glutathioneconjugate (panel C) at the cyano group compatible with the compound 711.30 m/z as confirmed by thepresence of 372 m/z in MS/MS of the isolated peak at 711.30 m/z (panel B). Further confirmation of thiscompound has been done by studying the neutral losses.
The presence of these metabolites of azoxystrobin in maize roots was also investigated bydifferential untargeted metabolomics using Progenesis QI ver. 2.0. A database of SDF structures tosearch such metabolites was custom made from known and possible metabolites and validation ofsuch metabolites was performed by the internal Metascope theoretical fragmentation engine usingDDA MS/MS fragmentation profile both at MS1 and the most abundant MS/MS fragments.
The top relative maximum abundance is shown in Table 1 and it was recorded respectively forcompounds at m/z 404.1068, 372.0798, 549.1369, 549.1715, 654.1935, 711.2189, 557.1727, and 552.1740.The validation of each peak was performed by looking at the control versus the treated root MS/MSprofile for each m/z species above which a signature of azoxystrobin MS/MS spectra could be found.

Molecules 2019, 24, 2473 7 of 14
Table 1. Possible azoxystrobin containing peaks differentially present in the treated maize root as compared untreated roots over 96 h. The searched azoxystrobin SDFstructures and related metabolites present here were not all validated since most of them were also present in the control roots. Their relative max abundance ascompared to the control and spectral counting is shown in the last column, where clearly the relative max abundance was recorded respectively for compoundsat m/z 404.1068, 372.0798, 549.1369, 549.1715, 654.1935, 711.2189, 557.1727, and 552.1740. In bold are reported the compounds which have been confirmed beingazoxystrobin metabolites.
Compound (RT_m/z) m/z z RT PW Anova (p) q Value FC HM LM Max Abundance
18.18_711.2189 m/z 711.2189 1 18.18 0.61 <1.1 × 10⁻¹⁶ <1.1 × 10⁻¹⁶ 18.7 AZO_96h CTRL_24h 139.919.33_552.1740 m/z 552.1740 1 19.33 0.69 1.11 × 10⁻¹⁶ 4.58 × 10⁻¹⁵ 27.8 AZO_96h CTRL_48h 50.718.47_654.1935 m/z 654.1935 1 18.47 0.61 2.22 × 10⁻¹⁶ 8.10 × 10⁻¹⁵ 110 AZO_96h CTRL_3h 162.028.70_403.0995 m/z 404.1068 1 28.70 3.12 3.33 × 10⁻¹⁶ 1.13 × 10⁻¹⁴ 2.98 × 10⁻³ AZO_3h CTRL_48h 8260.128.70_372.0798 m/z 372.0798 1 28.70 2.94 5.33× 10⁻¹⁶ 1.28 × 10⁻¹³ 8.05 × 10³ AZO_3h CTRL_48h 6041.616.10_534.1777 m/z 534.1777 1 16.10 0.64 2.12 × 10⁻¹⁰ 1.60 × 10⁻⁹ 3.91 AZO_96h CTRL_3h 57.223.22_557.1621 m/z 557.1621 1 23.22 1.25 4.47 × 10⁻⁹ 2.41 × 10⁻⁸ 6.76 CTRL_3h AZO_96h 3340.413.32_743.2417 m/z 743.2417 1 13.32 0.59 5.68 × 10⁻⁹ 3.01 × 10⁻⁸ 3.46 AZO_96h CTRL_3h 63.911.19_549.1369 m/z 549.1369 1 11.19 0.96 4.20 × 10⁻⁶ 1.27 × 10⁻⁵ 4.68 AZO_96h CTRl_3h 229.821.12_557.1727 m/z 557.1727 1 21.12 1.17 7.97 × 10⁻⁶ 2.30 × 10⁻⁵ 2.39 AZO_3h CTRl_72h 104.534.25_404.1264 m/z 404.1264 1 34.25 0.80 1.02 × 10⁻⁵ 2.89 × 10⁻⁵ Infinity AZO_3h CTRL_3h 12.93.90_1103.2994 m/z 1103.2994 1 3.90 0.45 2.50 × 10⁻⁵ 6.57 × 10⁻⁵ 4.87 CTRL_3h CTRL_48h 20.421.25_663.2184 m/z 663.2184 1 21.25 0.59 9.41 × 10⁻⁵ 0.00022 2.78 AZO_3h AZO_72h 26.513.21_426.1160 m/z 426.1160 1 13.21 0.85 0.000114 0.000263 1.74 CTRL_72h CTRL_3h 94.713.37_549.1715 m/z 549.1715 1 13.37 2.59 0.0258 4 1.42 AZO_3h CTRL_24h 330.39.32_367.0946 m/z 367.0946 2 9.32 0.51 0.0296 456 2.84 AZO_3h CTRL_3h 57.51.98_404.1227 m/z 404.1227 1 1.98 0.24 0.143 0.197 Infinity AZO_24h CTRL_24h 14.23.82_370.0885 m/z 370.0885 2 3.82 0.51 0.208 0.278 2.36 CTRL_96h AZO_96h 5.31.52_404.1226 m/z 404.1226 1 1.52 0.35 0.31 0.4 Infinity CTRL_3h CTRL_24h 3.69.32_355.0933 m/z 355.0933 2 9.32 0.51 0.336 0.432 4.08 AZO_3h CTRL_3h 7.538.31_404.1245 m/z 404.1245 1 38.31 0.45 0.508 0.629 Infinity AZO_48h CTRL_3h 13.437.53_404.1205 m/z 404.1205 1 37.53 0.56 0.607 0.74 Infinity AZO_72h CTRL_3h 16.624.29_743.2418 m/z 743.2418 1 24.29 0.61 0.704 0.838 1.38 AZO_3h AZO_96h 11.43.71_380.1017 m/z 380.1017 2 3.71 0.32 0.978 >0.9995 4.22 CTRL_96h CTRL_24h 18.3
Z = charge; RT = retention time; PW = peak width; FC = Fold change; HM = highest mean; LM = lowest mean.

Molecules 2019, 24, 2473 8 of 14
Not all the metabolites of azoxystrobin were found by the Progenesis Metascope engine butat least the main azoxystrobin conjugates were detected in order of significance (ANOVA) andabundance. The peaks were presented by precursor ions 654.1935 m/z, 711.2189 m/z, and 552.1740 m/z,corresponding respectively to azoxystrobin-GSH conjugate with glycil loss, azoxystrobin-GSHconjugate, and azoxystrobin free acid glucoside conjugate (Figure 6). Time course accumulationof selected metabolites have been chosen for visualization in Progenesis QI where the untreated control(CTRL) and the azoxystrobin treated samples (AZO) have been analyzed at 3 h, 24 h, 48 h, and 96 h(Figure 6). The typical representation of the trend of m/z over time and its isotope distribution canbe visualized in 2D or 3D and the related area quantified by relative units which are normalized byabundance related to a standard (i.e., CTRL) in Figure 6.
Molecules 2019, 24, x FOR PEER REVIEW 8 of 14
Not all the metabolites of azoxystrobin were found by the Progenesis Metascope engine but at least the main azoxystrobin conjugates were detected in order of significance (ANOVA) and abundance. The peaks were presented by precursor ions 654.1935 m/z, 711.2189 m/z, and 552.1740 m/z, corresponding respectively to azoxystrobin-GSH conjugate with glycil loss, azoxystrobin-GSH conjugate, and azoxystrobin free acid glucoside conjugate (Figure 6). Time course accumulation of selected metabolites have been chosen for visualization in Progenesis QI where the untreated control (CTRL) and the azoxystrobin treated samples (AZO) have been analyzed at 3 h, 24 h, 48 h, and 96 h (Figure 6). The typical representation of the trend of m/z over time and its isotope distribution can be visualized in 2D or 3D and the related area quantified by relative units which are normalized by abundance related to a standard (i.e., CTRL) in Figure 6.
Figure 6. Relative Ion abundance distribution of azoxystrobin-GSH (glutathione) conjugate at MS survey conditions as quantified by the Progenesis QI software for metabolomics. The label free relative spectral counting quantification analysis (here depicted as 3D isotope abundance) has revealed the differential presence of the m/z 711.2189, accumulating over time (max at 96 h) in azoxystrobin treated roots versus the untreated control. The same trend has been detected for the peaks 654.1935 m/z and 552.1740 m/z.
All the rest of Progenesis identified peaks at MS1 containing at MS/MS level the 372 m/z species, shown in Table 1, were not validated because they were also present in the control roots extract and lacked full similarity to all MS/MS spectra of azoxystrobin.
The QTRAP MS was hence used to setup a quantification method to be further implemented in future screening of the 711.3 m/z metabolite in plant once it would be commercially available to be used as standards. The MS conditions used for the future QQQ detection of 711.3 m/z metabolite are summarized in Table 2.
Table 2. Mass spectrometric parameters used for the Multiple Reaction Monitoring-Information Dependent Acquisition (MRM-IDA) spectra acquisition of glutathione conjugate of azoxystrobin.
Scan type
Q1 Q3 DP (V) EP (V) CE (V) CXP (V) CUR (psi)
CAD IS (V) TEM (°C)
GS 1 (psi)
GS 2 (psi)
MRM 711 404 60 10 30 13 35 High 4300 450 90 50
Figure 6. Relative Ion abundance distribution of azoxystrobin-GSH (glutathione) conjugate at MSsurvey conditions as quantified by the Progenesis QI software for metabolomics. The label free relativespectral counting quantification analysis (here depicted as 3D isotope abundance) has revealed thedifferential presence of the m/z 711.2189, accumulating over time (max at 96 h) in azoxystrobin treatedroots versus the untreated control. The same trend has been detected for the peaks 654.1935 m/z and552.1740 m/z.
All the rest of Progenesis identified peaks at MS1 containing at MS/MS level the 372 m/z species,shown in Table 1, were not validated because they were also present in the control roots extract andlacked full similarity to all MS/MS spectra of azoxystrobin.
The QTRAP MS was hence used to setup a quantification method to be further implemented infuture screening of the 711.3 m/z metabolite in plant once it would be commercially available to beused as standards. The MS conditions used for the future QQQ detection of 711.3 m/z metabolite aresummarized in Table 2.

Molecules 2019, 24, 2473 9 of 14
Table 2. Mass spectrometric parameters used for the Multiple Reaction Monitoring-InformationDependent Acquisition (MRM-IDA) spectra acquisition of glutathione conjugate of azoxystrobin.
Scan type Q1 Q3 DP (V) EP (V) CE (V) CXP (V) CUR(psi) CAD IS (V) TEM
(◦C)GS 1(psi)
GS 2(psi)
MRM711 404 60 10 30 13 35 High 4300 450 90 50711 372 60 10 30 13 35 High 4300 450 90 50711 582 60 10 30 13 35 High 4300 450 90 50
3. Discussion
Azoxystrobin is a strobilurin fungicide that was developed by Zeneca UK Ltd., in 1992.Its mechanism of action in fungi and bacteria rely on inhibiting the electron transport systemby binding the Qo site of mitochondrial cytochrome bcl complex to inhibit microbial respiration [15].The toxophore (chemical group that produces the toxic effect) portion of the molecule is actually notthe cyano group, but the β-methoxyacrylate portion that is double methylated and that, hence, shouldrepresent the immediate sensitive region of the molecules for enzymatic deactivation by conjugation ordemethylation. One of the azoxystrobin environmental degradation products, azoxystrobin free acid,was present in the methanol extracts of maize roots for the treated samples as compared to the controls(Supplementary Figure S1) indicating an active demethylation mechanism of detoxification occurringin vivo. This initial demethylation opens the molecule to a definitive inactivation of its toxophore byglycosylation as was shown by the presence of the peak with 552.1740 m/z (Supplementary Figure S3).
The conjugation of azoxystrobin with glutathione by enzymatic action of glutathione S-transferaseenzyme has not been described yet in plants, although a glutathione (GSH) conjugate of azoxystrobinhas been identified in rats where sulphur is conjugated to the phenolic ring in the ortho positionrelative to the cyano group where the conjugate species have shown m/z values of 708.18 and694.16 respectively for the fully methylated and demethylated GSH azoxystrobin conjugate [6] notfound here in our experiments. Here, we present mass spectrometric evidences that GSH wasconjugated with azoxystrobin through the –CN group thereby potentially allowing detoxification ofazoxystrobin. We have also proposed chemical structures of the corresponding precursors of m/z711.2189 (Figures 4 and 5) and 654.1935 (Supplementary Figure S2) as being full azoxystrobin-GSHand azoxystrobin-cysteine-γglutamic acid conjugates. During the MS survey at low energy, the glycineneutral loss is already present in the MS/MS spectra of m/z 711.2189 (Figure 4), but the elution of thepeak with m/z 654.1935 is at different time than that with m/z 711.2189 meaning that the loss could behappening in vivo. In barley, Glutathione S-conjugates accumulates in the plant vacuole and that the firststep of its degradation, the formation of the respective T-glutamylcysteinyl-S-conjugate, is catalyzed bya vacuolar carboxypeptidase [16]. Following the action of a vacuolar carboxypeptidase that degradesGS-conjugates by cleaving the glycine, it is also reported a removal of the amino terminal glutamicacid residue, cleaved also successively enzymatically [17]. Besides, a membrane associated γ-glutamyltranspeptidase (γ-GTase) has been identified [18], as part of the transport from the vacuole to thecytosol, that then removes the terminal glutamic acid leaving the S-cysteinyl derivative [7]. The loss ofthe glycine residue from glutathione conjugates of a xenobiotic is well documented [5,19] and is knownto occur during transport of xenobiotic glutathione conjugates from cytosol to vacuoles (for reviewsee [5]). Alongside the glycine neutral loss (∆57) (Figure 4), γ-Glutamic acid neutral loss (∆129) hasbeen detected (Supplementary Figure S4) confirming the nature of the analyte with precursor ion m/z711.2189. The neutral loss of 129 Da corresponding to the loss of glutamic acid from GSH conjugates ispreviously described [20] and validated by the method for simultaneous screening of GSH and CNadducts using precursor ion (PI) and neutral loss (NL) scans dependent product ion spectral acquisitionand datamining tools on QTRAP mass spectrometry [21]. Here, hence, we have demonstrated thatthe 711.3 m/z metabolite possesses a 129 Da neutral loss (Supplementary Figure S4) and that can bequantified by QQQ MS methods (Table 2) once the standard is available as pure compound.

Molecules 2019, 24, 2473 10 of 14
Naturally occurring isothiocyanate compounds present in cruciferous vegetables,e.g., sulforaphane, are powerful inducers of glutathione S-transferase activities in laboratory animals,meaning that the GSH conjugation at the cyano group is operated enzymatically and the reactive groupis represented by the carbonyl portion of the isothiocyanate [22]. Similar results have been shown forphenyl isocyanate detoxification by glutathione conjugation [23]. Here we have proposed and haveshown evidence that glutathione is conjugated to the electrophilic carbon of the cyano group (–CN)of azoxystrobin. Further experiments are currently underway in order to identify possible enzymes,i.e., gluthatiose S-transferases, that might mediate in vivo GSH conjugation and detoxification ofazoxystrobin in maize roots.
4. Materials and Methods
4.1. Chemicals
Analytical grade azoxystrobin (purity 99.4%) and sucrose (≥99.5%) were purchased fromSigma-Aldrich (Copenhagen, Denmark). Azoxystrobin free acid ((E)-2-(2-((6-(2-cyanophenoxy)pyrimidin-4-yl)oxy)phenyl)-3-methoxyacrylic acid) (10 ng/µL in acetonitrile) was procured fromDr. Ehrenstorfer GmbH (Augsburg, Germany). Acetonitrile and methanol (TOF/MS grade) wereobtained from Fisher Chemical (Roskilde, Denmark). Milli-Q water was generated from a Milli-Qsystem (Millipore, MA, USA). Murashige and Skoog (M&S) media was purchased from DuchefaBiochemie (Harlem, The Netherlands).
4.2. Maize Root Culture Growth
Maize seeds (cv. Kaspian) were purchased from KWS Scandinavia (Vejle, Denmark) and maizeroots were cultured as explained in our earlier study [3]. Briefly, maize seeds were surface sterilizedwith ethanol and sodium hypochlorite and rinsed with sterilized Milli-Q water. The seeds weretransferred into petri plates containing sucrose and full-strength M&S media that had been solidifiedwith phytagel. The pH of the media was maintained at 5.8. The plates were incubated under light/darkcondition for 16/8 h at 23 ◦C for seven days. The roots from germinated seeds were detached andtransferred into Erlenmeyer flasks containing half-strength M&S and sucrose where the pH wasmaintained at 5.8. The flasks were covered with aluminum foil to maintain a dark condition within theflasks. The flasks were shaken at 100 rpm at 25 ◦C for seven days and the maize root culture was readyfor azoxystrobin uptake and metabolism study.
4.3. Azoxystrobin Uptake
Azoxystrobin was dissolved in methanol and added to sterile half-strength liquid M&S growthmedium (pH 5.8) contained in a beaker to yield a final azoxystrobin concentration 100 µM in 500 mLmedium as explained in Gautam et al. (2018). Maize roots were transferred into the beaker and swirledgently to mix azoxystrobin thoroughly. A beaker with similar content except azoxystrobin was used ascontrol. Azoxystrobin treatment continued for three hours after which a portion of roots (5–10 g) wascut-off with sterile scissors, washed thoroughly with sterile water, wiped with tissue paper, wrappedin aluminum foil, and flash frozen in liquid nitrogen. Control maize roots was sampled similarly afterthree hours. The samples were labelled as 3 h sample.
The treatment solution was decanted off, maize roots were first washed with sterilized Milli-Qwater and then with M&S medium, and finally transferred to sterile liquid M&S medium devoid ofazoxystrobin. The control was also washed and transferred similarly. The flasks were wrapped withaluminum foil to prevent exposure to light and allowed to stand in a sterile bench throughout theuptake experiment period. Samples were collected after 3, 24, 48, 72, and 96 h of initial exposurewith azoxystrobin.
Molecules 2019, 24, 2473 11 of 14
4.4. Sample Preparation and Extraction
Frozen maize roots were freeze dried on a DryWinner 6-85 freeze drier (Holm & Halby, Brøndby,Denmark) while still wrapped in aluminum foil. The freeze-dried roots were ground in GenoGrinder100 (Spex, Metuchen, NJ, USA). 20.0 mg of homogenized root tissue was weighed in 2-mL Eppendorftube and suspended in 1 mL of 50% methanol (v/v) containing 0.1% formic acid. The tube was shakenvigorously, ultrasonicated for 15 min, and centrifuged at 16,000× g at 20 ◦C for 15 min in a Sigma 1-14Kmicrocentrifuge (Buch and Holm, Herlev, Denmark). The supernatant was filtered with 0.22 µm KXSyringe PTFE filter (Mikrolab, Aarhus, Denmark) and analyzed immediately with or stored at −20 ◦Cbefore analysis.
4.5. LC-MS/MS Analysis
4.5.1. Q-TOF Analysis
Methanol content in the extracts were adjusted to 25% before injecting. The liquid chromatographysystem was composed of a nano Acquity UPLC (Waters, Milford, CT, USA) equipped with a nanoTrap column (Waters XSelect™ HHS T3, 5 µm beads diameter, 180 µm × 20 mm) for accumulating theinjected samples and an analytical capillary column with the same chemistry (Waters nano RP-C18HHS T3 type, 1.8µm, 150µm × 100 mm) for sample separation. The nano capillary column wasattached with a nano ESI source to a Waters Q-TOF premiere (Waters, Milford, USA). The Q-TOFoperational conditions were the following: 3.2 kV for capillary cone voltage and extraction, 30 kV assampling cone voltage, and 3.4 kV as ion guide voltage, and the source temperature was set to 120 ◦C.The instrument was calibrated in V positive mode using the MS/MS profile of M2H + 785.8426 m/zGluFib-B ([Glu1]-Fibrinopeptide B human, F3261, Sigma Aldrich, Merck, Germany) as Z-lock mass(reference calibration) at 23 eV as collision energy obtaining a calibration range from 72 to 1286 Da,and with a ppm error of +/− 2.
The entire length of the LC run was 42 min. Mobile phase A was 0.1% formic acid (FA, SigmaAldrich, Germany) and phase B was acetonitrile (ACN, Thermo-Fischer Scientific, Hvidovre, Denmark)with 0.1% FA. The gradient conditions were from 15% phase B to 70% phase B in 25 min and from 25 minto 27 min from 70% phase B to 85% phase B; from 27 to 30 min, the percentage of mobile phase B raisedfrom 85% to 95%. After 30 min the percentage of phase B was constant set to 95%. Data acquisitionwas performed in Masslynx version 4.1 (Waters, Milford, USA) either as data-independent acquisition(DIA) mode by all ion fragmentation (MSe) with MS1 and MS/MS (MS2) range from 50 to 2000 m/z, ordata dependent (DDA). For the DDA mode the MS1 survey was acquired from 50 to 1000 m/z andMS/MS was acquired from 500 Da above after peak deisotoping: scan time 1.5 s with variable collisionenergy from 5 to 40 V.
Differential untargeted azoxystrobin metabolite, by the means of spectral counting comparison,was performed by Progenesis QI, version 2.0 (Nonlinear Dynamics, a Waters company, Newcastle uponTyne, UK). The import of raw MSe data acquired by Masslynx was transformed into centroid data byM2H + 785.8426 m/z GluFib-B lock mass data calibration and refinement including dead time correctionand charge deconvolution. Data runs, in triplicate, were hence layered into 2D graphs obtained by theretention time versus the m/z indexing of the MS1 and MS/MS peaks. After the multirun 2D alignmentthe peptide3D Apex3D algorithm was used to peak picking and quantification [24]. Label-freeion/adducts quantitation was performed by general all ion compound normalization using built inLOWESS (locally weighted scatterplot smoothing) algorithm and weighted spectral counting alongsidethe ion/adduct isotopic peaks [25]. The search algorithm was the built-in Progenesis Metascope usinga custom Structure Data File (SDF) databases created by joining together many single chemical 2Dstructures of azoxystrobin precursors as SDF files by Progenesis SDF studio. Chemical 2D structures ofazoxystrobin precursors were downloaded from ChemSpider website or manually drawn either byChemDraw Pro (CambridgeSoft, PerkinElmer, Waltham, MA, USA) or BIOVIA Draw 2018 (BIOVIA,
Molecules 2019, 24, 2473 12 of 14
Accelrys, San Diego, CA, USA). The Progenesis Metascope search of the custom SDF database wascarried out assuming 50 ppm error for precursor ions and 30 ppm for theoretical fragments.
4.5.2. QTRAP Analysis
The LC-MS/MS analysis was done with a QTRAP 4500 mass spectrometer (AB Sciex, Framingham,MA, USA) coupled to an Agilent 1260 Infinity HPLC system (Santa Clara, CA, USA). Reversed phaseHPLC was done with a BDS Hypersil C18 column (250 × 2.1; 5 µm) (Thermo Scientific, Waltham,MA, USA) using a gradient with eluent A 0.1% formic acid in Milli-Q water and B 0.1% formic acidin acetonitrile. Column compartment was maintained at 30 ◦C. The column was equilibrated with20% B for 10 min in the beginning of each run. The linear gradient was increased from 20% to 95%B (0–15 min) and maintained at 95% B (15–25 min). The mobile phase flow rate was maintained at300 µL/min with 5 µL injection volume. Samples were filtered through a 0.22 µm KX Syringe PTFEfilters (Mikrolab, Aarhus, Denmark) before LC-MS/MS analysis.
The QTRAP MS was used in Information Dependent Acquisition (IDA) mode. After the suspectscreening of glutathione conjugates with Q-TOF analysis, MS/MS spectra of the selected hits wereacquired using IDA.
The MS/MS spectra from one to two of the most intense peaks matching the survey MRMtransitions outlined in Table 1 were acquired if the peak intensity was above IDA threshold of 3000counts per second (cps). Dynamic exclusion was applied to avoid acquiring MS/MS spectra from thesame transition for the next 15 s after 3 occurrences of a transition, thus allowing for the detection ofco-eluting peaks. Two EPI experiments were done for the two most intense peaks of each transitionmeeting the IDA criteria. EPI spectra were acquired between m/z 80 to 720 in positive ionization modewith a scan rate at 20,000 amu per second. Two EPI spectra from each transition was summed to givea final spectrum which resulted in a dwell time of 1.6 s for a complete MRM-EPI scan. During theacquisition of EPI spectra, DP was ramped between 50 to 70 V. Collision energy of 35 V and a spread of15 V was used thus acquiring EPI at CE 20, 35, and 50 V.
Supplementary Materials: The supplementary materials are available online.
Author Contributions: Conceptualization, G.D., I.S.F., M.G.; methodology, G.D. and M.G.; software, (Q-TOF)G.D., (QTRAP) M.G.; data analysis, G.D. I.S.F., M.G.; data curation, G.D. I.S.F., M.G.; writing—original draftpreparation, G.D. and M.G.; writing—review and editing, I.S.F., G.D. and M.G.; supervision, I.S.F.
Funding: The study was funded by the PhD project (Project no. 17638) of Maheswor Gautam at the GraduateSchool of Science and Technology, Aarhus University (GSST, AU).
Acknowledgments: The GSST, AU is thanked for the funding for the PhD project. Bente Laursen, KirstenHeinrichson and Elena Claudia Jensen from the Team Natural Products Chemistry and Environmental Chemistryat AU are thanked for their assistance in the laboratory. Agnes Corbin and Juliet Evans from Nonlinear Dynamics,a Waters company (Newcastle upon Tyng, United Kingdom), are thanked a lot for their assistance during the dataprocessing in Progenesis QI for our experiments.
Conflicts of Interest: The authors declare no conflict of interest.
Abbreviations
MSe Waters® acquisition method synonymous of “all ions fragmentation” and data independentacquisition (DIA)
GSH reduced glutathioneLC-MS Liquid Chromatography followed by Mass SpectroscopyQ-TOF Quadrupole-Time of FlightQ-TRAP Triple Quadrupole Linear Ion Traps (also known as triple Q, or QQQ)MRM-IDA Multiple Reaction Monitoring using Information Dependent Acquisition (IDA)MRM-EPI Multiple Reaction Monitoring (MRM) with Enhanced Product Ion (EPI)
Molecules 2019, 24, 2473 13 of 14
References
1. Joseph, R.S. Metabolism of Azoxystrobin in Plants and Animals. Special Publication-Royal Soc. Chem. 1999,233, 265–278. [CrossRef]
2. Gautam, M.; Fomsgaard, I.S. Liquid chromatography-tandem mass spectrometry method for simultaneousquantification of azoxystrobin and its metabolites, azoxystrobin free acid and 2-hydroxybenzonitrile, ingreenhouse-grown lettuce. Food Addit. Contam. A 2017, 34, 2173–2180. [CrossRef] [PubMed]
3. Gautam, M.; Elhiti, M.; Fomsgaard, I.S. Maize root culture as a model system for studying azoxystrobinbiotransformation in plants. Chemosphere 2018, 195, 624–631. [CrossRef] [PubMed]
4. Gautam, M.; Etzerodt, T.; Fomsgaard, I.S. Quantification of azoxystrobin and identification of two novelmetabolites in lettuce via liquid chromatography–quadrupole-linear ion trap (QTRAP) mass spectrometry.Int. J. Environm. Anal. Chem. 2017, 97, 419–430. [CrossRef]
5. Bryant, D. Glutathione conjugation of herbicides and fungicides in plants and fungi: Functionalcharacterization of glutathione transferases from phytopathogens. Ph.D. Thesis, Durham University,Durham, UK, 2004.
6. Laird, W.J.D.; Gledhill, A.J.; Lappin, G.J. Metabolism of methyl-(E)-2-{2-[6-(2-cyanophenoxy)pyrimidin-4-yloxy]phenyl}-3-methoxyacrylate (azoxystrobin) in rat. Xenobiotica 2003, 33, 677–690. [CrossRef] [PubMed]
7. Ohkama-Ohtsu, N.; Zhao, P.; Xiang, C.; Oliver, D.J. Glutathione conjugates in the vacuole are degraded bygamma-glutamyl transpeptidase GGT3 in Arabidopsis. Plant. J. 2007, 49, 878–888. [CrossRef] [PubMed]
8. Xie, C.; Zhong, D.; Chen, X. A fragmentation-based method for the differentiation of glutathione conjugatesby high-resolution mass spectrometry with electrospray ionization. Anal. Chim. Acta 2013, 788, 89–98.[CrossRef] [PubMed]
9. Marrs, K.A. THE FUNCTIONS AND REGULATION OF GLUTATHIONE S-TRANSFERASES IN PLANTS.Annual Rev. Plant Biol. 1996, 47, 127–158. [CrossRef]
10. Edwards, R.; Dixon, D.P.; Walbot, V. Plant glutathione S-transferases: Enzymes with multiple functions insickness and in health. Trends Plant. Sci. 2000, 5, 193–198. [CrossRef]
11. Dixon, D.P.; Lapthorn, A.; Edwards, R. Plant glutathione transferases. Genome Biol. 2002, 3, reviews3004.[CrossRef]
12. Caccuri, A.M.; Lo Bello, M.; Nuccetelli, M.; Nicotra, M.; Rossi, P.; Antonini, G.; Federici, G.; Ricci, G. Protonrelease upon glutathione binding to glutathione transferase P1-1: Kinetic analysis of a multistep glutathionebinding process. Biochemistry 1998, 37, 3028–3034. [CrossRef] [PubMed]
13. Sheehan, D.; Meade, G.; Foley, V.M.; Dowd, C.A. Structure, function and evolution of glutathione transferases:Implications for classification of non-mammalian members of an ancient enzyme superfamily. Biochem. J.2001, 360, 1–16. [CrossRef] [PubMed]
14. Caccuri, A.M.; Antonini, G.; Board, P.G.; Parker, M.W.; Nicotra, M.; Lo Bello, M.; Federici, G.; Ricci, G. Protonrelease on binding of glutathione to alpha, Mu and Delta class glutathione transferases. Biochem. J. 1999, 344,419–425. [CrossRef] [PubMed]
15. Bartlett, D.W.; Clough, J.M.; Godwin, J.R.; Hall, A.A.; Hamer, M.; Parr-Dobrzanski, B. The strobilurinfungicides. Pest. Manage. Sci. 2002, 58, 649–662. [CrossRef] [PubMed]
16. Wolf, A.E.; Dietz, K.J.; Schroder, P. Degradation of glutathione S-conjugates by a carboxypeptidase in theplant vacuole. FEBS Lett. 1996, 384, 31–34. [CrossRef]
17. Beck, A.; Lendzian, K.; Oven, M.; Christmann, A.; Grill, E. Phytochelatin synthase catalyzes key step inturnover of glutathione conjugates. Phytochemistry 2003, 62, 423–431. [CrossRef]
18. Martin, M.N.; Slovin, J.P. Purified gamma-glutamyl transpeptidases from tomato exhibit high affinity forglutathione and glutathione S-conjugates. Plant. Physiol. 2000, 122, 1417–1426. [CrossRef]
19. Huber, C.; Bartha, B.; Harpaintner, R.; Schroder, P. Metabolism of acetaminophen (paracetamol) in plants–twoindependent pathways result in the formation of a glutathione and a glucose conjugate. Environ. Sci. Pollut.Res. Int. 2009, 16, 206–213. [CrossRef]
20. Murphy, C.M.; Fenselau, C.; Gutierrez, P.L. Fragmentation characteristic of glutathione conjugates activatedby high-energy collisions. J. Am. Soc. Mass Spectr. 1992, 3, 815–822. [CrossRef]
21. Jian, W.; Liu, H.-F.; Zhao, W.; Jones, E.; Zhu, M. Simultaneous Screening of Glutathione and Cyanide AdductsUsing Precursor Ion and Neutral Loss Scans-Dependent Product Ion Spectral Acquisition and Data MiningTools. J. Am. Soc. Mass Spectr. 2012, 23, 964–976. [CrossRef]
Molecules 2019, 24, 2473 14 of 14
22. Kassahun, K.; Davis, M.; Hu, P.; Martin, B.; Baillie, T. Biotransformation of the Naturally OccurringIsothiocyanate Sulforaphane in the Rat: Identification of Phase I Metabolites and Glutathione Conjugates.Chem. Res. Toxicol. 1997, 10, 1228–1233. [CrossRef] [PubMed]
23. Mali’n, T.J.; Lindberg, S.; Åstot, C. Novel glutathione conjugates of phenyl isocyanate identified byultra-performance liquid chromatography/electrospray ionization mass spectrometry and nuclear magneticresonance. J. Mass Spectr. 2014, 49, 68–79. [CrossRef]
24. Mueller, L.N.; Brusniak, M.-Y.; Mani, D.R.; Aebersold, R. An Assessment of Software Solutions for theAnalysis of Mass Spectrometry Based Quantitative Proteomics Data. J. Proteome Res. 2008, 7, 51–61. [CrossRef][PubMed]
25. Vogel, C.; Marcotte, E.M. Label-Free Protein Quantitation Using Weighted Spectral Counting. In QuantitativeMethods in Proteomics; Marcus, K., Ed.; Humana Press: Totowa, NJ, USA, 2012; pp. 321–341.
Sample Availability: Samples of the compounds are not available from the authors.
© 2019 by the authors. Licensee MDPI, Basel, Switzerland. This article is an open accessarticle distributed under the terms and conditions of the Creative Commons Attribution(CC BY) license (http://creativecommons.org/licenses/by/4.0/).