metabolic pathways of deep groundwater microbiomes and ... · may have been catalysing the...
TRANSCRIPT

Metabolic Pathways of Deep Groundwater Microbiomes and Sulphide Formation at Olkiluoto
Wo
rk
ing
Re
po
rt 2
01
6-5
1 •
Co
mp
ilatio
n a
nd
An
aly
sis
of H
yd
ro
ge
olo
gic
al R
es
po
ns
es
to
Fie
ld A
ctiv
itie
s in
Olk
iluo
to
Du
rin
g
20
13
–2
01
4
POSIVA OY
Olki luoto
FI-27160 EURAJOKI, F INLAND
Phone (02) 8372 31 (nat. ) , (+358-2-) 8372 31 ( int. )
Fax (02) 8372 3809 (nat. ) , (+358-2-) 8372 3809 ( int. )
October 2017
Working Report 2017-11
P. Blomberg, M. Itävaara, K. Marjamaa, H. Salavirta,
M. Arvas, H. Miett inen, M. Vikman


November 2017
Working Reports contain information on work in progress
or pending completion.
P. Blomberg, M. Itävaara, K. Marjamaa, H. Salavirta,
M. Arvas, H. Miett inen, M. Vikman
VTT
Working Report 2017-11
Metabolic Pathways of Deep Groundwater Microbiomes and Sulphide Formation at Olkiluoto


METABOLIC PATHWAYS OF DEEP GROUDWATER MICROBIOMES AND SULPHIDE FORMATION AT OLKILUOTO
ABSTRACT This work is connected to Olkiluoto microbiological site characterization studies at the final disposal site of high radioactive wastes. The aim was to discover the mechanisms of sulphide-formation in deep subsurface groundwaters in Olkiluoto. Geomicrobes have an important role in the transformation of minerals, in the decomposition and biosynthesis of organic compounds, and in the chemical changes of the groundwater composition. Microbial metabolic pathways and genes connected to these processes can therefore be used to monitor geobiological cycles. In order to study the sulphide-formation in two groundwater samples (OL-KR6/125−130 m with high sulphate concentration and no sulphides and OL-KR13/404.5−405.5 m with low sulphate concentration but high sulphide concentration), metagenomic and metatranscriptomic analyses were performed. Microbial diversity analyses were performed to tentatively relate the geomicrobiological processes and metabolic pathways with the organisms catalysing them. The deep groundwater microbial biomass was filtered, DNA and mRNA extracted and sequenced. Proteins were predicted and metabolic pathways were studied based on the comparison of expressed genes (metatrancriptomes) to genes (metagenomes). The metabolism of the multispecies microbial communities, here called microbiomes, were very complex. All species in the microbiome were dependent on each other’s metabolism and on the prevailing physicochemical environmental conditions and available electron acceptors and donors. Microbial metabolic pathways associated with geobiological cycles were studied. The analyses focused on the metabolism of nitrogen, sulphur, iron and carbon (methane and CO2). Sulphate-reduction occurred by several routes. The metabolic pathways for both assimilatory and dissimilatory sulphate-reduction were active in both samples. Although several sulphate-reducing organisms were present in both samples, bacteria typically associated with the oxidation of sulphur compounds were most abundant. These bacteria may have been catalysing the oxidation of hydrogen sulphide to zero-valent sulphur, e.g. intracellular polysulphide, or catalysing the net disproportionation of zero-valent sulphur to sulphate and hydrogen sulphide. Nitrogen and sulphur cycles connect to each other in several ways. E.g. nitrite as an electron acceptor can compete with sulphate. Furthermore, some of the enzymes in nitrogen metabolism were structurally and/or functionally similar to some of the enzymes in sulphur metabolism. Nitrogen fixation was the most active metabolic route for nitrogen utilization, transforming molecular nitrogen into ammonium. Although nitrification was not detected, both samples revealed active pathways for the consumption of nitrate and nitrite.
Sulphur-reduction requires an electron donor such as hydrogen gas, methane, or organic carbon originating from dead biomass, all of which were deemed probable in these two samples. The difference in sulphide accumulation into groundwater in the studied samples may be a result of the following observations. The archaea in OL-KR13/404.5−405.5 m were dominated by methanogens (methane-producing organisms), while the archaea in OL-KR6/125−130 m were dominated by methanotrophs (methane-consuming organisms), although methanogens were also present. OL-KR6/125−130 m exclusively contained a large amount of direct methane-oxidizing organisms, thus indicating access to a yet unidentified electron acceptor. OL-KR13/404.5−405.5 m contained a larger fraction of anaerobic methane oxidizers utilizing reverse methanogenesis for the consumption of methane. ANME-2 archaea and syntrophic bacteria were found abundantly in both samples, but more abundantly in OL-KR13/404.5−405.5 m. The OL-KR6/125−130 m groundwater contained a significant amount of soluble iron(II), which would have precipitated any free sulphide, thus removing it from the groundwater. As a conclusion; Metabolic pathways connected to anaerobic methane oxidation, reverse methanogenesis in particular, were abundant in both samples, which may indicate a role for methane as a carbon source and an electron donor for the reduction of sulphate to sulphide in Olkiluoto groundwater. This finding is not lessened or contradicted by methane also being produced in these microbial communities. Keywords: sulphate reduction, sulphide formation, deep groundwater, geomicrobiology, metabolic pathways, metagenomics, metatranscriptomics
GEOMIKROBIEN AINEENVAIHDUNTAREITIT JA SULFIDIN MUODOSTUMI-NEN OLKILUODON SYVISSÄ POHJAVESISSÄ
TIIVISTELMÄ
Tämä työ on osa Olkiluodon mikrobiologista paikkatutkimusta liittyen korkea-aktiivisen ydinjätteen loppusijoitukseen. Työn tavoitteena on selvittää sulfidin muodostumiseen liittyviä mekanismeja Olkiluodon syvissä pohjavesissä. Geomikrobeilla on tärkeä merkitys mineraalien globaalissa kierrossa, niiden muuntamisessa orgaanisiksi yhdisteiksi sekä hyödyntämisessä energiana hapetus/pelkistysreaktioissa. Geobiologisia kiertoja voidaan tämän vuoksi tutkia mikrobien aineenvaihdunnan ja geenien avulla. Sulfidien muodostumisen selvittämiseksi metagenomiikka- ja metatranskriptomiikka-tutkimusta sovellettiin geomikrobiologisten prosessien ja aineenvaihduntareittien selvittämiseksi kahden pohjavesinäytteen (OL-KR6/125−130 m, paljon sulfaattia ja ei sulfidia; OL-KR13/405.5−414.5 m, vähän sulfaattia ja paljon sulfidia) tutkimisessa. Syvien pohjavesien mikrobibiomassa suodatettiin, DNA ja mRNA eristettiin ja sekvensoitiin. Proteiinit ennustettiin ja aineenvaihduntareitit tutkittiin vertaamalla aktivoituneita geenejä (metatranskriptomiikka) koko genomitietoon (metagenomiikka). Monilajisen mikrobiyhteisön (mikrobiomi) aineenvaihdunta on hyvin monimutkainen. Yksittäiset mikrobit mikrobiyhteisössä ovat riippuvaisia toistensa aineenvaihdunnan tuotteista ja vallitsevista fysikokemiallisista olosuhteista sekä saatavilla olevista elektronien vastaanottajista ja luovuttajista. Työssä tutkittiin geobiokemiallisiin kiertoihin liittyviä mikrobien aineenvaihduntareittejä keskittyen erityisesti typen, rikin ja hiilen kiertoon (sisältäen metaanin ja hiilidioksidin kierron). Aineenvaihduntareittien tarkastelussa todettiin aktiivinen sulfaatin ja typen kuljetus solujen ulkopuolelta soluihin. Typenkierrossa aktiivisin aineenvaihduntareitti oli typen fiksaatio, jossa molekulaarinen typpi muuntuu ammoniumtypeksi. Sen sijaan nitrifikaatiota ei todettu. Typen ja rikin kierto liittyvät toisiinsa ja nitriitti voi esimerkiksi kilpailla sulfaatin kanssa elektronin vastaanottajana. Tämä on erityisen merkittävää anaerobisessa metaanin hapetuksessa, jossa metaania hapettavat ja sulfaattia pelkistävät mikrobit toimivat syntrofisesti eli vuorovaikutteisesti vastaanottaen toisiltaan elektroneja anaerobisessa metaanin hapetuksessa, jossa muodostuu sulfideja. Biologinen sulfaatin pelkistyminen voi tapahtua useiden aineenvaihduntareittien kautta. Aktiivinen assimiloiva ja dissimiloiva sulfaatin pelkistys todettiin molemmissa näytteissä, joten molemmissa näytteissä muodostui myös sulfidia. Tämä nähtiin myös diversiteettitutkimuksessa, jossa todettiin sulfaatinpelkistäjiä molemmissa näytteissä. Sulfidin erilainen kertyminen pohjaveteen tutkituissa näytteissä saattaa johtua useista seuraavassa esitetyistä tekijöistä. Molemmissa näytteissä todettiin suuri määrä metaanin hapettajia eli metanotrofeja. OL-KR13/405.5−414.5 m näytteessä, jossa oli suuri sulfidipitoisuus, todettiin runsaasti metaanin hapettajiin kuuluvia ANME-2 arkeoneja, joita esiintyi jonkin verran myös aerobisten metanotrofien lisäksi OL-KR6/125−130 m näytteessä. Nämä arkeonit toimivat syntrofisesti pääasiassa nitriitin pelkistäjien kanssa. Nitriitin puutteessa arkeonit voivat käyttää sulfaatteja elektronien vastaanottajana, jolloin sulfaatti pelkistyy sulfideiksi.

Geokemian mukaan OL-KR6/125−130 m kairareiässä on enemmän vapaata rautaa ja mangaania kuin OL-KR13/405.5−414.5 m kairareiässä. Tämä voi johtaa rautasulfidin eli pyriitin saostumiseen, jolloin vapaa sulfidi poistuu vedestä. Lisäksi OL-KR6/125−130 m näytteessä sulfidit voivat hapettua mikrobiologisesti, ja/tai ne voivat muuntua polysulfidiksi ja tiosulfaatiksi, jotka varastoituvat mikrobisoluihin. Tätä tapahtui kuitenkin molemmissa mikrobiomeissa. Johtopäätöksenä voidaan todeta, että molemmissa näytteissä esiintyi runsaasti metaanin hapetukseen sekä reversiibeliin metanogeneesiin liittyviä aineenvaihduntareittejä. Lisäksi molemmissa näytteissä oli aktiivinen sulfaatin pelkistyminen käynnissä. Tämä voi olla osoitus siitä, että metaani toimii sekä hiilenlähteenä että elektronien luovuttajana sulfaatin pelkistymisessä sulfidiksi Olkiluodon pohjavedessä. Avainsanat: sulfaatin pelkistyminen, sulfidien muodostuminen, syvät pohjavedet, geomikrobiologia, aineenvaihduntareitit, metagenomiikka, metatranskriptomiikka.
1
TABLE OF CONTENTS
ABSTRACT TIIVISTELMÄ
GLOSSARY .......................................................................................................................... 3 PREFACE ............................................................................................................................ 7 1 INTRODUCTION .......................................................................................................... 9 2 BACKGROUND OF MICROBIOLOGICAL SULPHUR CYCLE IN GROUNDWATER .. 13
2.1 Sulphate and sulphide concentrations in deep groundwaters of the Fennoscandian Shield .................................................................................. 13 2.2 Microbial sulphur metabolism and sulphide formation ................................... 13 2.3 Oxidation ...................................................................................................... 14 2.4 Reduction ..................................................................................................... 15 2.5 Disproportionation......................................................................................... 15 2.6 Disulphide respiration ................................................................................... 16 2.7 Others ........................................................................................................... 16
3 SYNTROPHY AND CO-OCCURRENCE WITH METHANE OXIDATION .................... 17 4 MICROBIOME META-ANALYSES .............................................................................. 19
4.1 Gene prediction and functional annotation .................................................... 19 4.2 Metabolic pathway analysis based on meta’omics’ ....................................... 20
5 AIMS ........................................................................................................................... 23 6 MATERIALS AND METHODS .................................................................................... 25
6.1 Hydrogeochemistry ....................................................................................... 25 6.2 Microbiological analyses ............................................................................... 25 6.2.1 Sampling the drillholes OL-KR13 and OL-KR6 in Olkiluoto .................... 26 6.2.2 Total Number of Cells (TNC) ................................................................. 26 6.2.3 Nucleic acid isolation ............................................................................. 27 6.2.4 Real-time quantitative PCR (qPCR) ....................................................... 27 6.2.5 DNA sequencing of metagenomes ........................................................ 28 6.2.6 RNA sequencing of metatranscriptomes ................................................ 29 6.3 Bioinformatics ............................................................................................... 29 6.3.1 Sequence processing ............................................................................ 29 6.3.2 Quality control and assembly of sequence data ..................................... 30 6.3.3 Gene prediction, taxonomic and functional annotation ........................... 31 6.3.4 Grouping genes based on annotations .................................................. 31 6.4 Metabolic analyses ....................................................................................... 31 6.4.1 Pathway maps ....................................................................................... 32 6.4.2 Metabolic processes .............................................................................. 33
7 RESULTS ................................................................................................................... 35 7.1 Hydrogeochemistry ....................................................................................... 35 7.1.1 Mineralogy ............................................................................................. 36 7.2 Microbiological and meta’omics’ analysis ...................................................... 37 7.2.1 Enumeration of microbial cells ............................................................... 37 7.2.2 DNA and RNA isolations ........................................................................ 37 7.2.3 Quantitative PCR ................................................................................... 38 7.2.4 DNA and RNA sample quality, assembly and quantitative statistics ....... 40 7.2.5 Species abundance - domains ............................................................... 43 7.2.6 Species abundance - bacteria ............................................................... 45 7.2.7 Species abundance - archaea ............................................................... 46 7.2.8 Metabolic annotations ............................................................................ 48 7.3 Metabolic analyses ....................................................................................... 49
2
7.3.1 Sulphur metabolism ............................................................................... 50 7.3.2 Nitrogen metabolism .............................................................................. 53 7.3.3 Methane metabolism and carbon fixation ............................................... 57 7.3.4 Hydrogen ............................................................................................... 63 7.3.5 Iron ........................................................................................................ 64 7.3.6 Other pathways ..................................................................................... 65
8 DISCUSSION ............................................................................................................. 67 8.1 Overview ...................................................................................................... 67 8.2 Nitrogen ........................................................................................................ 68 8.3 Iron ............................................................................................................... 69 8.4 Sulphur ......................................................................................................... 69 8.5 Methane and carbon dioxide fixation ............................................................ 72 8.6 Reconciliating who and what ........................................................................ 73 8.6.1 OL-KR6/125−130 m ............................................................................... 73 8.6.2 OL-KR13/405.5−414.5 m ....................................................................... 75 8.7 Uncertainties ................................................................................................. 77
9 CONCLUSIONS ......................................................................................................... 81 10 REFERENCES ........................................................................................................... 85 APPENDIX A. TAXONOMY BASED ON KEGG PROTEIN DATABASE ............................. 95 APPENDIX B. BACTERIAL TAXONOMY BASED ON KEGG PROTEIN DATABASE ........ 97 APPENDIX C. ARCHAEAL TAXONOMY BASED ON KEGG PROTEIN DATABASE ......... 99 APPENDIX D. METABOLIC ANALYSES RELATED TO METABOLIC PROCESSES ...... 101 APPENDIX E. WRITTEN METABOLIC ANALYSES RELATED TO ENZYME FUNCTIONS IN OL-KR6/125−130 M AND OL-KR13/405.5−414.5 M .................................................... 109 APPENDIX F. METABOLIC ANALYSES RELATED TO ENZYME FUNCTIONS IN OL- KR6/125−130 M ............................................................................................................... 111 APPENDIX G. METABOLIC ANALYSES RELATED TO ENZYME FUNCTIONS IN OL- KR13/405.5−414.5 M ........................................................................................................ 113 APPENDIX H. METABOLIC ANALYSES RELATED TO KEGG ORTHOLOGY NUMBERS ....................................................................................................................... 115 APPENDIX I. KEGG PATHWAY MAP 02010 ................................................................... 119 APPENDIX J. KEGG PATHWAY MAP 00300 .................................................................. 121 APPENDIX K. KEGG PATHWAY MAP 00330 .................................................................. 123 APPENDIX L. KEGG PATHWAY MAP 00310 .................................................................. 125 APPENDIX M. KEGG PATHWAY MAP 00270 ................................................................. 127 APPENDIX N. KEGG PATHWAY MAP 00790 .................................................................. 129 APPENDIX O. KEGG PATHWAY MAP 00020 ................................................................. 131 APPENDIX P. KEGG PATHWAY MAP 00240 .................................................................. 133 APPENDIX Q. KEGG PATHWAY MAP 00550 ................................................................. 135 APPENDIX R. KEGG PATHWAY MAP 00500 .................................................................. 137 APPENDIX S. KEGG PATHWAY MAP 00540 .................................................................. 139 APPENDIX T. KEGG PATHWAY MAP 00480 .................................................................. 141 APPENDIX U. KEGG PATHWAY MAP 02040 .................................................................. 143 APPENDIX V. KEGG PATHWAY MAP 02030 .................................................................. 145 APPENDIX X. KEGG PATHWAY MAP 00633 .................................................................. 147 APPENDIX Y. KEGG PATHWAY MAP 00450 .................................................................. 149

3
GLOSSARY
amoA a gene involved in the oxidation of ammonia to hydroxylamine, used as a
marker gene for the detection of ammonia oxidation bacteria ANME ANaerobic Methane-oxidising archaea Annotation A process of assigning database identifiers to sequences based on matching
the sequence being annotated with known gene sequences in a sequence database. Database identifiers may be KEGG gene identifier, KEGG orthology (KO) number, Enzyme Commission (EC) number, KEGG module (MD) identifier, and KEGG pathway map (PW).
ASR Assimilatory sulphate reduction (metabolic process) Apr APS reductase enzyme Asr Assimilatory sulphite reductase enzyme asrA, asrB Genes encoding anaerobic sulphite reductase Assembly A process where short reads are aligned into longer contigs. Assimilation
the conversion of absorbed nutrients into the substance of the cell in constructive metabolism
ATP Adenosine triphosphate Binning A process of grouping sequences and calculating summary properties, e.g.
DNA and RNA coverages, for the group. The group is thereafter called the bin.
bp base pair cDNA Complementary DNA; the DNA complement of RNA. The cDNA is
sequenced in metatranscriptomics. Contig A sequence formed during the assembly of short reads into longer
sequences. cysJ, cysI Genes encoding Asr DAPI 4’,6-diamidino-2-phenylindole
4
Disproportionation a process in which compound is simultaneously reduced and oxidised to form two different products
Dissimilation
anaerobic respiratory energy producing reactions DNA a nucleic acid that contains the genetic instructions used in the development
and functioning of all known living organisms DSR Dissimilatory sulphate reduction (metabolic process) Dsr Dissimilatory sulphite reductase enzyme dsrA, dsrB Genes encoding Dsr, a gene involved in sulphate reduction, used as a
marker gene for the detection of sulphate-reducing bacteria EC Enzyme Commission number, a classification systems for enzymatic functions. Heterotropic
microbes using organic compounds as a source of energy and carbon. KEGG Kyoto Encyclopedia of Genes and Genomes, a database of metabolic genes
(KO), reactions, EC numbers, modules (MD), pathways and their relations. KO KEGG Orthology numbers are a classification system for enzyme functions.
They group genes of the same evolutionary origin carrying out the same metabolic function together such as “K00394: adenylylsulphate reductase, subunit A”.
mcrA a gene involved in the production of methane and used as a marker gene for
the detection of methanogens. MD KEGG Module indentifier. Collections of enzymatic functions i.e. modules
which group genes and enzymatic reactions carried out by them together to perform a common metabolic process.
Module Group of enzymes related to the same metabolic process. See MD mRNA messenger RNA NAD, NADH Oxidised (NAD) and reduced (NADH) nicotinamide adenine dinucleotide NADP Oxidised nicotinamide adenine dinucleotide phosphate NADPH Reduced nicotinamide adenine dinucleotide phosphate

5
narG a gene involved in nitrate reduction, used as a marker gene for the detection
of nitrate to nitrite-reducing bacteria ORF Open reading frame; a sequence of DNA beginning with a start sequence
and ending with a stop sequence. The start sequence determines where, i.e. in which frame, transcription to mRNA begins. A DNA sequence with the potential to code for a protein.
OTU Operational taxonomic unit, concept used in hierarchial classification when
pre-defined groups are being compared. Here, used to indicate groups of sequences or species, which share a defined degree of similarity
PAPS 3'-phosphoadenylyl sulphate, metabolic intermediate in the assimilatory
sulphate reduction pathway PCR polymerase chain reaction, amplification method for fragments of DNA pmoA a gene involved in methane oxidation, marker gene for detection of
methanotrophic microbes PW KEGG pathway map identifier qPCR quantitative polymerase chain reaction RNA ribonucleic acid, polymeric molecule involved in expression of genes RN KEGG KEGG Reaction numbers are unique identifier for metabolic reactions in seq A sequence of nucleotides SRB Sulphate-reducing bacteria SSU small subunit Syntrophy A phenomenon where two species live off the metabolic products of each
other such than they perform a net reaction neither of them could perform on their own
TNC Total number of cells

6

7
PREFACE
The work was carried out at VTT Technical Research Centre of Finland, Ltd. The contact person at Posiva Oy was Tiina Lamminmäki and at VTT Merja Itävaara. The research work at VTT was done by research scientists; Peter Blomberg, Kaisa Marjamaa, Heikki Salavirta, Hanna Miettinen, Mikko Arvas, Minna Vikman Merja Itävaara Mirva Pyrhönen Laboratory technician, performed the qPCR analysis Sequencing was performed as contract at Biomedicum, Finland.

8
9
1 INTRODUCTION
The Fennocandian Shield in the Olkiluoto region is one of the most well-characterized geological sites until ca 1000 m depth. Hydrogeochemical monitoring has been ongoing for years at Olkiluoto (Posiva, 2012). The major reason for monitoring has been to study the stability of and potential changes in geochemistry and gas composition (Pitkanen et al., 2001; Posiva, 2012). In the year 2016, the Olkiluoto island contained 57 drillholes, of which the majority have been multipacker-isolated in order to stabilize the water levels, i.e. to prevent water flow between the fractures in the bedrock and thus to avoid mixing of water (Wersin et al., 2014). Any mixing of water would affect both chemistry and microbiology and may accelerate processes which are considered adverse reactions, but would not be typical for stable hydrological conditions. Hydrogeochemical measurements include complete characterization of anions, cations, and dissolved gases, but also geophysical measurements (Posiva, 2012). Microbes may play an important role in geological repositories by biofilm formation, by catalysing mineral transformations, and by changing chemisty of the aqueous composition. Consequently, the research on microbiology has recently gained an important role in the monitoring program at Olkiluoto. The role of microbes has also been internationally acknowledged and is studied in the first, solely microbiological, project in the EURATOM program in a project titled MIND (The Microbiology In Nuclear waste Disposal, www.mind15.eu) (2015-2020). Terrestrial deep subsurface environmental conditions change from the surface oxygen containing conditions to increasingly reducing conditions with increasing depth. The deep subsurface microbes have developed diverse mechanisms for procurement of energy (Boettger et al., 2013; Lever et al., 2015; Wright et al., 2011). The use of different energy sources depends on their availability, which is affected by geological constraints, depth, and the presence of organic and inorganic compounds and gases in the lithosphere. Microbes can use both inorganic and organic energy sources (e.g. originating from the degradation of living organisms). Organic carbon sources can provide both energy and carbon (Itävaara et al., 2016a). The subsurface geological layers may receive dissolved organic carbon flow from the surface where the sun is the primary energy source. In addition, dead microbial biomass that forms as a consequence of the normal cycle of life provides organic carbon to the microbes, thereby also supporting the growth of heterotrophic microorganisms. The hydrocarbons (e.g. methane (CH4) and longer-chain hydrocarbons) that are present in deep Earth crust reservoirs can also feed microbial life. Geochemical energy in the form of hydrogen (H2) and minerals is generally considered the primary source of energy for deep subsurface microorganisms (Ahonen et al., 2011; Chivian et al., 2008; Fredrickson et al., 1997; Fredrickson and Balkwill, 2006; Gebert et al., 2011; Lin et al., 2014; Mayhew et al., 2013; McCollom and Amend, 2005; Meyer-Dombard et al., 2014; Pedersen, 2010, 2000, 2012). Hydrogen (H2) can be generated by abiotic and biotic reactions. Hydrogen production by abiotic reactions during water-rock -interactions is mediated at least by the following

10
processes: 1) radiolysis of water, 2) hydration of iron silicate minerals, and in particular, 3) hydration of ultramafic rocks (serpentinization) in the oceanic crust at the plate boundaries. In addition, hydrogen (H2) is reported to form as an intermediate compound together with volatile fatty acids in organic carbon biodegradation processes. (Mayhew et al., 2013) In addition to hydrogen (H2), methane (CH4) is present in the upper crust in variable quantities dissolved in groundwater. In the deep subsurface, the origin of methane (CH4) can be either biotic or abiotic. Methane-cycling microbes are essential members of deep subsurface microbiomes. Methanogens are present in the most nutrient-depleted deep anaerobic environments where all other electron acceptors, except carbon dioxide (CO2), have been depleted. They generate methane (CH4) and intermediate carbon compounds (acetate CH3COO-, butyrate CH3CH2CH2COO-, etc.), during anaerobic degradation of organic molecules (Itävaara et al., 2016a). Methanotrophs are methane-cycling microbes consuming methane (CH4) to gain energy and carbon. In the near-surface oxic/anoxic interface of the lithosphere, aerobic methanotrophs are involved in the oxidation of methane (CH4) to carbon dioxide (CO2), thus reducing methane-emissions into the atmosphere (Smith et al., 2007). Recent studies on deep groundwater microbiology at Olkiluoto have revealed unexpectedly wide diversity of species present in geological deep groundwaters (Bomberg et al., 2015; Miettinen et al., 2015a). The biodiversity of 19 deep drillholes ranging from 300 m to 1,000 m depths have been characterized for bacterial, archaeal, and fungal diversity (Bomberg et al., 2015; Miettinen et al., 2015a; Sohlberg et al., 2015). The studies revealed great variation in the diversity of microbial species, not only in different drillholes, but also at different depths (Miettinen et al., 2015a). The species diversity and variation is affected by availability of electron donors and acceptors which are due to geology, pressure, temperature and gases (Itävaara et al., 2011). Deep biosphere investigations of Outokumpu deep drillhole (2.5 km deep) during 2007-2012 provided conclusive information about the connection of deep subsurface microbiomes to geology, geochemisty and gas composition (Itävaara et al., 2011a, 2011b; Kietäväinen et al., 2013; Nyyssönen et al., 2014). The highest number of classified bacteria (Clostridia, Fusibacter, Peptococcaceae Natranaerobiaceae) occurred at 1400–1500m depth, which connects with the ophiolite-derived altered rock types (mainly serpentinite and diopside-tremolite rock). At this depth, elevated hydrogen and Mg2 concentrations were also observed (Nyyssönen et al., 2014). The reason for the higher diversity of microorganisms at 1400–1500m was estimated to be due to mineralogical properties of the rock and potentially due to the availability of hydrogen generated at 1500m depth (Kietäväinen et al., 2013). These studies were confirmed later in studies connected to fracture microbial diversity studies (Purkamo et al., 2015, 2013). The major focus of conducted microbiological studies has been on sulphate-reducing microorganisms and their capability and potential to produce highly-corrosive hydrogen sulphide (H2S). Therefore, the activity and function of these microorganisms has been especially well-studied. The molecular methods applied so far have provided information on the occurrence of known sulphur-metabolizing microbes and the essential genes coding for enzymes involved in these reactions. In this work, both the occurrence and the functionality of sulphur pathways in microbial communities harvested from two

11
Olkiluoto deep groundwater samples (having either high or low sulphide (HS-) content) were examined using microbiome meta-analyses. The analyses sought to provide information on microbial pathways involved in excessive and detectable quantities of sulphide-formation.

12
13
2 BACKGROUND OF MICROBIOLOGICAL SULPHUR CYCLE IN GROUNDWATER
2.1 Sulphate and sulphide concentrations in deep groundwaters of the Fennoscandian Shield
At Olkiluoto site a SO4-rich brackish water lies between 100 and 300 m depth that indicates an ancient seawater (Pitkänen et al., 1999). The sulphate (SO4
2-) concentrations ranged from negligible in the deep saline groundwater to several hundred milligrams per litre in sulphate-rich aquifers (Miettinen et al., 2015a; Pitkänen et al., 1999). The aqueous sulphide (HS-) amounts ranged from less than 0.01 mg L-1 to 0.6 mg L-1 and are controlled by insoluble mackinawite (FeS) or pyrite. (Pitkanen et al., 2001). However, in some groundwater samples elevated concentrations up to 12 mg L-1 have been detected. These high sulphide amounts are also constrained by FeS and they coincide with the transition zone from brackish to saline groundwaters. the monitoring data indicates relatively rapid decrease in concentrations (Wersin et al., 2014). Similar sulphate (SO4
2-) (200 mg L-1 to 400 mg L-1) and sulphide (HS-) (below detection to 3.3 mg L-1) concentrations have been detected in three drillhole waters (depths 170 m to 448 m) at the ÄSPÖ Hard Rock Laboratory located in South-Eastern Sweden (Wu et al., 2015). In the Pyhäsalmi mine in North Ostrobothnia, the drillholes deeper than 1,300 m depth contained also several hundred milligrams sulphate (SO4
2-) per litre and the amount of sulphide (HS-) ranged from 0.07 mg L-1 to 1.9 mg L-1 (Miettinen et al., 2015b). At the Outokumpu deep drillhole (total depth 2,500 m), sulphate (SO4
2-) could only be detected between 1,200 m and 1,500 m depth (13−17 mg L-1), and were at other depths below the detection limit for quantification. Sulphide (HS-) concentrations increased with the depth from below the detection limit (0.02 mg L-1) to a maximum amount of 0.64 mg L-1 detected at the deepest part of the drillhole (2,400 m depth) (Kietäväinen et al., 2013).
2.2 Microbial sulphur metabolism and sulphide formation
Sulphur has several oxidation states, from -II (completely reduced) to +VI (completely oxidized), and can be oxidized and reduced both chemically and biologically. In addition, the sulphur cycle is closely linked to other element cycles such as the carbon and nitrogen cycles. Microbial sulphur-utilization includes assimilatory processes that assimilate sulphur for incorporation into intracellular macromolecules and dissimilatory processes that generate energy through the oxidation or reduction of sulphur substrates. Dissimilatory sulphate reduction uses sulphate (SO4
2-) as an electron acceptor and produces sulphide (HS-). Electron donors may be e.g. organic compounds or hydrogen gas (H2). Sulphate-reducing organisms include bacteria and archaea. Sulphate-reducing organisms have been found abundantly from anaerobic deep groundwater environments, including Olkiluoto subsurface groundwater samples (Bomberg et al., 2015; Hallbeck and Pedersen, 2008; Itävaara et al., 2011b; Miettinen et al., 2015a; Pedersen, 2012; Wu et al., 2015). Microorganisms can also produce energy from sulphur-compounds by oxidation or disproportionation reactions. E.g. some Epsilonproteobacteria are known to oxidise reduced sulphur-compounds such as elemental sulphur and thiosulphate (S2O3
2-) with nitrate (NO3
-) as an electron acceptor (Grote et al., 2012; Handley et al., 2014). Such
14
sulphur-oxidising Epsilonproteobacteria were also found in deep subsurface groundwaters from the Fennoscandian Shield (Miettinen et al., 2015a; Wu et al., 2015). During disproportionation processes, a compound is simultaneously reduced and oxidised to form two different products. Disproproponation of elemental sulphur, thiosulphate (S2O3
2-), or sulphite (SO32-) may simultaneously form both sulphate (SO4
2-) and hydrogen sulphide (H2S) (Finster et al., 1998). Microorganisms catalysing such disproponation processes belong to the sulphate-reducing deltaproteobacteria. So far, studies indicate that these organisms mainly reverse part of the sulphate-reduction pathway during the net disproportionation phase (Finster et al., 1998). Sulphate-reducing bacteria are also known to grow syntrophically with other organisms and have therefore been under intensive study in connection to methane-oxidising organisms (Beal et al., 2009; Boetius et al., 2000; Haroon et al., 2013; Holler et al., 2011; Knittel and Boetius, 2009; Wehrmann et al., 2013). In addition, recent findings support the hypothesis that some ANME archaea contain the capability for sulphate-reduction (Milucka et al., 2012). Sulphur-oxidation and therefore also sulphur-reduction can proceed by a number of distinct routes. The number of relevant compounds, however, is quite limited. Sulphate (SO4
2-) can be reduced to sulphite (SO32-), which can be further reduced to sulphide (HS-
). Sulphide (HS-) can be oxidized to zero-valent sulphur (S0) or to sulphite (SO32-). Zero-
valent sulphur (S0) can appear both as thiosulphate(S2O32-)/polythionates or as sulphur
globules/polysulphides (also including disulphide (HS2-)). While polythionates and
polysulphides are readily reduced, only thiosulphate (S2O32-) and sulphite (SO3
2-) can be oxidized to sulphate (SO4
2-). Elemental sulphur (S8) can be activated by sulphide (HS-) to polysulphide (HSx
-) or by and organic thiol (RSH) to persulphide-sulphur (RSS-). The key reactions and enzymes are described in more detail in the following sections.
2.3 Oxidation
Sulphide oxidation may proceed via sulfide-quinone oxidoreductase (Sqr) or sulfide:flavocytochrome c oxidoreductase (Fcc). Sqr and Fcc produce elemental sulphur (sulphur globules), which has been shown, in the case of Sqr, to be preceded by the formation of aqueous polysulphides (Handley et al., 2014). Thus, the mechanism goes through persulphide-sulphur similarly as the oxidation of elemental sulphur in Acidithiobacillus ferrooxidans (Holmes, S., Bonnefoy, 2007) or the transmembrane transport of polysulphide aided by the sud protein (Kletzin et al., 2004). Acidophilic bacteria such as Acidithiobacillus ferrooxidans oxidise elemental sulphur by a system different from the majority of other bacteria, i.e. the zero-valent sulphur (S0) is transported into the periplasmic space as persulphide-sulphur where it is oxidized by sulfur dioxygenase to sulphite (SO3
2-) and further to sulfate (SO42-) by sulphite:ferricytochrome-
c oxidoreductase (sorB) (Holmes, S., Bonnefoy, 2007; Kletzin et al., 2004; Mendez-Garcia et al., 2015; Rabus et al., 2015a). The major (canonical) sulphur-oxidation paths in bacteria (sox) and archaea (sor) differ substantially in that the sox system acts on thiosulphate (SO3
2-) and the sor enzyme in
15
thermophilic archae oxidatively disproportionates zero-valent sulphur (S0) to sulphite (SO3
2-) and sulphide (HS-).
2.4 Reduction
Sulphate reduction to sulphite (SO32-) generally requires the enzymes ATP sulfurylase
also known as sulphate adenylyltransferase (sat) and APS reductase also known as adenylyl-sulfate reductase (apr). Apr can be connected to the membrane-associated quinone pool through quinone-interacting membrane-bound oxidoreductase (Qmo) (Rabus et al., 2015a). It has been proposed that ANME-2 organisms are capable of direct reduction of sulphate (SO4
2-) to sulphite (SO32-) without the use of ATP, which is needed
to activate sulphate (SO42-) in all other dissimilatory sulphate-reducing paths (Milucka et
al., 2012). Sulphite (SO32-) may be oxidised to sulphate (SO4
2-) by reversing the above pathway (apr + sat), thereby producing ATP by substrate-level phosphorylation (Mendez-Garcia et al., 2015), or via direct oxidation (sulphite:ferricytochrome-c oxidoreductase (sorB), sulphite:oxygen oxidoreductase, or sulphite: Fe(III) oxidoreductase). Thiosulphate reduction to sulphite (SO3
2-) and hydrogen sulphide (H2S) can be catalysed by the membrane-associated thiosulfate reductase (Phs). This reaction is also reversible. The reduction of sulphite (SO3
2-) to sulphide (HS-) is catalysed by assimilatory sulphite reductase (asr) or dissimilatory sulphite reductase (dsr). Their main difference is the redox cofactor used. Asr uses ferredoxin and dsr uses NAD(P)H; the main consequence being that asr produces sulphide (HS-) directly, while dsr may produce thiosulphate (S2O3
2-) or trithionate (S3O62-) with limited supply of redox cofactors (Rabus
et al., 2015a). Dsr may be connected to the membrane-associated quinone pool by DsrMK (Rabus et al., 2015a). Dsr (possibly not on its own) is also capable of reducing both thiosulphate (S2O3
2-) and trithionate (S3O62-) (Rabus et al., 2015a).
A membrane-bound polysulfide reductase (Psr) in Sulfurovum sp. NBC37-1 catalyze the anaerobic reduction of polysulphides leading to formation of hydrogen sulphide (H2S) (Handley et al., 2014; Rabus et al., 2015a). Tetrasulphide (S4
2-) and pentasulphide (S5
2-) are the predominant species of polysulphide at pH > 6 (Hedderich et al., 1998). Polysulphides (and elemental sulphur) can also be reduced by hydrogen (H2) in a reaction catalysed by sulfhydrogenase (hydABDG), with concomitant production of hydrogen sulphide (H2S). Sulphate transport across the cell membrane might be facilitated by the ABC transporter SulT or by sulphate permease SulP (Mendez-Garcia et al., 2015; Rabus et al., 2015a). The ABC transporter consumes ATP and may either import or export sulphate (SO4
2-).
2.5 Disproportionation
Most sulphate-reducers can also reduce or disproportionate thiosulphate (S2O32-) and
sulphite (SO32-) (Finster, 2008; Rabus et al., 2015a). The reaction catalysed by dsr
enzymes. In the presence of thiosulphate (S2O32-), sulphate-reduction is inhibited (Rabus
et al., 2015a). The disproportionation of thiosulphate (S2O32-) (to sulphate (SO4
2) and
16
sulphide (HS-) and sulphite (SO32-) (to sulphate (SO4
2-) and sulphide (HS-) are both exergonic at standard conditions, whereas the disproportionation of elemental sulphur (to sulphate (SO4
2-) and sulphide (HS-) is endergonic and is only thermodynamically favourable under environmental conditions where the sulphide (HS-) produced is scavenged by iron and manganese oxides (Rabus et al., 2015a). Tetrathionate hydrolase catalyses the disproportionation of tetrathionate to sulphate (SO4
2-), thiosulphate (S2O32-), and zero-valent sulphur (S0) (Holmes, S., Bonnefoy, 2007).
Tetrathionate is produced from thiosulphate (S2O32-) by thiosulphate:quinone
oxidoreductase (Holmes, S., Bonnefoy, 2007; Kletzin et al., 2004). Together with spontaneous sulphur-transfering reactions, these disproportionation reactions and oxidoreductases can catalyse the net oxidation or reduction of zero-valent sulphur (S0) and sulphide (HS-).
2.6 Disulphide respiration
Disulphide-respiration is rare even among sulphate-reducing organisms, but Desulfuromonas acetoxidans and Pyrobaculum islandicum can grow on cysteine or oxidised glutathione as electron acceptors (Hedderich et al., 1998). In contrast to organisms using an external disulphide as their electron acceptor for respiration, methanogenic archaea generate a disulphide in the final step of methanogenesis and use this disulphide as the terminal electron acceptor of the respiratory chain (Hedderich et al., 1998). Several methanogenic paths are known to be reversible at suitable conditions (e.g. high excess of methane (CH4) and very low reduction potential of solutes in the aqueous liquid). Inorganic disulphide (HS2
-) may also be disproportionated into sulphate (SO42-)
and sulphide (HS-) by deltaproteobacteria expressing Sat, Apr, and Dsr (Milucka et al., 2012).
2.7 Others
Thiocyanate (NCS-) represents a one-carbon compound containing a sulfane atom, which can be spontaneously produced by the combination of reduced sulphur-compounds and cyanide (CN-) (Sorokin and Kuenen, 2005). The reaction may also be catalysed by sulphur-transferases such as the Sud protein in Wolinella succinogenes (Hedderich et al., 1998).

17
3 SYNTROPHY AND CO-OCCURRENCE WITH METHANE OXIDATION
Aerobic methane-oxidation can be coupled to denitrification by synthrophic partnerships of methanotrophs and denitrifiers, or they can occur in the same organism (Rabus et al., 2015a; Zhu et al., 2016). Anaerobic methane-oxidation can be coupled to sulphate-reduction by syntrophic partnerships of methanotrophs and sulphate-reducers, but the two processes can occur in the same organism (Joye, 2012; Milucka et al., 2012; Rabus et al., 2015a). Sulphate-reducers Deltaproteobacteria, Desulfosarcina, and Desulfococcus have often been detected to be associated with anaerobic methane-oxidisers from ANME-1 and ANME-2 groups (Knittel and Boetius, 2009). In addition, ANME-2d archaea have been demonstrated to grow syntrophically with ammonia-oxidisers in an anaerobic environment (Haroon et al., 2013). ANME-3 archaea are typically associated with Desulfobulbus -type sulphate-reducers (Knittel and Boetius, 2009). Methanomirabilis oxyfera, the only bacterial representative of all known anaerobic methane-oxidisers, reduces nitrite (NO2
-) while simultaneously producing oxygen (O2), which was then used in aerobic oxidation of methane (CH4) (Ettwig et al., 2010). Other electron acceptors such as iron and manganese in oxide minerals can also be used as terminal electron acceptors for anaerobic methane-oxidation (Beal et al., 2009). Terminal electron acceptors in anaerobic methane-oxidation can be:
Nitrate 5 CH4 + 8 NO3- + 8 H+ 5 CO2 + 4 N2 + 14 H2O
Nitrite 3 CH4 + 8 NO2- + 8 H+ 3 CO2 + 4 N2 + 10 H2O
Iron CH4 + 8 Fe(OH)3 + 15 H+ HCO3- + 8 Fe2+ + 21 H2O
Manganese CH4 + 4 MnO2 + 7 H+ HCO3- + 4 Mn2+ + 5 H2O
Sulphate CH4 + SO42- HS- + HCO3
- + H2O

18

19
4 MICROBIOME META-ANALYSES
Metagenomics and metatranscriptomics represent molecular methods designed to analyse the biodiversity and metabolic functions (Abram, 2015) of microbial communities (de Bruijn, 2011). The protocols rely on direct isolation of genetic material (DNA, RNA) from the biomass collected from the deep groundwater by filtration. While metagenomics (based on sequencing of DNA) reveal the genomic information representing all organisms and their metabolic capability present in an ecosystem, metatranscriptomics (based on sequencing of RNA) investigate gene expression e.g. activated genes and metabolic functions (Abram, 2015; Vieites et al., 2009). The RNA pool in cells consist of different types of RNA, of which messenger RNA (mRNA) is translated to proteins, including enzymes that catalyse most of the cellular reactions. As such, the transcriptome analysis often focuses on the mRNA sequence analysis. The majority of RNA in a cell is ribosomal RNA and not mRNA. For this reason, reduction of ribosomal RNA amount is an important step before sequencing to enrich mRNA in the sample. The RNA sample is most often reverse transcribed to obtain cDNA, which is then sequenced. Sequencing depth in a metagenomics and metatranscriptomics means that on average each base has been sequenced a certain number of times. However, in practise sequencing depth varies depending on the genomic region. The optimal sequencing depth depends on the purpose of the investigation. If the objective is to generate metagenomes of the most abundant species in a habitat, coverages can be as low as 3x for rare species and 10x for more abundant species of a community in environmental samples (Hua et al., 2015; Tyson et al., 2004). If the objective is to focus on microbial diversity, distribution, and biogeography, sampling rare taxa could be more important, and thus, deep sequencing with up to millions of reads per sample may be preferred (Vieites et al., 2009; Zhou et al., 2015). Organisms with relative abundances of 0.1% may perform functions essential to the entire community (Vieites et al., 2009).
4.1 Gene prediction and functional annotation
The major functional units of a genome are the genes transcribed from it. The process of transcription turns the DNA sequence of a gene into an RNA molecule that can be functional in it-self, i.e. carry out some specific task in the cell, or further be translated to a protein molecule. Both RNA and protein can carry out enzymatic, metabolic, functions in a cell. Overwhelming majority of cellular metabolic functions are carried out by proteins instead of RNAs. Also, currently the DNA gene sequences that are eventually turned into a protein i.e. protein coding genes, can be comprehensively and fast predicted from a genome sequence alone. In contrast prediction of merely RNA coding genes and therefore also their functional annotation is still not well developed. In functional annotation of protein coding genes their protein sequences are matched by sequence similarity searches to databases of functionally annotated genes. Use of protein sequence instead of DNA sequence gives these searches more sensitivity as the protein sequence is better conserved in evolution. A new protein sequence with high similarity to a protein of which function is known, is then expected to carry out the same function i.e. it is annotated with this function.
20
4.2 Metabolic pathway analysis based on meta’omics’
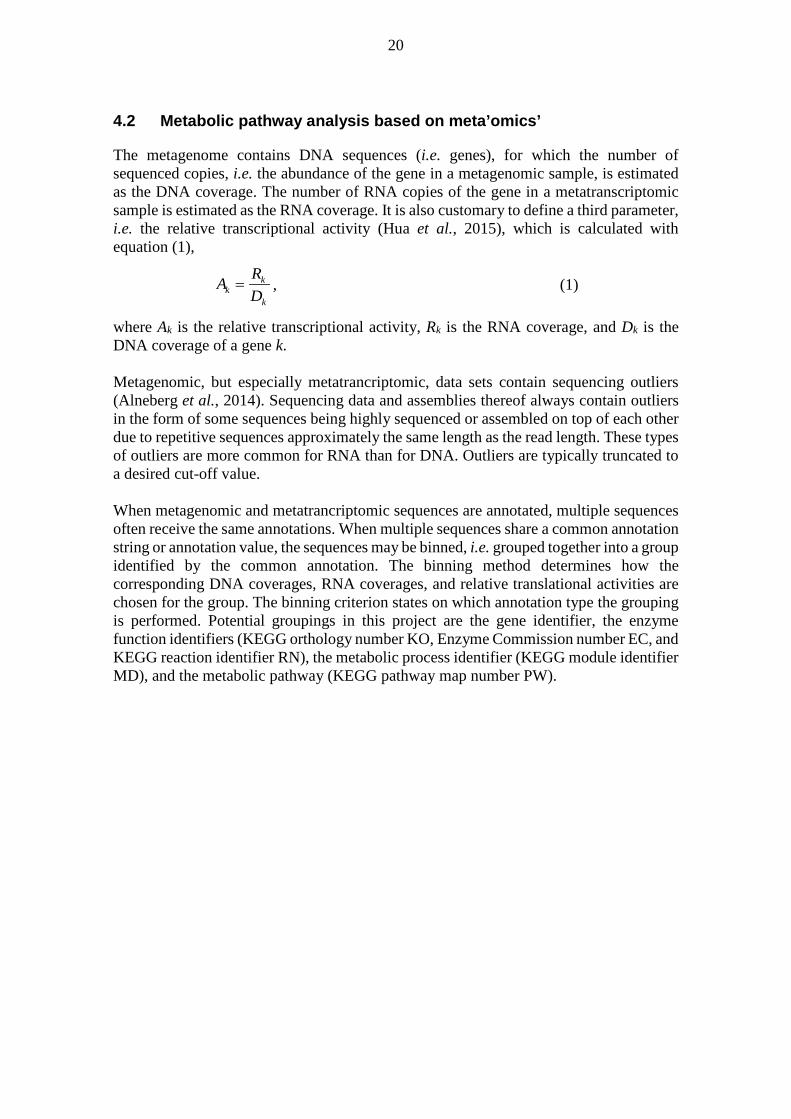
The metagenome contains DNA sequences (i.e. genes), for which the number of sequenced copies, i.e. the abundance of the gene in a metagenomic sample, is estimated as the DNA coverage. The number of RNA copies of the gene in a metatranscriptomic sample is estimated as the RNA coverage. It is also customary to define a third parameter, i.e. the relative transcriptional activity (Hua et al., 2015), which is calculated with equation (1),
, (1)
where Ak is the relative transcriptional activity, Rk is the RNA coverage, and Dk is the DNA coverage of a gene k. Metagenomic, but especially metatrancriptomic, data sets contain sequencing outliers (Alneberg et al., 2014). Sequencing data and assemblies thereof always contain outliers in the form of some sequences being highly sequenced or assembled on top of each other due to repetitive sequences approximately the same length as the read length. These types of outliers are more common for RNA than for DNA. Outliers are typically truncated to a desired cut-off value. When metagenomic and metatrancriptomic sequences are annotated, multiple sequences often receive the same annotations. When multiple sequences share a common annotation string or annotation value, the sequences may be binned, i.e. grouped together into a group identified by the common annotation. The binning method determines how the corresponding DNA coverages, RNA coverages, and relative translational activities are chosen for the group. The binning criterion states on which annotation type the grouping is performed. Potential groupings in this project are the gene identifier, the enzyme function identifiers (KEGG orthology number KO, Enzyme Commission number EC, and KEGG reaction identifier RN), the metabolic process identifier (KEGG module identifier MD), and the metabolic pathway (KEGG pathway map number PW).
kk
k
RAD
=

21
Figure 1. Relationships of various KEGG database entities. For example KEGG orthologous groups of genes K00956 (sulphate adenylyltransferase subunit 1) together with K00957 (sulphate adenylyltransferase subunit 2) or K00958 (sulphate adenylyltransferase) alone can carry out reaction R00529 (ATP:sulphate adenylyltransferase) where C00059 (sulphate) reacts with ATP to form C00224 (adenylyl sulphate). In the Enzyme Commission classification system, this reaction is denoted EC 2.7.7.4. KEGG modules are small linear metabolic pathways while KEGG pathways group modules and other enzymatic functions into larger networks.

22

23
5 AIMS
The major aim of this study was to determine which sulphide-forming processes were active, and potentially elucidate the mechanisms initiating sulphide-formation in deep groundwater by performing metabolic pathway analysis of the groundwater microbiomes. Two habitats from Olkiluoto drillholes (OL-KR6/125−135 m and OL-KR13/404.5−414.5 m) were selected by Posiva for analysis based on their hydrogeochemistry: Sulphate (SO4
2-) had been found at both locations, while sulphide-accumulation had been observed only in OL-KR13/404.5−414.5 m. As such, these habitats were suitable for studying microbial metabolism in sulphide-accumulating and sulphide-free deep ground waters.

24
25
6 MATERIALS AND METHODS
6.1 Hydrogeochemistry
The composition of groundwater and the mineral composition of the bedrock are needed to evaluate the hydrogeochemical potential of various net chemical processes catalysed by microbes. The mineralogy of the bedrock, the compositions of the groundwater samples, and the purgeable gases were provided by Posiva Oy.
6.2 Microbiological analyses
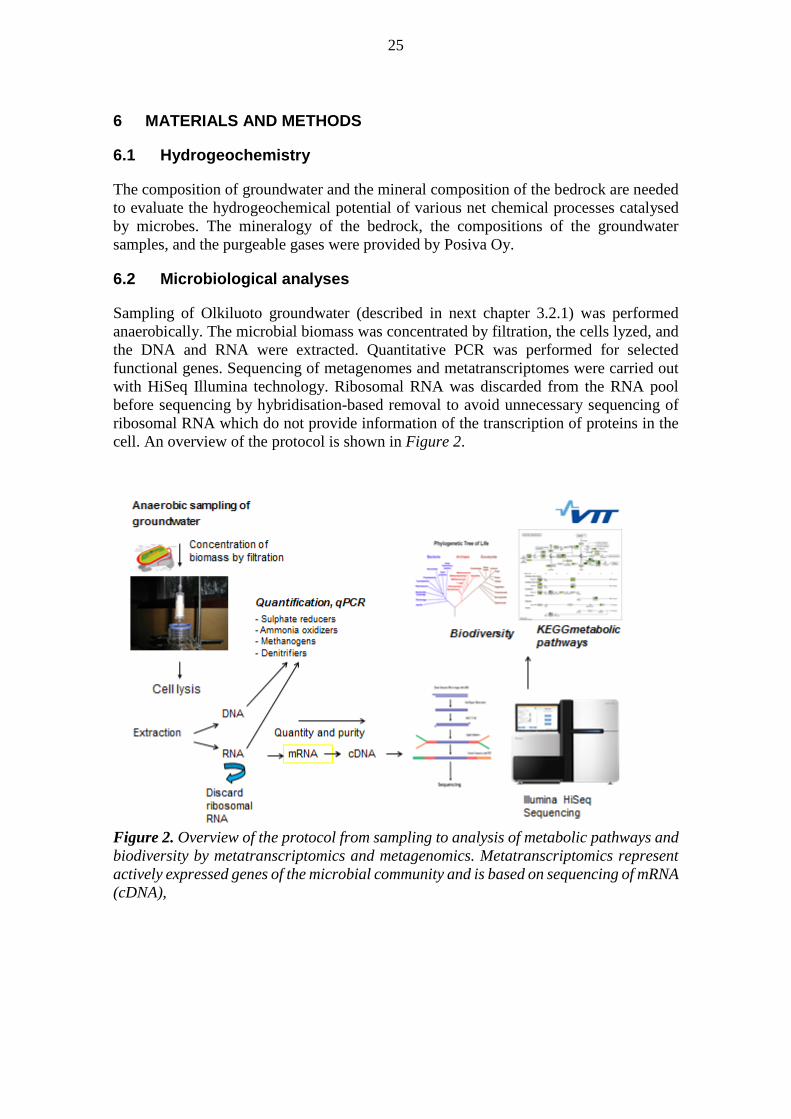
Sampling of Olkiluoto groundwater (described in next chapter 3.2.1) was performed anaerobically. The microbial biomass was concentrated by filtration, the cells lyzed, and the DNA and RNA were extracted. Quantitative PCR was performed for selected functional genes. Sequencing of metagenomes and metatranscriptomes were carried out with HiSeq Illumina technology. Ribosomal RNA was discarded from the RNA pool before sequencing by hybridisation-based removal to avoid unnecessary sequencing of ribosomal RNA which do not provide information of the transcription of proteins in the cell. An overview of the protocol is shown in Figure 2.
Figure 2. Overview of the protocol from sampling to analysis of metabolic pathways and biodiversity by metatranscriptomics and metagenomics. Metatranscriptomics represent actively expressed genes of the microbial community and is based on sequencing of mRNA (cDNA),

26
6.2.1 Sampling the drillholes OL-KR13 and OL-KR6 in Olkiluoto
The deep groundwater samples were collected from Olkiluoto area between December 2nd and 4th, 2014. The samples were collected from two multi-packered drillholes OL-KR6/125−135 m and OL-KR13/404.5−414.5 m. The water flow rates were 12 L h-1 from drillhole OL-KR6/125−130 m and 0.75 L h-1 from drillhole OL-KR13/404.5−414.5 m. The sampling section was packered-off in order to seal off a specific water-conducting fracture zone from the rest of the drillhole. These isolated fracture zones were purged by pumping out the water collected between the packers and allowing water from the isolated fracture zone to run into the packered off section of the drillhole. The conductivity and the pH of the pumped water was monitored, and after the values settled, it was assumed that the water represents the endemic fracture zone water. In order to standardize these samplings, the packer-sealed fracture zones had been pumped for at least few weeks before sampling. OL-KR13/404.5−414.5 m drillhole water samples were collected into new, sterile, gas tight polyacetate tube (8 mm outer diameter) which was led into an acid washed, sterile, RNAse free (220°C, 6 h) anaerobic glass bottle with sterile injection needle through rubber stopper. In case of OL-KR6/125−130 m the water was led by polyacetate tube straight into an anaerobic glovebox (MBRAUN, Germany) and collected into an acid washed, sterile, RNase free glass bottle. Microbial biomass for nucleic acid analyses was concentrated by filtration on cellulose acetate filters (0.2 μm pore size, Corning) by vacuum suction in the anaerobic chamber. The filters were immediately cut out from the filtration funnels with sterile scalpels and frozen on dry ice in sterile 45 mL cone tubes (Corning). The overall time for mRNA sample collection, filtration and cutting before freezing ranged from 15 to 55 minutes being longer with OL-KR13/404.5−414.5 m samples as the water pumping was slower. Sampling of microbial biomass for DNA analysis took around 40 to 170 minutes depending on the volumes which were larger than for mRNA, and several samples were collected at the same time. DNA is more stable than mRNA allowing longer sampling times. The frozen samples were transported in dry ice to the laboratory where they were stored at -80 °C until nucleic acid extraction. Samples for microbial density measurements were collected in acid-washed, anaerobic and sterile 100 mL head-space vials through a rubber stopper and transported to laboratory at 4 °C protected from light.
6.2.2 Total Number of Cells (TNC)
The total number of microbial cells was estimated with epifluorescence microscopy based on staining with 4,6-diamidino-2-phenylindole (DAPI) (Kepner and Pratt, 1994). The method and calculations are described in (Itävaara et al. 2008) and (Itävaara et al., 2011b). Briefly; A 5 to 20 mL subsample of each groundwater sample was stained with 1 μg mL-
1 of DAPI for 20 min at room temperature, in dark, and under aerobic conditions, after which it was filtered on black 0.2 µm pore-sized polycarbonate membrane filters (Isopore™ Membrane filters, 0.2 µm GTBP, Millipore) with a Millipore 1225 Sampling Manifold (Millipore) by suction. The number of cells in the sample was calculated from 30 microscopy images (Olympus BX60, Olympus Optical Ltd., Tokyo, Japan with 100× magnification).

27
6.2.3 Nucleic acid isolation
Total DNA was isolated directly from the frozen cellulose-acetate filters. The filters were cut to 2 x 2 mm2 pieces with sterile scalpel in a laminar flow hood, and the DNA was extracted with the NucleoSpin Soil DNA extraction kit (Machery-Nagel GmbH & Co. KG, Germany) with 5 mL starting tubes (Eppendorf AG, Germany). Negative DNA isolation control was also included. The isolation was performed according to the manufacturer’s instructions, using SL1 buffer and Enhancer SX. The isolated and purified DNA was then stored frozen at -80 °C until use. Total RNA was isolated directly from the frozen cellulose-acetate filter with the PowerWater RNA isolation kit (MoBio Laboratories, Inc., Solana Beach, CA). The filters were thawed on ice and care was taken to minimize the time of thawing. The intact filters were inserted into the bead tubes with flame-sterilized forceps and the RNA extraction was performed according to the manufacturer’s instructions. Negative RNA isolation control was also included. RNA for the sequencing was stored at -80 °C. For the qPCR analysis RNA was further handled as follows. DNA contamination of the RNA extracts was checked by PCR with bacteria 16S rRNA gene specific primers U968 and U1401 (Nübel et al., 1996). If a PCR product was obtained, the RNA extract was first treated with DNase (Promega) according to the manufacturer’s instructions. The RNA was subsequently submitted to cDNA synthesis. Aliquots of 9.2 μL of RNA was incubated together with 250 ng random hexamers (Promega) and 0.83 mM final concentration dNTP (Finnzymes, Espoo, Finland) at 37 °C for 30 min and inactivated with DNase stop solution for 10 min at 65 °C and then cooled on ice for 1 minute. cDNA was synthesised with the Superscript III kit (Invitrogen), by adding 4 μL 5x First strand buffer, 40 u DTT and 200 u Superscript III to the cooled reactions. To protect the RNA template from degradation, 40 u recombinant RNase inhibitor, RNaseOut (Promega), was used. The reactions were incubated at 25 °C for 5 minutes, 50 °C for 1 h and 70 °C for 15 min. RT-PCR was also performed on the negative RNA extraction controls as well as negative reagent RT-PCR controls to ensure that these steps have remained uncontaminated during the process. Qubit 2.0 Fluorometer (Life Technologies) was used to quantitate both DNA and RNA isolated.
6.2.4 Real-time quantitative PCR (qPCR)
Several microbial groups connected to carbon and nitrogen-cycling and sulphate reduction were quantified by qPCR of functional genes. Functional genes code for proteins catalysing various biogeochemical processes and can be used as marker genes to detect carbon, nitrogen and sulphur-cycling microorganisms. Phylogenetically variable and different species can target the same function in the environment and can therefore been detected based on genes which contain similar structures so called conservative structures by PCR. In order to detect active microbes connected to specific metabolic functions transcripts based on messenger RNA (mRNA) transforming the genetic information to enzymes was additionally analysed. Sulphate reduction is catalysed by the dissimilatory sulphate reductase gene (dsrAB), which is present in microorganisms able to convert sulphate (SO4
2-) to sulphide (HS-) (Karkhoff-Schweizer et al., 1995). The dsrAB gene sequence is highly conserved across

28
the sulphate-reducing bacteria and archaea. As an enzyme coding gene, dsrAB is also a good target for the identification and enumeration of populations with a specific metabolic potential in a wide range of environments in which the traditional culture-dependent methods cannot be used. Similarly; ammonium-oxidizing microbial populations which turn NH4
+ to NO2- can be
monitored by detecting the genes or their transcripts. The abundances of bacterial 16S rRNA genes copies and transcripts of the dsrB, amoA, narG, pmoA and mcrA (sulphate reducers, ammonia oxidizers, nitrate reducers, methanotrops, and methanogens, respectively) were estimated by real-time quantitative PCR (qPCR). The used primers for qPCRs are presented in Table 1. The reaction mixtures (10 μL) contained 1 μL DNA/cDNA extract, standard dilution or water, 5 μL of the KAPA SYBR® FAST Universal qPCR 2xMaster Mix (KAPA Biosystems, Wilmington, MA, USA), 2.5 μM of each forward and reverse primer and nuclease free water. The amplifications consisted of an initial 15 min denaturation at 95 °C, followed by 45 cycles of denaturation at 95 °C for 10 s, annealing at 55 °C for 35 s (56 °C for dsrB and mcrA, 58 °C for narG and 59 °C for amoA) and extension of 72 °C for 30 s, and with final extension at 72 °C for 3 min. Subsequently, a melting curve was recorded to test the specificity of the qPCR, with a program consisting of a 10 s denaturation at 95 °C, 1 min of annealing at 65 °C, and a melting and continuous measuring step rising gradually (0.11 °C s−1) to 95 °C. Table 1. Primers used for qPCR studies.
Gene Function Primer Reference 16S rRNA bacteria P1/P2 Muyzer et al. (1993) dsrB Sulphate-reducers DSRp2060F/DSR4R Geets et al. (2006); Wagner et al., (1998) amoA Ammonia oxidizers amoA-1F/ amoA-2R Rotthauwe and Witzel (1997) pmoA methanotrophs pmof1/pmor Cheng et al. (1999) mcrA methanogens ME1/ME3 Hales et al. (1996) narG denitrification 1960m2f/2050m2r López-Gutierrez et al. (2004)
6.2.5 DNA sequencing of metagenomes
The DNA sequencing was carried out by the Institute for Molecular Medicine Finland (FIMM, subcontracting) as follows: The samples were processed to Illumina sequencing compatible libraries with Nextera DNA sample preparation kit (Illumina, San Diego, CA, USA). 6.8 ng – 20 ng of genomic DNA was used for the tagmentation. The reaction volume in Nextera tagmentation and amplification steps was 20 µL and after both steps the libraries were purified with EdgeBio Performa V3 96-Well Short Plate (Edge BioSystems, Gaithersburg, MD, USA). After the amplification the libraries were first incubated with 4 µL of EdgeBio SOPE Resin and then purified with EdgeBio Performa plates. The sequencing ready libraries were quantitated with Agilent 2100 Bioanalyzer High Sensitivity kit (Agilent, Santa Clara, CA, USA). The libraries were sequenced in Illumina HiSeq2500 system (v4 chemistry) using 101 bases long paired-end reads.
29
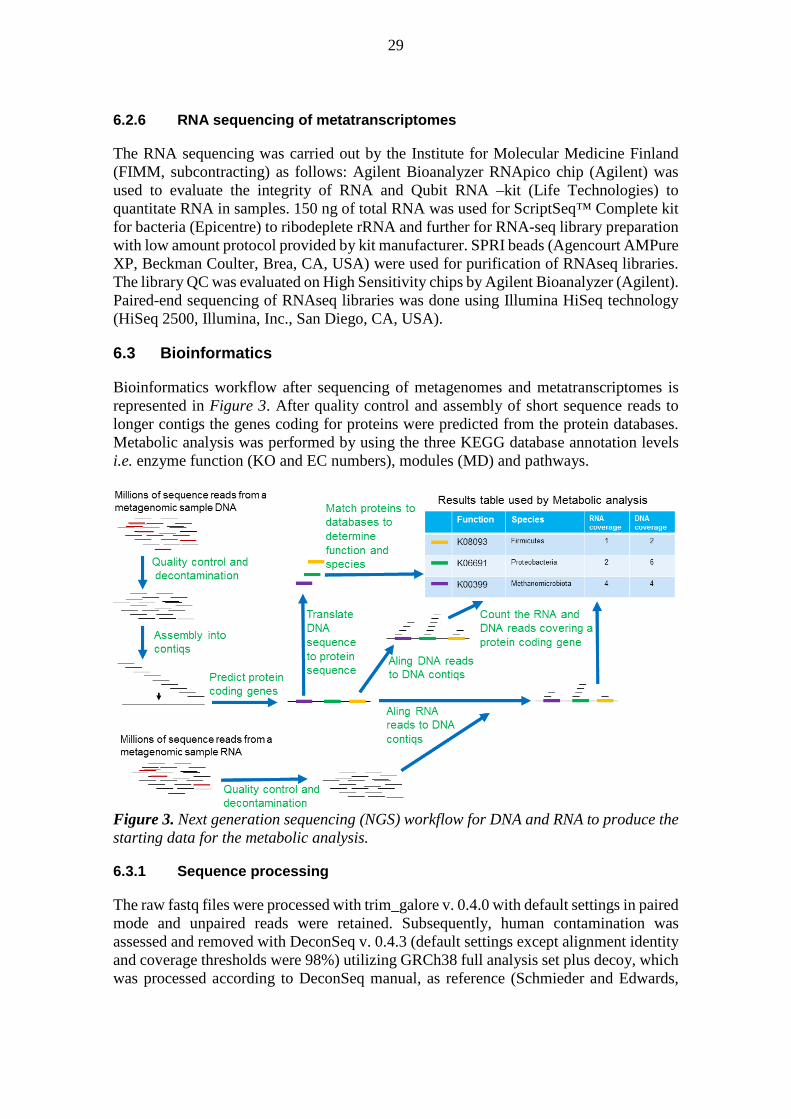
6.2.6 RNA sequencing of metatranscriptomes
The RNA sequencing was carried out by the Institute for Molecular Medicine Finland (FIMM, subcontracting) as follows: Agilent Bioanalyzer RNApico chip (Agilent) was used to evaluate the integrity of RNA and Qubit RNA –kit (Life Technologies) to quantitate RNA in samples. 150 ng of total RNA was used for ScriptSeq™ Complete kit for bacteria (Epicentre) to ribodeplete rRNA and further for RNA-seq library preparation with low amount protocol provided by kit manufacturer. SPRI beads (Agencourt AMPure XP, Beckman Coulter, Brea, CA, USA) were used for purification of RNAseq libraries. The library QC was evaluated on High Sensitivity chips by Agilent Bioanalyzer (Agilent). Paired-end sequencing of RNAseq libraries was done using Illumina HiSeq technology (HiSeq 2500, Illumina, Inc., San Diego, CA, USA).
6.3 Bioinformatics
Bioinformatics workflow after sequencing of metagenomes and metatranscriptomes is represented in Figure 3. After quality control and assembly of short sequence reads to longer contigs the genes coding for proteins were predicted from the protein databases. Metabolic analysis was performed by using the three KEGG database annotation levels i.e. enzyme function (KO and EC numbers), modules (MD) and pathways.
Figure 3. Next generation sequencing (NGS) workflow for DNA and RNA to produce the starting data for the metabolic analysis.
6.3.1 Sequence processing
The raw fastq files were processed with trim_galore v. 0.4.0 with default settings in paired mode and unpaired reads were retained. Subsequently, human contamination was assessed and removed with DeconSeq v. 0.4.3 (default settings except alignment identity and coverage thresholds were 98%) utilizing GRCh38 full analysis set plus decoy, which was processed according to DeconSeq manual, as reference (Schmieder and Edwards,
30
2011). Re-synchronized and merged reads were assembled with IDBA-UD v. 1.1.1 (Peng et al., 2012) with default settings except mink was 20, maxk was 100, and step was 10. The unpaired reads were also used in the assembly utilizing the long read option. Small subunit ribosomal RNA genes were screened from the contigs with SSU-ALIGN v. 0.1 (Cannone et al., 2002; Nawrocki et al., 2009). Proteins were predicted from the contigs with PRODIGAL v. 2.6.2 (Hyatt et al., 2012) in meta mode. The predicted proteins were queried against the nr protein database of the NCBI with blastp v. 2.2.30+ (Altschul et al., 1990) with seq, soft_masking and use_sw_tback options enabled. DNA and RNA reads were mapped to the assembled contigs with BWA v. 0.7.12-r1044 (Li and Durbin, 2009) and coverage of contigs and predicted proteins was assessed with the pileup script of BBMap v. 34 (http://sourceforge.net/projects/bbmap/).
6.3.2 Quality control and assembly of sequence data
Adapters and poor quality bases were removed from the raw sequence data with trim_galore v. 0.4.0 (Krueger, 2015) in paired mode in which both reads of a pair have to pass applied thresholds. Default settings were applied except minimum stringency of adapter sequence overlap was set to two, i.e. two or more adapter sequence overlapping bases were trimmed off from the read ends. Unpaired high quality reads were retained. Human contamination was assessed and removed with DeconSeq v. 0.4.3 (Schmieder and Edwards, 2011). Default settings were applied except alignment identity and coverage thresholds were set to 98%, i.e. to count as human contamination, the reads had to align with at least 98% similarity to the human genome reference over at least 98% of their lengths. The human genome reference utilized in this study was GRCh38 full analysis set plus decoy from the 1,000 genomes project (The 1000 Genomes Project Consortium, 2012), which was downloaded from the National Center for Biotechnology Information (NCBI) FTP server and prepared for according to the DeconSeq manual. The read pairs were re-synchronized with fastqCombinePairedEnd.py (Normandeau, 2014). In the case of the DNA-seq data, the resulting paired fastq files were merged into interleaved fasta files with fq2fa script that is bundled with IDBA v. 1.1.1 (Peng et al., 2012) iterative De Bruijn graph assembler. The same script was also utilized for merging unpaired high quality DNA-seq reads from fastq files into fasta files. The metagenomes were assembled with IDBA-UD v. 1.1.1 from the paired DNA-seq data with default settings except k-mer was incremented by 10 (-step option in IDBA-UD) following every assembly iteration, i.e. k-mer was 20 in the first round of assembly, 30 in the second round of assembly, etc., until in the final round k-mer was 100. The “long_read” (-l) option in IDBA-UD was utilized for the inclusion of high quality unpaired DNA-seq reads in the assembly process. OL-KR13/405.5−414.5 m and OL-KR6/125−130 m DNA-seq replicate samples (A and B samples) were assembled separately and as merged (pooled) samples. The metatranscriptomes were assembled from the re-synchronized paired RNA-seq data with Trinity v. 2.0.6 (Grabherr et al., 2011) with default settings. DNA-seq and RNA-seq coverage of the metagenomic contigs and the Open Reading Frames (ORF) of the predicted proteins (see below) was assessed by mapping the read data to the target sequences with BWA v. 0.7.12-r1044 (Li and Durbin, 2009). The coverage information was extracted from the resulting bam files with BBMap v. 34 (http://sourceforge.net/projects/bbmap/) pileup script.

31
6.3.3 Gene prediction, taxonomic and functional annotation
Small subunit rRNAs genes (archaeal and bacterial 16S and eukaryote 18S) were screened from the metagenomic (DNA-seq) and metatranscriptomic (RNA-seq) assemblies with SSU-ALIGN v. 0.1 (Nawrocki et al., 2009). Not all potential genes code for a protein (Vieites et al., 2009). Protein-coding genes (including enzymes) were predicted from the assembled metagenomes and metatranscriptomes with PRODIGAL v. 2.6.2 (Hyatt et al., 2012) in meta mode. For taxonomic annotations, the predicted proteins were queried against the nr protein database of the NCBI with BLASTP v. 2.2.30+ (Altschul et al., 1990) with seq, soft_masking and use_sw_tback options enabled for more remote homology detection. The e-value threshold in BLASTP was set to 10-6. Taxonomy was assigned based on the last common ancestor (LCA) method implemented in Blast2lca v. 0.600 (Pignatelli, 2014). In this method, the taxonomy of a query sequence is resolved as the LCA of the best hit (highest bit score, a measure of alignment quality between the query and subject sequences) and hits that are within 0.9X of the bit score of the best hit. For functional annotations of the proteins, the predicted proteins were queried with BLASTP against the eukaryotic, prokaryotic, viral and plasmid proteins included in Kyoto Encyclopedia of Genes and Genomes (KEGG) FTP Release 2015-06-22 (Kanehisa et al., 2014; Kanehisa and Goto, 2000). The options and thresholds were the same as with the BLASTP queries against the nr database of the NCBI specified above. KEGG Orthology (KO) numbers were assigned by the best-hit method. In cases were the best hit did not include a KO annotation, hits that were within 0.9X the bit score of the best hit were considered if they were associated with a KO annotation. The following information were annotated to the query sequences on the basis of the KO annotations: Enzyme Commission (EC) number, KEGG modules, KEGG pathways, and KEGG reactions. Gene definitions and taxonomic information were annotated on the basis of the KEGG gene identifiers.
6.3.4 Grouping genes based on annotations
Sequences sharing a common annotation may be binned, i.e. grouped together into a group identified by the common annotation. The groups are called bins. The DNA and RNA abundances of the groups (bins) were calculated based on the abundances of the sequences having the specific annotation that defined the group. Sequences were grouped based on KEGG gene, KEGG orthology (KO) number, Enzyme Commission (EC) number and KEGG module (MD) identifier.
6.4 Metabolic analyses
Genes encode enzymes that catalyse metabolic reactions when expressed. A metagenome contains the genes of all enzymes in the community of microorganisms, i.e. the genomic potential of expressing an enzyme. Enzyme expression requires gene transcription (DNA to mRNA) and translation (mRNA to protein). Metatranscriptomics studies the transcription of genes. Each enzyme catalyses a metabolic function. A set of enzymes frequently found to work together implementing a common metabolic process may be grouped into a metabolic module. A pathway map groups together a set of metabolic

32
functions based on location, biochemistry, biological similarity, or other biological relevance. The metabolic capability of the community can be explored by analysing the enzymes encoded by DNA and perhaps also transcribed to mRNA. The analyses were carried out on three annotation levels; at the level of enzyme function, at the level of metabolic modules, and at the level of pathway maps. Although the lower annotation levels (enzymatic functions) do contain the metabolic functions and processes included in the higher annotation levels (modules and pathway maps), analysing everything at the lower level would be very tedious and it would be difficult to provide a glance of the main results. In order to benefit maximally from the higher annotation levels, the analyses at lower annotation levels were restricted to content not part of the higher levels. Pathway maps showing a visual overview of predefined portions of metabolic functions and processes were generated. Selected predefined sets of metabolic functions, i.e. metabolic modules, were analysed in more detail to determine if they were operational at the time of sampling. The abundance of operational modules was estimated. Finally, the genes were analysed. All sequences and groups of sequences are described by three main properties; the DNA coverage, the RNA coverage, and the relative transcriptional activity. The DNA coverage determines the abundance of the sequence in the collective microbial gene pool. A higher value implies that a larger fraction of microbial cells in the community contained the gene. The RNA coverage determines the abundance of a transcribed gene in the collective pool of transcribed genes. The relative transcriptional activity (Hua et al., 2015) is a measure on how transcribed a gene is in relation to how many cells contain it. It is often assumed that there is roughly one copy of any specific DNA sequence in a cell, but the number of corresponding RNA sequences may be many or none.
6.4.1 Pathway maps
A pathway map is a collection of metabolic functions, e.g. enzyme-catalysed reactions, relating to the topic of the pathway map. Pathway maps usually show many metabolic processes (modules), but also metabolic functions (reactions) not part of any module. KEGG pathway maps were visually analysed e.g. for metabolic functions not preassembled into modules. Pathway maps were generated for visualization based on DNA and RNA sequences annotated with KEGG orthology (KO) numbers. The colouring was based on the DNA abundancy, the RNA abundancy, and the relative transcriptional activity of sequences binned by KO numbers. The pathway maps generated contained DNA abundancy, RNA abundancy, and the relative transcriptional activity for every metabolic function defined by KO numbers. For each metabolic functionality, i.e. a box on a pathway map, the corresponding DNA abundancy, RNA abundancy, and the relative transcriptional activity were shown on a simplified scale using a small column chart. Each of the three values was given a column height ranging from 0 to 4 and a colour to match the height according to Table 2.

33
Table 2. Interpretation guide for column charts in pathway maps. Column heights and colors for column charts denoting DNA abundancy, RNA abundancy, and the relative transcriptional activity for metabolic functions defined by KO numbers on pathway maps.
Column height Column colour Explanation 0 No colour Gene not found 1 Orange Gene rare 2 Yellow Gene less abundant than average 3 Light green Gene more abundant than average 4 Dark green Gene highly abundant
Two samples were plotted side by side on the same pathway map to allow rapid visual comparison. Each box denoting a metabolic functionality was divided into two equally wide sections; one for each sample. The sample OL-KR6/125−130 m is always shown on the left half of each box, while sample OL-KR13/405.5−414.5 m is always shown on the right half of each box. The halves were further divided into three columns; one for DNA abundancy, one for RNA abundancy, and one for the relative transcriptional activity, in order from left to right within each half of the box. Thus there are six columns in each box; the three leftmost pertain to OL-KR6/125−130 m and the three rightmost pertain to OL-KR13/405.5−414.5 m. The background colour of each box is a shade of light grey. Boxes, for which there are no KO defined, have a white background. The interpretation of a pathway map can be quite tricky because the same KO may appear in multiple locations, only one of which is likely of interest. Examples include nitroalkane degradation and nitrate reduction to nitrite (NO2
-), or trithionate reduction to sulphite (SO3
2-) and sulphite reduction to sulphide (HS-). Furthermore, KO for non-specific reactions, i.e. general reactions, may appear on multiple pathway maps even if they do not perform the exact function shown on the map. For example, the hydrolysis of an acyl chain from lecithin will produce the corresponding acid of which ever chain was attached to the lecithin backbone, including arachidonic acid and linoleic acid.
6.4.2 Metabolic processes
Sequences, the primary data of metagenomes and metatranscriptomes, can be annotated with a functional role (e.g. a metabolic function). The metabolic functions (e.g. enzymes) often occurring together can be further grouped into metabolic processes (modules). A module describes one or more subsequent reactions forming a net function. The modular structure provides a convenient way to assess the metagenomic potential of metabolic processes. The KEGG database provides manually defined collections of enzymatic functions i.e. modules. They group genes and enzymatic reactions carried out by them together to perform a common metabolic task such as “M00596: Dissimilatory sulphate reduction” in Figure 1. Genes are represented by KEGG Orthology (KO) groups, which group genes of the same evolutionary origin carrying out the same metabolic function together such as “K00394: adenylylsulphate reductase, subunit A” in Figure 1. The presence of modules was predicted with KEGG Mapper, Search Module (www.genome.jp/kegg/tool/map_module1.html). The manual determination of module presence and functionality proceeded one KEGG module at a time using the images

34
produced by KEGG Mapper, a list of KO numbers used by the module, and the coverage data on the sequences annotated with KO numbers. The modules were determined to be either functional or not functional based on the module definitions. Each module describes prerequisite, optional, and alternative combinations of KO numbers needed to perform the metabolic process described by the module. The functionality of a metabolic process states whether or not the module is operational, i.e. a suitable set of genes are present in the metagenome. A metabolic process was deemed functional if there were DNA evidence of all necessary parts of at least one parallel implementation of the functionality defined by the module. Subsequently, the relative abundances of modules in the metagenomes were analysed.
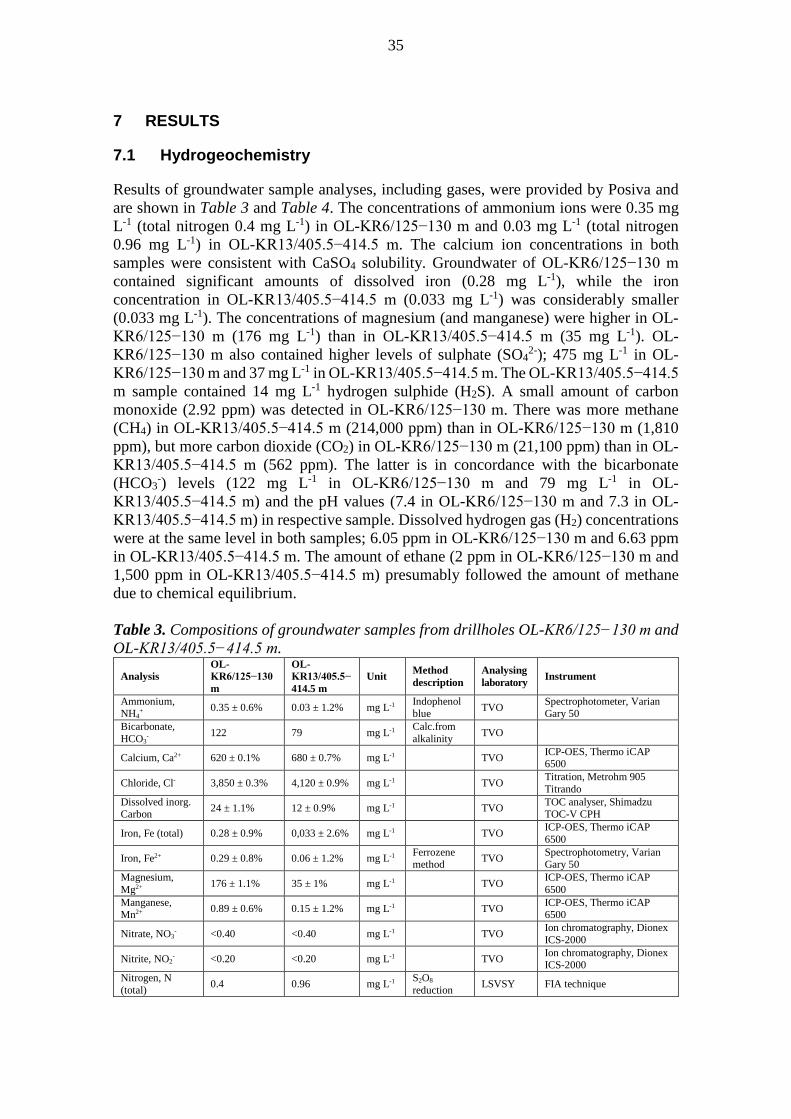
35
7 RESULTS
7.1 Hydrogeochemistry
Results of groundwater sample analyses, including gases, were provided by Posiva and are shown in Table 3 and Table 4. The concentrations of ammonium ions were 0.35 mg L-1 (total nitrogen 0.4 mg L-1) in OL-KR6/125−130 m and 0.03 mg L-1 (total nitrogen 0.96 mg L-1) in OL-KR13/405.5−414.5 m. The calcium ion concentrations in both samples were consistent with CaSO4 solubility. Groundwater of OL-KR6/125−130 m contained significant amounts of dissolved iron (0.28 mg L-1), while the iron concentration in OL-KR13/405.5−414.5 m (0.033 mg L-1) was considerably smaller (0.033 mg L-1). The concentrations of magnesium (and manganese) were higher in OL-KR6/125−130 m (176 mg L-1) than in OL-KR13/405.5−414.5 m (35 mg L-1). OL-KR6/125−130 m also contained higher levels of sulphate (SO4
2-); 475 mg L-1 in OL-KR6/125−130 m and 37 mg L-1 in OL-KR13/405.5−414.5 m. The OL-KR13/405.5−414.5 m sample contained 14 mg L-1 hydrogen sulphide (H2S). A small amount of carbon monoxide (2.92 ppm) was detected in OL-KR6/125−130 m. There was more methane (CH4) in OL-KR13/405.5−414.5 m (214,000 ppm) than in OL-KR6/125−130 m (1,810 ppm), but more carbon dioxide (CO2) in OL-KR6/125−130 m (21,100 ppm) than in OL-KR13/405.5−414.5 m (562 ppm). The latter is in concordance with the bicarbonate (HCO3
-) levels (122 mg L-1 in OL-KR6/125−130 m and 79 mg L-1 in OL-KR13/405.5−414.5 m) and the pH values (7.4 in OL-KR6/125−130 m and 7.3 in OL-KR13/405.5−414.5 m) in respective sample. Dissolved hydrogen gas (H2) concentrations were at the same level in both samples; 6.05 ppm in OL-KR6/125−130 m and 6.63 ppm in OL-KR13/405.5−414.5 m. The amount of ethane (2 ppm in OL-KR6/125−130 m and 1,500 ppm in OL-KR13/405.5−414.5 m) presumably followed the amount of methane due to chemical equilibrium. Table 3. Compositions of groundwater samples from drillholes OL-KR6/125−130 m and OL-KR13/405.5−414.5 m.
Analysis OL-KR6/125−130 m
OL-KR13/405.5−414.5 m
Unit Method description
Analysing laboratory Instrument
Ammonium, NH4
+ 0.35 ± 0.6% 0.03 ± 1.2% mg L-1 Indophenol blue TVO Spectrophotometer, Varian
Gary 50 Bicarbonate, HCO3
- 122 79 mg L-1 Calc.from alkalinity TVO
Calcium, Ca2+ 620 ± 0.1% 680 ± 0.7% mg L-1 TVO ICP-OES, Thermo iCAP 6500
Chloride, Cl- 3,850 ± 0.3% 4,120 ± 0.9% mg L-1 TVO Titration, Metrohm 905 Titrando
Dissolved inorg. Carbon 24 ± 1.1% 12 ± 0.9% mg L-1 TVO TOC analyser, Shimadzu
TOC-V CPH
Iron, Fe (total) 0.28 ± 0.9% 0,033 ± 2.6% mg L-1 TVO ICP-OES, Thermo iCAP 6500
Iron, Fe2+ 0.29 ± 0.8% 0.06 ± 1.2% mg L-1 Ferrozene method TVO Spectrophotometry, Varian
Gary 50 Magnesium, Mg2+ 176 ± 1.1% 35 ± 1% mg L-1 TVO ICP-OES, Thermo iCAP
6500 Manganese, Mn2+ 0.89 ± 0.6% 0.15 ± 1.2% mg L-1 TVO ICP-OES, Thermo iCAP
6500
Nitrate, NO3- <0.40 <0.40 mg L-1 TVO Ion chromatography, Dionex
ICS-2000
Nitrite, NO2- <0.20 <0.20 mg L-1 TVO Ion chromatography, Dionex
ICS-2000 Nitrogen, N (total) 0.4 0.96 mg L-1 S2O8
reduction LSVSY FIA technique

36
Analysis OL-KR6/125−130 m
OL-KR13/405.5−414.5 m
Unit Method description
Analysing laboratory Instrument
Non Purgeable Organic Carbon 4.3 ± 2% 10 ± 0.5% mg L-1 TVO TOC analyser, Shimadzu
TOC-V CPH Phosphate, HPO4
2- <0.10 <0.10 mg L-1 TVO Ion chromatography, Dionex ICS-2000
Potassium, K+ 18 ± 0.3% 10 ± 1.2% mg L-1 TVO ICP-OES, Thermo iCAP 6500
Sodium, Na+ 1,600 ± 0.2% 1,780 ± 1.3% mg L-1 TVO ICP-OES, Thermo iCAP 6500
Sulphate, SO42- 475 ± 0.2% 37 ± 0.4% mg L-1 TVO Ion chromatography, Dionex
ICS-2000
Sulphide, HS- <0.02 14 ± 2% mg L-1 Methylene blue TVO Spectrophotometry, Varian
Gary 50
Sulphur, S (total) 150 ± 0.1% 23 ± 4% mg L-1 H2O2 oxidation TVO Ion Chromatography, ICS-
2000 Total alkalinity, HCl uptake 2 ± 0.8% 1.3 ± 2.1% mmol
L-1 HCl uptake TVO Titration, Metrohm 905 Titrando
Total dissolved solids 6,895 6,791 mg L-1 TVO
pH, Field 7.4 7.3
Table 4. The composition of gaseous samples from drillholes OL-KR6/125−130 m and OL-KR13/405.5−414.5 m.
Gas OL-KR6/125−130 m
OL-KR13/405.5−414.5 m
Unit
Hydrogen 6.32 6.7 ppm Helium 1,840 14,400 ppm Argon 6,670 8,570 ppm Nitrogen 947,000 767,000 ppm Carbon monoxide 3.05 < 2.02 ppm Carbon dioxide 21,100 562 ppm Methane 1,810 214,000 ppm Ethane 1.91 1,500 ppm Propane < 2.65 0.52 ppm
7.1.1 Mineralogy
The bedrock in Olkiluoto was mainly gneiss. Three main hydrothermal alteration types have been identified at Olkiluoto after greisenisation: i) clay mineral formation, which has two main subtypes; illitisation and kaolinisation, ii) sulphidisation, and iii) carbonatisation (Aaltonen et al. 2010). The mineralogy of the bedrock in Olkiluoto was provided by Posiva Oy. The most common fracture deposits in Olkiluoto were calcite (CaCO3), pyrite (FeIIS2), kaolinite (Al2Si2O5(OH)4), and chlorite ((Mg,FeII)5Al(Si3Al)O10(OH)8). Epidote (Ca2Al2(FeIIIAl)(SiO4)(Si2O7)O(OH)), biotite (K(Mg,FeII)3AlSi3O10(OH,F)2), muscovite (KAl2(AlSi3O10)(F,OH)2), illite ((K,H3O)(Al,Mg,Fe)2(Si,Al)4O10((OH)2,(H2O))), quartz (SiO2), and graphite (C) were found sporadically. Small quantities of serisite (K2Al4(Si3AlO10)2(OH)2), hematite (FeIII
2O3), pyrrhotite (FeII0,83-1S), sphalerite
((Zn,FeII)S), and galena (PbS) were also found.
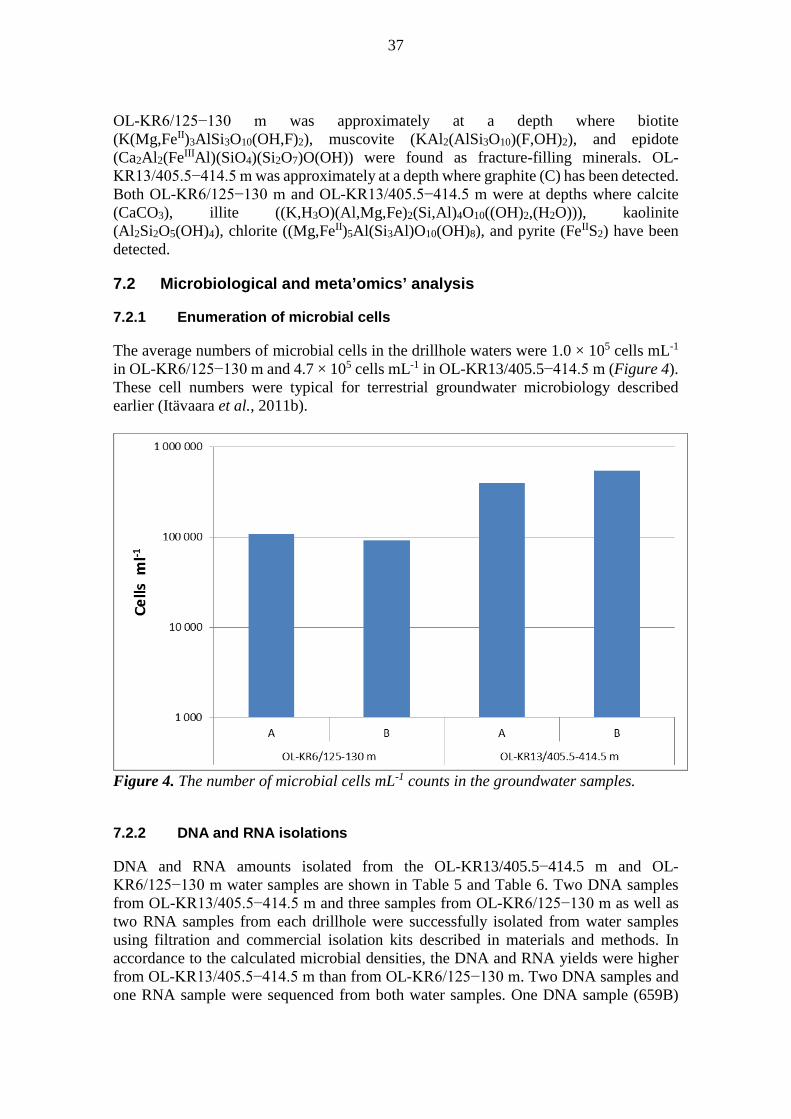
37
OL-KR6/125−130 m was approximately at a depth where biotite (K(Mg,FeII)3AlSi3O10(OH,F)2), muscovite (KAl2(AlSi3O10)(F,OH)2), and epidote (Ca2Al2(FeIIIAl)(SiO4)(Si2O7)O(OH)) were found as fracture-filling minerals. OL-KR13/405.5−414.5 m was approximately at a depth where graphite (C) has been detected. Both OL-KR6/125−130 m and OL-KR13/405.5−414.5 m were at depths where calcite (CaCO3), illite ((K,H3O)(Al,Mg,Fe)2(Si,Al)4O10((OH)2,(H2O))), kaolinite (Al2Si2O5(OH)4), chlorite ((Mg,FeII)5Al(Si3Al)O10(OH)8), and pyrite (FeIIS2) have been detected.
7.2 Microbiological and meta’omics’ analysis
7.2.1 Enumeration of microbial cells
The average numbers of microbial cells in the drillhole waters were 1.0 × 10⁵ cells mL-1 in OL-KR6/125−130 m and 4.7 × 10⁵ cells mL-1 in OL-KR13/405.5−414.5 m (Figure 4). These cell numbers were typical for terrestrial groundwater microbiology described earlier (Itävaara et al., 2011b).
Figure 4. The number of microbial cells mL-1 counts in the groundwater samples.
7.2.2 DNA and RNA isolations
DNA and RNA amounts isolated from the OL-KR13/405.5−414.5 m and OL-KR6/125−130 m water samples are shown in Table 5 and Table 6. Two DNA samples from OL-KR13/405.5−414.5 m and three samples from OL-KR6/125−130 m as well as two RNA samples from each drillhole were successfully isolated from water samples using filtration and commercial isolation kits described in materials and methods. In accordance to the calculated microbial densities, the DNA and RNA yields were higher from OL-KR13/405.5−414.5 m than from OL-KR6/125−130 m. Two DNA samples and one RNA sample were sequenced from both water samples. One DNA sample (659B)
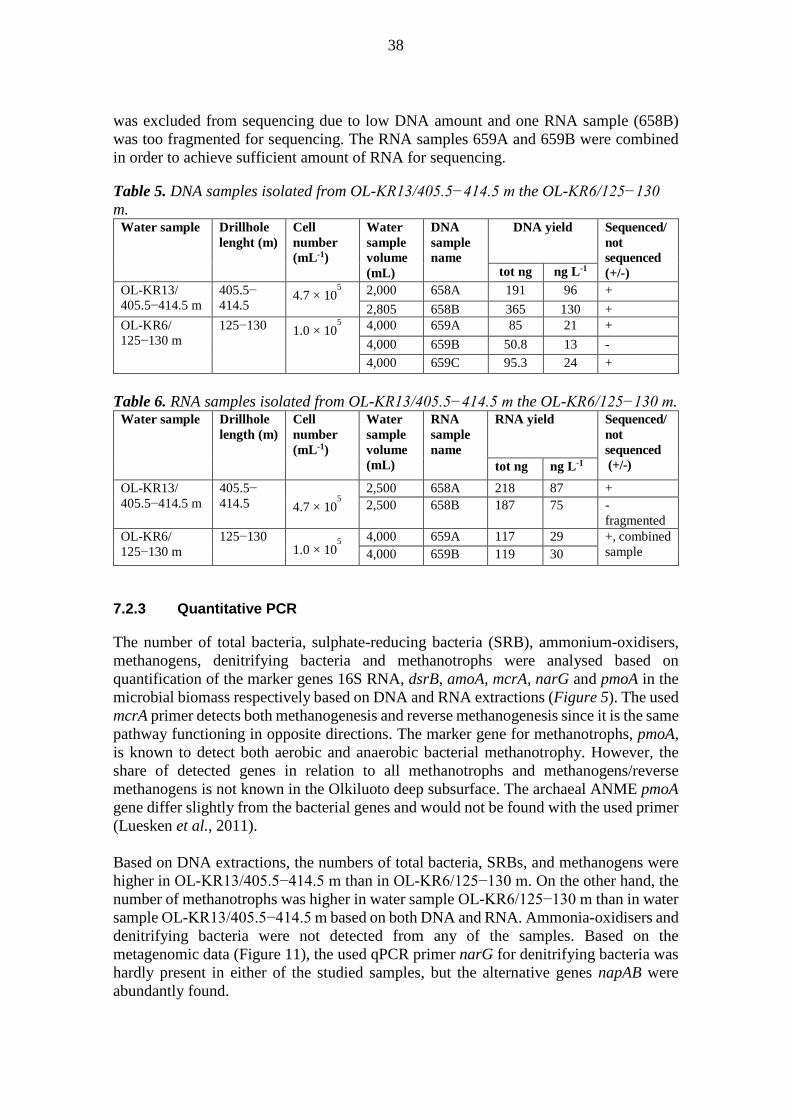
38
was excluded from sequencing due to low DNA amount and one RNA sample (658B) was too fragmented for sequencing. The RNA samples 659A and 659B were combined in order to achieve sufficient amount of RNA for sequencing. Table 5. DNA samples isolated from OL-KR13/405.5−414.5 m the OL-KR6/125−130 m.
Water sample Drillhole lenght (m)
Cell number (mL-1)
Water sample volume (mL)
DNA sample name
DNA yield Sequenced/ not sequenced (+/-) tot ng ng L-1
OL-KR13/ 405.5−414.5 m
405.5− 414.5
4.7 × 10⁵ 2,000 658A 191 96 +
2,805 658B 365 130 + OL-KR6/ 125−130 m
125−130 1.0 × 10⁵ 4,000 659A 85 21 +
4,000 659B 50.8 13 - 4,000 659C 95.3 24 +
Table 6. RNA samples isolated from OL-KR13/405.5−414.5 m the OL-KR6/125−130 m.
Water sample Drillhole length (m)
Cell number (mL-1)
Water sample volume (mL)
RNA sample name
RNA yield Sequenced/ not sequenced (+/-) tot ng ng L-1
OL-KR13/ 405.5−414.5 m
405.5− 414.5 4.7 × 10
5
2,500 658A 218 87 + 2,500 658B 187 75 -
fragmented OL-KR6/ 125−130 m
125−130 1.0 × 10
5
4,000 659A 117 29 +, combined sample 4,000 659B 119 30
7.2.3 Quantitative PCR
The number of total bacteria, sulphate-reducing bacteria (SRB), ammonium-oxidisers, methanogens, denitrifying bacteria and methanotrophs were analysed based on quantification of the marker genes 16S RNA, dsrB, amoA, mcrA, narG and pmoA in the microbial biomass respectively based on DNA and RNA extractions (Figure 5). The used mcrA primer detects both methanogenesis and reverse methanogenesis since it is the same pathway functioning in opposite directions. The marker gene for methanotrophs, pmoA, is known to detect both aerobic and anaerobic bacterial methanotrophy. However, the share of detected genes in relation to all methanotrophs and methanogens/reverse methanogens is not known in the Olkiluoto deep subsurface. The archaeal ANME pmoA gene differ slightly from the bacterial genes and would not be found with the used primer (Luesken et al., 2011). Based on DNA extractions, the numbers of total bacteria, SRBs, and methanogens were higher in OL-KR13/405.5−414.5 m than in OL-KR6/125−130 m. On the other hand, the number of methanotrophs was higher in water sample OL-KR6/125−130 m than in water sample OL-KR13/405.5−414.5 m based on both DNA and RNA. Ammonia-oxidisers and denitrifying bacteria were not detected from any of the samples. Based on the metagenomic data (Figure 11), the used qPCR primer narG for denitrifying bacteria was hardly present in either of the studied samples, but the alternative genes napAB were abundantly found.

39
Figure 5. The number of total bacteria, sulphate-reducers, ammonium-oxidisers, methanogens, denitrifying bacteria and methanotrops from the 16S rRNA, dsrB, amoA, mcrA, narG and pmoA gene targeted qPCR. a) DNA b) cDNA (RNA). cDNA = complementary DNA.
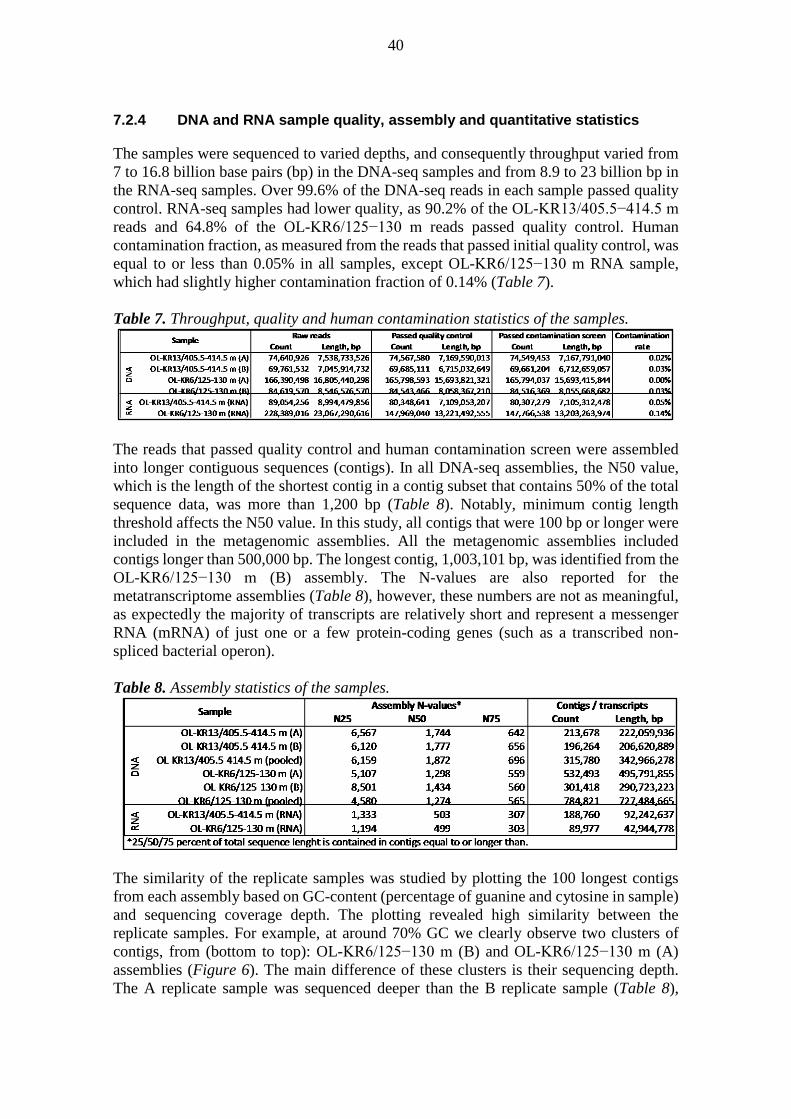
40
7.2.4 DNA and RNA sample quality, assembly and quantitative statistics
The samples were sequenced to varied depths, and consequently throughput varied from 7 to 16.8 billion base pairs (bp) in the DNA-seq samples and from 8.9 to 23 billion bp in the RNA-seq samples. Over 99.6% of the DNA-seq reads in each sample passed quality control. RNA-seq samples had lower quality, as 90.2% of the OL-KR13/405.5−414.5 m reads and 64.8% of the OL-KR6/125−130 m reads passed quality control. Human contamination fraction, as measured from the reads that passed initial quality control, was equal to or less than 0.05% in all samples, except OL-KR6/125−130 m RNA sample, which had slightly higher contamination fraction of 0.14% (Table 7). Table 7. Throughput, quality and human contamination statistics of the samples.
The reads that passed quality control and human contamination screen were assembled into longer contiguous sequences (contigs). In all DNA-seq assemblies, the N50 value, which is the length of the shortest contig in a contig subset that contains 50% of the total sequence data, was more than 1,200 bp (Table 8). Notably, minimum contig length threshold affects the N50 value. In this study, all contigs that were 100 bp or longer were included in the metagenomic assemblies. All the metagenomic assemblies included contigs longer than 500,000 bp. The longest contig, 1,003,101 bp, was identified from the OL-KR6/125−130 m (B) assembly. The N-values are also reported for the metatranscriptome assemblies (Table 8), however, these numbers are not as meaningful, as expectedly the majority of transcripts are relatively short and represent a messenger RNA (mRNA) of just one or a few protein-coding genes (such as a transcribed non-spliced bacterial operon). Table 8. Assembly statistics of the samples.
The similarity of the replicate samples was studied by plotting the 100 longest contigs from each assembly based on GC-content (percentage of guanine and cytosine in sample) and sequencing coverage depth. The plotting revealed high similarity between the replicate samples. For example, at around 70% GC we clearly observe two clusters of contigs, from (bottom to top): OL-KR6/125−130 m (B) and OL-KR6/125−130 m (A) assemblies (Figure 6). The main difference of these clusters is their sequencing depth. The A replicate sample was sequenced deeper than the B replicate sample (Table 8),
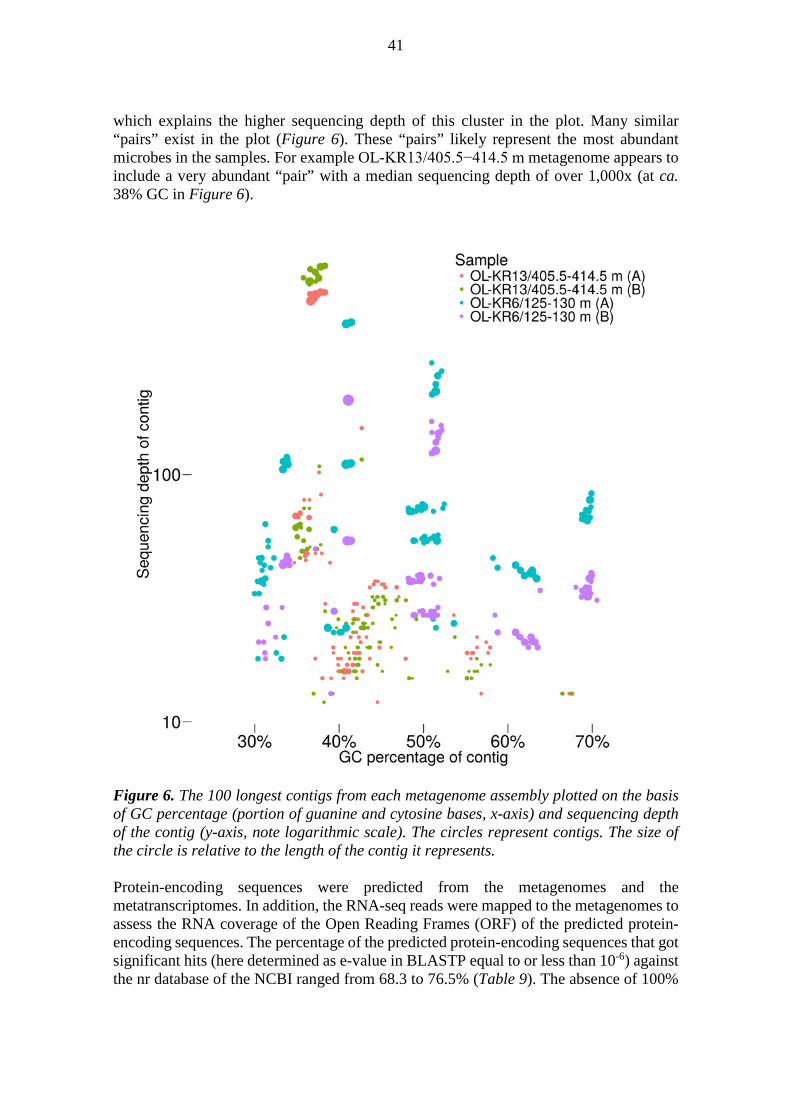
41
which explains the higher sequencing depth of this cluster in the plot. Many similar “pairs” exist in the plot (Figure 6). These “pairs” likely represent the most abundant microbes in the samples. For example OL-KR13/405.5−414.5 m metagenome appears to include a very abundant “pair” with a median sequencing depth of over 1,000x (at ca. 38% GC in Figure 6).
Figure 6. The 100 longest contigs from each metagenome assembly plotted on the basis of GC percentage (portion of guanine and cytosine bases, x-axis) and sequencing depth of the contig (y-axis, note logarithmic scale). The circles represent contigs. The size of the circle is relative to the length of the contig it represents. Protein-encoding sequences were predicted from the metagenomes and the metatranscriptomes. In addition, the RNA-seq reads were mapped to the metagenomes to assess the RNA coverage of the Open Reading Frames (ORF) of the predicted protein-encoding sequences. The percentage of the predicted protein-encoding sequences that got significant hits (here determined as e-value in BLASTP equal to or less than 10-6) against the nr database of the NCBI ranged from 68.3 to 76.5% (Table 9). The absence of 100%
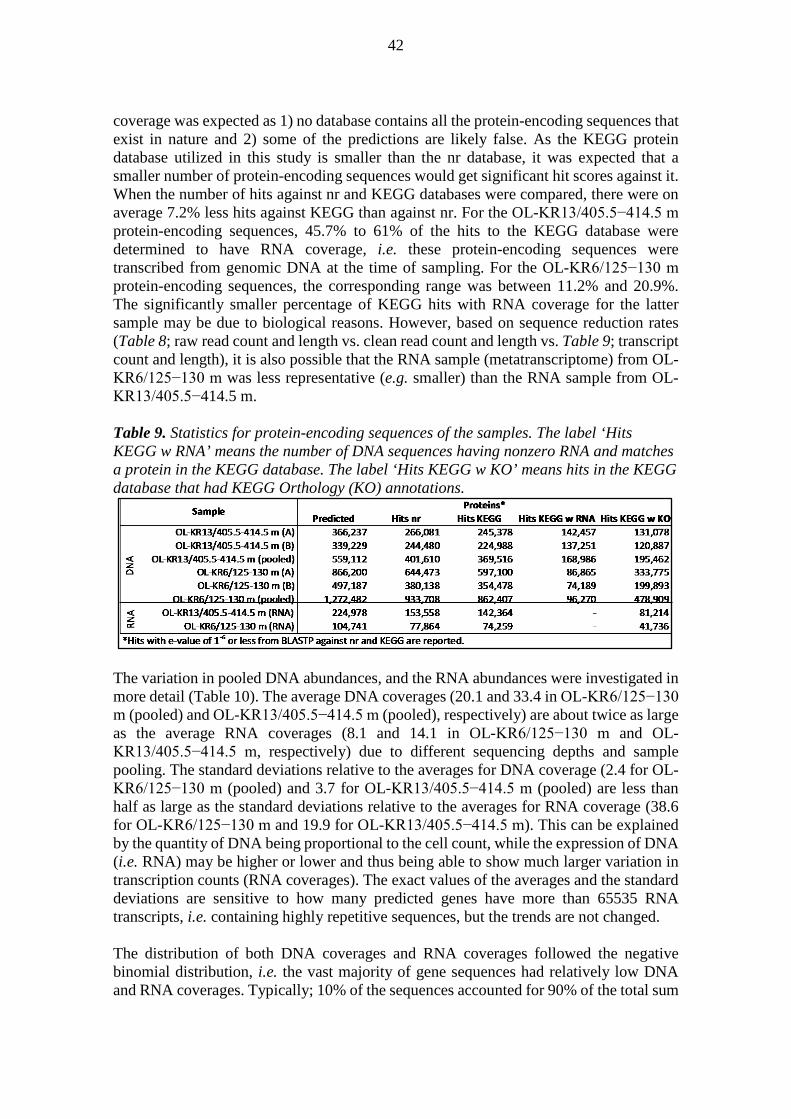
42
coverage was expected as 1) no database contains all the protein-encoding sequences that exist in nature and 2) some of the predictions are likely false. As the KEGG protein database utilized in this study is smaller than the nr database, it was expected that a smaller number of protein-encoding sequences would get significant hit scores against it. When the number of hits against nr and KEGG databases were compared, there were on average 7.2% less hits against KEGG than against nr. For the OL-KR13/405.5−414.5 m protein-encoding sequences, 45.7% to 61% of the hits to the KEGG database were determined to have RNA coverage, i.e. these protein-encoding sequences were transcribed from genomic DNA at the time of sampling. For the OL-KR6/125−130 m protein-encoding sequences, the corresponding range was between 11.2% and 20.9%. The significantly smaller percentage of KEGG hits with RNA coverage for the latter sample may be due to biological reasons. However, based on sequence reduction rates (Table 8; raw read count and length vs. clean read count and length vs. Table 9; transcript count and length), it is also possible that the RNA sample (metatranscriptome) from OL-KR6/125−130 m was less representative (e.g. smaller) than the RNA sample from OL-KR13/405.5−414.5 m. Table 9. Statistics for protein-encoding sequences of the samples. The label ‘Hits KEGG w RNA’ means the number of DNA sequences having nonzero RNA and matches a protein in the KEGG database. The label ‘Hits KEGG w KO’ means hits in the KEGG database that had KEGG Orthology (KO) annotations.
The variation in pooled DNA abundances, and the RNA abundances were investigated in more detail (Table 10). The average DNA coverages (20.1 and 33.4 in OL-KR6/125−130 m (pooled) and OL-KR13/405.5−414.5 m (pooled), respectively) are about twice as large as the average RNA coverages (8.1 and 14.1 in OL-KR6/125−130 m and OL-KR13/405.5−414.5 m, respectively) due to different sequencing depths and sample pooling. The standard deviations relative to the averages for DNA coverage (2.4 for OL-KR6/125−130 m (pooled) and 3.7 for OL-KR13/405.5−414.5 m (pooled) are less than half as large as the standard deviations relative to the averages for RNA coverage (38.6 for OL-KR6/125−130 m and 19.9 for OL-KR13/405.5−414.5 m). This can be explained by the quantity of DNA being proportional to the cell count, while the expression of DNA (i.e. RNA) may be higher or lower and thus being able to show much larger variation in transcription counts (RNA coverages). The exact values of the averages and the standard deviations are sensitive to how many predicted genes have more than 65535 RNA transcripts, i.e. containing highly repetitive sequences, but the trends are not changed. The distribution of both DNA coverages and RNA coverages followed the negative binomial distribution, i.e. the vast majority of gene sequences had relatively low DNA and RNA coverages. Typically; 10% of the sequences accounted for 90% of the total sum

43
of DNA coverages. The coverages of DNA and RNA followed negative binomial distributions as any sequencing data is expected to do. The RNA coverages also contained a few sequences with unplausibly high coverages, possibly due to highly repetitive fragments. The statistics of the distributions of DNA and RNA coverages in OL-KR6/125−130 m and OL-KR13/405.5−414.5 m are shown in Table 10. The mode of a distribution is the value on the abscissa (x-axis) for which the corresponding value on the ordinate (y-axis) is the highest. In this case, the mode represents the most often occurring DNA coverage among all sequences. The modes of the distributions of DNA coverages for OL-KR6/125−130 m and OL-KR13/405.5−414.5 m were approximately one fifth of the averages. 18% of sequences in OL-KR6/125−130 m and 16% of sequences in OL-KR13/405.5−414.5 m had DNA coverages higher than the average. Table 10. Summary statistics such as average and standard deviation of DNA coverage and RNA coverage in metagenome and metatranscriptome samples from OL-KR6/125−130 m and OL-KR13/405.5−414.5 m. The standard deviations relative to the averages (i.e. normalized) are higher for RNA than for DNA, thus indicating that the distributions of RNA coverages are wider than the distributions of DNA coverages.
OL-KR6/125−130 m (pooled)
OL-KR13/405.5−414.5 m (pooled)
Number of sequences 862,407 369,516 Total sum of DNA coverages 17,365,252 12,357,223 Average DNA coverage 20.1 33.4 Standard deviation of DNA coverages 48.2 124.7 The standard deviation relative to the average for DNA coverage
2.4 3.7
Mode of DNA coverage 4 3 Median of DNA coverage 8 8 Sequences with DNA coverage above average
159,332 (18%) 58,475 (16%)
Sum of DNA coverage for sequences having DNA coverage above average
12,102,768 (70%) 9,581,963 (78%)
Total sum of RNA coverages 6,951,291 5,208,597 Average RNA coverage 8.1 14.1 Standard deviation of DNA coverages 311.3 280.9 The standard deviation relative to the average for RNA coverage
38.6 19.9
Mode of RNA coverage ignoring zeros 2 2 Median of RNA coverage ignoring zeros 11 5 Sequences with RNA coverage above average
56,318 (7%) 39,241 (11%)
Sum of RNA coverage for sequences having RNA coverage above average
673,471 (97%) 4,597,099 (88%)
7.2.5 Species abundance - domains
Based on the relative abundance of taxonomic annotations of proteins, archaea were more abundant in the OL-KR13/405.5−414.5 m samples (metagenomes and metatranscriptome) than the OL-KR6/125−130 m samples (Figure 7). The abundance of eukaryotes and viruses was very low, and topped 1% only in the OL-KR6/125−130 m
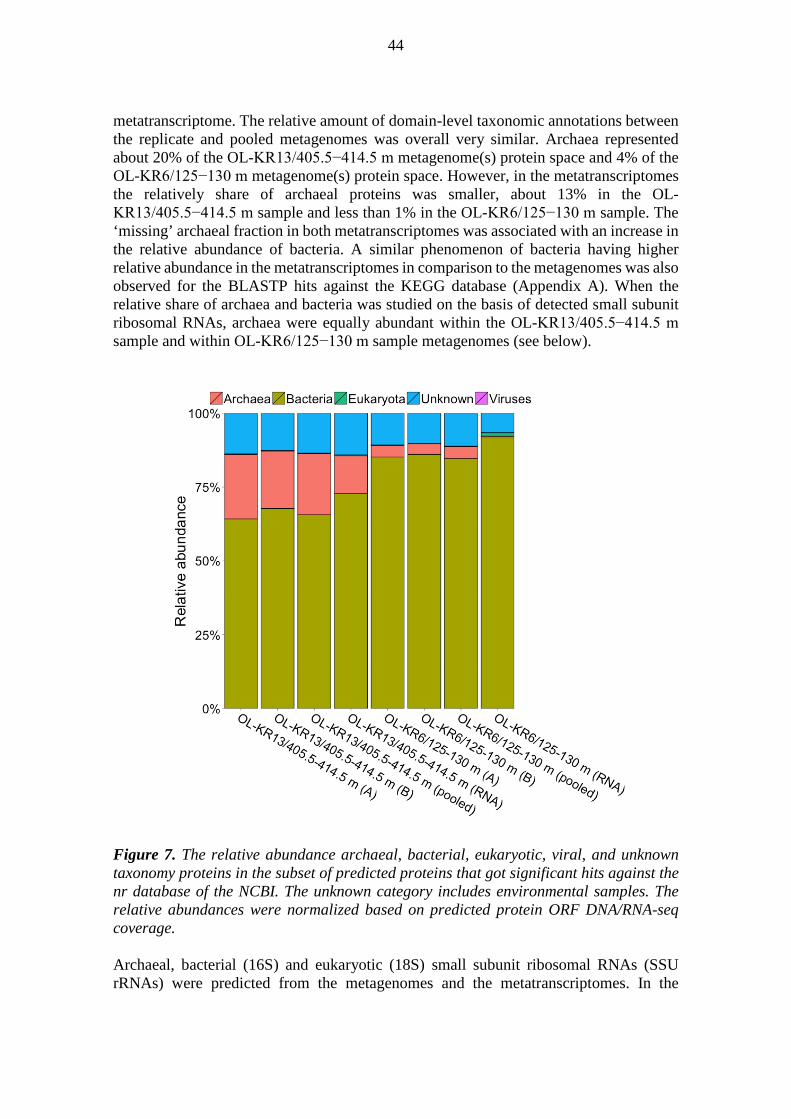
44
metatranscriptome. The relative amount of domain-level taxonomic annotations between the replicate and pooled metagenomes was overall very similar. Archaea represented about 20% of the OL-KR13/405.5−414.5 m metagenome(s) protein space and 4% of the OL-KR6/125−130 m metagenome(s) protein space. However, in the metatranscriptomes the relatively share of archaeal proteins was smaller, about 13% in the OL-KR13/405.5−414.5 m sample and less than 1% in the OL-KR6/125−130 m sample. The ‘missing’ archaeal fraction in both metatranscriptomes was associated with an increase in the relative abundance of bacteria. A similar phenomenon of bacteria having higher relative abundance in the metatranscriptomes in comparison to the metagenomes was also observed for the BLASTP hits against the KEGG database (Appendix A). When the relative share of archaea and bacteria was studied on the basis of detected small subunit ribosomal RNAs, archaea were equally abundant within the OL-KR13/405.5−414.5 m sample and within OL-KR6/125−130 m sample metagenomes (see below).
Figure 7. The relative abundance archaeal, bacterial, eukaryotic, viral, and unknown taxonomy proteins in the subset of predicted proteins that got significant hits against the nr database of the NCBI. The unknown category includes environmental samples. The relative abundances were normalized based on predicted protein ORF DNA/RNA-seq coverage. Archaeal, bacterial (16S) and eukaryotic (18S) small subunit ribosomal RNAs (SSU rRNAs) were predicted from the metagenomes and the metatranscriptomes. In the
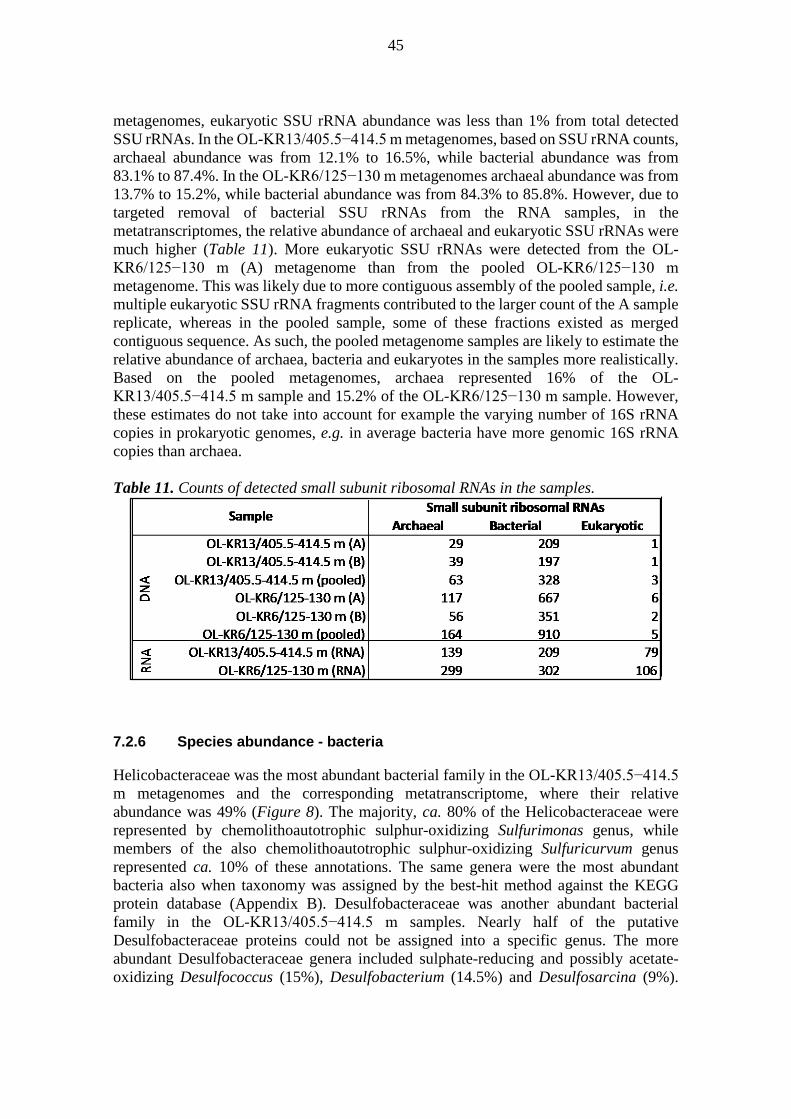
45
metagenomes, eukaryotic SSU rRNA abundance was less than 1% from total detected SSU rRNAs. In the OL-KR13/405.5−414.5 m metagenomes, based on SSU rRNA counts, archaeal abundance was from 12.1% to 16.5%, while bacterial abundance was from 83.1% to 87.4%. In the OL-KR6/125−130 m metagenomes archaeal abundance was from 13.7% to 15.2%, while bacterial abundance was from 84.3% to 85.8%. However, due to targeted removal of bacterial SSU rRNAs from the RNA samples, in the metatranscriptomes, the relative abundance of archaeal and eukaryotic SSU rRNAs were much higher (Table 11). More eukaryotic SSU rRNAs were detected from the OL-KR6/125−130 m (A) metagenome than from the pooled OL-KR6/125−130 m metagenome. This was likely due to more contiguous assembly of the pooled sample, i.e. multiple eukaryotic SSU rRNA fragments contributed to the larger count of the A sample replicate, whereas in the pooled sample, some of these fractions existed as merged contiguous sequence. As such, the pooled metagenome samples are likely to estimate the relative abundance of archaea, bacteria and eukaryotes in the samples more realistically. Based on the pooled metagenomes, archaea represented 16% of the OL-KR13/405.5−414.5 m sample and 15.2% of the OL-KR6/125−130 m sample. However, these estimates do not take into account for example the varying number of 16S rRNA copies in prokaryotic genomes, e.g. in average bacteria have more genomic 16S rRNA copies than archaea. Table 11. Counts of detected small subunit ribosomal RNAs in the samples.
7.2.6 Species abundance - bacteria
Helicobacteraceae was the most abundant bacterial family in the OL-KR13/405.5−414.5 m metagenomes and the corresponding metatranscriptome, where their relative abundance was 49% (Figure 8). The majority, ca. 80% of the Helicobacteraceae were represented by chemolithoautotrophic sulphur-oxidizing Sulfurimonas genus, while members of the also chemolithoautotrophic sulphur-oxidizing Sulfuricurvum genus represented ca. 10% of these annotations. The same genera were the most abundant bacteria also when taxonomy was assigned by the best-hit method against the KEGG protein database (Appendix B). Desulfobacteraceae was another abundant bacterial family in the OL-KR13/405.5−414.5 m samples. Nearly half of the putative Desulfobacteraceae proteins could not be assigned into a specific genus. The more abundant Desulfobacteraceae genera included sulphate-reducing and possibly acetate-oxidizing Desulfococcus (15%), Desulfobacterium (14.5%) and Desulfosarcina (9%).

46
The most abundant Deltaproteobacterial genera according to KEGG taxonomy were Desulfococcus, Desulfatibacilum and Geobacter (Appendix B). Methylococcaceae was the most abundant bacterial family in the OL-KR6/125−130 m metagenomes and particularly the corresponding metatranscriptome, where their relative abundance was nearly 38% (Figure 8). About one third of these proteins could not be assigned to any particular Methylococcaceae genus. However, nearly 60% of the Methylococcaceae in the OL-KR6/125−130 m were determined to represent the genus Methylomonas, and particularly the species Methylomonas methanica, which as its name indicates, is a methanotroph that can obtain both carbon and energy from methane. Methylomonas was the most abundant bacterial genus also according to the KEGG taxonomy (Appendix B). Helicobacteraceae were relatively abundant also in the OL-KR6/125−130 m transcriptome sample. These Helicobacteraceae belonged mainly to the Sulfurimonas (about 70%) and Sulfuricurvum (about 20% in metagenomes, 10% in metatranscriptome) genera that were also identified from the OL-KR13/405.5−414.5 m samples. According to the KEGG taxonomy, the same genera were also abundant in the OL-KR6/125−130 m samples. In addition, the Gammaproteobacterial Acetinobacter genus was abundant (3% from total bacteria in metagenome and metatranscriptome) in the OL-KR6/125−130 m samples (Appendix B).
Figure 8. The relative abundance bacterial family proteins in the subset of predicted proteins that got significant hits against the nr database of the NCBI. All bacterial families that were present in sample in less than 2% abundance (of total bacteria) are summed into the “Other” category. uc_ means unclassified, these annotations could be made reliably only to the last level of taxonomy preceding the uc_ label. For the “unknown” species, the species annotations corresponded largely to environmental samples, for which taxonomy is unknown.
7.2.7 Species abundance - archaea
Methanoperedenaceae was the most abundant archaeal family in the OL-KR13/405.5−414.5 m samples and also relatively common in the OL-KR6/125−130 m
47
samples (Figure 9). This archaeal family is also known as the ANME-2d lineage, which was previously based on 16S rRNA determined to be the most abundant archaeal taxon in especially mixed drillhole samples but also in some baseline drillholes in the deep Olkiluoto biosphere (Miettinen et al., 2015a). Nearly all of the proteins that got a Methanoperedenaceae family classification got Methanoperedens nitroreducens (Haroon et al., 2013) classification at the species level. However, this was likely due to the limited availability of Methanoperedenaceae proteins in public databases, as the average similarity percentage for alignments between the ca. 10,000 Methanoperedenaceae classified proteins and M. nitroreducens subject sequences in BLASTP was only 73.1% for the OL-KR13/405.5−414.5 m (pooled) sample and 66.9% for the ca. 3,000 Methanoperedenaceae proteins in the OL-KR6/125−130 m (pooled) sample. Methanosarcinaceae was another abundant archaeal family in both samples (Figure 9), and particularly the metatranscriptomes: OL-KR13/405.5−414.5 m (17.8%), OL-KR6/125−130 m (31%). In OL-KR13/405.5−414.5 m (pooled), 45% of the Methanosarcinaceae proteins could not be classified below the family level, while in the corresponding metatranscriptome 75% of the proteins could be assigned into a genus. The most abundant Methanosarcinaceae genera in OL-KR13/405.5−414.5 m (pooled) and metatranscriptome were Methanosarcina (44% in pooled, 68% in metatranscriptome) and Methanococcoides (5% in pooled, 1.8% in metatranscriptome). In OL-KR6/125−130 m (pooled), 33% of the Methanosarcinaceae could not be classified below the family level, while in the corresponding metatranscriptome 96% of the proteins could be classified. Methanosarcina (45%) was the most abundant genus in OL-KR6/125−130 m (pooled), while also Methanococcoides (9.6%), Methanosalsum (3.3%), Methanolobus (3.3%) and Methanohalophilus (2.7%) were present in considerable relative abundance within the Methanosarcinaceae family proteins. The OL-KR6/125−130 m metatranscriptome Methanosarcinaceae proteins belonged largely to Methanosarcina (93.7%). Methanosarcinaceae are generally anaerobic methanogens with wide substrate range. They are able to split acetate to methane and carbon dioxide and to catabolize methyl compounds (Bonin, A. S., Boone, 2006). According to KEGG taxonomy, the most abundant archaeal genera in the OL-KR13/405.5−414.5 m samples were Methanosarcina (13.6% from total archaea in the metagenome and 18.1% in the metatranscriptome), Aciduliprofundum (7.1% in the metagenome and 5.8% in the metatranscriptome), Methanocella (6.6% in the metagenome and 7% in the metatranscriptome), and Methanosaeta (6.4% in the metagenome and 9.6% in the metatranscriptome; Appendix C). In the OL-KR6/125−130 m samples, according to KEGG taxonomy, the most abundant archaeal genera were Methanosarcina (7.6% in the metagenome and 9.2% in the metatranscriptome), Methanosaeta (5.2 in the metagenome and 15.8% in the metatranscriptome) and Methanocella (4.8% in the metagenome and 5.3% in the metatranscriptome; Appendix C).

48
Figure 9. The relative abundance archaeal family proteins in the subset of predicted proteins that got significant hits against the nr database of the NCBI. All archaeal families that were present in sample in less than 2% abundance (of total bacteria) are summed into the “Other” category. uc_ means unclassified, these annotations could be made reliably only to the last level of taxonomy preceding the uc_ label. For the “unknown” species, the species annotations corresponded largely to environmental samples, for which taxonomy is unknown.
7.2.8 Metabolic annotations
The metagenomes from OL-KR6/125−130 m (pooled) and OL-KR13/405.5−414.5 m (pooled) contained 862,407 and 369,516 predicted gene sequences having hits in the KEGG database. The amounts of sequences having metabolic annotations (determined by hits in the KEGG database that had KEGG Orthology (KO) annotations as in Table 9) and unique annotations are presented in Table 12 and Table 13, respectively. 56% of the sequences in OL-KR6/125−130 m and 53% of the sequences in OL-KR13/405.5−414.5 m having hits in the KEGG database were also annotated with a KO number. 4% of the unique sequences in OL-KR6/125−130 m and 3% of the unique sequences in OL-KR13/405.5−414.5 m having hits in the KEGG database were also annotated with a KO number. Table 12. Number of sequences having metabolic annotations in samples OL-KR6/125−130 m and OL-KR13/405.5−414.5 m. The sixth row is for sequences having at least one annotation. The top quantile refer to sequences having DNA and RNA coverages above average.
Annotation OL-KR6/125−130 m (pooled) OL-KR13/405.5−414.5 m (pooled)
All Top quantile All Top quantile KEGG orthology number (KO) 480,038 19,068 (4%) 195,979 43,958 (22%) KEGG reaction identifier (RN) 418,398 7,906 (2%) 165,018 17,383 (11%) Enzyme Commission number (EC) 278,457 9,994 (4%) 111,217 21,892 (20%) KEGG module (MD) 345,671 7,951 (2%) 131,779 18,150 (14%) KEGG pathway map (PW) 641,524 11,214 (2%) 254,149 25,893 (10%) Any annotation 862,407 35,070 (4%) 369,516 81,571 (22%)

49
Table 13. Number of unique annotations in metagenomes from OL-KR6/125−130 m and OL-KR13/405.5−414.5 m. The top quantile refer to sequences having DNA and RNA coverages above average.
Annotation OL-KR6/125−130 m (pooled) OL-KR13/405.5−414.5 m (pooled)
All Top quantile All Top quantile Number of unique sequences 96,265 46,501 (48%) 168,972 35,070 (21%) KEGG orthology number (KO) 3,959 3,280 (83%) 5,198 2,633 (51%) KEGG Reaction identifier (RN) 2,006 1,724 (86%) 2,165 1,400 (65%) Enzyme Commission number (EC) 1,406 1,198 (85%) 1,602 1,023 (64%) KEGG module (MD) 412 353 (86%) 479 290 (61%) KEGG pathway map (PW) 315 258 (82%) 352 267 (76%)
7.3 Metabolic analyses
The metabolic analyses of microbial communities in the drillhole waters OL-KR6/125−130 m and OL-KR13/405.5−414.5 m were performed by using the annotated metagenomes and metatranscriptomes obtained after sequencing of DNA and RNA isolated from the microbial biomass, respectively. The replicate samples of DNA were identical. Therefore, only the results for the pooled samples are reported here. The focus of the analysis was the genes and transcripts that encode enzymes catalysing metabolic reactions. The analyses were carried out at levels of pathway maps, metabolic modules, and enzyme functions. Elemental cycling of carbon, nitrogen and sulphur are here demonstrated as metabolic pathway analysis of the whole deep subsurface microbiomes of Olkiluoto drillholes OL-KR6/125−130 m and OL-KR13/405.5−414.5 m. The cycling of elements includes interaction of microorganisms with their environment, transport of C, N or S compounds across the cell membrane, utilization to construct cell components, and maintaining the viability and growth of microorganisms. Assimilatory pathways describe the use of imported elements in metabolism and dissimilatory pathways excrete compounds outside the cell. A pathway map is a visual two-dimensional representation of metabolic functions and processes relating to the topic of the pathway map. Each metabolic function, catalysed by an enzyme, is represented by a box in the pathway map. In this analysis, the metabolic pathways maps (as defined in KEGG) were supplemented with information gained from sequence data analysis from the OL-KR6/125−130 m and the OL-KR13/405.5−414.5 m DNA and RNA samples (Figures 10-14). Two column charts are shown for each metabolic function (enzyme); one chart for each of the two drillhole samples. The OL-KR6/125−130 m sample is always on the left and the OL-KR13/405.5−414.5 m sample is always on the right. The column chart contains three columns. The leftmost column shows the DNA abundancy i.e. the abundance of the gene sequences for the enzyme in the collective microbial gene pool (roughly the number of cells assuming each cell contains one copy). The middle column shows the RNA abundancy for the enzyme gene, reflecting the ‘absolute activity’ of the enzyme gene. The rightmost column shows the relative transcriptional activity (Hua et al., 2015), indicating how transcribed a gene was in relation to how many cells contained it, i.e. how ‘metabolically active’ it was. The height of each column may have five distinct values; 0 for ‘no hits’, 1 for ‘gene rare’, 2 for ‘gene less abundant than average’, 3 for ‘gene more abundant than average’, and 4 for

50
‘gene highly abundant’. The colour of each column follows the column height such that column height 1 is orange, column height 2 is yellow, column height 3 is light green, and column height 4 is dark green. A metabolic process (module) is a set of metabolic functions (e.g. enzymes) commonly occurring together to implement a net function. The functionality of a metabolic process states whether or not the module was operational, i.e. a suitable set of genes were present in the metagenome. The operational functionality of metabolic processes (modules, as defined in KEGG) in OL-KR6/125−130 m and the OL-KR13/405.5−414.5 m microbiomes were assessed using KEGG Mapper, Search Module (http://www.genome.jp/kegg/tool/map_module1.html). A metabolic process was deemed functional if there were DNA evidence of all necessary parts of at least one parallel implementation of the functionality defined by the module. The DNA and RNA abundances and the relative transcriptional activity of genes related to modules were calculated. Many functional modules for carbon fixation, nitrate reduction, and sulphate reduction were found. Also nitrogen fixation, methanogenesis from acetate, methanogenesis from carbon dioxide, acetogenesis, and the majority of rudimentary metabolism were functional in both OL-KR6/125−130 m and OL-KR13/405.5−414.5 m. The most relevant metabolic processes in OL-KR6/125−130 m and OL-KR13/405.5−414.5 m are presented in the Appendix D. Genes encode enzymes, which catalyse metabolic reactions. The presence of genes (DNA) and their transcripts (RNA) in metagenomes and metatranscriptomes, respectively, are string indications that the corresponding enzymatic functions are catalysed by the microbial community. The DNA abundances and the RNA abundances of enzyme functions were calculated by grouping sequences having been annotated with KEGG orthology identifiers (KO) or Enzyme Commission numbers (EC). Both KO and EC are classification systems for enzyme functions. In general, neither classification system is a subset of the other. Genes can also be part of metabolic processes (modules). The analysis of enzyme functions performed in this work was limited to gene sequences not having been annotated with module identifiers. Written description (Appendix E) and evaluation of the most relevant enzyme functions in OL-KR6/125−130 m and in OL-KR13/405.5−414.5 m are presented in table form in Appendixes F and G, respectively. In the Appendix H, all genes that were directly involved with sulphate reduction to sulphide (HS-) are presented. The gene counts, abundances of DNA and RNA, and the relative transcriptional activity of the most important KEGG orthology (KO) numbers relating to sulphur-chemistry are summarized.
7.3.1 Sulphur metabolism
The metabolic pathway map for sulphur metabolism showing assimilatory sulphate reduction, dissimilatory sulphate reduction, thiosulphate oxidation, sulphite oxidation, polysulphide synthesis, polysulphide degradation, sulphur-oxidation, sulphur-reduction, and sulphide-oxidation is shown in Figure 10.

51
Figure 10. The metabolic pathway map for sulphur metabolism showing assimilatory sulphate reduction (blue highlight, thick line), dissimilatory sulphate reduction (purple highlight, thick line), thiosulphate oxidation (orange highlight, thin line), sulphite oxidation, polysulphide synthesis (dark red highlight, thick line), polysulphide degradation (red arrow), reactions with elemental sulphur (polygon with blue dashed line), and sulphide assimilation (magenta highlight, thin line). Boxes for each metabolic function have two column charts; the left chart is for the OL-KR6/125−130 m sample and the right chart is for the OL-KR13/405.5−414.5 m sample. Each column chart includes three columns, the first for the DNA adundancy, the second for the RNA abundancy and the last for the relative transcriptional activity. The height and colour of each column may have five distinct values; 0 for ‘no hits’, 1 for ‘gene rare’ (orange), 2 for ‘gene less abundant than average’ (yellow), 3 for ‘gene more abundant than average’ (light green), and 4 for ‘gene highly abundant’ (dark green). Sulphur oxidation/reduction Microbial sulphur metabolism is complex and connected to other elemental cycles. The increase in sulphate (SO4
2-) and sulphide (HS-) in groundwater may also occur through oxidation or reduction of elemental sulphur. However, in this study, no known genes (fccAB (sulfide:flavocytochrome c oxidoreductase), ethe1 (sulphur dioxygenase), sor
dsrAB
asrABC
cysIJ
sir
hydABDG
sulT
sat
aprAB fcc sor
sorB
sqr
phsABC
sat aprAB sir
cysIJ
dsrAB
52
(sulphur oxygenase reductase), sreABC (sulphur reductase)) interacting with elemental sulphur were detected (polygon with blue dashed line in Figure 10). Transport of sulphate into cells Sulphate (SO4
2-) was abundant in both OL-KR6/125−130 m and OL-KR13/405.5−414.5 m water samples, although over 10 times higher sulphate (SO4
2-) concentrations were detected in OL-KR6/125−130 m than in OL-KR13/405.5−414.5 m (Table 3). Sulphate transport across the cell membrane (marked with thin olive green highlight in Figure 10) might be facilitated by the ABC transporter (sulT) or sulphate permease (sulP) (Mendez-Garcia et al., 2015; Rabus et al., 2015a). Sulphate permease may also facilitate the transfer of thiosulphate (S2O3
2-) (Barrett and Clark, 1987). The ABC transporter for sulphate (SO4
2-) uptake (sulT) was significantly more abundant in terms of both DNA and RNA in OL-KR6/125−130 m than in OL-KR13/405.5−414.5 m. Sulphate permease (sulP), however, was even more abundant than sulT in both microbiomes. Assimilatory sulphate reduction In assimilative sulphate reduction, sulphate (SO4
2-) can be taken up and reduced to sulphide (HS-), which can then be incorporated into sulphur-containing amino acids and proteins. The assimilatory path for sulphate reduction to sulphite (SO3
2-) (left half of the thick blue highlight in Figure 10) occurs through adenylyl sulphate (APS) and 3'-phosphoadenylyl sulphate (PAPS) and is irreversible. The enzyme genes associated with these reactions were abundant and transcribed in both OL-KR6/125−130 m and OL-KR13/405.5−414.5 m microbiomes. The assimilatory sulphite reductase enzymes (right half of the thick blue highlight in Figure 10) presumably catalyse the reduction of sulphite (SO3
2-) when the organism has sufficient chemiosmotic energy and is therefore unlikely to function in the reverse direction. These genes (cysIJ) were more abundant in OL-KR6/125−130 m than in OL-KR13/405.5−414.5 m, but about equally transcribed in both the OL-KR6/125−130 m and the OL-KR13/405.5−414.5 m microbiomes. The genes asrABC and sir (blue arrows in Figure 10) had low abundancies in OL-KR13/405.5−414.5 m, but were apparently absent in OL-KR6/125−130 m. Dissimilatory sulphate reduction/sulphite oxidation The dissimilatory path for sulphate reduction to sulphite (SO3
2-) (left half of the thick purple highlight in Figure 10) is reversible and would produce ATP when sulphite (SO3
2-
) is oxidized to sulphate (SO42-). The dissimilatory sulphite reductase enzymes (right half
of the thick purple highlight in Figure 10) catalyse the reduction of sulphite (SO32-) when
the organism has insufficient chemiosmotic energy and is in fact drawing energy out of the reduction reaction. This reaction is easily reversed by the law of mass action in cases where there is sufficient chemiosmotic energy from other sources. The first step of dissimilatory sulphate reduction is catalysed by ATP sulfurylase (sat) and the second reaction is catalysed by APS reductase (aprAB). These genes were abundant in both the OL-KR6/125−130 m and the OL-KR13/405.5−414.5 m microbiomes. However, the transcription of the genes were higher in OL-KR6/125−130 m than in OL-KR13/405.5−414.5 m. The last reaction in the pathway is catalysed by sulphite reductase. The genes coding for this enzyme, dsrA and dsrB (purple arrow in Figure 10) were more abundant in OL-KR13/405.5−414.5 m than in OL-KR6/125−130 m, but there were about equally transcribed in both microbiomes. The Dsr enzymes may
53
have also been involved in disproportionation reactions. Neither sample contained the archaeal sorB (sulphite:cytochrome c oxidoreductase, not to be confused with sulphur:oxygen oxidoreductase, sor) gene for sulphite (SO3
2-) oxidation to sulphate (SO4
2-). Sulphide - polysulphide association The genes for shuttling sulphide (HS-) to and from polysulphide (hydABDG, sqr) were more abundant and more transcribed in OL-KR13/405.5−414.5 m than in OL-KR6/125−130 m. In both samples, the gene for polysulphide synthesis (sqr, thick dark red highlight in Figure 10) was more abundant and more transcribed than the genes for polysulphide depolymerisation (hydABDG, red arrow in Figure 10). Thiosulphate oxidation/reduction The genetic abundance and transcription of selected sox genes for oxidizing thiosulphate (S2O3
2-) to sulphate (SO42-) (thin orange highlight in Figure 10) were higher in OL-
KR6/125−130 m than in OL-KR13/405.5−414.5 m. Only one of the sox genes was abundant and highly transcribed in OL-KR6/125−130 m; a gene encoding a c-type cytochrome. Although a large quantity of a redox protein such as a cytochrome might indicate an electron buffer as in the case of rusticyanin for Acidithiobacillus ferrooxidans, the unusually high DNA coverage with respect to the other proteins in the sox system suggest the cytochrome (also) has other functions. The reversible reduction of thiosulphate (S2O3
2-) to hydrogen sulphide (H2S) can be catalysed by the membrane-associated enzyme thiosulphate reductase (phsA, phsB, and phsC), which was present but not abundant in both OL-KR6/125−130 m and OL-KR13/405.5−414.5 m (Figure 10).
7.3.2 Nitrogen metabolism
The metabolic pathway map for nitrogen metabolism is presented in Figure 11. The pathways of main interest are dissimilatory nitrate reduction, nitrogen fixation and denitrification as these pathways may provide energy to microbial cells. Nitrogen metabolism may be divided into assimilatory processes and dissimilatory processes. The dissimilatory processes function as alternative electron acceptors, while the assimilatory processes produce and sequester ammonium ions.

54
Figure 11. The metabolic pathway map for nitrogen metabolism showing dissimilatory nitrate reduction, assimilatory nitrate reduction, denitrification, nitrogen fixation, nitrification, anammox, and ammonia assimilation (oval with blue dashed line). Boxes for each metabolic function have two column charts, the left chart is for the OL-KR6/125−130 m sample and the right chart is for the OL-KR13/405.5−414.5 m sample. Each column chart includes three columns, the first for the DNA adundancy, the second for the RNA abundancy and the last for the relative transcriptional activity. Height and colour of each column may have five distinct values; 0 for ‘no hits’, 1 for ‘gene rare’ (orange), 2 for ‘gene less abundant than average’ (yellow), 3 for ‘gene more abundant than average’ (light green), and 4 for ‘gene highly abundant’ (dark green). Nitrate reduction and the transport of nitrate and nitrite into cells Nitrite (NO2
-) and nitrate (NO3-) concentrations in OL-KR6/125−130 m and OL-
KR13/405.5−414.5 m were below the detection limits (Table 3, 0,2 and 0,4 mg L-1, respectively). The genes coding the ABC transporter for nitrate (NO3
-), nitrite (NO2-), and
cyanate (OCN-) (thin olive green highlight in Figure 11) were abundant and transcribed in both samples, thus uptake would have been enabled. ABC transporters utilize the energy of ATP hydrolysis to transport various substrates across cellular membranes, and are thus able to function with lower substrate concentrations than permeases. Both dissimilatory nitrate reductases (narGHIJ, napAB, purple arrows in Figure 11) and
narGHIJ
napAB
narB
nasAB nirA
nirBD nrfAH
nifDKH
nasAB narB
narGHIJ napAB
nirA
nrfAH nirBD

55
assimilatory nitrate reductases (narB, nasAB, blue arrows in Figure 11) were present in both samples. napAB and narB were more abundant in OL-KR13/405.5−414.5 m than in OL-KR6/125−130 m, while narGHIJ and nasAB were more abundant in OL-KR6/125−130 m than in OL-KR13/405.5−414.5 m. nasA, napAB, and narB were moderately transcriptionally active, but narGHIJ was transcribed in negligible amounts. The periplasmic nitrate reductase napA is structurally similar (belong to the same SCOP family) to formate dehydrogenase SCOP database ver 1.75 e.g. http://scop.mrc-lmb.cam.ac.uk/scop/data/scop.b.c.ii.c.c.html and http://scop.mrc-lmb.cam.ac.uk/scop/data/scop.b.d.bbj.b.b.html. Dissimilatory and assimilatory nitrite reduction to ammonia Nitrite reduction to ammonia may have been catalysed independently by three enzymes corresponding to the genes nirA (magenta arrow in Figure 11), nirBD (orange arrow in Figure 11), and nrfAH (red arrow in Figure 11). In OL-KR6/125−130 m, the most abundant enzyme was nirBD, but both nrfAH and nirA were relatively more transcribed than nirBD. In OL-KR13/405.5−414.5 m, nirA was both the most abundant and the most transcribed enzyme, followed by nirBD, and nrfAH. The moderate relative transcriptional activities of nirA, nirBD, and nrfAH in OL-KR13/405.5−414.5 m implied that this process was not particularly important for the cells. In OL-KR6/125−130 m, however, the nirA and nrfH were highly transcriptionally active, while the relative transcriptional activities of nirDB and nrfA were modest. The nrf enzyme complex is known for reducing both nitrite (NO2
-) and nitrate (NO3-) and commonly found in SRBs e.g. Desulfovibrio
vulgaris. The nrfA gene mitigates the inhibitory effect of nitrite (NO2-) on sulphite
reduction by removing the inhibitor (Greene et al., 2003; Rabus et al., 2015a). While no intermediates of the reaction are released, nrfA is able to reduce various other nitrogen oxides such as nitric oxide (NO), hydroxylamine (H2NOH), and nitrous oxide (N2O), but notably also sulphite (SO3
2-), providing the only known direct link between the nitrogen and sulfur cycles (Einsle, 2011). In δ- and ε-proteobacteria, nrfA is known to form a complex with nrfH, allowing a more efficient electron transfer (Einsle, 2011). The numbers of distinct gene sequences for nirA and nrfH were similar in contrast to nirBD or nrfA. Thus, it may have been possible that nirA and nrfH were exchanging electrons in OL-KR6/125−130 m. (Schnell et al., 2005) reported that nirA from Mycobacterium tuberculosis was a sulphite reductase. Both the nirA enzyme in Mycobacterium tuberculosis and the nir enzyme in Spinacia oleracea belong to the same SCOP family as sulphite reductases and it has been shown that these enzymes catalyse the reduction of sulphite (SCOP database ver 1.75 e.g. http://scop.mrc-lmb.cam.ac.uk/scop/data/scop.b.e.bcj.ef.b.html and http://scop.mrc-lmb.cam.ac.uk/scop/data/scop.b.e.chg.b.b.html, Schnell et al., (2005). Thus, it is entirely plausible that some of the gene sequences detected in OL-KR6/125−130 m having high relative transcriptional activities may have been sulphite reductases rather than nitrite reductases. Nitrogen fixation Both samples contained the nifDKH genes for nitrogen fixation (dark red arrow in Figure 11). The genes nifD, nifK, and nifH were equally abundant and equally transcribed in OL-KR13/405.5−414.5 m and OL-KR6/125−130 m, but nifK was more abundant and significantly more transcribed than nifD or nifH in OL-KR6/125−130 m. Nitrogen fixation (M00175) was the main electron sink in OL-KR13/405.5−414.5 m, but sparingly

56
transcribed in OL-KR6/125−130 m (Appendix D). Although neither sample contained the nitrogenase delta subunit anfG, several nitrogen fixation supporting enzymes were found in abundance and were also highly transcribed in OL-KR13/405.5−414.5 m; nitrogen fixation protein (nifw; K02595), nitrogen fixation protein (nifx; K02596), nitrogenase mofe cofactor biosynthesis protein (nife; K02587), nitrogenase molybdenum-iron cofactor biosynthesis protein (nifn; K02592), nitrogen-fixing NifU-like protein (K13819), and molybdenum transport protein (modD; K03813) (Appendix E-G). Nitrogen assimilation The main uses of ammonim ions were found to be amino acids with nitrogen-containing side chains (e.g. lysine and arginine), polyamines (agmatine, putrescine, spermidine, and spermine), and assimilatory sinks such as nucleotide bases. Ammonium assimilation (oval with blue dashed line in Figure 11) was more transcribed in OL-KR6/125−130 m than in OL-KR13/405.5−414.5 m. The metabolism of lysine and polyamines differed in the two samples; OL-KR6/125−130 m obtained more lysine and polyamines from the environment (as evidenced by the corresponding ABC transporters on map 02010, Appendix I) while OL-KR13/405.5−414.5 m focused on the biosynthesis of lysine and polyamines (maps 00300, Appendix J and 00330, Appendix K). The ABC transporters for lysine, spermidine, and putrescine uptake were transcribed in OL-KR6/125−130 m at low levels (map 02010, Appendix I). There was an additional lysine biosynthesis pathway active in OL-KR13/405.5−414.5 m (map 00300, Appendix J). Lysine was degraded via 3,5-diaminohexanoate in OL-KR6/125−130 m, but via saccharopine in OL-KR13/405.5−414.5 m (map 00310, Appendix L). The lysine degradation path via 3,5-diaminohexanoate is associated with anaerobic lysine degradation (Kreimeyer et al., 2007)), while saccharopine is also an intermediate in the lysine biosynthesis pathway (M00030) found exclusively in OL-KR13/405.5−414.5 m. The highly abundant and highly transcriptionally active biosynthesis of lysine (M00527, M00016), nucleotides (M00048), histidine (M00026), phosphatidylethanolamine (M00093), ornithine (M00028), and polyamines (M00133) indicated a need for ammonia storage in OL-KR13/405.5−414.5 m (Appendix D). Both samples shuttled flux from arginine to agmatine (an especially nitrogen-rich compound), from N-carbomoyl-putrescine to putrescine, and further to spermidine and spermine (map 00330, Appendix K). The last two steps, i.e. the formation of spermidine and spermine, require S-adenosyl-methioninamide, the synthesis of which was lower in OL-KR13/405.5−414.5 m than in OL-KR6/125−130 m (map 00270, Appendix M). In OL-KR6/125−130 m, 4-aminobutanoate was obtained primarily from arginine through the arginine dihydrolase (ADH) pathway. In OL-KR13/405.5−414.5 m, 4-aminobutanoate was obtained primarily from putrescine through the arginine decarboxylase (ADC) pathway. It is therefore likely that spermine and spermidine were depolymerized in OL-KR13/405.5−414.5 m to putrescine, with the simultaneous generation of S-adenosyl methioninamine, which was further converted to methyl-5-thio-D-ribulose-1-phosphate. The consumption of S-adenosyl methioninamine to S-methyl-5-thio-D-ribulose 1-phosphate was higher in OL-KR13/405.5−414.5 m than in OL-KR6/125−130 m. Methyl-5-thio-D-ribulose-1-phosphate is a sulphur-analog to ribulose-1,5-bisphosphate, which is the primary substrate for Rubisco in the calvin cycle. Upon the action of Rubisco, methyl-5-thio-D-ribulose-1-phosphate splits into 3-phosphoglycerate, a metabolite in the central carbon metabolism, and methyl-3-mercaptopyruvate, a methylated derivative of 3-
57
mercaptopyruvate. The methyl group can be shuttled to methanogenesis/acetogenesis or reused within the cell. 3-mercaptopyruvate can be easily desulphurised to pyruvate with the concomitant formation of thiosulphate (S2O3
2-) from sulphite (SO32-) through the
catalytic action of thiosulfate/3-mercaptopyruvate sulfurtransferase (rhodanese). This explains the formation and consumption of intracellular thiosulphate.
7.3.3 Methane metabolism and carbon fixation
Methane was detected in water samples from both OL-KR6/125−130 m (1,810 ppm) and OL-KR13/405.5−414.5 m (214,000 ppm). The KEGG metabolic pathway map of methane metabolism (Figure 12) includes aerobic methane oxidation, three methanogenesis pathways (from CO2, from acetate, or from stored methyl groups), and one acetogenesis pathway, and two formaldehyde assimilation pathways (the ribulose monophosphate cycle and the serine cycle). The metabolic map in Figure 12 also contains the biosynthesis paths for coenzyme B, coenzyme M, methanofuran, and coenzyme F420. The pathway map showing the Calvin cycle for carbon fixation is shown in Figure 13. The pathway map of carbon fixation paths in prokaryotes showing the reductive citric acid cycle and the bacterial Wood-Ljungdahl pathway is shown in Figure 14.
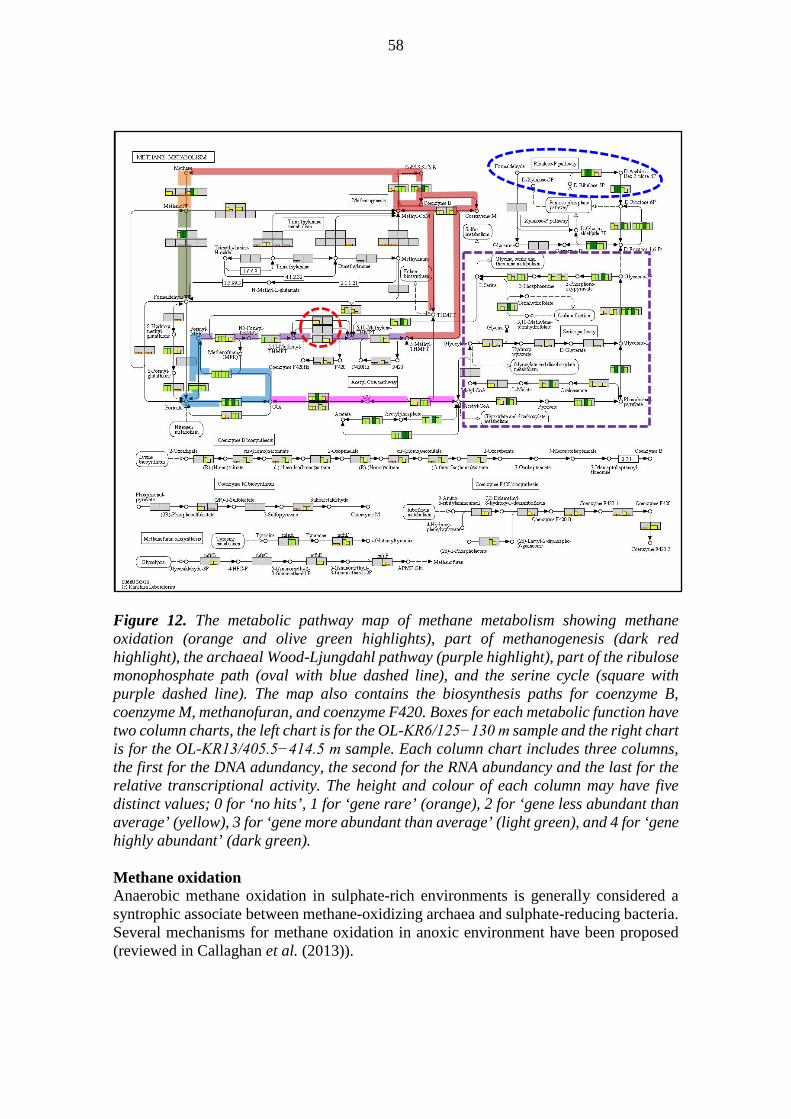
58
Figure 12. The metabolic pathway map of methane metabolism showing methane oxidation (orange and olive green highlights), part of methanogenesis (dark red highlight), the archaeal Wood-Ljungdahl pathway (purple highlight), part of the ribulose monophosphate path (oval with blue dashed line), and the serine cycle (square with purple dashed line). The map also contains the biosynthesis paths for coenzyme B, coenzyme M, methanofuran, and coenzyme F420. Boxes for each metabolic function have two column charts, the left chart is for the OL-KR6/125−130 m sample and the right chart is for the OL-KR13/405.5−414.5 m sample. Each column chart includes three columns, the first for the DNA adundancy, the second for the RNA abundancy and the last for the relative transcriptional activity. The height and colour of each column may have five distinct values; 0 for ‘no hits’, 1 for ‘gene rare’ (orange), 2 for ‘gene less abundant than average’ (yellow), 3 for ‘gene more abundant than average’ (light green), and 4 for ‘gene highly abundant’ (dark green). Methane oxidation Anaerobic methane oxidation in sulphate-rich environments is generally considered a syntrophic associate between methane-oxidizing archaea and sulphate-reducing bacteria. Several mechanisms for methane oxidation in anoxic environment have been proposed (reviewed in Callaghan et al. (2013)).

59
There is substantial evidence supporting the anaerobic oxidation of methane via direct reversal of the methanogenesis pathway (Hoehler, 2004). Thus, the genes associated with methanogenesis are also associated with reverse methanogenesis, i.e. the anaerobic oxidation of methane. Methyl-coenzyme M reductase (mcr), heterodisulphide reductase (hdr), and tetrahydromethanopterin S-methyltransferase (dark red highlights in Figure 12), the key enzymes in methanogenesis were more abundant and more transcribed in OL-KR13/405.5−414.5 m than in OL-KR6/125−130 m, but the pathway appeared active in both habitats. The genes coding for methane consumption through reverse methanogenesis to acetate (M00357, Appendix D) were equally abundant as opposed to the genes for reverse methanogenesis to CO2 (M00567, Appendix D). Thus, acetate may have been the main carbon-product of anaerobic methane oxidation. In OL-KR13/405.5−414.5 m, reverse methanogenesis from methane to acetate (M00357, Appendix D) dominated methane utilization. While not conclusive evidence for reverse methanogenesis to acetate, since acetate can be produced also by several carbon fixation pathways, the cation/acetate symporter (actP; K14393) having been moderately abundant in OL-KR13/405.5−414.5 m would suggest that at least some acetate was trafficked between organisms. Although the coupling between anaerobic methane oxidation and sulphate reduction in AMNE-2 archea remains unclear, the participation of formylmethanofuran dehydrogenase (fwd; EC 1.2.99.5), has been proposed (Milucka et al., 2012). The genes and transcripts for this enzyme were abundant both in OL-KR6/125−130 m and in OL-KR13/405.5−414.5 m. Methane oxidation in aerobic conditions occurs via methane monooxygenases. It has been proposed that this route can be functional also in anoxic environment e.g. when coupled to the dismutation of nitric oxide (NO) and the concomitant intracellular oxygen production (in denitrifying bacteria, Ettwigg et al. (2010)). The OL-KR6/125−130 m metagenome contained genes for both the particulate and the soluble forms of the methane monooxygenases catalysing methane oxidation to methanol (orange highlight in Figure 12). The particulate form was highly transcribed. The OL-KR6/125−130 m metagenome also contained a gene for an enzyme for the direct oxidation of methanol to formaldehyde with cytochrome cL as the electron acceptor (olive green highlight in Figure 12). The same path was not detected in the OL-KR13/405.5−414.5 m metagenome. Given the reactive nature of formaldehyde, the different abundances of methane and methanol oxidation enzymes (Figure 12), and the similar abundancy of formaldehyde-producing and formaldehyde-consuming enzymes, it is likely that methanol was produced by one organism and consumed by another. Formaldehyde assimilation The OL-KR6/125−130 m metatranscriptome was more abundant than the OL-KR13/405.5−414.5 m metatranscriptome with transcripts for the enzymes of the ribulose monophosphate path for formaldehyde assimilation (oval with blue dashed line in Figure 12). The genes for formaldehyde assimilation through the serine cycle (M00346, Appendix D) or a modification using some of the enzymes from the Leucine degradation pathway (M00036, Appendix D) were also abundant, but sparingly transcribed. The serine cycle
60
(square with purple dashed line in Figure 12) appeared complete in OL-KR6/125−130 m, but malate:CoA ligase was not found in the metagenome of OL-KR13/405.5−414.5 m. The gene may have differed too much from the known enzymes and was therefore not annotated correctly, or the reaction catalysed by the known enzyme (K09011, D-citramalate synthase) was implemented by two other enzymes; succinyl-CoA:D-citramalyl-CoA transferase (K18313) and R-citramalyl-CoA lyase (K18314). Regardless of its completeness, the serine cycle remained a minor pathway for formaldehyde assimilation in these drillhole communities. Formate and carbon dioxide ‘cycling’ OL-KR6/125−130 m and also OL-KR13/405.5−414.5 m, transcribed enzyme genes catalysing a cycle producing and consuming formate and carbon dioxide (thin blue highlight in Figure 12). The cycle may have been a method for syntrophic organisms to transfer energy from one organism to the other. Alternatively, the enzyme has been proposed to be essential for direct sulphate reduction to sulphite (Milucka et al., 2012)) and direct nitrite reduction to ammonium (nrf). The cycle was in relative terms more actively transcribed in OL-KR6/125−130 m than in OL-KR13/405.5−414.5 m. The cycle is often thought to employ methanofuran, but the known methanofuran biosynthesis path was found present and active only in OL-KR13/405.5−414.5 m. Therefore, OL-KR6/125−130 m must have been using another molecule (possibly glutathione) in the cycle or a yet unknown biosynthesis pathway for methanofuran. Carbon fixation by Wood-Ljungdahl paths The acetyl-CoA-forming Wood-Ljungdahl path for carbon fixation in archaea (tetrahydromethanopterin-mediated, purple highlight in Figure 12) and in bacteria (tetrahydrofolate-mediated, purple highlight in Figure 14) are shown in Figures 12 and 14. Archaeal (Figure 12) and bacterial (Figure 14) Wood-Ljungdahl paths were more abundant in OL-KR13/405.5−414.5 m than in OL-KR6/125−130 m. The tetrahydromethanopterin-mediated archaeal pathway appeared complete in OL-KR13/405.5−414.5 m, but incomplete in OL-KR6/125−130 m. The biosynthesis paths (map 00790, Appendix N) for pterins (e.g. tetrahydromethanopterin and tetrahydrosarcinopterin) and folate (e.g. tetrahydrofolate) were abundant in both samples, but more abundant in OL-KR13/405.5−414.5 m than in OL-KR6/125−130 m. The direction in which the archaeal Wood-Ljungdahl pathway was being catalysed may have been indicated by the cofactor-specificity of methylenetetrahydromethanopterin dehydrogenase (circle with red dashed line in Figure 12). In OL-KR6/125−130 m, the cofactor was NADP and would presumably be consistent with oxidation (reverse methanogenesis or reverse acetogenesis). In OL-KR13/405.5−414.5 m, the cofactor was Coenzyme F420 and would be consistent with reduction (methanogenesis or acetogenesis). The detection of carbon monoxide in OL-KR6/125−130 m (2.92 ppm), if not from abiotic origin, would have been consistent with an active acetogenenic path (magenta highlight in Figure 12).
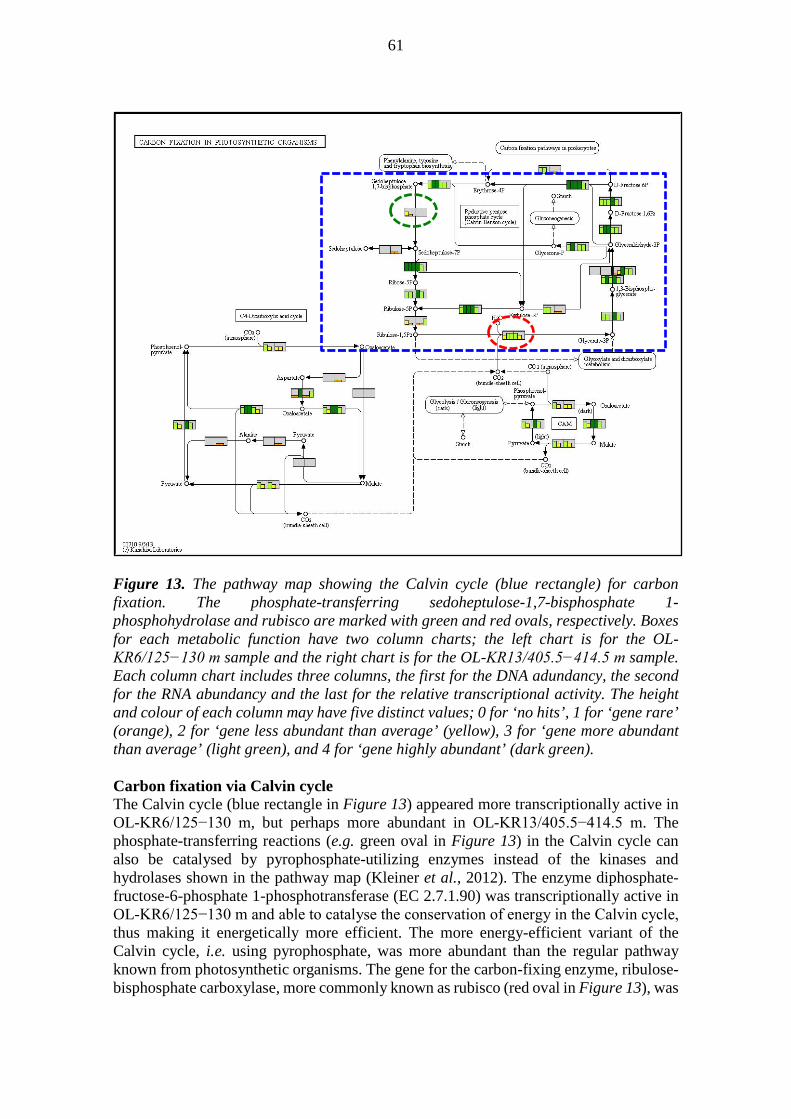
61
Figure 13. The pathway map showing the Calvin cycle (blue rectangle) for carbon fixation. The phosphate-transferring sedoheptulose-1,7-bisphosphate 1-phosphohydrolase and rubisco are marked with green and red ovals, respectively. Boxes for each metabolic function have two column charts; the left chart is for the OL-KR6/125−130 m sample and the right chart is for the OL-KR13/405.5−414.5 m sample. Each column chart includes three columns, the first for the DNA adundancy, the second for the RNA abundancy and the last for the relative transcriptional activity. The height and colour of each column may have five distinct values; 0 for ‘no hits’, 1 for ‘gene rare’ (orange), 2 for ‘gene less abundant than average’ (yellow), 3 for ‘gene more abundant than average’ (light green), and 4 for ‘gene highly abundant’ (dark green). Carbon fixation via Calvin cycle The Calvin cycle (blue rectangle in Figure 13) appeared more transcriptionally active in OL-KR6/125−130 m, but perhaps more abundant in OL-KR13/405.5−414.5 m. The phosphate-transferring reactions (e.g. green oval in Figure 13) in the Calvin cycle can also be catalysed by pyrophosphate-utilizing enzymes instead of the kinases and hydrolases shown in the pathway map (Kleiner et al., 2012). The enzyme diphosphate-fructose-6-phosphate 1-phosphotransferase (EC 2.7.1.90) was transcriptionally active in OL-KR6/125−130 m and able to catalyse the conservation of energy in the Calvin cycle, thus making it energetically more efficient. The more energy-efficient variant of the Calvin cycle, i.e. using pyrophosphate, was more abundant than the regular pathway known from photosynthetic organisms. The gene for the carbon-fixing enzyme, ribulose-bisphosphate carboxylase, more commonly known as rubisco (red oval in Figure 13), was

62
more abundant in OL-KR13/405.5−414.5 m than in OL-KR6/125−130 m, but much more transcribed in OL-KR6/125−130 m than in OL-KR13/405.5−414.5 m. The rubisco enzyme consists of a large chain subunit and a small chain subunit. The gene for the large chain subunit was three times as abundant and more than eight times as transcribed as the small chain subunit in OL-KR6/125−130 m. The small chain subunit was not found at all in the OL-KR13/405.5−414.5 m metagenome.
Figure 14. The pathway map of carbon fixation paths in prokaryotes showing the reductive citric acid cycle (blue highlight) and the bacterial Wood-Ljungdahl pathway (purple highlight). Boxes for each metabolic function have two column charts; the left chart is for the OL-KR6/125−130 m sample and the right chart is for the OL-KR13/405.5−414.5 m sample. Each column chart includes three columns, the first for the DNA adundancy, the second for the RNA abundancy and the last for the relative transcriptional activity. The height and colour of each column may have five distinct values; 0 for ‘no hits’, 1 for ‘gene rare’ (orange), 2 for ‘gene less abundant than average’ (yellow), 3 for ‘gene more abundant than average’ (light green), and 4 for ‘gene highly abundant’ (dark green). Reductive citric acid cycle for carbon fixation The OL-KR6/125−130 m and OL-KR13/405.5−414.5 m samples were abundant in genes and transcripts common to the oxidative and the reductive citric acid cycles. Only OL-
63
KR13/405.5−414.5 m contained the genes, citryl-CoA synthase and citryl-CoA lyase (blue oval in Figure 14), in low amounts, presumed to be characteristic genes of the reductive citric acid cycle. The reductive citric acid cycle might also operate with the citrate-splitting enzyme (ATP citrate lyase), which was present and actively transcribed in both OL-KR6/125−130 m and OL-KR13/405.5−414.5 m. The genes for the citric acid cycle were highly abundant in both samples, but citric acid cycle enzymes catalysing purely oxidative reactions were found only in OL-KR6/125−130 m (map 00020, Appendix O).
7.3.4 Hydrogen
There are generally two classes of hydrogenases; those used in electron transport chains and those that aren’t. The latter class contains mainly soluble hydrogenases, while the former contains mainly membrane-bound hydrogenases. Both types of hydrogenases were present in both samples. Apart from the [NiFe]-hydrogenase diaphorase moiety (hoxF and hoxU) (K18005 and K18006), and the hydrogenase reducing an unknown acceptor (K06281 and K06282), all hydrogenases were more abundant in OL-KR13/405.5−414.5 m than in OL-KR6/125−130 m. In OL-KR6/125−130 m, the [NiFe]-hydrogenase diaphorase moiety (hoxF and hoxU) (K18005 and K18006), the hydrogenase reducing an unknown acceptor (K06281 and K06282), and the NAD-reducing hydrogenase (K00436 and K18007) were abundant and moderately transcribed, while the other hydrogenases were less abundant and only modestly transcribed. In OL-KR13/405.5−414.5 m, the F420-non-reducing hydrogenase (K14126, K14127, and K14128), the membrane-bound hydrogenase (K18016, K18017, and K18023), the hydrogenase reducing an unknown acceptor (K06281 and K06282), the ferricytochrome c3-reducing [NiFe] hydrogenase (K00437 and K18008), the menaquinone-reactive Ni/Fe-hydrogenase (K05922 and K05927), and the NAD-reducing hydrogenase (K00436 and K18007) were abundant and moderately transcribed, while the other hydrogenases were less abundant and only modestly transcribed. The F420-non-reducing hydrogenase (K14126, K14127, and K14128), the membrane-bound hydrogenase (K18016, K18017, and K18023), and the NADP-reducing hydrogenase (K17992, K18330, K18331, and K18332) enzymes catalyse the reduction of redox cofactors with reduction potential close to the reduction potential of hydrogen, thus conserving the energy. The membrane-bound, ferricytochrome c3-reducing [NiFe] hydrogenase (K00437 and K18008), the menaquinone-reactive Ni/Fe-hydrogenase (K05922 and K05927) reduce redox cofactors with reduction potential far from the reduction potential of hydrogen and thus presumably pump protons, i.e. generate energy for the organism. It can therefore be concluded that both microbiomes produced NADH from H2. While the other uses of dissolved H2 in OL-KR6/125−130 m remain unknown, it is clear that a larger fraction of dissolved H2 in OL-KR13/405.5−414.5 m was used directly for energy generation. Although none of the hydrogenases in OL-KR6/125−130 m and OL-KR13/405.5−414.5 m were particularly active, their combined DNA coverage would suggest that many organisms had the capacity to consume dissolved hydrogen gas (H2).
64
Nitrogen fixation produces hydrogen gas as a necessary side product (Hoffman et al., 2013; Igarashi and Seefeldt, 2003). Nitrogen fixation was more active in OL-KR13/405.5−414.5 m than in OL-KR6/125−130 m. Despite the obvious correlation of hydrogen production due to nitrogen fixation and the higher abundance of hydrogenases in OL-KR13/405.5−414.5 m, this does not necessitate a dependence because the geochemical environment may produce (or may have produced in the past) more hydrogen at OL-KR13/405.5−414.5 m than at OL-KR6/125−130 m. Methanogens are the dominant hydrogenotrophs in many environments since methanogens have a lower threshold for H2 than acetogens (Heimann et al., 2010; Ragsdale and Pierce, 2009).
7.3.5 Iron
Although the ability to store, oxidize, and reduce ferric iron is widespread among all organisms on the planet, only a fraction is known to catalyse the reduction as a means to obtain energy from the environment. The assimilatory ferric:chelate reductase (K18915) was barely detected in both microbiomes, indicating that ferric iron was not available. The iron-storage enzyme, bacterioferritin (K03594) was highly abundant and extremely transcribed in OL-KR6/125−130 m, but only abundant and modestly transcribed in OL-KR13/405.5−414.5 m. Thus, the abundance and relative transcriptional activity of bacterioferritin followed the concentration of dissolved iron(II). Extracellular electron transfer to insoluble Fe(III) oxide minerals has been conserved in the hyperthermophilic Archaea and is widely distributed among the Bacteria (Weber et al., 2006). The direct dissimilar reduction of iron(III) solids by Geobacter metallireducens requires omcB, omcE and omcS (Weber et al. 2006). Shewanella oneidensis uses the Mtr pathway, in which mtrC, mtrF, or omcA is reduired for the direct dissimilar reduction of extracellular compounds including iron(III) solids, (Coursolle and Gralnick, 2012). Homologues to macA, omcE, omcS, ompC, and ppcA from Geobacter sp. barely detected in both samples. Lovley et al. (1993) showed that Desulfovibrio vulgaris reduced ferric iron solids with H2 as the electron donor in a medium without sulphate. A cytochrome c3 hydrogenase was needed. Soluble iron(II), the product of iron(III) reduction was detected in small amounts in OL-KR6/125−130 m. A ferricytochrome c3-reducing [NiFe] hydrogenase (K00437 and K18008) was abundant and moderately transcribed in OL-KR13/405.5−414.5 m, but barely detectable in OL-KR6/125−130 m (Appendix E). There was effectively no evidence at all for dissimilatory iron oxidation. The few genes that accidentally had a good match to gene sequences of known iron-oxidising organisms (Hedrich et al., 2011) were scarce and far apart in the scaffolds. The genes for the ABC transporters (map 02010, Appendix I) of zinc, molybdate, tungstate, iron complex, cobalt, and nickel were significantly more abundant in OL-KR13/405.5−414.5 m than in OL-KR6/125−130 m. However, the genes for the ABC transporter of iron(III) were much more abundant in OL-KR6/125−130 m than in OL-KR13/405.5−414.5 m. Furthermore, OL-KR6/125−130 m contained a small amount of an ABC transporter for iron(II)/manganese which was not found in OL-

65
KR13/405.5−414.5 m. The manganese transport system M00316 and the Iron/zinc/copper transport system M00318 were found functional only in OL-KR6/125−130 m (Appendix D).
7.3.6 Other pathways
Observations related to metabolic routes other than the pathways described above are listed below. The referenced metabolic pathway maps and modules can be found in Appendices D−Y. The metagenome and metatranscriptome of OL-KR6/125−130 m focused more than OL-KR13/405.5−414.5 m on pathways associated with growth and carbon storage such as shuttling ammonia into pyrimidine metabolism (map 00240, Appendix P), directing more flux into amino acids, enhanced peptidoglycan biosynthesis (map 00550, Appendix Q) and glycogen storage (map 00500, Appendix R). Both samples contained ABC transporters for lipopolysaccharides and lipoproteins, the transporters for capsular polysaccharides and lipo-oligosaccharides were more abundant in OL-KR6/125−130 m than in OL-KR13/405.5−414.5 m. The organisms in the OL-KR13/405.5−414.5 m community degraded glycogen more often via glucose and maltose than through trehalose (map 00500, Appendix R), and put more emphasis on the biosynthesis of lipopolysaccharides than the organisms in OL-KR6/125−130 m (map 00540, Appendix S). Glutathione biosynthesis was more abundant in OL-KR6/125−130 m than in OL-KR13/405.5−414.5 m (map 00480, Appendix T). As a relatively small organic thiol, glutathione may have filled several functions within intracellular sulphur chemistry. Glutathione may have replaced methanofuran in the formate-CO2 cycling reactions catalysed by formylmethanofuran dehydrogenase in OL-KR6/125−130 m. Glutathione may have partially replaced Coenzyme-B in the methanogenesis pathway in the OL-KR6/125−130 m microbiome. Glutathione may have acted as a carrier of or storage anchor for zero-valent sulphur (S0). The OL-KR13/405.5−414.5 m microbiome, on the other hand, seemed to convert any glutathione to glutathione disulphide (map 00480, Appendix T), a reaction that would inactivate glutathione until it was needed again. The degradation of cysteine sulphinate to sulphite (SO3
2-) or further to thiosulphate (S2O3
2-) was more abundant and more transcribed in OL-KR13/405.5−414.5 m than in OL-KR6/125−130 m (map 00270, Appendix M). Neither sample contained genes for the direct synthesis of cysteine sulphinate. The biosynthetic paths of L-cysteine, thiocysteine, and L-methionine were more abundant in OL-KR13/405.5−414.5 m than in OL-KR6/125−130 m (map 00270, Appendix M). It is also interesting to discover that the OL-KR6/125−130 m metagenome did not contain any enzyme for generating S-hydroxy-methyl-glutathione, but the subsequent oxidation to formate was abundant and highly transcribed. Thus, these may have been two mechanisms to repair damage done by reactive sulphur species (RSS). The genes associated with bacterial flagellar assembly (map 02040, Appendix U) and chemotaxis (map 02030, Appendix V) were highly abundant in both OL-KR6/125−130 m and OL-KR13/405.5−414.5 m. Genes relating to flagellar biosynthesis, flagellar assembly, and hormone-like molecules/quorum sensing (flagella regulon) were more
66
highly transcribed in OL-KR6/125−130 m than in OL-KR13/405.5−414.5 m (map 02040, Appendix U; map 02030, Appendix V). The archaeal flagellar proteins FlaI (K07332) and FlaJ (K07333) were abundant in OL-KR6/125−130 m and very abundant in OL-KR13/405.5−414.5 m. FlaI and FlaJ were sparingly transcribed in OL-KR13/405.5−414.5 m and very modestly transcribed in OL-KR6/125−130 m. A high occurrence of genes and transcripts associated with both bacterial and archaeal flagellae suggest that most of the organisms in OL-KR13/405.5−414.5 m and some of the organisms in OL-KR6/125−130 m actively depended on flagellae for locomotion and/or sensory purposes. A trinitrotoluene degradation pathway was significant in OL-KR6/125−130 m, but hardly detected in OL-KR13/405.5−414.5 m (map 00633, Appendix X). The degradation of dinitrotoluene was barely found in OL-KR6/125−130 m, and not found at all in OL-KR13/405.5−414.5 m (map 00633, Appendix X). Enzymes catalysing the detoxification of hydrogen peroxide, other reactive oxygen species (ROS), and reactive nitrogen species (RNS), e.g. catalase (EC 1.11.1.6), were about equally abundant in both samples (see Appendix E for more details on ROS/RNS). Genes for enzymes catalysing reactions with selenium-containing metabolites (pathway map 00450, Appendix Y) were generally more abundant and more transcribed in OL-KR13/405.5−414.5 m than in OL-KR6/125−130 m. Since selenium and sulphur have very similar chemistry, they occur together in hydrogeochemical environments. Thus, the activity of selenium-metabolism can be taken as another indication that sulphur-metabolism were more important in OL-KR13/405.5−414.5 m than in OL-KR6/125−130 m. A number of eukaryotic genes were found from the deep microbiome samples (Appendix E-G). The genes for the eukaryotic V-type ATPase were detected only in OL-KR13/405.5−414.5 m. In contrast, the genes for the eukaryotic cytochrome c oxidase and the eukaryotic NADH dehydrogenase were only detected in OL-KR6/125−130 m. The corresponding bacterial (and archaeal) genes were highly abundant in both samples. Eukaryotic genes for RNA polymerase, transcription factors, splicesome, mini-chromosome-maintenance complex (helicase), lysosome, endocytosis, phagosome, integrins, focal adhesion, and cell adhesion molecules were rare in terms of DNA, but transcribed at high levels in OL-KR13/405.5−414.5 m.

67
8 DISCUSSION
Olkiluoto groundwater sulphate (SO42-) is expected to originate from the ancient Littorina
sea (Pitkänen et al., 1999). Hydrogen sulphide (H2S) can, however, be produced by a plethora of net metabolic reactions catalysed by single organisms, syntrophic pairs of organisms, or microbial communities. In geological conditions where energy sources are scarce, the microbial communities are more dependent on syntrophic and community-level interactions since electron donors and acceptors are exchanged between the organisms. Therefore, it is important to understand all active geobiological processes and the role of each organism.
8.1 Overview
Microbiological sulphide-formation catalysed by sulphate-reducing organisms may have gone undetected by hydrogeochemical measurements if a) such organisms were not present, b) the organisms have used other, more preferred, electron acceptors than sulphate (SO4
2-), c) the sulphate-reducing organisms have unsuccessfully competed for electron donors against other organisms, d) the sulphate-reducing organisms have lacked some essential nutrient and/or micronutrient, e) the sulphate-reducing organisms have been inhibited by the product, f) the sulphide has precipitated, or g) the product has been removed by oxidation. The accumulation of hydrogen sulphide (HS-), may have competed with the precipitation of iron sulphides. The amount of hydrogen sulphide in OL-KR6/125−130 m was below the detection limit and therefore, it is unlikely that the organisms were inhibited by the soluble product (HS-). The non-negligible concentration of iron in OL-KR6/125−130 m may have supported the precipitation of iron sulphide on the surfaces of the organisms, thus potentially limiting the diffusion of sulphate near the organisms. Such a barrier might explain why the energy-requiring sulphate uptake transporter (sulT) was abundant and transcribed in OL-KR6/125−130 m, but not in OL-KR13/405.5−414.5 m although there was more sulphate (SO4
2-) in OL-KR6/125−130 m than in OL-KR13/405.5−414.5 m. The concentration of dissolved iron was negligible in OL-KR13/405.5−414.5 m, thus not precipitating iron sulphides onto the surfaces of the organisms, which in turn would allow the accumulation of soluble hydrogen sulphide (HS-). Sulphate-reducing organisms consist of a taxonomically diverse group of microorganisms, including more than 150 species of SRB (Garrity et al. 2004). The microbial organisms able to perform dissimilatory sulphate reduction are mainly anaerobic bacteria, but include also few archaea. The presence of SRB in Olkiluoto has been confirmed both by cultivation techniques (Hallbeck and Pedersen, 2008) and by molecular methods (Bomberg et al., 2015; Itävaara et al. 2008; Miettinen et al., 2015b; Nyyssönen et al., 2012). In this study, sulphate-reducing microorganisms were detected in both metagenomes. The metagenomes and metatranscriptomes of the two groundwater samples OL-KR6/125−130 m and OL-KR13/405.5−414.5 m revealed that the community of organisms had the capability of utilizing sulphate/sulphite/thiosulphate/thiocyanate, nitrate/nitrite/cyanate, nitrogen gas, manganese (Appendix D), iron (Appendixes D and E), carbon dioxide (Appendix D), glutathione/organic disulphides (Appendix E),

68
arsenate/arsenite/chromate/selenite (Appendixes D and E), copper (Appendixes D and E), and sulphinate/nitroalkane (Appendix E) as electron acceptors. Furthermore, the community of microorganisms were capable of detoxifying reactive oxygen species (ROS), reactive nitrogen species (RNS), reactive iron species (RIS), and reactive sulphur species (RSS) (Appendix E). However, many of these proposed extracellular electron acceptors were present at insignificant amounts compared to sulphate and can thus be ruled out as preferred electron acceptors. Their metabolic significance on the other hand might not be insignificant since the oxygen-containing organic electron acceptors (e.g. sulphinate, nitroalkane) could originate from radiolysis (Bryan, S.A., Pederson, 1996; Elias, 2010; Etoh et al., 1987; Kekki and Zilliacus, 2010), thus also explaining the highly active protection against ROS, RNS, RIS, and RSS. Radiolysis would also produce hydrogen gas. Nevertheless, the sample OL-KR13/405.5−414.5 m had higher cell count than sample OL-KR6/125−130 m, thereby indicating more energetic net reactions occuring in OL-KR13/405.5−414.5 m than in OL-KR6/125−130 m.
8.2 Nitrogen
Active nitrogen-fixation was observed in both microbiomes, but was much more abundant in OL-KR13/405.5−414.5 m than in OL-KR6/125−130 m. In this process, molecular nitrogen (N2) dissolved in the groundwater was transformed to ammonia to be utilized for the biosynthesis of amino acids (proteins), nucleotide bases (DNA and RNA), and other cell components. The nitrogen-fixation pathway dominated the metabolic pathways of nitrogen in OL-KR13/405.5−414.5 m. Both microbiome samples contained abundant and transcriptionally active enzymes for the transport of nitrite (NO2
-) and nitrate (NO3-) across the cell wall. However, neither
nitrite (NO2-) nor nitrate (NO3
-) were detected in the groundwater. If nitrate or nitrite were available, they would be rapidly consumed by the abundant and transcriptionally active assimilatory and dissimilatory nitrate-reduction pathways in both microbiome samples. Some of the nitrate-reducing enzymes (napA) and some of the nitrite-reducing enzymes (nirA) belong to the same protein superfamily as sulphite reductase, and therefore the proteins detected may have been sulphite reductases and not nitrate/nitrite reductases. Furthermore, the nrfA enzyme is known to catalyse both nitrite and sulphite reduction. A potential source of nitrite might have been nitrification, a process in which ammonia is oxidised to nitrite (NO2
-). The process was, however, neither detected with qPCR nor with metabolic pathway analysis. The gene targeted by qPCR, amoA (ammonia monooxygenase), was not detected in either sample. Metabolic pathway analysis discovered that although a methane monooxygenase also oxidating ammonia was abundant in OL-KR6/125−130 m, subsequent enzymes in the nitrification pathway were not detected in either sample with the conservative cut off value used. If net oxidation of ammonium did occur, the mechanism remained unclear. The highly inconsistent abundancies of enzymes in the denitrification pathway prevented any clear conclusions about this pathway. It might have been complete and transcriptionally active in OL-KR6/125−130 m, but not in OL-KR13/405.5−414.5 m due to two missing enzymes. Denitrification and assimilatory/dissimilatory nitrite reduction

69
would have competed for any nitrite (NO2-) formed by nitrification, thus keeping its
concentration well below the limit of detection.
8.3 Iron
It is well known that ferric iron can be reduced by hydrogen sulphide without enzymatic catalysts (Kwon et al., 2014; Weber et al., 2006). Thus, all sulphide-producing organisms could also be considered indirect iron-reducing organisms. Furthermore, (Flynn et al., 2014) showed that Shewanella oneidensis, a well-known iron-reducing organism, reduced ferric iron solids at alkaline pH indirectly through this abiotic mechanism in a process called ‘cryptic sulphur cycle’ because the sulphide intermediate may or may not be detected (Friedrich and Finster, 2014). Iron(III) solids may be abiotically reduced by sulphide, nitrite, organic acids such as humic acids, pyruvate, or oxalate, and certain aromatic compounds (Burdige, 1993). Therefore, it may be difficult to determine the mechanism responsible for iron reduction, if observed. Organisms known for direct dissimilatory reduction of ferric iron include Geobacter spp., Geothrix sp., Shewanella oneidensis, Acidithiobacillus ferrooxidans, Acidithiobacillus thiooxidans, Desulfuromonas spp., and Desulfovibrio vulgaris (Flynn et al., 2014; Holmes, S., Bonnefoy, 2007; Lovley et al., 1993; Weber et al., 2006). The presumed mechanism for Thiobacilli cannot be distinguished from abiotic reduction and so far, no enzymes have been isolated (Sugio et al., 2007). Ferric iron may have had a role in OL-KR6/125−130 m since the relative abundances and relative transcriptional activities of iron(III)-related genes were higher in OL-KR6/125−130 m than in OL-KR13/405.5−414.5 m. Iron(II) oxidation was not detected in either sample.
8.4 Sulphur
An overview of the hydrogen sulphide-forming and -consuming metabolism observed in OL-KR6/125−130 m and OL-KR13/405.5−414.5 m is shown in Figure 15. The metabolic pathway analysis showed that genes coding for the enzymes in the canonical assimilatory and dissimilatory pathways for sulphate reduction were present and transcriptionally active in both samples (Figure 15). ANME-2 archaea were identified in both samples with relative abundances varying from 6.2% to 32.3% of the archaea. In contrast to the canonical pathways utilizing multi-step processes, Milucka et al., (2012) have proposed that ANME-2 organisms are capable of the direct reduction of sulphate (SO4
2-) to sulphite (SO32-) by coupling this reaction to
formylmethanofuran dehydrogenase (fwd; EC 1.2.99.5). The fwd enzyme was highly abundant and transcribed in both OL-KR6/125−130 m and OL-KR13/405.5−414.5 m. However, more detailed studies of mechanisms would be needed in order to confirm the direct coupling of these metabolic functions. Sulphur-oxidizing bacteria were most active and abundant in OL-KR13/405.5−414.5 m, but were also detected in OL-KR6/125−130 m. These bacteria formed the majority of the microbial community in OL-KR13/405.5−414.5 m. As much as 49% of active bacteria in
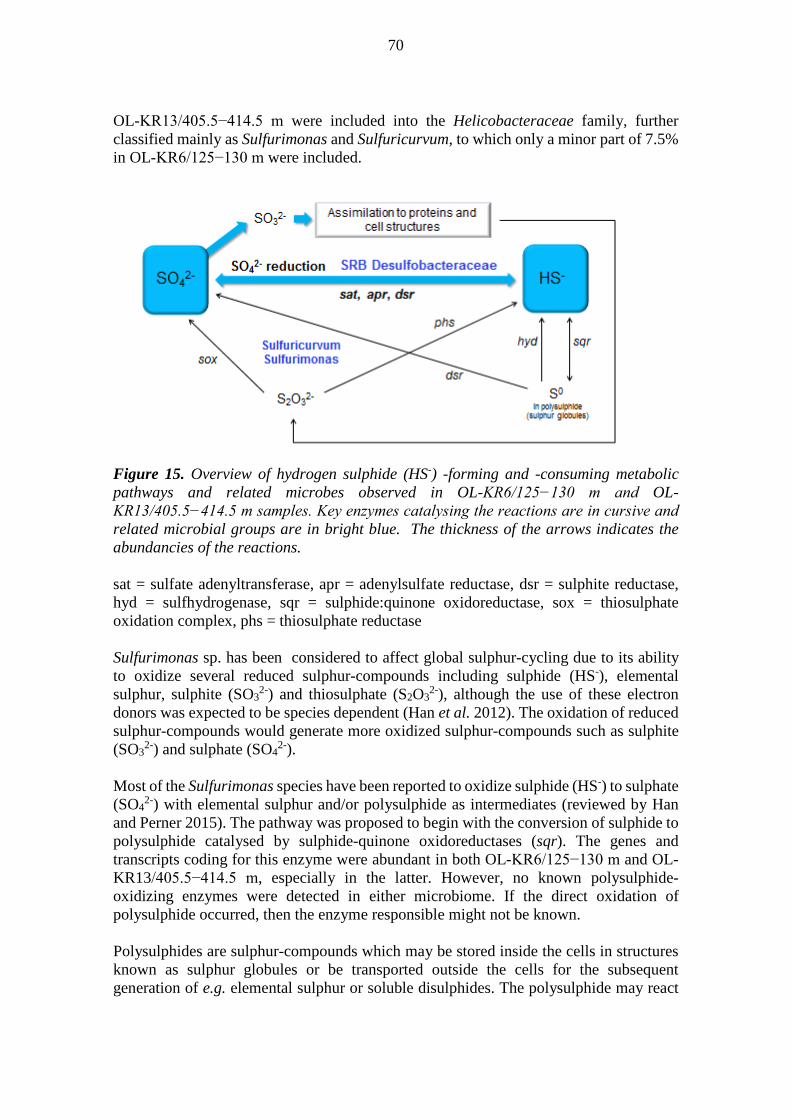
70
OL-KR13/405.5−414.5 m were included into the Helicobacteraceae family, further classified mainly as Sulfurimonas and Sulfuricurvum, to which only a minor part of 7.5% in OL-KR6/125−130 m were included.
Figure 15. Overview of hydrogen sulphide (HS-) -forming and -consuming metabolic pathways and related microbes observed in OL-KR6/125−130 m and OL-KR13/405.5−414.5 m samples. Key enzymes catalysing the reactions are in cursive and related microbial groups are in bright blue. The thickness of the arrows indicates the abundancies of the reactions. sat = sulfate adenyltransferase, apr = adenylsulfate reductase, dsr = sulphite reductase, hyd = sulfhydrogenase, sqr = sulphide:quinone oxidoreductase, sox = thiosulphate oxidation complex, phs = thiosulphate reductase Sulfurimonas sp. has been considered to affect global sulphur-cycling due to its ability to oxidize several reduced sulphur-compounds including sulphide (HS-), elemental sulphur, sulphite (SO3
2-) and thiosulphate (S2O32-), although the use of these electron
donors was expected to be species dependent (Han et al. 2012). The oxidation of reduced sulphur-compounds would generate more oxidized sulphur-compounds such as sulphite (SO3
2-) and sulphate (SO42-).
Most of the Sulfurimonas species have been reported to oxidize sulphide (HS-) to sulphate (SO4
2-) with elemental sulphur and/or polysulphide as intermediates (reviewed by Han and Perner 2015). The pathway was proposed to begin with the conversion of sulphide to polysulphide catalysed by sulphide-quinone oxidoreductases (sqr). The genes and transcripts coding for this enzyme were abundant in both OL-KR6/125−130 m and OL-KR13/405.5−414.5 m, especially in the latter. However, no known polysulphide-oxidizing enzymes were detected in either microbiome. If the direct oxidation of polysulphide occurred, then the enzyme responsible might not be known. Polysulphides are sulphur-compounds which may be stored inside the cells in structures known as sulphur globules or be transported outside the cells for the subsequent generation of e.g. elemental sulphur or soluble disulphides. The polysulphide may react

71
with glutathione to produce hydrogen sulphide (H2S) and glutathione disulphide (Holmes and Bonnefoy, 2007) or with thiosulphate (S2O3
2-) to produce tetrathionate (S4O62-) and
hydrogen sulphide (H2S) in spontaneous non-enzyme-catalysed reactions (Kletzin et al., 2004). The biosynthesis of glutathione was transcriptionally more active in OL-KR6/125−130 m than in OL-KR13/405.5−414.5 m, but highly abundant in both. The organisms in OL-KR13/405.5−414.5 m appeared to produce much more glutathione disulphide than the organisms in OL-KR6/125−130 m (Appendix T). The organisms in OL-KR6/125−130 m, on the other hand, seemed to use glutathione for dehalogenation much more than the organisms in OL-KR13/405.5−414.5 m (Appendix T). Every disproportionation reaction of sulphur requires a persulphide bond, i.e. a sulphur-sulphur bond. Such bonds can be formed in multiple pathways, all of which require hydrogen sulphide (H2S) (Finster, 2008; Handley et al., 2014; Hedderich et al., 1998; Holmes, S., Bonnefoy, 2007; Milucka et al., 2012; Rabus et al., 2015b). These pathways include the oxidation of sulphide (HS-) to polysulphide by sqr and the reaction of glutathione disulphide with hydrogen sulphide. Polysulphide can then be disproportioned via sulphide (HS-) to sulphate (SO4
2-) and sulphide (HS-) such that slightly less than 3 atoms of zero-valent sulphur (in polysulphide) are reduced to sulphide (HS-) for every zero-valent sulphur atom being oxidized to sulphate (SO4
2-). If ANME-2 archae were to produce soluble disulphide (HS2
-) as proposed by Milucka et al., 2012, then the disulphide could be consumed by sulphate-reducing bacteria disproportioning it to sulphate (SO4
2-) and hydrogen sulphide (H2S), thus implementing an alternative mode of syntrophy between AMNE-2 archae and sulphate-reducing bacteria. Thiocyanate (NCS-) can be spontaneously produced with or without enzyme catalysis by the combination of a reduced sulphur-compounds such as thiosulphate (S2O3
2-) and cyanide (Hedderich et al., 1998; Sorokin and Kuenen, 2005). The reaction may be catalysed by thiosulphate-sulphur-transferase (rhodanese) found in both OL-KR6/125−130 m and OL-KR13/405.5−414.5 m. Despite the high abundances and transcription levels of this enzyme in both habitats, none of the known paths of hydrogen cyanide formation (KEGG, 2016) were found in either habitat. However, rhodanese has previously been attributed with another reaction in which thiosulphate (S2O3
2-) is broken up to elemental sulphur and sulphite (SO3
2-) (Holmes and Bonnefoy, 2007). The degradation of polyamines would result in the net conversion of sulphide (HS-) to zero-valent sulphur in the form of thiosulphate (S2O3
2-), from which it could be converted further via rhodanese to disulphide (HS2
-) or polysulphide. Sulphite (SO3
2-) may be oxidized to sulphate (SO42-) by reversing part of the DSR
pathway, thereby producing ATP by substrate-level phosphorylation (Finster, 2008; Mendez-Garcia et al., 2015; Milucka et al., 2012). This process would require an extracellular electron acceptor such as nitrate (NO3
-), nitrite (NO2-), nitric oxide (NO), or
nitrous oxide (N2O). The oxidation of thiosulphate (S2O3
2-) to sulphate (SO42-) via the Sox pathway was
expected to be common among sulphur-oxidizing bacteria (Han and Perner, 2015). The genes coding for the Sox enzymes were found in both OL-KR6/125−130 m and OL-

72
KR13/405.5−414.5 m, but they were very rare. Only one gene was highly transcribed and only in OL-KR6/125−130 m.
8.5 Methane and carbon dioxide fixation
The reduction of sulphate (SO42-), sulphite (SO3
2-), thiosulphate (S2O32-), zero-valent
sulphur, iron(III), nitrate (NO3-), nitrite (NO2
-), and dinitrogen (N2) requires electrons. Hydrogen gas (H2), ammonium ions (NH4
+), and organic carbon sources (e.g. methane, formate, acetate, and dead biomass components) may directly or indirectly provide these electrons. Geological subsurface conditions are scarce in organic carbon content compared to many other habitats in the biosphere. The most probable carbon sources for microbes were both biotically and abiotically or thermogenically formed methane and hydrocarbons and dead microbial biomass (Itävaara et al., 2016). Methane was the most abundant of these carbon sources in Olkiluoto bedrock (Pitkanen and Partamies, 2007). The purgeable fraction of dissolved gases contained 1,810 ppm methane in OL-KR6/125−130 m and 214,000 ppm methane in OL-KR13/405.5−414.5 m. The purgeable fraction of dissolved gases contained 21,100 ppm carbon dioxide in OL-KR6/125−130 m and 562 ppm carbon dioxide in OL-KR13/405.5−414.5 m. The small quantity of carbon dioxide in OL-KR13/405.5−414.5 m may have been restricting processes dependent on carbon dioxide. Methanotrophs are methane-cycling microbes able to consume methane to gain energy and carbon. They have been found in oxygen-containing and anaerobic environments. Methanotrophs included into Methylococcaceae family were found in high abundancy from the OL-KR6/125−130 m metatrancriptome (37.5%) and with lower abundancy from the metagenome (10.4%). These methanotrophic species grow at oxic/anoxic interphases. Methanococcaceae family members were not found in the OL-KR13/405.5−414.5 m microbiome, probably due to the more reduced conditions in OL-KR13/405.5−414.5 m than in OL-KR6/125−130 m. In OL-KR6/125−130 m, oxygen-dependent methane oxidation was ongoing as indicated by the high amount of methanotrophs and an active metabolic pathway from methane to methanol and further to formaldehyde and formate. The genes and transcripts coding for a key enzyme in this pathway, methane monooxygenase (gene pmoA), were also much more abundant in OL-KR6/125−130 m than in OL-KR13/405.5−414.5 m where they were detected only by PCR. Anaerobic methanotrophs are mostly archaea and they were discovered in 1976 and were coupled to sulphate-reduction in marine sediments (Haroon et al., 2013). In 2006 nitrite-dependent anaerobic methane-oxidation was reported; this process was coupled to denitrification (Pedersen, 2012; Raghoebarsing et al., 2006). It was shown that, in addition to nitrite (NO2
-), nitrate (NO3-) can also act as an electron acceptor for the
anaerobic oxidation of methane (Haroon et al., 2013). Later Beal et al. (2009) suggested the reduction of manganese (Mn4+) and iron (Fe3+) in marine sediments could as well act as electron acceptors (Beal et al., 2009). Anaerobic methane-oxidation has been under intensive investigations during the last years. ANME archaea have been found earlier in Olkiluoto (Miettinen et al., 2015a; Nyyssönen et al., 2012). In the present study, ANME-2d type of archaea (Methanoperedenaceae) were found in both samples. These were the most abundant Archea in OL-KR13/405.5−414.5 m. Reverse methanogenesis has been
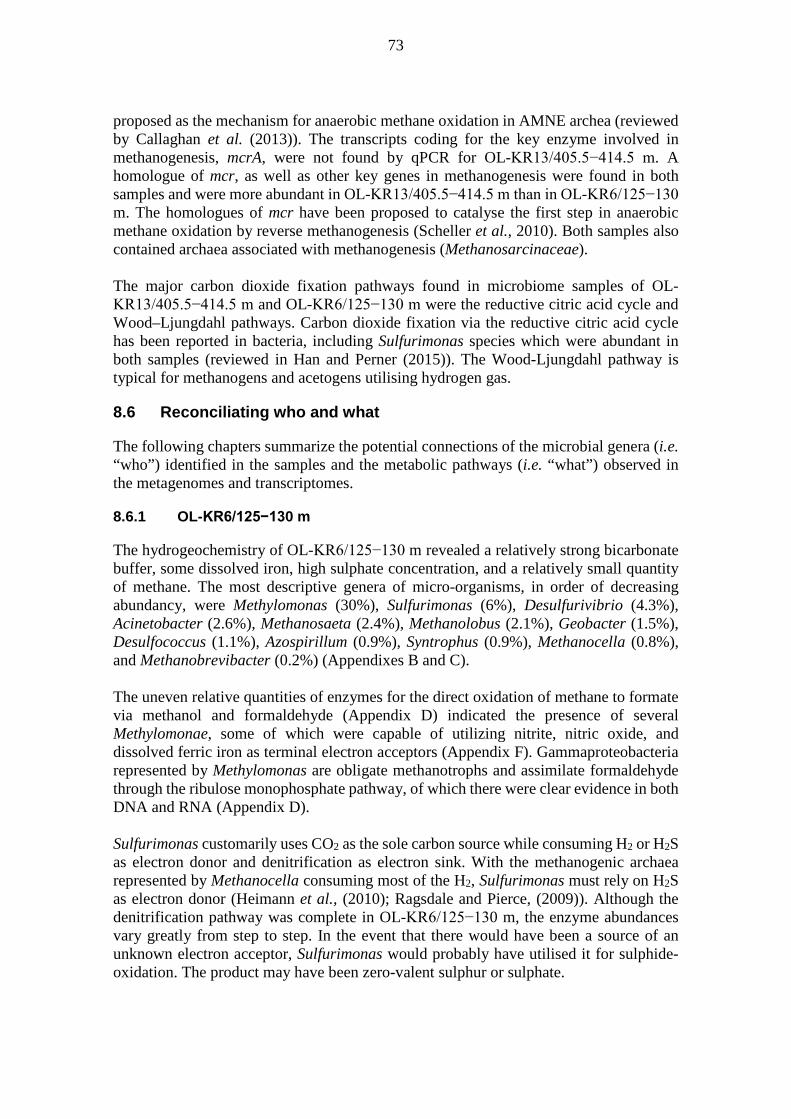
73
proposed as the mechanism for anaerobic methane oxidation in AMNE archea (reviewed by Callaghan et al. (2013)). The transcripts coding for the key enzyme involved in methanogenesis, mcrA, were not found by qPCR for OL-KR13/405.5−414.5 m. A homologue of mcr, as well as other key genes in methanogenesis were found in both samples and were more abundant in OL-KR13/405.5−414.5 m than in OL-KR6/125−130 m. The homologues of mcr have been proposed to catalyse the first step in anaerobic methane oxidation by reverse methanogenesis (Scheller et al., 2010). Both samples also contained archaea associated with methanogenesis (Methanosarcinaceae). The major carbon dioxide fixation pathways found in microbiome samples of OL-KR13/405.5−414.5 m and OL-KR6/125−130 m were the reductive citric acid cycle and Wood–Ljungdahl pathways. Carbon dioxide fixation via the reductive citric acid cycle has been reported in bacteria, including Sulfurimonas species which were abundant in both samples (reviewed in Han and Perner (2015)). The Wood-Ljungdahl pathway is typical for methanogens and acetogens utilising hydrogen gas.
8.6 Reconciliating who and what
The following chapters summarize the potential connections of the microbial genera (i.e. “who”) identified in the samples and the metabolic pathways (i.e. “what”) observed in the metagenomes and transcriptomes.
8.6.1 OL-KR6/125−130 m
The hydrogeochemistry of OL-KR6/125−130 m revealed a relatively strong bicarbonate buffer, some dissolved iron, high sulphate concentration, and a relatively small quantity of methane. The most descriptive genera of micro-organisms, in order of decreasing abundancy, were Methylomonas (30%), Sulfurimonas (6%), Desulfurivibrio (4.3%), Acinetobacter (2.6%), Methanosaeta (2.4%), Methanolobus (2.1%), Geobacter (1.5%), Desulfococcus (1.1%), Azospirillum (0.9%), Syntrophus (0.9%), Methanocella (0.8%), and Methanobrevibacter (0.2%) (Appendixes B and C). The uneven relative quantities of enzymes for the direct oxidation of methane to formate via methanol and formaldehyde (Appendix D) indicated the presence of several Methylomonae, some of which were capable of utilizing nitrite, nitric oxide, and dissolved ferric iron as terminal electron acceptors (Appendix F). Gammaproteobacteria represented by Methylomonas are obligate methanotrophs and assimilate formaldehyde through the ribulose monophosphate pathway, of which there were clear evidence in both DNA and RNA (Appendix D). Sulfurimonas customarily uses CO2 as the sole carbon source while consuming H2 or H2S as electron donor and denitrification as electron sink. With the methanogenic archaea represented by Methanocella consuming most of the H2, Sulfurimonas must rely on H2S as electron donor (Heimann et al., (2010); Ragsdale and Pierce, (2009)). Although the denitrification pathway was complete in OL-KR6/125−130 m, the enzyme abundances vary greatly from step to step. In the event that there would have been a source of an unknown electron acceptor, Sulfurimonas would probably have utilised it for sulphide-oxidation. The product may have been zero-valent sulphur or sulphate.
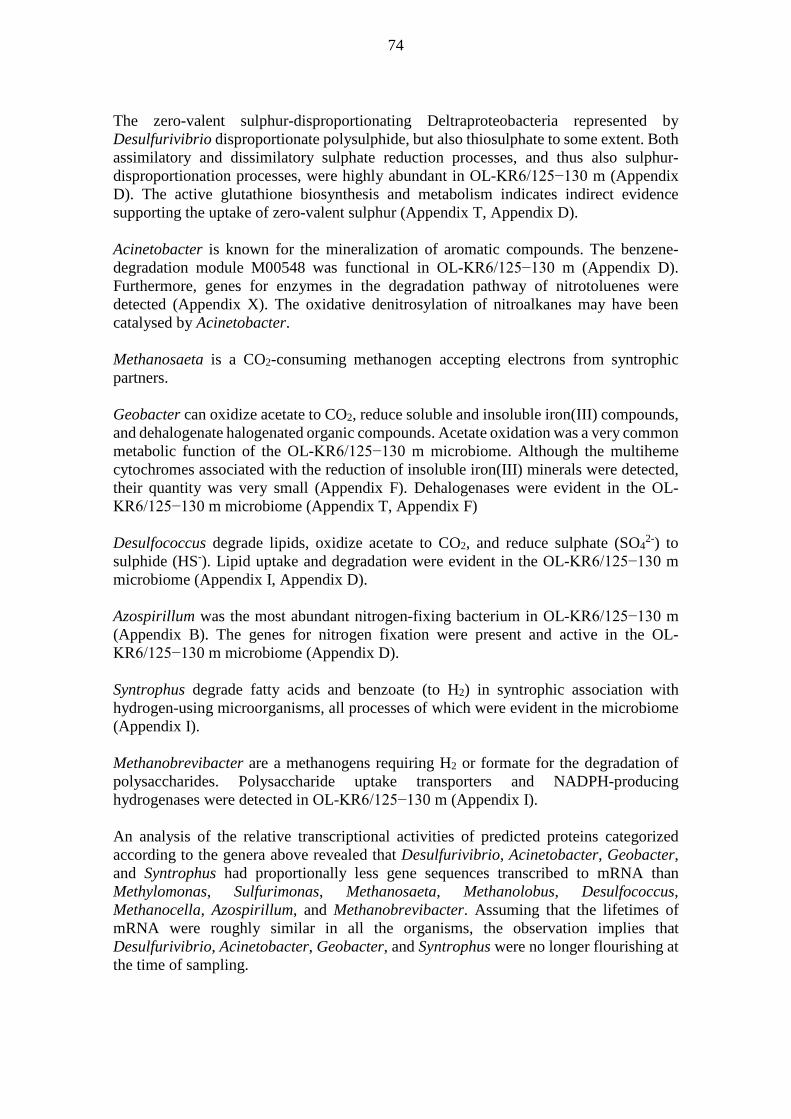
74
The zero-valent sulphur-disproportionating Deltraproteobacteria represented by Desulfurivibrio disproportionate polysulphide, but also thiosulphate to some extent. Both assimilatory and dissimilatory sulphate reduction processes, and thus also sulphur-disproportionation processes, were highly abundant in OL-KR6/125−130 m (Appendix D). The active glutathione biosynthesis and metabolism indicates indirect evidence supporting the uptake of zero-valent sulphur (Appendix T, Appendix D). Acinetobacter is known for the mineralization of aromatic compounds. The benzene-degradation module M00548 was functional in OL-KR6/125−130 m (Appendix D). Furthermore, genes for enzymes in the degradation pathway of nitrotoluenes were detected (Appendix X). The oxidative denitrosylation of nitroalkanes may have been catalysed by Acinetobacter. Methanosaeta is a CO2-consuming methanogen accepting electrons from syntrophic partners. Geobacter can oxidize acetate to CO2, reduce soluble and insoluble iron(III) compounds, and dehalogenate halogenated organic compounds. Acetate oxidation was a very common metabolic function of the OL-KR6/125−130 m microbiome. Although the multiheme cytochromes associated with the reduction of insoluble iron(III) minerals were detected, their quantity was very small (Appendix F). Dehalogenases were evident in the OL-KR6/125−130 m microbiome (Appendix T, Appendix F) Desulfococcus degrade lipids, oxidize acetate to CO2, and reduce sulphate (SO4
2-) to sulphide (HS-). Lipid uptake and degradation were evident in the OL-KR6/125−130 m microbiome (Appendix I, Appendix D). Azospirillum was the most abundant nitrogen-fixing bacterium in OL-KR6/125−130 m (Appendix B). The genes for nitrogen fixation were present and active in the OL-KR6/125−130 m microbiome (Appendix D). Syntrophus degrade fatty acids and benzoate (to H2) in syntrophic association with hydrogen-using microorganisms, all processes of which were evident in the microbiome (Appendix I). Methanobrevibacter are a methanogens requiring H2 or formate for the degradation of polysaccharides. Polysaccharide uptake transporters and NADPH-producing hydrogenases were detected in OL-KR6/125−130 m (Appendix I). An analysis of the relative transcriptional activities of predicted proteins categorized according to the genera above revealed that Desulfurivibrio, Acinetobacter, Geobacter, and Syntrophus had proportionally less gene sequences transcribed to mRNA than Methylomonas, Sulfurimonas, Methanosaeta, Methanolobus, Desulfococcus, Methanocella, Azospirillum, and Methanobrevibacter. Assuming that the lifetimes of mRNA were roughly similar in all the organisms, the observation implies that Desulfurivibrio, Acinetobacter, Geobacter, and Syntrophus were no longer flourishing at the time of sampling.
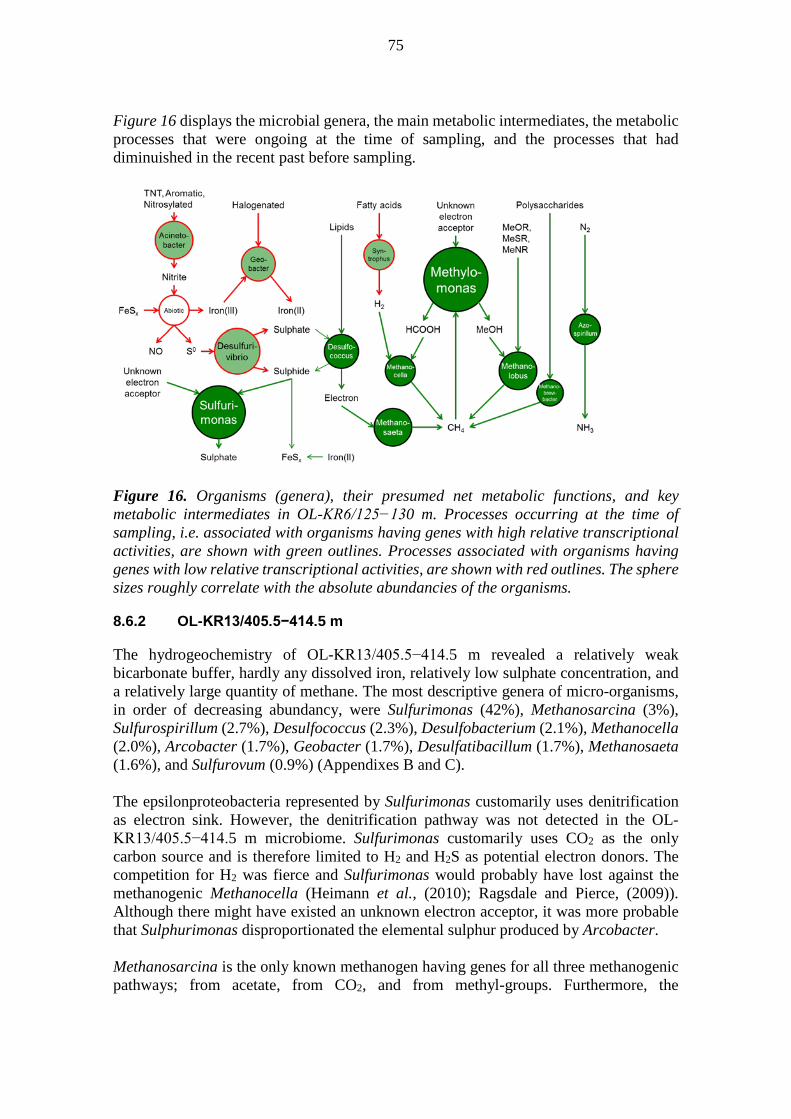
75
Figure 16 displays the microbial genera, the main metabolic intermediates, the metabolic processes that were ongoing at the time of sampling, and the processes that had diminuished in the recent past before sampling.
Figure 16. Organisms (genera), their presumed net metabolic functions, and key metabolic intermediates in OL-KR6/125−130 m. Processes occurring at the time of sampling, i.e. associated with organisms having genes with high relative transcriptional activities, are shown with green outlines. Processes associated with organisms having genes with low relative transcriptional activities, are shown with red outlines. The sphere sizes roughly correlate with the absolute abundancies of the organisms.
8.6.2 OL-KR13/405.5−414.5 m
The hydrogeochemistry of OL-KR13/405.5−414.5 m revealed a relatively weak bicarbonate buffer, hardly any dissolved iron, relatively low sulphate concentration, and a relatively large quantity of methane. The most descriptive genera of micro-organisms, in order of decreasing abundancy, were Sulfurimonas (42%), Methanosarcina (3%), Sulfurospirillum (2.7%), Desulfococcus (2.3%), Desulfobacterium (2.1%), Methanocella (2.0%), Arcobacter (1.7%), Geobacter (1.7%), Desulfatibacillum (1.7%), Methanosaeta (1.6%), and Sulfurovum (0.9%) (Appendixes B and C). The epsilonproteobacteria represented by Sulfurimonas customarily uses denitrification as electron sink. However, the denitrification pathway was not detected in the OL-KR13/405.5−414.5 m microbiome. Sulfurimonas customarily uses CO2 as the only carbon source and is therefore limited to H2 and H2S as potential electron donors. The competition for H2 was fierce and Sulfurimonas would probably have lost against the methanogenic Methanocella (Heimann et al., (2010); Ragsdale and Pierce, (2009)). Although there might have existed an unknown electron acceptor, it was more probable that Sulphurimonas disproportionated the elemental sulphur produced by Arcobacter. Methanosarcina is the only known methanogen having genes for all three methanogenic pathways; from acetate, from CO2, and from methyl-groups. Furthermore, the
76
biosynthesis of sarcinopterin was detected in OL-KR13/405.5−414.5 m (Appendix N). Methanosarcina is also known for reverse methanogenesis, i.e. the oxidation of methane with the concurrent reduction of sulphate (SO4
2-) to sulphide (HS-). Sulfurospirillum reduces arsenate, oxidizes H2, formate, and acetate, consumes halogenated compounds, and reduces elemental sulphur/polysulphide to sulphide (HS-). Arsenate reduction, the direct reduction of polysulphide to H2S with H2, and formate oxidation were evident in the OL-KR13/405.5−414.5 m microbiome (Appendix E, Appendix G). Desulfococcus degrades lipids, oxidizes acetate to CO2, and reduces sulphate (SO4
2-) to sulphide (HS-). Lipid uptake and degradation were evident in the OL-KR13/405.5−414.5 m microbiome (Appendix I, Appendix D). Desulfobacterium represents SRB without more detailed characteristics in literature. Nevertheless, both assimilatory and dissimilatory sulphate-reduction processes were highly abundant in OL-KR13/405.5−414.5 m (Appendix D). Methanocella is a methanogenic archae able to consume H2 and formate. Methanogenesis, formate oxidation, and hydrogenases were evident in the OL-KR13/405.5−414.5 m microbiome. Arcobacter is known for nitrogen fixation, for producing filamentous sulphur mats from both sulphide (HS-) and sulphate (SO4
2-), and for syntrophic accociation with (methanogenic)/methanotrophic archae. Nitrogen fixation was highly active in OL-KR13/405.5−414.5. Geobacter can oxidize acetate to CO2, reduce soluble and insoluble iron(III) compounds, and dehalogenate halogenated organic compounds. Acetate oxidation was a very common metabolic function of the OL-KR13/405.5−414.5 m microbiome. Although the multiheme cytochromes associated with the reduction of insoluble iron(III) minerals were detected, their quantity was very small (Appendix G). Dehalogenases were barely evident in the OL-KR13/405.5−414.5 m microbiome (Appendix T, Appendix G) Desulfatibacillum is an alkane-consuming SRB also producing formate for syntrophic methanogens. Formatogenesis was highly active in OL-KR13/405.5−414.5 m (Appendix G). Direct evidence for alkane-consumption was not found. Methanosaeta is a (methanogen)/methanotroph able to shuttle electrons to syntrophic partners. Sulfurovum couples the oxidation of sulphur compounds with the reduction of nitrate or molecular oxygen. In this case the electron donor (oxidant) remained unknown although the sox complex was expressed. An analysis of the relative transcriptional activities of predicted proteins categorized according to the genera above revealed that Desulfococcus, Desulfobacterium, Desulfatibacillum, Geobacter, and Sulfurovum had proportionally less gene sequences

77
transcribed to mRNA than Sulfurimonas, Methanosarcina, Sulfurospirillum, Methanocella, Methanosaeta, and Arcobacter. Assuming that the lifetimes of mRNA were roughly similar in all the organisms, the observation implies that Desulfococcus, Desulfobacterium, Desulfatibacillum, Geobacter, and Sulfurovum were no longer flourishing at the time of sampling. Figure 17 displays the microbial genera, the main metabolic intermediates, the metabolic processes that were ongoing at the time of sampling, and the processes that had diminuished in the recent past before sampling.
Figure 17. Organisms (genera), their presumed net metabolic functions, and key metabolic intermediates in OL-KR13/405.5−414.5 m. Processes occurring at the time of sampling, i.e. associated with organisms having genes with high relative transcriptional activities, are shown with green outlines. Processes associated with organisms having genes with low relative transcriptional activities, are shown with red outlines. The sphere sizes roughly correlate with the absolute abundancies of the organisms.
8.7 Uncertainties
The metagenomic and metatranscriptomic samples were of high quality, having only 0.1% contamination frequency. Although excellent purity of DNA and RNA samples, about 70% of all predicted protein sequences (each sequence counted as many times as it occurred in the metagenome) were found to have significant hits in sequence databases. The distribution of both DNA coverages and RNA coverages followed the negative binomial distribution, i.e. the top 10% of the sequences accounted for 90% of the total sum of DNA coverages (Table 10). Approximately 87% of the predicted proteins (each unique sequence counted once) could be assigned to a domain, of which between 40% and 55% were bacterial or archaeal genera having abundancies less than 2% of bacterial proteins. About 50% of the unique sequences of predicted proteins having hits in the KEGG database were also annotated with a KO number. Thus, roughly 40% of the predicted proteins were assigned to a known metabolic function with the conservative cutoff value used. The metabolic analysis focused on the fraction of sequences predicted to encode proteins for which a metabolic function could be assigned, i.e. 35%-40% of all
78
predicted sequences (each sequence counted as many times as sequenced).Figure 16 and Figure 17 have been composed by merging and reconciliating metabolic processes detected by metabolic analyses with metabolic processes associated via literature with microbial genera predicted to be present based on protein abundancies. The association by genera may or may not hold true. Single-genome analyses may reveal which metabolic functions occurred together in an organism. In of having an average sequence depth between 50x and 1000x as suggested by Figure 6, the true average sequencing depths were approximately 21x for OL-KR6/125−130 m and approximately 34x for OL-KR13/405.5−414.5 m. The published guideline in chapter 4 , which states that coverages can be as low as 3x for rare species and 10x for more abundant species of a community in environmental samples might be sufficient, did not consider the possibility of the community composing of several hundreds of unique genomes. Clearly, the organisms in these deep subsurface habitats were far from monoclonal. In terms of evolution, this means that the rate of gene mutations (within a single species) has been high in comparison to the growth rate and therefore also in comparison to the selection pressure. With such low sequencing depths in relation to the huge numbers of distinct genomes, the assignment of specific metabolic functions to specific organisms is a gamble at best. The relatively large fragmentation of the pan-genomes in both OL-KR6/125−130 m and OL-KR13/405.5−414.5 m indicate that the DNA may have contained an unusually large number of non-standard nucleotides. The two samples studied provided metagenomic and metatranscriptomic snapshots of the two habitats, both of which were undergoing changes with time (as evidenced by relative transcriptional activities both significantly higher and significantly lower than average). The OL-KR6/125−130 m habitat appeared closer in time to an oxidation event, during which some of the organisms came into contact with trinitrotoluene. The habitat was undergoing methanogenesis from recently accumulated dead biomass at the time of sampling. The OL-KR13/405.5−414.5 m habitat appeared further along the sequence of degradation phases; having depleted many organic constituents of dead biomass and almost all electron acceptors other than sulphate. The habitat was undergoing sulphate-reduction to sulphide coupled one way or another to the anaerobic oxidation of methane. List of open questions
• What was the source of dissolved iron? Although the long-term answer would probably be the ferric iron in the minerals, some of the dissolved iron could originate from pyrite oxidation via an abiotic mechanism in response to nitrogen oxides. The nitrogen oxides might presumably originate from nitrotoluenes and other nitrosylated organic compounds.
• How active is radiolysis? Radiolysis might explain the source of oxidizing equivalents including nitrogen oxides and ferric iron. The current samples were insufficient for studying the unperturbed state of drillhole microbiomes and thus conclusions about the potential long-term activity of radiolytic water splitting remains unresolved.
• If methane, ammonia, and sulphur species were oxidized, where did the oxidizing equivalents originate? Is it a sign of contamination or due to radiolysis of water? If an oxidation event had taken place in the history of both drillholes, would it explain the observed series of events? Is the human drilling-activity responsible
79
for all observed events, including the events observed in both drillhole communities studied?
• Which organism does what? The deep subsurface microbiomes studied in this work contain in addition to known also until now unknown microorganisms which may have novel metabolic pathways and functons. This is providing an uncertainty to the results.
• What reactions do the abundant nitrate reductases and nitrite reductases really catalyse? Some of the pathways in nitrogen metabolism were incomplete and several of the more abundant and/or relatively more transcriptionally active enzymes in otherwise complete pathways were structurally similar to enzymes in sulphur metabolism (sulphite reductase) and/or methane metabolism (e.g. formate reductase).

80
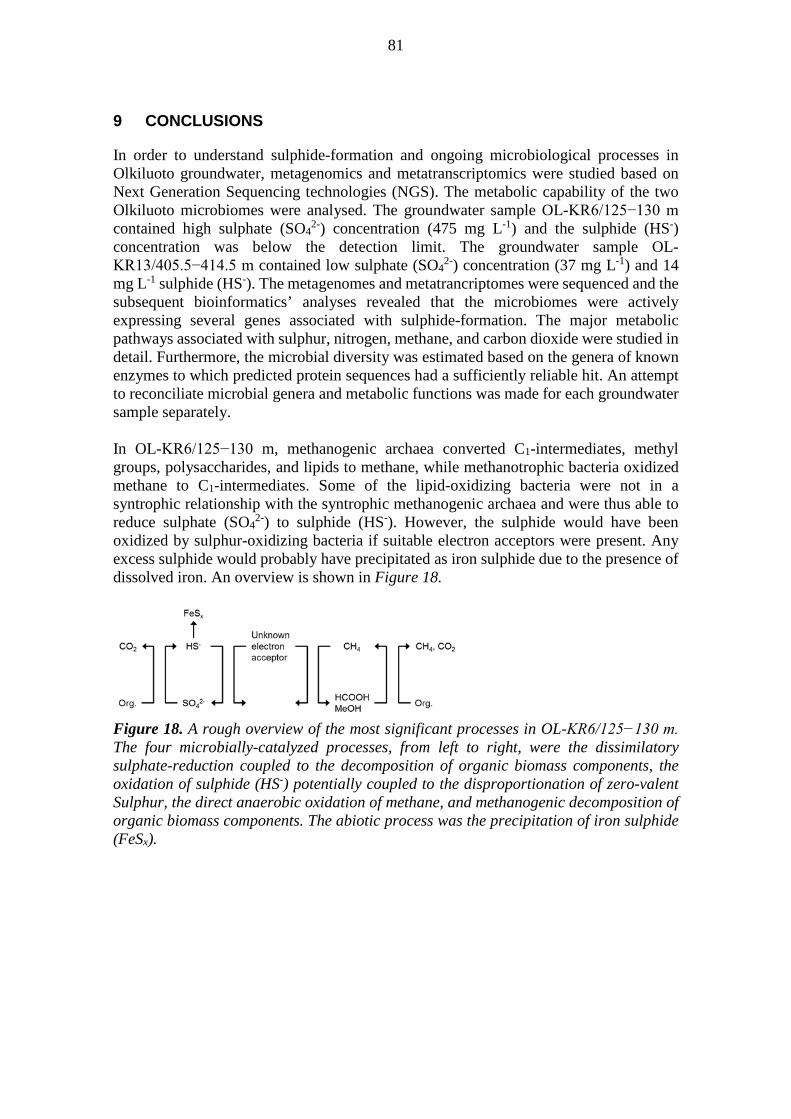
81
9 CONCLUSIONS
In order to understand sulphide-formation and ongoing microbiological processes in Olkiluoto groundwater, metagenomics and metatranscriptomics were studied based on Next Generation Sequencing technologies (NGS). The metabolic capability of the two Olkiluoto microbiomes were analysed. The groundwater sample OL-KR6/125−130 m contained high sulphate (SO4
2-) concentration (475 mg L-1) and the sulphide (HS-) concentration was below the detection limit. The groundwater sample OL-KR13/405.5−414.5 m contained low sulphate (SO4
2-) concentration (37 mg L-1) and 14 mg L-1 sulphide (HS-). The metagenomes and metatrancriptomes were sequenced and the subsequent bioinformatics’ analyses revealed that the microbiomes were actively expressing several genes associated with sulphide-formation. The major metabolic pathways associated with sulphur, nitrogen, methane, and carbon dioxide were studied in detail. Furthermore, the microbial diversity was estimated based on the genera of known enzymes to which predicted protein sequences had a sufficiently reliable hit. An attempt to reconciliate microbial genera and metabolic functions was made for each groundwater sample separately. In OL-KR6/125−130 m, methanogenic archaea converted C1-intermediates, methyl groups, polysaccharides, and lipids to methane, while methanotrophic bacteria oxidized methane to C1-intermediates. Some of the lipid-oxidizing bacteria were not in a syntrophic relationship with the syntrophic methanogenic archaea and were thus able to reduce sulphate (SO4
2-) to sulphide (HS-). However, the sulphide would have been oxidized by sulphur-oxidizing bacteria if suitable electron acceptors were present. Any excess sulphide would probably have precipitated as iron sulphide due to the presence of dissolved iron. An overview is shown in Figure 18.
Figure 18. A rough overview of the most significant processes in OL-KR6/125−130 m. The four microbially-catalyzed processes, from left to right, were the dissimilatory sulphate-reduction coupled to the decomposition of organic biomass components, the oxidation of sulphide (HS-) potentially coupled to the disproportionation of zero-valent Sulphur, the direct anaerobic oxidation of methane, and methanogenic decomposition of organic biomass components. The abiotic process was the precipitation of iron sulphide (FeSx).

82
OL-KR6/125−130 m • Dissimilatory sulphate-reduction was ongoing. Several sulphur-reducing
organisms were detected, although less abundant than sulphur-oxidizing organisms.
• Hydrogen sulphide (H2S) may have been precipitated by iron, manganese, and other trace metals as sulphides and therefore there was no accumulation of sulphide (HS-).
• Polysulphide synthesis was ongoing for the storage of zero-valent sulphur. • Genes for the uptake of nitrate (NO3
-) into cells, for the reduction to ammonia, and for the subsequent assimilation to organic compounds were transcribed.
• The primary methane-consuming pathway was the direct oxidation to methanol and further to formaldehyde for assimilation to formate for shuttling to other organisms. Methanotrophs catalyzing this pathway were abundant.
• Methane consumption in methanotrophic microorganisms by reverse methanogenesis was possible, but the genes were much less abundant than the genes for methane oxidation to methanol. A small amount of ANME-2 archaea was present.
• The reductive citric acid cycle was the primary carbon fixation path. • Enzymes catalysing the synthesis and consumption of formate were more
abundant than the enzymes catalysing synthesis and consumption of acetate. • The range of electron acceptors other than sulphur-compounds and carbon-
compounds was large; including iron(III) solids, nitrate (NO3-), nitrite (NO2
-), arsenate, and dinitrogen (dissolved N2).
• Hydrogen gas was consumed mainly as an additional source of reducing equivalents.
• Uptake of amino acids, acetate, lipids, and polysaccharides. In OL-KR13/405.5−414.5 m, the electrons were likely transferred from the syntrophic methanogens to the syntrophic bacteria which catalyzed nitrogen-fixation and sulphate-reduction to elemental sulphur mats. The sulphur mats would have been excellent substrates for organisms catalysing net disproportionation to sulphate and sulphide or net reduction to sulphide. Hydrogen gas and formate may have functioned as electron-shuttling intermediates. The microbiome also contained archaea identified as Methanosarcina capable of sulphate-reduction driven by reverse methanogenesis. An overview is shown in Figure 19.
Figure 19. A rough overview of the most significant processes in OL-KR13/405.5−414.5 m. The five microbially-catalyzed processes, from left to right, were dissimilatory sulphate-reduction coupled to the anaerobic oxidation of methane through reverse methanogenesis by methanosarcinales, dissimilatory sulphate-reduction by syntrophic bacteria associated with syntrophic ANME archae, the disproportionation of zero-valent Sulphur, the reduction of zero-valent sulphur, and nitrogen fixation potentially driven by reverse methanogenesis.

83
OL-KR13/405.5−414.5 m • Hydrogen sulphide (H2S) was formed due to depletion of all other electron
acceptors. The combined amount of sulphur-reducing organisms was larger than the amount of sulphur-oxidizing organisms.
• There was hardly any soluble iron to precipitate the sulphide (HS-). Although there was no evidence for a continued dissolution of iron, the rate of sulphide formation clearly exceeded the rate of iron dissolution since hydrogen sulphide accumulation was detected.
• Polysulphide synthesis ongoing for the intracellular storage of sulphur. • Polysulphide reduction to sulphide was also very active. • The main electron acceptors were sulphate (SO4
2-, i.e. sulphate reduction), bicarbonate (HCO3
-, i.e. carbon fixation), and dinitrogen (dissolved N2, i.e. nitrogen fixation).
• Genes for the uptake of nitrate (NO3-) and nitrite (NO2
-) into cells, for the reduction to ammonia, and for the subsequent assimilation to organic compounds were transcribed.
• The anaerobic methane oxidation by reverse methanogenesis was the main methane-utilizing pathway, these enzymes could also catalyze methanogenesis.
• The reductive citric acid cycle was the primary carbon fixation path. • Enzymes catalysing acetate synthesis and consumption were more abundant than
enzymes catalysing formate synthesis and consumption. • Hydrogen gas was used also for generating energy (ATP) and not just as an
additional source of reducing equivalents. • Uptake of acetate and lipids.

84

85
10 REFERENCES
Aaltonen, I., Lahti, M., Engström, J., Mattila, J., Paananen, M., Paulamäki, S., Gehör, S., Kärki, A., Ahokas, T., Torvela, T., Front, K., 2010. Geological Model of the Olkiluoto Site - version 2.0. Working Report 2010-70. Posiva Oy, Eurajoki, Finland.
Abram, F., 2015. Systems-based approaches to unravel multi-species microbial community functioning. Comput. Struct. Biotechnol. J. 13, 24–32.
Ahonen, L., Kietäväinen, R., Kortelainen, N., Kukkonen, I.T., Pullinen, A., Toppi, T., Bomberg, M., Itävaara, M., Nousiainen, A., Nyyssönen, M., Öster, M., 2011. Hydrogeological characteristics of the Outokumpu Deep Drill Hole. Spec. Pap. Geol. Surv. Finl. 2011, 151–168.
Alneberg, J., Bjarnason, B.S., de Bruijn, I., Schirmer, M., Quick, J., Ijaz, U.Z., Lahti, L., Loman, N.J., Andersson, A.F., Quince, C., 2014. Binning metagenomic contigs by coverage and composition. Nat. Methods 11, 1144–1146.
Altschul, S.F., Gish, W., Miller, W., Myers, E.W., Lipman, D.J., 1990. Basic local alignment search tool. J. Mol. Biol. 215, 403–10.
Barrett, E.L., Clark, M. a, 1987. Tetrathionate reduction and production of hydrogen sulfide from thiosulfate. Microbiol. Rev. 51, 192–205.
Beal, E.J., House, C.H., Orphan, V.J., 2009. Manganese- and iron-dependent marine methane oxidation. Science 325, 184–7.
Boetius, A., Ravenschlag, K., Schubert, C.J., Rickert, D., Widdel, F., Gieseke, A., Amann, R., Jørgensen, B.B., Witte, U., Pfannkuche, O., 2000. A marine microbial consortium apparently mediating anaerobic oxidation of methane. Nature 407, 623–6.
Boettger, J., Lin, H.T., Cowen, J.P., Hentscher, M., Amend, J.P., 2013. Energy yields from chemolithotrophic metabolisms in igneous basement of the Juan de Fuca ridge flank system. Chem. Geol. 337–338, 11–19.
Bomberg, M., Lamminmäki, T., Itävaara, M., 2015. Estimation of microbial metabolism and co-occurrence patterns in fracture groundwaters of deep crystalline bedrock at Olkiluoto, Finland. Biogeosciences Discuss. 12, 13819–13857.
Bonin, A. S., Boone, D.R., 2006. The order Methanobacteriales. In: M. Dworkin, S. Falkow, E. Rosenberg, K.-H. Schleifer, and E.S. (Ed.), The Prokaryotes. Springer New York, New York, pp. 231–243.
Bryan, S.A., Pederson, L.R., 1996. PNNL-10748: Thermal and compined thermal and radiolytic reactions involving nitrous oxide, hydrogen, nitrogen, and ammonia in contact with tank 241-sy-101 simulated waste webviewable-PNNL--10748 84.
Burdige, D.J., 1993. The biogeochemistry of manganese and iron reduction in marine sediments. Earth-Science Reuiews Elsevier Sci. Publ. B.V 35, 249–284.
Callaghan, A. V, 2013. Enzymes involved in the anaerobic oxidation of n -alkanes : from methane to long-chain paraffins. Front. Microbiol. 4, 1–9.
Cannone, J.J., Subramanian, S., Schnare, M.N., Collett, J.R., D’Souza, L.M., Du, Y., Feng, B., Lin, N., Madabusi, L. V, Müller, K.M., Pande, N., Shang, Z., Yu, N., Gutell, R.R., 2002. The comparative RNA web (CRW) site: an online database of comparative sequence and structure information for ribosomal, intron, and other RNAs. BMC Bioinformatics 3, 2.

86
Cheng, Y.S., Halsey, J.L., Fode, K.A., Remsen, C.C., Collins, M.L.P., 1999. Detection of methanotrophs in groundwater by PCR. Appl. Environ. Microbiol. 65, 648–651.
Chivian, D., Brodie, E.L., Alm, E.J., Culley, D.E., Dehal, P.S., DeSantis, T.Z., Gihring, T.M., Lapidus, A., Lin, L., Lowry, S.R., Moser, D.P., Richardson, P.M., Southam, G., Wanger, G., Pratt, L.M., Andersen, G.L., Hazen, T.C., Brockman, F.J., Arkin, A.P., Onstott, T.C., 2008. Environmental genomics reveals a single-species ecosystem deep within Earth. Science 322, 275–278.
Coursolle, D., Gralnick, J.A., 2012. Reconstruction of extracellular respiratory pathways for iron(III) reduction in Shewanella oneidensis strain MR-1. Front. Microbiol.
de Bruijn, F.J., 2011. Handbook of Molecular Microbial Ecology II: Metagenomics in Different Habitats.
Einsle, O., 2011. Research on Nitrification and Related Processes, Part B Structure and Function of Formate-Dependent Cytochrome c Nitrite Reductase, NrfA. Methods Enzymol. 496, 399–422.
Elias, G., 2010. Reactivity of Radiolytically-Produced Nitrogen Oxide Radicals Toward Aromatic Compounds.
Etoh, Y., Karasawa, H., Ibe, E., Sakagami, M., Yasuda, T., 1987. Radiolysis of N 2 -H 2 O Systems Radiolysis of N 2 -H 2 0 Systems. J. Nucl. Sci. Technol. J. J. Nucl. Sci. Technol. J. Nucl. Sci. Technol. 248, 22–3131.
Ettwig, K.F., Butler, M.K., Le Paslier, D., Pelletier, E., Mangenot, S., Kuypers, M.M.M., Schreiber, F., Dutilh, B.E., Zedelius, J., de Beer, D., Gloerich, J., Wessels, H.J.C.T., van Alen, T., Luesken, F., Wu, M.L., van de Pas-Schoonen, K.T., Op den Camp, H.J.M., Janssen-Megens, E.M., Francoijs, K.-J., Stunnenberg, H., Weissenbach, J., Jetten, M.S.M., Strous, M., 2010. Nitrite-driven anaerobic methane oxidation by oxygenic bacteria. Nature 464, 543–548.
Finster, K., 2008. Microbiological disproportionation of inorganic sulfur compounds. J. Sulfur Chem. 29, 281–292.
Finster, K., Liesack, W., Thamdrup, B., 1998. Elemental sulfur and thiosulfate disproportionation by Desulfocapsa sulfoexigens sp. nov., a new anaerobic bacterium isolated from marine surface sediment. Appl. Environ. Microbiol. 64, 119–125.
Flynn, T.M., O’Loughlin, E.J., Mishra, B., DiChristina, T.J., Kemner, K.M., 2014. Sulfur-mediated electron shuttling during bacterial iron reduction. Science (80-.). 344, 1039–1042.
Fredrickson, J.K., Balkwill, D.L., 2006. Geomicrobial Processes and Biodiversity in the Deep Terrestrial Subsurface. Geomicrobiol. J. 23, 345–356.
Fredrickson, J.K., McKinley, J.P., Bjornstad, B.N., Long, P.E., Ringelberg, D.B., White, D.C., Krumholz, L.R., Suflita, J.M., Colwell, F.S., Lehman, R.M., Phelps, T.J., Onstott, T.C., 1997. Porelsize constraints on the activity and survival of subsurface bacteria in a late cretaceous shale‐sandstone sequence, northwestern New Mexico. Geomicrobiol. J. 14, 183–202.
Friedrich, M.W., Finster, K.W., 2014. Iron-reducing bacteria switch to sulfur reduction as their main energy source in alkaline environments GEOCHEMISTRY.
Garrity, M. G., Bell, J. A., Lilburn, T.G., 2004. Taxonomix outline of the prokaryotes release 5.0. In: Bergey’s Manual® of Systematic Bacteriology. Springer, New York

87
Berlin Heidelberg, p. 399. Gebert, J., Knoblauch, C., Gadd, G., Pfeiffer, E.-M., Dilly, O., 2011. Sustainability of
geochemical cycling. J. Geochemical Explor. 110, vii–viii. Geets, J., Borremans, B., Diels, L., Springael, D., Vangronsveld, J., van der Lelie, D.,
Vanbroekhoven, K., 2006. DsrB gene-based DGGE for community and diversity surveys of sulfate-reducing bacteria. J. Microbiol. Methods 66, 194–205.
Grabherr, M.G., Haas, B.J., Yassour, M., Levin, J.Z., Thompson, D.A., Amit, I., Adiconis, X., Fan, L., Raychowdhury, R., Zeng, Q., Chen, Z., Mauceli, E., Hacohen, N., Gnirke, A., Rhind, N., di Palma, F., Birren, B.W., Nusbaum, C., Lindblad-Toh, K., Friedman, N., Regev, A., 2011. Full-length transcriptome assembly from RNA-Seq data without a reference genome. Nat. Biotechnol. 29, 644–52.
Greene, E. a, Hubert, C., Nemati, M., Jenneman, G.E., Voordouw, G., 2003. Nitrite reductase activity of sulphate-reducing bacteria prevents their inhibition by nitrate-reducing , sulphide- oxidizing bacteria. Environ. Microbiol. 5, 607–617.
Grote, J., Thrash, J.C., Huggett, M.J., 2012. Streamlining and Core Genome Conservation among Highly Divergent Members of the SAR11 Clade 3, 1–13.
Hales, B. a, Edwards, C., Ritchie, D. a, Hall, G., Pickup, R.W., Saunders, J.O.N.R., 1996. Isolation and Identification of Methanogen-Specific DNA from Blanket Bog Peat by PCR Amplification and Sequence Analysis 62, 1–8.
Hallbeck, L., Pedersen, K., 2008. Characterization of microbial processes in deep aquifers of the Fennoscandian Shield. Appl. Geochemistry 23, 1796–1819.
Han, C., Kotsyurbenko, O., Chertkov, O., H., B., Lapidus, A., Nolan, M., Lucas, S., Hammon, N., Deshpande, S., Cheng, J.-F., Tapia, R., Goodwin, L., Pitluck, S., L., K., Pagani, I., Ivanova, N., Mavromatis, K., Mikhailova, N., Pati, A., Chen, A., Palaniappan, K., Land, M., Hauser, L., Chang, Y-J., Jeffries, C.D., Brambilla, E-M., Rohde, M., Spring, S., Sikorski, J., Göker, M., Woyke, T., Bristow, J., Eisen, J., Markowitz, V., Hugenholtz, P., Kyrpides, N., Klenk, H-P., Detter, J., 2012. Complete genome sequence of the sulfur compounds oxidizing chemolithoautotroph Sulfuricurvum kujiense type strain (YK- 1(T)).
Han, Y., Perner, M., 2015. The globally widespread genus Sulfurimonas: Versatile energy metabolisms and adaptations to redox clines. Front. Microbiol. 6, 1–17.
Handley, K.M., Bartels, D., O’Loughlin, E.J., Williams, K.H., Trimble, W.L., Skinner, K., Gilbert, J. a., Desai, N., Glass, E.M., Paczian, T., Wilke, A., Antonopoulos, D., Kemner, K.M., Meyer, F., 2014. The complete genome sequence for putative H2- and S-oxidizer Candidatus Sulfuricurvum sp., assembled de novo from an aquifer-derived metagenome. Environ. Microbiol. 16, 3443–3462.
Haroon, M.F., Hu, S., Shi, Y., Imelfort, M., Keller, J., Hugenholtz, P., Yuan, Z., Tyson, G.W., 2013. Anaerobic oxidation of methane coupled to nitrate reduction in a novel archaeal lineage. Nature 500, 567–70.
Hedderich, R., Klimmek, O., Kröger, A., Dirmeier, R., Keller, M., Stetter, K.O., 1998. Anaerobic respiration with elemental sulfur and with disulfides. FEMS Microbiol. Rev. 22, 353–381.
Hedrich, S., Schlömann, M., Barrie Johnson, D., Schl??mann, M., Barrie Johnson, D., Schlömann, M., Johnson, D.B., 2011. The iron-oxidizing proteobacteria. Microbiology 157, 1551–1564.
88
Heimann, A., Jakobsen, R., Blodau, C., 2010. Energetic constraints on H2-dependent terminal electron accepting processes in anoxic environments: A review of observations and model approaches. Environ. Sci. Technol. 44, 24–33.
Hoehler T. M., 2004. Biological energy requirements as quantitative boundary conditions for life in the subsurface. Geobiology 2, 205–215.
Hoffman, B.M., Lukoyanov, D., Dean, D.R., Seefeldt, L.C., 2013. Nitrogenase: A Draft Mechanism. Acc. Chem. Res. 46, 587–595.
Holler, T., Wegener, G., Niemann, H., Deusner, C., Ferdelman, T.G., Boetius, a., Brunner, B., Widdel, F., 2011. Carbon and sulfur back flux during anaerobic microbial oxidation of methane and coupled sulfate reduction. Proc. Natl. Acad. Sci. 108, E1484–E1490.
Holmes, S., Bonnefoy, V., 2007. Genetic and bioinformatic insights into iron and sulfur oxidation mechanisms of bioleaching organisms. In: Rawlings, D.E., Johnson, D.P. (Ed.), Biomining. Springer- Verlag, Berlin, Heidelberg, New York, pp. 281–307.
Hua, Z.-S., Han, Y.-J., Chen, L.-X., Liu, J., Hu, M., Li, S.-J., Kuang, J.-L., Chain, P.S., Huang, L.-N., Shu, W.-S., 2015. Ecological roles of dominant and rare prokaryotes in acid mine drainage revealed by metagenomics and metatranscriptomics. ISME J. 9, 1280–94.
Hyatt, D., Locascio, P.F., Hauser, L.J., Uberbacher, E.C., 2012. Gene and translation initiation site prediction in metagenomic sequences. Bioinformatics 28, 2223–2230.
Igarashi, R.Y., Seefeldt, L.C., 2003. Nitrogen fixation: the mechanism of the Mo-dependent nitrogenase. Crit. Rev. Biochem. Mol. Biol. 38, 351–384.
Itävaara, M., Vehkomäki, M-L, Nousiainen, A., 2008. Sulphate – reducing bacteria in ground water samples from Olkiluoto – analyzed by quantitative PCR., Posiva Working Report 2008-2.
Itävaara, M., Nyyssönen, M., Bomberg, M., Kapanen, A., Nousiainen, A., Ahonen, L., Hultman, J., Paulin, L., Auvinen, P., Kukkonen, I.T., 2011a. Microbiological sampling and analysis of the Outokumpu Deep Drill Hole biosphere in 2007-2009. Spec. Pap. Geol. Surv. Finl. 2011, 199–206.
Itävaara, M., Nyyssönen, M., Kapanen, A., Nousiainen, A., Ahonen, L., Kukkonen, I., 2011b. Characterization of bacterial diversity to a depth of 1500 m in the Outokumpu deep borehole, Fennoscandian Shield. FEMS Microbiol. Ecol. 77, 295–309.
Itävaara, M., Salavirta, H., Marjamaa, K., Ruskeeniemi, T., 2016a. Geomicrobiology and Metagenomics of Terrestrial Deep Subsurface Microbiomes. In: Advances in Applied Microbiology. pp. 1–77.
Itävaara, M., Salavirta, H., Marjamaa, K., Ruskeeniemi, T., 2016b. Geomicrobiology and Metagenomics of Terrestrial Deep Subsurface Microbiomes. In: Advances in Applied Microbiology. pp. 1–77.
Joye, S.B., 2012. Microbiology: A piece of the methane puzzle. Nature 491, 538–539. Kanehisa, M., Goto, S., 2000. KEGG: Kyoto encyclopedia of genes and genomes.
Nucleic Acids Res. 28, 27–30. Kanehisa, M., Goto, S., Sato, Y., Kawashima, M., Furumichi, M., Tanabe, M., 2014.
Data, information, knowledge and principle: back to metabolism in KEGG. Nucleic Acids Res. 42, D199-205.
Karkhoff-Schweizer, R.R., Huber, D.P.W., Voordouw, G., 1995. Conservation of the

89
genes for dissimilatory sulfite reductase from Desulfovibrio vulgaris and Archaeoglobus fulgidus allows their detection by PCR. Appl. Environ. Microbiol. 61, 290–296.
KEGG, 2016. KEGG (Kyoto Encyclopedia of Genes and Genomes) [WWW Document]. URL http://www.genome.jp/kegg/
Kekki, T., Zilliacus, R., 2010. Formation of nitric acid during high gamma dose radiation. Kepner, R.L., Pratt, J.R., 1994. Use of fluorochromes for direct enumeration of total
bacteria in environmental samples: past and present. Microbiol. Rev. 58, 603–615. Kietäväinen, R., Ahonen, L., Kukkonen, I.T., Hendriksson, N., Nyyssönen, M., Itävaara,
M., 2013. Characterisation and isotopic evolution of saline waters of the Outokumpu Deep Drill Hole, Finland – Implications for water origin and deep terrestrial biosphere. Appl. Geochemistry 32, 37–51.
Kleiner, M., Wentrup, C., Lott, C., Teeling, H., Wetzel, S., Young, J., Chang, Y.-J., Shah, M., VerBerkmoes, N.C., Zarzycki, J., Fuchs, G., Markert, S., Hempel, K., Voigt, B., Becher, D., Liebeke, M., Lalk, M., Albrecht, D., Hecker, M., Schweder, T., Dubilier, N., 2012. Metaproteomics of a gutless marine worm and its symbiotic microbial community reveal unusual pathways for carbon and energy use. Proc. Natl. Acad. Sci. U. S. A. 109, E1173-82.
Kletzin, A., Urich, T., Müller, F., Bandeiras, T.M., Gomes, C.M., 2004. Dissimilatory Oxidation and Reduction of Elemental Sulfur in Thermophilic Archaea. J. Bioenerg. Biomembr. 36, 77–91.
Knittel, K., Boetius, A., 2009. Anaerobic oxidation of methane: progress with an unknown process. Annu. Rev. Microbiol. 63, 311–34.
Kreimeyer, A., Perret, A., Lechaplais, C., Vallenet, D., Médigue, C., Salanoubat, M., Weissenbach, J., 2007. Identification of the last unknown genes in the fermentation pathway of lysine. J. Biol. Chem.
Krueger, F., 2015. http://www.bioinformatics.babraham.ac.uk/projects/trim_galore/ [WWW Document].
Kwon, M.J., Boyanov, M.I., Antonopoulos, D.A., Brulc, J.M., Johnston, E.R., Skinner, K.A., Kemner, K.M., O’Loughlin, E.J., 2014. Effects of dissimilatory sulfate reduction on FeIII (hydr)oxide reduction and microbial community development. Geochim. Cosmochim. Acta.
Lever, M. a., Rogers, K.L., Lloyd, K.G., Overmann, J., Schink, B., Thauer, R.K., Hoehler, T.M., Jorgensen, B.B., 2015. Life under extreme energy limitation: a synthesis of laboratory- and field-based investigations. FEMS Microbiol. Rev. 1–41.
Li, H., Durbin, R., 2009. Fast and accurate short read alignment with Burrows-Wheeler transform. Bioinformatics 25, 1754–60.
Lin, H.-T., Cowen, J.P., Olson, E.J., Lilley, M.D., Jungbluth, S.P., Wilson, S.T., Rappé, M.S., 2014. Dissolved hydrogen and methane in the oceanic basaltic biosphere. Earth Planet. Sci. Lett. 405, 62–73.
López-Gutiérrez, J.C., Henry, S., Hallet, S., Martin-Laurent, F., Catroux, G., Philippot, L., 2004. Quantification of a novel group of nitrate-reducing bacteria in the environment by real-time PCR. J. Microbiol. Methods 57, 399–407.
Lovley, D.R., Roden, E.E., Phillips, E.J.P., Woodward, J.C., 1993. Enzymatic iron and uranium reduction by sulfate-reducing bacteria. Mar. Geol.

90
Luesken, F.A., Zhu, B., van Alen, T.A., Butler, M.K., Diaz, M.R., Song, B., Op den Camp, H.J.M., Jetten, M.S.M., Ettwig, K.F., 2011. pmoA primers for detection of anaerobic methanotrophs. Appl. Environ. Microbiol. 77, 3877–3880.
Mayhew, L.E., Ellison, E.T., McCollom, T.M., Trainor, T.P., Templeton, A.S., 2013. Hydrogen generation from low-temperature water–rock reactions. Nat. Geosci. 6, 478–484.
McCollom, T.M., Amend, J.P., 2005. A thermodynamic assessment of energy requirements for biomass synthesis by chemolithoautotrophic micro-organisms in oxic and anoxic environments. Geobiology 3, 135–144.
McVean, G.A., Altshuler, D.M., Durbin, R.M., Abecasis, G.R., Bentley, D.R., Chakravarti, A., Clark, A.G., Donnelly, P., Eichler, E.E., Flicek, P., Gabriel, S.B., Gibbs, R.A., Green, E.D., Hurles, M.E., Al., E., 2012. An integrated map of genetic variation from 1,092 human genomes. Nature 491, 56–65.
Mendez-Garcia, C., Pel??ez, A.I., Mesa, V., S??nchez, J., Golyshina, O. V., Ferrer, M., 2015. Microbial diversity and metabolic networks in acid mine drainage habitats. Front. Microbiol. 6, 1–17.
Meyer-Dombard, D.R., Woycheese, K.M., Yargıçoğlu, E.N., Cardace, D., Shock, E.L., Güleçal-Pektas, Y., Temel, M., 2014. High pH microbial ecosystems in a newly discovered, ephemeral, serpentinizing fluid seep at Yanartaş (Chimera), Turkey. Front. Microbiol. 5, 723.
Miettinen, H., Bomberg, M., Nyyssönen, M., Salavirta, H., Sohlberg, E., Vikman, M., Itävaara, M., 2015a. The Diversity of Microbial Communities in Olkiluoto Bedrock Groundwaters 2009-2013. Front. Microbiol. 160.
Miettinen, H., Kietäväinen, R., Sohlberg, E., Numminen, M., Ahonen, L., Itävaara, M., 2015b. Microbiome composition and geochemical characteristics of deep subsurface high-pressure environment, Pyhäsalmi mine Finland. Front. Microbiol. 6.
Milucka, J., Ferdelman, T.G., Polerecky, L., Franzke, D., Wegener, G., Schmid, M., Lieberwirth, I., Wagner, M., Widdel, F., Kuypers, M.M.M., 2012. Zero-valent sulphur is a key intermediate in marine methane oxidation. Nature 491, 541–6.
Murzin, A. G., Chandonia, J-M., Andreeva, A., Howorth, D., Lo Conte, L., Ailey, B. G., Brenner, S. E., Hubbard, T. J. P., Chothia, C., 2009. Structural Classification of Proteins, 1.75 release.
Muyzer, G., de Waal, E.C., Uitterlinden, A.G., 1993. Profiling of complex microbial populations by denaturing gradient gel electrophoresis analysis of polymerase chain reaction-amplified genes coding for 16S rRNA. Appl. Environ. Microbiol. 59, 695–700.
Nawrocki, E.P., Kolbe, D.L., Eddy, S.R., 2009. Infernal 1.0: Inference of RNA alignments. Bioinformatics 25, 1335–1337.
Normandeau, 2014. Scripts developped over time and (sometimes) still usefull [WWW Document]. URL https://github.com/enormandeau/Scripts
Nübel, U., Engelen, B., Felske, A., Snaidr, J., Wieshuber, A., Amann, R.I., Ludwig, W., Backhaus, H., 1996. Sequence heterogeneities of genes encoding 16S rRNA in Paenibacillus polymyxy detected by temperature gradient gel electrophoresis. Appl. Environ. Microbiol. 178, 5636–5643.
Nyyssönen, M., Bomberg, M., Kapanen, A., Nousiainen, A., Pitkänen, P., Itävaara, M.,

91
2012. Methanogenic and Sulphate-Reducing Microbial Communities in Deep Groundwater of Crystalline Rock Fractures in Olkiluoto, Finland. Geomicrobiol. J. 29, 863–878.
Nyyssönen, M., Hultman, J., Ahonen, L., Kukkonen, I., Paulin, L., Laine, P., Itävaara, M., Auvinen, P., 2014. Taxonomically and functionally diverse microbial communities in deep crystalline rocks of the Fennoscandian shield. ISME J. 8, 126–138.
Pedersen, K., 2000. Exploration of deep intraterrestrial microbial life: Current perspectives. FEMS Microbiol. Lett. 185, 9–16.
Pedersen, K., 2010. Analysis of copper corrosion in compacted bentonite clay as a function of clay density and growth conditions for sulfate-reducing bacteria. J. Appl. Microbiol. 108, 1094–104.
Pedersen, K., 2012. Influence of H(2) and O(2) on sulphate-reducing activity of a subterranean community and the coupled response in redox potential. FEMS Microbiol. Ecol. 82, 653–65.
Peng, Y., Leung, H.C.M., Yiu, S.M., Chin, F.Y.L., 2012. IDBA-UD: a de novo assembler for single-cell and metagenomic sequencing data with highly uneven depth. Bioinformatics 28, 1420–8.
Pignatelli, 2014. Calculates the lowest common ancestors of each query sequence in a Blast result [WWW Document]. URL https://github.com/emepyc/Blast2lca
Pitkanen, P., Luukkonen, A., Ruotsalainen, P., Leino-Forsman, H., Vuorinen, U., 2001. Geochemical modelling of groundwater evolution and residence time at the Häststholmen site.
Pitkanen, P., Partamies, S., 2007. Origin and Implications of Dissolved Gases in Groundwater at Olkiluoto (Posiva 2007-04).
Pitkänen, P., Luukkonen, A., Ruotsalainen, P., Leino-Forsman, H., Vuorinen, U., 1999. Geochemical modelling of groundwater evolution and residence time at the Olkiluoto. Posiva Oy.
Posiva, 2012. Olkiluoto Site Description 2011 2011–2, 1039. Purkamo, L., Bomberg, M., Nyyssönen, M., Kukkonen, I., Ahonen, L., Itävaara, M.,
2015. Heterotrophic communities supplied by ancient organic carbon predominate in deep fennoscandian bedrock fluids. Microb. Ecol. 69, 319–32.
Purkamo, L., Bomberg, M., Nyyssönen, M., Kukkonen, I., Ahonen, L., Kietäväinen, R., Itävaara, M., 2013. Dissecting the deep biosphere: retrieving authentic microbial communities from packer-isolated deep crystalline bedrock fracture zones. FEMS Microbiol. Ecol. 85, 324–37.
Rabus, R., Venceslau, S.S., Wöhlbrand, L., Voordouw, G., Wall, J.D., Pereira, I.A.C., 2015a. A Post-Genomic View of the Ecophysiology, Catabolism and Biotechnological Relevance of Sulphate-Reducing Prokaryotes. Adv. Microb. Physiol. 66, 55–321.
Rabus, R., Venceslau, S.S., Wöhlbrand, L., Voordouw, G., Wall, J.D., Pereira, I. a. C.C., 2015b. A Post-Genomic View of the Ecophysiology, Catabolism and Biotechnological Relevance of Sulphate-Reducing Prokaryotes. Adv. Microb. Physiol. 66, 55–321.
Raghoebarsing, A.A., Pol, A., van de Pas-Schoonen, K.T., Smolders, A.J., Ettwig, K.F.,

92
Rijpstra, W.I., Schouten, S., Damste, J.S., Op den Camp, H.J., Jetten, M.S., Strous, M., 2006. A microbial consortium couples anaerobic methane oxidation to denitrification. Nature 440, 918–921.
Ragsdale, S.W., Pierce, E., 2009. NIH Public Access 1784, 1873–1898. Rotthauwe, J., Witzel, K., 1997. The Ammonia Monooxygenase Structural Gene amoA
as a Functional Marker : Molecular Fine-Scale Analysis of Natural Ammonia-Oxidizing Populations 63, 4704–4712.
Scheller, S., Goenrich, M., Boecher, R., Thauer, R.K., Jaun, B., 2010. The key nickel enzyme of methanogenesis catalyses the anaerobic oxidation of methane. Nature 465, 606–608.
Schmieder, R., Edwards, R., 2011. Fast identification and removal of sequence contamination from genomic and metagenomic datasets. PLoS One 6, e17288.
Schnell, R., Sandalova, T., Hellman, U., Lindqvist, Y., Schneider, G., 2005. Siroheme- and [Fe4-S4]-dependent NirA from Mycobacterium tuberculosis is a sulfite reductase with a covalent Cys-Tyr bond in the active site. J. Biol. Chem.
Smith, C., Schiater, P., Mohamund, Y., Agrawal, A., 2007. Using a constructed wetland to treat groundwater contaminated with chlorinated ethenes. In: Battelle Press - 9th International In Situ and On-Site Bioremediation Symposium 2007.
Sohlberg, E., Bomberg, M., Miettinen, H., Nyyssönen, M., Salavirta, H., Vikman, M., Itävaara, M., 2015. Revealing the unexplored fungal communities in deep groundwater of crystalline bedrock fracture zones in Olkiluoto, Finland. Front. Microbiol. 6, 573.
Sorokin, D.Y., Kuenen, J.G., 2005. Haloalkaliphilic sulfur-oxidizing bacteria in soda lakes. FEMS Microbiol. Rev. 29, 685–702.
Sugio, T., Taha, T.M., Kanao, T., Takeuchi, F., 2007. Increase in Fe 2þ -Producing Activity during Growth of Acidithiobacillus ferrooxidans ATCC23270 on Sulfur.
Tyson, G.W., Chapman, J., Hugenholtz, P., Allen, E.E., Ram, R.J., Richardson, P.M., Solovyev, V. V, Rubin, E.M., Rokhsar, D.S., Banfield, J.F., 2004. Community structure and metabolism through reconstruction of microbial genomes from the environment. Nature 428, 37–43.
Vieites, J.M., Guazzaroni, M.-E., Beloqui, A., Golyshin, P.N., Ferrer, M., 2009. Metagenomics approaches in systems microbiology. FEMS Microbiol. Rev. 33, 236–55.
Wagner, M., Roger, A.J., Flax, J.L., Gregory, A., Stahl, D.A., Wagner, M., Roger, A.J., Flax, J.L., Brusseau, G.A., Stahl, D.A., 1998. Phylogeny of Dissimilatory Sulfite Reductases Supports an Early Origin of Sulfate Respiration Phylogeny of Dissimilatory Sulfite Reductases Supports an Early Origin of Sulfate Respiration 180, 2975–2982.
Weber, K.A., Achenbach, L.A., Coates, J.D., 2006. Microorganisms pumping iron: anaerobic microbial iron oxidation and reduction. Nat. Rev. Microbiol. 4, 752–764.
Wehrmann, L.M., Arndt, S., März, C., Ferdelman, T.G., Brunner, B., 2013. The evolution of early diagenetic signals in Bering Sea subseafloor sediments in response to varying organic carbon deposition over the last 4.3Ma. Geochim. Cosmochim. Acta 109, 175–196.
Wersin, P., Alt-Epping, P., Pitkänen, P., Román-Ross, G., Trinchero, P., Molinero, J.,

93
Smith, P., Snellman, M., Filby, A., Kiczka, M., 2014. Sulphide Fluxes and Concentrations in the Spent Nuclear Fuel Repository at Olkiluoto, Posiva Report 2014-01.
Wright, K.E., Grasby, S.E., Williamson, C., Spear, J., Templeton, A.S., 2011. Bioenergetics of microbial sulfur-redox reactions in a glacial environment. Appl. Geochemistry 26, S323.
Wu, X., Holmfeldt, K., Hubalek, V., Lundin, D., Åström, M., Bertilsson, S., Dopson, M., 2015. Microbial metagenomes from three aquifers in the Fennoscandian shield terrestrial deep biosphere reveal metabolic partitioning among populations. ISME J.
Zhou, J., He, Z., Yang, Y., Deng, Y., Tringe, S.G., Alvarez-cohen, L., 2015. High-Throughput Metagenomic Technologies for Complex Microbial Community Analysis: Open and Closed Formats 6, 1–17.
Zhu, J., Wang, Q., Yuan, M., Tan, G.Y.A., Sun, F., Wang, C., Wu, W., Lee, P.H., 2016. Microbiology and potential applications of aerobic methane oxidation coupled to denitrification (AME-D) process: A review. Water Res. 90, 203–215.

94

95
APPENDIX A. TAXONOMY BASED ON KEGG PROTEIN DATABASE
The relative abundance archaeal, bacterial, eukaryotic, viral, and unknown taxonomy proteins in the subset of predicted proteins that got significant BLASTP hits against the KEGG protein.

96
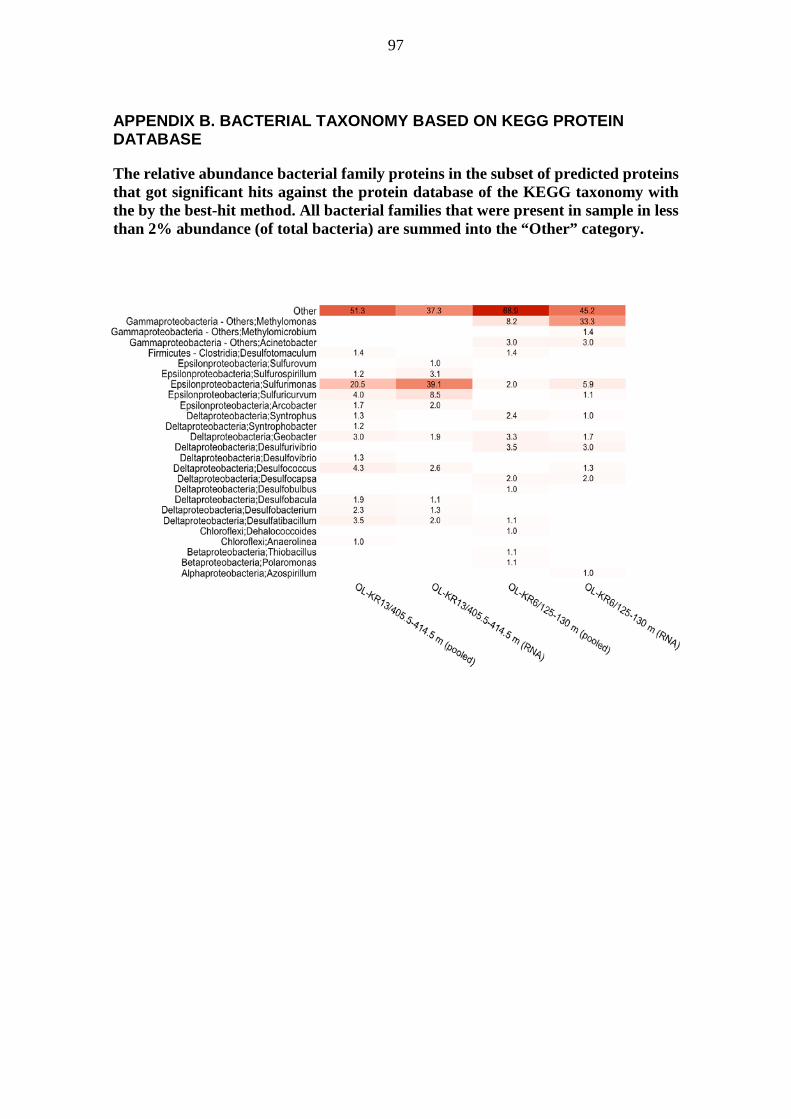
97
APPENDIX B. BACTERIAL TAXONOMY BASED ON KEGG PROTEIN DATABASE
The relative abundance bacterial family proteins in the subset of predicted proteins that got significant hits against the protein database of the KEGG taxonomy with the by the best-hit method. All bacterial families that were present in sample in less than 2% abundance (of total bacteria) are summed into the “Other” category.

98

99
APPENDIX C. ARCHAEAL TAXONOMY BASED ON KEGG PROTEIN DATABASE
The relative abundance archaeal family proteins in the subset of predicted proteins that got significant hits against the protein database of the KEGG taxonomy with the by the best-hit method. All bacterial families that were present in sample in less than 2% abundance (of total bacteria) are summed into the “Other” category.

100
101
APPENDIX D. METABOLIC ANALYSES RELATED TO METABOLIC PROCESSES
The most highly transcribed modules in OL-KR6/125−130 m are Cobalamin biosynthesis (M00122) and Methionine salvage (M00034), which are coupled because Cobalamine is required by one of the enzymes for methionine synthesis. In OL-KR6/125−130 m, the most dominating carbon fixation paths were the reductive pentose phosphate cycle also known as the Calvin cycle (M00165) and the reductive citrate cycle also known as the Arnon-Buchanan cycle (M00173, M00307). Formaldehyde assimilation through the ribulose monophosphate pathway (M00345) was also very dominant. The genes coding for methane consumption through reverse methanogenesis to acetate (M00357), reverse methanogenesis to CO2 (M00567), and methane oxidation to formaldehyde (M00174) were abundant, but sparingly transcribed. The reductive acetyl-CoA pathway also known as the Wood-Ljungdahl pathway (M00377) was genetically abundant, but sparingly transcribed. Formaldehyde assimilation through the serine pathway (M00346) or a modification using some of the enzymes from the Leucine degradation pathway (M00036) was also abundantly encoded in DNA, but springly transcribed to mRNA. The carbon-monoxide-using pathway for carbon fixation, i.e. the Acetyl-CoA pathway (M00422), was functional, but much less abundant and even more sparingly transcribed. In OL-KR13/405.5−414.5 m, the reductive citrate cycle (M00173) was the sole module dominating carbon fixation, while reverse methanogenesis from methane to acetate (M00357) was the sole module dominating methane utilization. The Calvin cycle (M00165), the Wood-Ljungdahl pathway (M00377), the reverse methanogenesis pathway from methane to CO2 (M00567), the ribulose monophosphate pathway for formaldehyde assimilation (M00345), and the Acetyl-CoA pathway (M00422) were all genetically abundant in OL-KR13/405.5−414.5 m, but sparingly transcribed. The serine cycle appeared complete in OL-KR6/125−130 m, but malate:CoA ligase was not found in the metagenome of OL-KR13/405.5−414.5 m. The gene may have differed too much from the known enzymes and were therefore not annotated correctly, or the reaction catalysed by the known enzyme (K09011, D-citramalate synthase) was implemented by two other enzymes; succinyl-CoA:D-citramalyl-CoA transferase (K18313) and R-citramalyl-CoA lyase (K18314). Regardless of its completeness, the serine cycle remained a minor pathway for formaldehyde assimilation in these drillhole communities. Other abundant and highly active metabolic processes in OL-KR6/125−130 m were biosynthesis of cofactors such as Glutathione (M00118), Thiamine pyrophosphate (M00127), Coenzyme A (M00119, M00120), Biotin (M00123, M00577), Heme (M00121) Riboflavin (M00125), and Coenzyme Q (M00117, M00096, M00095), biosynthesis of Lipopolysaccharides (M00063, M00320, M00250), motility (M00515, M00506), and tryptophan biosynthesis (M00023). The relative transcriptional activity of the two-component regulatory system RegB-RegA (M00523) indicating redox response suggests OL-KR6/125−130 m may be adapting to
102
changes in the reduction potential of the solution, i.e. change of extracellular electron acceptor. Based on the assumptions that high abundance and low transcriptional activity infer past activation, and high relative transcriptional activity infer ongoing activation, potential metabolic triggers were sought. In OL-KR6/125−130 m, past adaptation to Copper (M00452), Zinc (M00242), Nickel (M00246, M00245, M00239), Iron(III) (M00190, M00240), and Molybdate/Tungstate (M00189, M00423, M00186) may have taken place, as indicated by relatively high genetic abundance and low transcriptional activity. The ChpA-ChpB/PilGH (chemosensory) two-component regulatory system (M00507) and the HydH-HydG (metal tolerance) two-component regulatory system (M00499) were functional in OL-KR6/125−130 m. Manganese homeostasis (M00465) and transport (M00316, M00317) may have been important for a tiny subpolulation in OL-KR6/125−130 m. Other highly abundant and highly active metabolic processes in OL-KR13/405.5−414.5 m were biosynthesis of Thiamine pyrophosphate (M00127), Biotin (M00572, M00123, M00577), and Coenzyme A (M00120). The biosynthesis of the methyl-group carrier molecules tetrahydrofolate (M00126) and cobalamin (M00122) were highly abundant in OL-KR13/405.5−414.5 m, but only moderately transcribed. The biosynthesis of redox cofactors such as Riboflavin (M00125), Nicotinamid adenine dinucleotide (M00115), Heme (M00121), and also to some extent coenzyme F420 (M00378) were relatively abundant and transcriptionally active. The respiratory-chain (electron transport chain) units, Cytochrome c oxidase (cbb-type) (M00156), Cytochrome bc1 complex (M00151), and NADH: quinone oxidoreductase (M00144) were highly abundant and highly transcribed in OL-KR13/405.5−414.5 m. The biosynthesis of cysteine (M00021) and methionine (M00017) in OL-KR13/405.5−414.5 m were abundant and highly transcribed. Biosynthesis of branched-chain amino acids (M00570, M00019, M00432, M00535) were highly abundant, and still active. The biosynthesis of aromatic amino acids (M00023, M00022, M00025, M00024) were abundant, yet increasingly active. Although the biosynthesis of isoprenoids through the non-mevalonate pathway (M00096) was highly active and highly abundant, the biosynthesis of isoprenoids through the mevalonate pathway (M00095) and the subsequent biosynthesis of C10-C20 isoprenoids (M00364, M00367, M00365) were diminishing in OL-KR13/405.5−414.5 m. The biosynthesis of lipopolysachharides (M00063, M00320) and fatty acids (M00082, M00083) in OL-KR13/405.5−414.5 m were abundant, yet only moderately active. The highly abundant and highly transcriptionally active biosynthesis of lysine (M00527, M00016), nucleotides (M00048), histidine (M00026), phosphatidylethanolamine (M00093), ornithine (M00028), and polyamines (M00133) indicated a need for ammonia

103
storage in OL-KR13/405.5−414.5 m. The product preference may have been changing from DNA nucleotides (M00053, M00549, M00049) and histidine to RNA nucleotides (M00052, M00051, M00050) and lysine. Highly abundant, yet sparingly active modules in OL-KR13/405.5−414.5 m were M00239 (Peptides/nickel transport system), M00244 (Putative zinc/manganese transport system), M00240 (Iron complex transport system), M00186 (Tungstate transport system), M00246 (Nickel transport system), and M00245 (Cobalt/nickel transport system). In contrast, the zinc transport system (M00242), the molybdate transport system (M00189), and the HydH-HydG (metal tolerance) two-component regulatory system (M00499) were transcriptionally very active. The zinc (M00242) and molybdate (M00189) transport systems were highly abundant, and abundant, respectively. Although the two-component regulatory system for chemotaxis (M00506) was highly abundant and moderately active in OL-KR13/405.5−414.5 m, thus indicating continued motility, the abundant adhesion protein transport system (M00330) and the transcriptionally highly active regulatory module for synthesis of attachment pili (M00501) indicate some type of immobilization. The activation of chemotaxis and immobilization may be a response to the sampling procedure where the microorganisms were removed from their souce by flowing water. The flow rate of OL-KR6/125−130 m (0.75 L h-1) was much lower than the flow rate of OL-KR6/125−130 m (12 L h-1), which could explain why OL-KR13/405.5−414.5 m showed a greater response for immobilization.

104
Description and evaluation of the most relevant metabolic processes (modules) in OL-KR6/125−130 m and OL-KR13/405.5−414.5 m. The evaluation considered DNA abundance, RNA abundance, and the relative transcriptional activity of the modules. The modules are listed in descending order of importance. The relevance was determined by requiring the module to be functional and at least some significance in DNA abundance, RNA abundance, or relative transcriptional activity.
Module Description Evaluation M00122 Cobalamin biosynthesis, cobinamide → cobalamin abundant in OL-KR13/405.5−414.5 m,
highly abundant and highly active in OL-KR6/125−130 m
M00034 Methionine salvage pathway highly abundant and highly active in OL-KR6/125−130 m
M00345 Formaldehyde assimilation, ribulose monophosphate pathway
abundant in both, more active in OL-KR6/125−130 m
M00167 Reductive pentose phosphate cycle, glyceraldehyde-3P → ribulose-5P
abundant in both, more active in OL-KR6/125−130 m
M00061 D-Glucuronate degradation more active in OL-KR6/125−130 m M00631 D-Galacturonate degradation (bacteria) more active in OL-KR6/125−130 m M00036 Leucine degradation, leucine → acetoacetate +
acetyl-CoA much more active in OL-KR6/125−130 m
M00307 Pyruvate oxidation, pyruvate → acetyl-CoA abundant in both, more active in OL-KR6/125−130 m
M00165 Reductive pentose phosphate cycle (Calvin cycle) highly abundant in both, more active in OL-KR6/125−130 m
M00515 FlrB-FlrC (polar flagellar synthesis) two-component regulatory system
functional in OL-KR6/125−130 m
M00004 Pentose phosphate pathway (Pentose phosphate cycle)
highly abundant in both, more active in OL-KR6/125−130 m
M00596 Dissimilatory sulphate reduction, sulphate → H2S abundant in both, more active in OL-KR6/125−130 m
M00133 Polyamine biosynthesis, arginine → agmatine → putrescine → spermidine
abundant in both, more active in OL-KR13/405.5−414.5 m
M00179 Ribosome, archaea highly abundant in both, more active in OL-KR6/125−130 m
M00011 Citrate cycle, second carbon oxidation, 2-oxoglutarate → oxaloacetate
highly abundant in both, more active in OL-KR6/125−130 m
M00178 Ribosome, bacteria highly abundant in both, more active in OL-KR6/125−130 m
M00173 Reductive citrate cycle (Arnon-Buchanan cycle) highly abundant in both, more active in OL-KR13/405.5−414.5 m
M00023 Tryptophan biosynthesis, chorismate → tryptophan
highly abundant in both, more active in OL-KR13/405.5−414.5 m
M00008 Entner-Doudoroff pathway, glucose-6P → glyceraldehyde-3P + pyruvate
abundant in both, more active in OL-KR6/125−130 m
M00009 Citrate cycle (TCA cycle, Krebs cycle) highly abundant in both, more active in OL-KR6/125−130 m
M00527 Lysine biosynthesis, DAP aminotransferase pathway, aspartate → lysine
more active in OL-KR13/405.5−414.5 m
M00501 PilS-PilR (type 4 fimbriae synthesis) two-component regulatory system
more active in OL-KR13/405.5−414.5 m
M00016 Lysine biosynthesis, succinyl-DAP pathway, aspartate → lysine
highly abundant in both, more active in OL-KR13/405.5−414.5 m
M00125 Riboflavin biosynthesis, GTP → riboflavin/FMN/FAD
highly abundant in both, more active in OL-KR6/125−130 m
M00119 Pantothenate biosynthesis, valine/L-aspartate → pantothenate
abundant in both, more active in OL-KR6/125−130 m

105
Module Description Evaluation M00118 Glutathione biosynthesis, glutamate → glutathione Abundant and transcriptionally active
in OL-KR6/125−130 m M00017 Methionine biosynthesis, apartate → homoserine
→ methionine abundant in both, more active in OL-KR13/405.5−414.5 m
M00175 Nitrogen fixation, nitrogen → ammonia more active in OL-KR13/405.5−414.5 m M00210 Phospholipid transport system abundant in both, more active in OL-
KR6/125−130 m M00250 Lipopolysaccharide transport system more active in OL-KR6/125−130 m M00595 Thiosulphate oxidation by SOX complex,
thiosulphate → sulphate functional in OL-KR6/125−130 m
M00024 Phenylalanine biosynthesis, chorismate → phenylalanine
more active in OL-KR13/405.5−414.5 m
M00003 Gluconeogenesis, oxaloacetate → fructose-6P highly abundant in both, more active in OL-KR6/125−130 m
M00157 F-type ATPase, prokaryotes and chloroplasts highly abundant in both M00183 RNA polymerase, bacteria abundant in both, slightly more
transcribed in OL-KR6/125−130 m M00523 RegB-RegA (redox response) two-component
regulatory system functional in OL-KR6/125−130 m
M00166 Reductive pentose phosphate cycle, ribulose-5P → glyceraldehyde-3P
abundant in both, more active in OL-KR6/125−130 m
M00552 D-galactonate degradation, De Ley-Doudoroff pathway, D-galactonate → glycerate-3P
abundant in both, more active in OL-KR6/125−130 m
M00063 CMP-KDO biosynthesis abundant in both M00095 C5 isoprenoid biosynthesis, mevalonate pathway more active in OL-KR6/125−130 m M00025 Tyrosine biosynthesis, chorismate → tyrosine more active in OL-KR13/405.5−414.5 m M00149 Succinate dehydrogenase, prokaryotes abundant in both, slightly more active
in OL-KR13/405.5−414.5 m M00150 Fumarate reductase, prokaryotes very active in OL-KR13/405.5−414.5 m M00135 GABA biosynthesis, eukaryotes, putrescine →
GABA more active in OL-KR13/405.5−414.5 m
M00423 Molybdate/tungstate transport system more active in OL-KR13/405.5−414.5 m M00529 Denitrification, nitrate → nitrogen slightly more active in OL-
KR13/405.5−414.5 m M00530 Dissimilatory nitrate reduction, nitrate →
ammonia abundant in both, more active in OL-KR13/405.5−414.5 m
M00299 Spermidine/putrescine transport system more transcribed in OL-KR6/125−130 m M00526 Lysine biosynthesis, DAP dehydrogenase
pathway, aspartate → lysine abundant in both, more active in OL-KR13/405.5−414.5 m
M00126 Tetrahydrofolate biosynthesis, GTP → THF abundant in both, much more active in OL-KR13/405.5−414.5 m
M00026 Histidine biosynthesis, PRPP → histidine highly abundant in both, slightly more active in OL-KR13/405.5−414.5 m
M00454 KdpD-KdpE (potassium transport) two-component regulatory system
slightly more active in OL-KR6/125−130 m
M00497 GlnL-GlnG (nitrogen regulation) two-component regulatory system
slightly more active in OL-KR6/125−130 m
M00359 Aminoacyl-tRNA biosynthesis, eukaryotes highly abundant in both, more transcribed in OL-KR6/125−130 m
M00360 Aminoacyl-tRNA biosynthesis, prokaryotes highly abundant in both, more transcribed in OL-KR6/125−130 m
M00357 Methanogenesis, acetate → methane more active in OL-KR13/405.5−414.5 m M00330 Adhesin protein transport system more active in OL-KR13/405.5−414.5 m

106
Module Description Evaluation M00045 Histidine degradation, histidine => N-
formiminoglutamate → glutamate functional in OL-KR13/405.5−414.5 m
M00028 Ornithine biosynthesis, glutamate → ornithine abundant in both, more active in OL-KR13/405.5−414.5 m
M00567 Methanogenesis, CO2 → methane abundant in both, more active in OL-KR13/405.5−414.5 m
M00193 Putative spermidine/putrescine transport system functional in OL-KR13/405.5−414.5 m
M00185 Sulphate transport system functional in OL-KR6/125−130 m M00364 C10-C20 isoprenoid biosynthesis, bacteria abundant in OL-KR13/405.5−414.5 m M00176 Assimilatory sulphate reduction, sulphate → H2S abundant in both, slightly more active
in OL-KR13/405.5−414.5 m M00531 Assimilatory nitrate reduction, nitrate → ammonia more transcribed in OL-KR6/125−130 m M00554 Nucleotide sugar biosynthesis, galactose => UDP-
galactose slightly more active in OL-KR13/405.5−414.5 m
M00365 C10-C20 isoprenoid biosynthesis, archaea slightly more active in OL-KR13/405.5−414.5 m
M00174 Methane oxidation, methanotroph, methane → formaldehyde
abundant in OL-KR6/125−130 m
M00323 Urea transport system slightly more active in OL-KR6/125−130 m
M00134 Polyamine biosynthesis, arginine → ornithine → putrescine
more active in OL-KR13/405.5−414.5 m
M00140 C1-unit interconversion, prokaryotes abundant in both, slightly more active in OL-KR13/405.5−414.5 m
M00342 Bacterial proteasome slightly more active in OL-KR13/405.5−414.5 m
M00524 FixL-FixJ (nitrogen fixation) two-component regulatory system
functional in both
M00343 Archaeal proteasome slightly more active in OL-KR13/405.5−414.5 m
M00377 Reductive acetyl-CoA pathway (Wood-Ljungdahl pathway)
abundant in both, slightly more active in OL-KR13/405.5−414.5 m
M00116 Menaquinone biosynthesis, chorismate → menaquinone
abundant in OL-KR6/125−130 m
M00378 F420 biosynthesis slightly more active in OL-KR13/405.5−414.5 m
M00141 C1-unit interconversion, eukaryotes slightly more active in OL-KR13/405.5−414.5 m
M00471 NarX-NarL (nitrate respiration) two-component regulatory system
functional in OL-KR6/125−130 m
M00317 Manganese/iron transport system functional in OL-KR6/125−130 m M00186 Tungstate transport system slightly more active in OL-
KR13/405.5−414.5 m M00445 EnvZ-OmpR (osmotic stress response) two-
component regulatory system functional in OL-KR6/125−130 m
M00367 C10-C20 isoprenoid biosynthesis, non-plant eukaryotes
functional in OL-KR13/405.5−414.5 m
M00509 WspE-WspRF (chemosensory) two-component regulatory system
functional in OL-KR6/125−130 m
M00264 DNA polymerase II complex, archaea slightly more active in OL-KR13/405.5−414.5 m
M00450 BaeS-BaeR (envelope stress response) two-component regulatory system
functional in OL-KR6/125−130 m
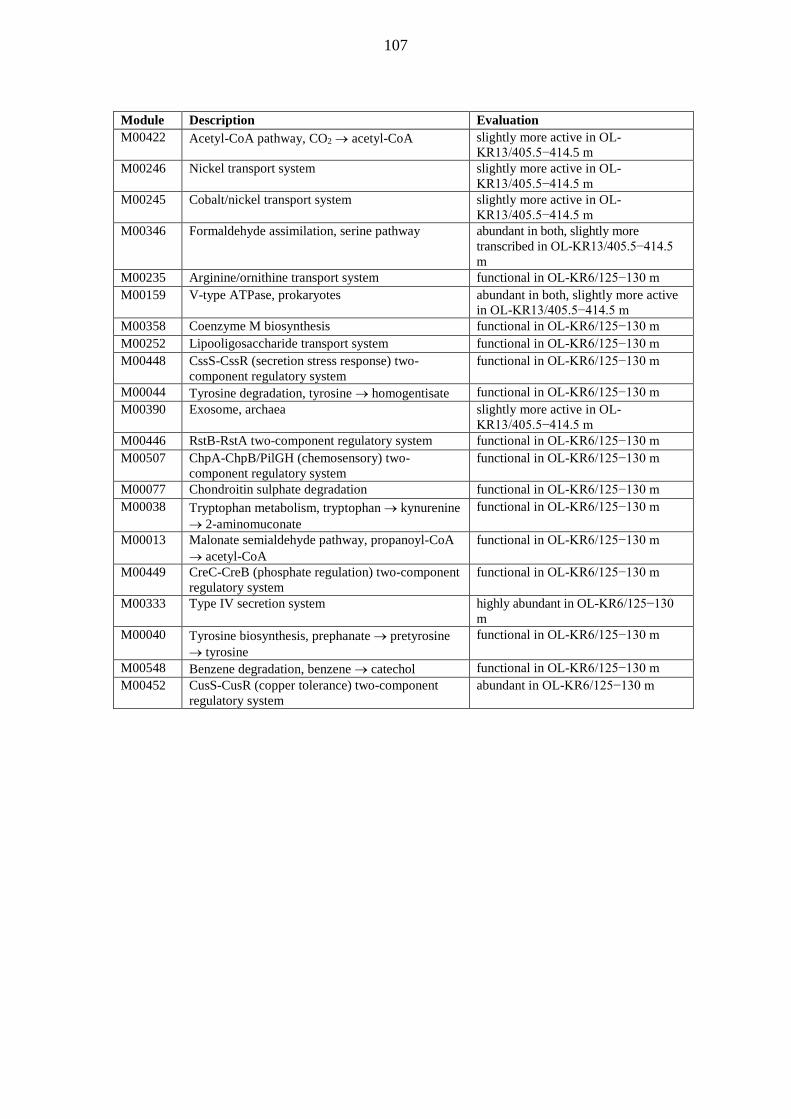
107
Module Description Evaluation M00422 Acetyl-CoA pathway, CO2 → acetyl-CoA slightly more active in OL-
KR13/405.5−414.5 m M00246 Nickel transport system slightly more active in OL-
KR13/405.5−414.5 m M00245 Cobalt/nickel transport system slightly more active in OL-
KR13/405.5−414.5 m M00346 Formaldehyde assimilation, serine pathway abundant in both, slightly more
transcribed in OL-KR13/405.5−414.5 m
M00235 Arginine/ornithine transport system functional in OL-KR6/125−130 m M00159 V-type ATPase, prokaryotes abundant in both, slightly more active
in OL-KR13/405.5−414.5 m M00358 Coenzyme M biosynthesis functional in OL-KR6/125−130 m M00252 Lipooligosaccharide transport system functional in OL-KR6/125−130 m M00448 CssS-CssR (secretion stress response) two-
component regulatory system functional in OL-KR6/125−130 m
M00044 Tyrosine degradation, tyrosine → homogentisate functional in OL-KR6/125−130 m M00390 Exosome, archaea slightly more active in OL-
KR13/405.5−414.5 m M00446 RstB-RstA two-component regulatory system functional in OL-KR6/125−130 m M00507 ChpA-ChpB/PilGH (chemosensory) two-
component regulatory system functional in OL-KR6/125−130 m
M00077 Chondroitin sulphate degradation functional in OL-KR6/125−130 m M00038 Tryptophan metabolism, tryptophan → kynurenine
→ 2-aminomuconate functional in OL-KR6/125−130 m
M00013 Malonate semialdehyde pathway, propanoyl-CoA → acetyl-CoA
functional in OL-KR6/125−130 m
M00449 CreC-CreB (phosphate regulation) two-component regulatory system
functional in OL-KR6/125−130 m
M00333 Type IV secretion system highly abundant in OL-KR6/125−130 m
M00040 Tyrosine biosynthesis, prephanate → pretyrosine → tyrosine
functional in OL-KR6/125−130 m
M00548 Benzene degradation, benzene → catechol functional in OL-KR6/125−130 m M00452 CusS-CusR (copper tolerance) two-component
regulatory system abundant in OL-KR6/125−130 m

108

109
APPENDIX E. WRITTEN METABOLIC ANALYSES RELATED TO ENZYME FUNCTIONS IN OL-KR6/125−130 M AND OL-KR13/405.5−414.5 M
Several enzyme functions related to metal transporters, ion channels, and resistance proteins were common to OL-KR6/125−130 m and OL-KR13/405.5−414.5 m. The ions for which there were such enzyme in OL-KR6/125−130 m were copper(I), silver, sulphate, iron(II), iron, cobalt, zinc, cadmium, potassium, magnesium, ammonium, calcium, copper(II), bicarbonate, nickel, and nitrite. The copper-resistance (tolerance) proteins (K07156 and K07245) were abundant in OL-KR6/125−130 m. The ions for which there were such enzyme in OL-KR13/405.5−414.5 m were acetate, iron, chloride, calcium, iron(III), copper(I), silver, sulphate, potassium, molybdenum, sodium, magnesium, cobalt, zinc, cadmium, and ammonium. Magnesium chelatase (EC 6.6.1.1), cobaltochelatase (EC 6.6.1.2), the chromate transporter (chrA; K07240), and the cation/acetate symporter (actP; K14393) were moderately abundant in OL-KR13/405.5−414.5 m. In addition, oxidoreductases for rare electron donors/acceptors were found. The oxidoreductases for OL-KR6/125−130 m related to arsenate, iron, reactive oxygen species, thiosulphate, disulphide, and hydrogen gas. The oxidoreductases for OL-KR13/405.5−414.5 m concerned disulphide, arsenate, thiosulphate, reactive oxygen species, hydrogen gas, iron, (S)-S-oxide, and selenate. Arsenate reductase (1.20.4.1) and selenate reductase (EC 1.97.1.9) were present in both samples, but the arsenite-transporting ATPase (EC 3.6.3.16) was moderately abundant only in OL-KR6/125−130 m. Voltage-gated ion channels were abundant and moderately transcribed in both habitats; more abundant in OL-KR13/405.5−414.5 m, but relatively more transcribed in OL-KR6/125−130 m. In OL-KR6/125−130 m, roughly 20% of the organism having voltage-gated ion channels had the voltage-gated sodium channel (K08714) and 80% the voltage-gated potassium channel (K10716). In OL-KR13/405.5−414.5 m, the channels had roughly a 50% share, each. The Ca-activated chloride channel (K07114), the Ca2+-transporting ATPase (EC 3.6.3.8), and the Ca2+:H+ antiporter (K07300) were highly abundant in OL-KR13/405.5−414.5 m, but only moderately abundant in OL-KR6/125−130 m. The csrA carbon storage regulator (K03563) was highly abundant and highly active in OL-KR13/405.5−414.5 m, although present also in OL-KR6/125−130 m. OL-KR6/125−130 m contained a haloalkane dehalogenase (EC 3.8.1.5), while OL-KR13/405.5−414.5 m contained a tryptophan 7-halogenase (EC 1.14.19.9). Deoxyribodipyrimidine photo-lyase (EC 4.1.99.3) was abundant and active in OL-KR13/405.5−414.5 m. If sulphate-reducers try to oxidise molecular oxygen, reactive oxygen species (ROS) such as superoxide, hydrogen peroxide and hydroxyl radical are formed (Rabus et al., 2015a). Denitrification enzymes may also produce nitric oxide, which is a potent reactive nitrogen species (RNS). Thus, the expression of peroxiredoxin (EC 1.11.1.15), three superoxide

110
dismutases (sod1; K04565, sod2; K04564, and EC 1.15.1.1), and catalase (katE; K03781) may have indicated oxidative stress (Hua et al., 2015) or the need for protection against ROS/RNS. However, the co-occurrence with superoxide reductase (EC 1.15.1.2), chaperones (dnaK; K04043, grpE; K03687, hslO; K04083, htpG; K04079, groES; K04078, and groEL; K04077), heat-shock-proteins (K03283, K09542, HSP20; K13993, and clpB; K03695), and cold-shock-protein (cspA; K03704) would rather suggest longevity maximization (map04213).

111
APPENDIX F. METABOLIC ANALYSES RELATED TO ENZYME FUNCTIONS IN OL-KR6/125−130 M
Description and evaluation of the DNA abundance (A), the RNA abundance (T), and the relativel transcriptional activity (Q) of enzyme functions in OL-KR6/125−130 m not being part of metabolic processes (modules). The KEGG orthology number (KO) and the Enzyme Commission number (EC) are enzyme classification systems categorizing known enzymes based on the metabolic function they catalyze. The enzyme functions are listed in descending order of importance. A plus sign denotes ‘value above average’. KO or EC
A T Q Description
1.16.3.1 + + + ferroxidase 1.20.4.1 + + + arsenate reductase (glutaredoxin) 3.5.1.53 + + + N-carbamoylputrescine amidase 3.1.2.6 + + + hydroxyacylglutathione hydrolase 2.7.1.90 - - + diphosphate-fructose-6-phosphate 1-phosphotransferase K05802 + + + kefA, bspA, aefA; potassium efflux system protein K16092 + + + btuB; vitamin B12 transporter K04759 + + + feoB; ferrous iron transport protein B K07245 + + + pcoD; copper resistance protein D K03611 + + + dsbB; disulphide bond formation protein DsbB K07390 + + + grxD, GLRX5; monothiol glutaredoxin K07787 + + + cusA, silA; Cu(I)/Ag(I) efflux system membrane protein
CusA/SilA K03321 + + + TC.SULP; sulphate permease, SulP family K03497 + + + parB, spo0J; chromosome partitioning protein, ParB family 1.6.1.2 + + + NAD(P) transhydrogenase (Re/Si-specific) 1.11.1.15
+ + + peroxiredoxin
K06189 + + + corC; magnesium and cobalt transporter K03676 + - + grxC, GLRX, GLRX2; glutaredoxin 3 1.8.1.8 + + + protein-disulphide reductase K08970 - - + rcnA; nickel/cobalt exporter 1.2.1.2 + + + formate dehydrogenase 1.1.1.284
+ - + S-(hydroxymethyl)glutathione dehydrogenase
3.1.2.12 + - + S-formylglutathione hydrolase K03893 - - + arsB; arsenical pump membrane protein K02598 - - + nirC; nitrite transporter NirC K03499 + + + trkA, ktrA; trk system potassium uptake protein 1.8.5.2 - - + thiosulphate dehydrogenase (quinone) K03563 + - + csrA; carbon storage regulator K07156 + - + copC, pcoC; copper resistance protein C 2.7.8.5 + + + CDP-diacylglycerol---glycerol-3-phosphate 3-
phosphatidyltransferase K03733 + + + xerC; integrase/recombinase XerC 3.8.1.5 - - + haloalkane dehalogenase

112
3.4.19.13
- - + glutathione hydrolase
3.6.3.4 + - + Cu2+-exporting ATPase 1.12.1.2 + - - hydrogen dehydrogenase KO or EC
A T Q Description
1.18.1.2 + - - ferredoxin-NADP reductase K03284 + + - corA; magnesium transporter 3.6.3.12 + - - K+-transporting ATPase K03549 + - - kup; KUP system potassium uptake protein K00351 + - - nqrF; Na+-transporting NADH:ubiquinone oxidoreductase
subunit F [EC:1.6.5.-] 1.12.99.6
+ - - hydrogenase (acceptor)
K07238 + - - TC.ZIP, zupT, ZRT3, ZIP2; zinc transporter, ZIP family K02014 + + - TC.FEV.OM; iron complex outermembrane recepter protein K06213 + - - mgtE; magnesium transporter 3.6.3.54 + + - Cu+-exporting ATPase 2.8.1.1 + - - thiosulphate sulphurtransferase K03498 + - - trkH, trkG, ktrB; trk system potassium uptake protein 1.15.1.1 + - - superoxide dismutase K03320 + - - amt, AMT, MEP; ammonium transporter, Amt family K07785 + - - nrsD, nreB; MFS transporter, NRE family, putaive nickel
resistance protein K04751 + - - glnB; nitrogen regulatory protein P-II 1 K12141 + - - hyfF; hydrogenase-4 component F [EC:1.-.-.-] 3.6.3.16 + - - arsenite-transporting ATPase K03671 + - - trxA; thioredoxin 1 1.5.5.1 + - - electron-transferring-flavoprotein dehydrogenase K07213 + - - ATOX1, ATX1, copZ, golB; copper chaperone 3.6.3.3 + - - Cd2+-exporting ATPase 3.6.3.5 + - - Zn2+-exporting ATPase K04758 + - - feoA; ferrous iron transport protein A 1.8.1.9 + - - thioredoxin-disulphide reductase K07301 + - - yrbG; cation:H+ antiporter 3.6.3.8 + - - Ca2+-transporting ATPase K16267 + - - zipB; zinc and cadmium transporter K15726 + - - czcA; cobalt-zinc-cadmium resistance protein CzcA K12140 + - - hyfE; hydrogenase-4 component E [EC:1.-.-.-] K18814 + - - ictB; putative inorganic carbon (HCO3
-) transporter K16302 + - - CNNM; metal transporter CNNM
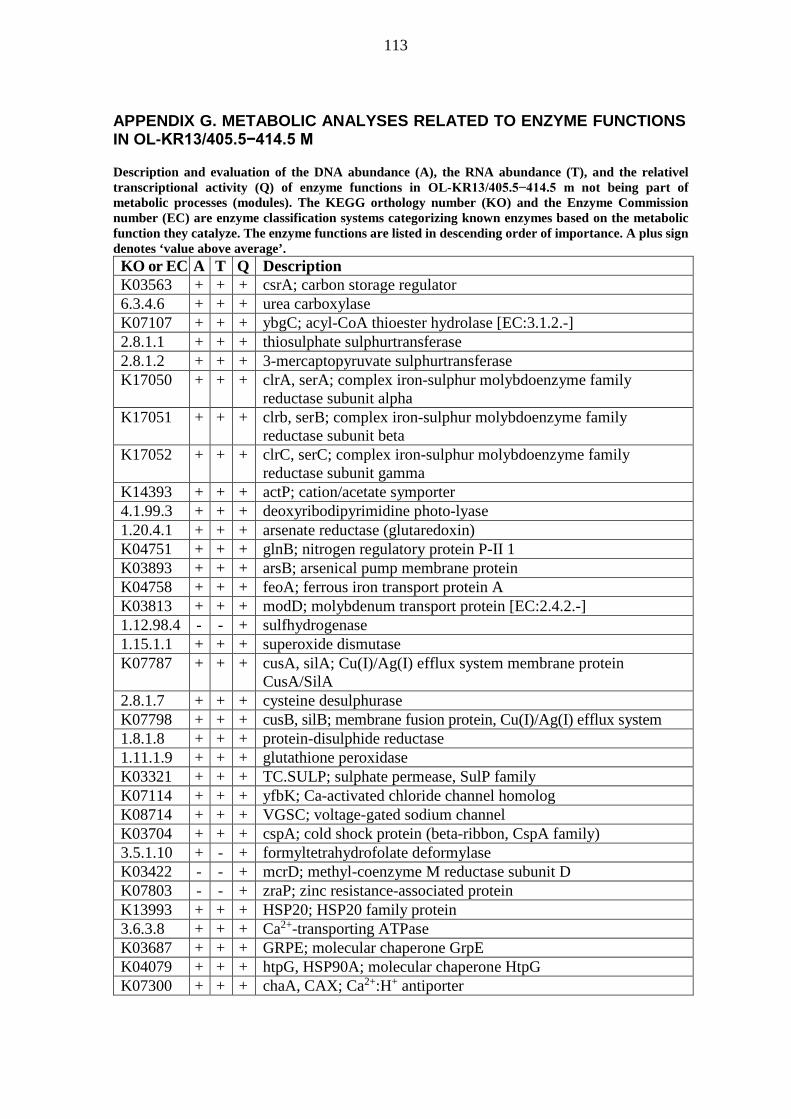
113
APPENDIX G. METABOLIC ANALYSES RELATED TO ENZYME FUNCTIONS IN OL-KR13/405.5−414.5 M
Description and evaluation of the DNA abundance (A), the RNA abundance (T), and the relativel transcriptional activity (Q) of enzyme functions in OL-KR13/405.5−414.5 m not being part of metabolic processes (modules). The KEGG orthology number (KO) and the Enzyme Commission number (EC) are enzyme classification systems categorizing known enzymes based on the metabolic function they catalyze. The enzyme functions are listed in descending order of importance. A plus sign denotes ‘value above average’. KO or EC A T Q Description K03563 + + + csrA; carbon storage regulator 6.3.4.6 + + + urea carboxylase K07107 + + + ybgC; acyl-CoA thioester hydrolase [EC:3.1.2.-] 2.8.1.1 + + + thiosulphate sulphurtransferase 2.8.1.2 + + + 3-mercaptopyruvate sulphurtransferase K17050 + + + clrA, serA; complex iron-sulphur molybdoenzyme family
reductase subunit alpha K17051 + + + clrb, serB; complex iron-sulphur molybdoenzyme family
reductase subunit beta K17052 + + + clrC, serC; complex iron-sulphur molybdoenzyme family
reductase subunit gamma K14393 + + + actP; cation/acetate symporter 4.1.99.3 + + + deoxyribodipyrimidine photo-lyase 1.20.4.1 + + + arsenate reductase (glutaredoxin) K04751 + + + glnB; nitrogen regulatory protein P-II 1 K03893 + + + arsB; arsenical pump membrane protein K04758 + + + feoA; ferrous iron transport protein A K03813 + + + modD; molybdenum transport protein [EC:2.4.2.-] 1.12.98.4 - - + sulfhydrogenase 1.15.1.1 + + + superoxide dismutase K07787 + + + cusA, silA; Cu(I)/Ag(I) efflux system membrane protein
CusA/SilA 2.8.1.7 + + + cysteine desulphurase K07798 + + + cusB, silB; membrane fusion protein, Cu(I)/Ag(I) efflux system 1.8.1.8 + + + protein-disulphide reductase 1.11.1.9 + + + glutathione peroxidase K03321 + + + TC.SULP; sulphate permease, SulP family K07114 + + + yfbK; Ca-activated chloride channel homolog K08714 + + + VGSC; voltage-gated sodium channel K03704 + + + cspA; cold shock protein (beta-ribbon, CspA family) 3.5.1.10 + - + formyltetrahydrofolate deformylase K03422 - - + mcrD; methyl-coenzyme M reductase subunit D K07803 - - + zraP; zinc resistance-associated protein K13993 + + + HSP20; HSP20 family protein 3.6.3.8 + + + Ca2+-transporting ATPase K03687 + + + GRPE; molecular chaperone GrpE K04079 + + + htpG, HSP90A; molecular chaperone HtpG K07300 + + + chaA, CAX; Ca2+:H+ antiporter

114
KO or EC A T Q Description 1.97.1.9 - - + selenate reductase K06213 + + + mgtE; magnesium transporter 1.12.1.2 + + + hydrogen dehydrogenase 1.16.3.1 + - + ferroxidase K04043 + + + dnaK; molecular chaperone DnaK K07301 + + + yrbG; cation:H+ antiporter K07240 + - + chrA; chromate transporter K03686 + + + dnaJ; molecular chaperone DnaJ 1.15.1.2 + - - superoxide reductase K02014 + + + TC.FEV.OM; iron complex outermembrane recepter protein 1.2.1.2 + - - formate dehydrogenase K10716 + + - kch, trkA, mthK, pch; voltage-gated potassium channel K03324 + - - yjbB; phosphate:Na+ symporter 1.12.5.1 + - - hydrogen:quinone oxidoreductase K03605 + - - hyaD, hybD; hydrogenase maturation protease [EC:3.4.23.-] K03620 + - - hyaC; Ni/Fe-hydrogenase 1 B-type cytochrome subunit K16264 + - - czcD, zitB; cobalt-zinc-cadmium efflux system protein 1.11.1.15 + - - peroxiredoxin 6.6.1.1 + - - magnesium chelatase 1.8.1.9 + - - thioredoxin-disulphide reductase K00400 + - - K00400; methyl coenzyme M reductase system, component A2 1.12.99.6 + - - hydrogenase (acceptor) 1.11.1.5 + - - cytochrome-c peroxidase K04077 + - - groEL, HSPD1; chaperonin GroEL 1.14.19.9 + - - tryptophan 7-halogenase K04078 + - - groES, HSPE1; chaperonin GroES 1.8.4.11 + - - peptide-methionine (S)-S-oxide reductase K03529 + - - smc; chromosome segregation protein K03726 + - - helS; helicase [EC:3.6.4.-] K03313 + - - nhaA; Na+:H+ antiporter, NhaA family K07332 + - - flaI-A, flaI; archaeal flagellar protein FlaI 3.6.3.54 + - - Cu+-exporting ATPase K07333 + - - flaJ-A, flaJ; archaeal flagellar protein FlaJ K05567 + - - mnhC, mrpC; multicomponent Na+:H+ antiporter subunit C K03320 + - - amt, AMT, MEP; ammonium transporter, Amt family K04759 + - - feoB; ferrous iron transport protein B K03498 + - - trkH, trkG, ktrB; trk system potassium uptake protein K05568 + - - mnhD, mrpD; multicomponent Na+:H+ antiporter subunit D 1.12.7.2 + - - ferredoxin hydrogenase K05570 + - - mnhF, mrpF; multicomponent Na+:H+ antiporter subunit F K10725 + - - cdc6A; archaeal cell division control protein 6 K05566 + - - mnhB, mrpB; multicomponent Na+:H+ antiporter subunit B 6.6.1.2 + - - cobaltochelatase K05571 + - - mnhG, mrpG; multicomponent Na+:H+ antiporter subunit G

115
APPENDIX H. METABOLIC ANALYSES RELATED TO KEGG ORTHOLOGY NUMBERS
KEGG orthology (KO) numbers directly involved with sulphate reduction to sulphide in OL-KR6/125−130 m and OL-KR13/405.5−414.5 m. The count C measures the number of distinct sequences in the metagenome having the KO annotation, which is an indication on how many species have the gene. A is the abundance of DNA, T is the abundance of RNA, and Q is the relative transcriptional activity. OL-KR6/125−130 m OL-KR13/405.5−414.5 m KO C A T Q C A T Q Description K02048 11 804 283 0.72 6 45 4 0.29 cysP; sulfate transport system substrate-binding protein, sulT,
active sulphate uptake K02046 7 714 292 0.73 5 25 5 0.47 cysU; sulfate transport system permease protein, sulT, active
sulphate uptake K02047 6 710 306 0.74 3 16 0 0.00 cysW; sulfate transport system permease protein, sulT, active
sulphate uptake K02045 12 758 323 0.74 6 46 17 0.67 cysA; sulfate transport system ATP-binding protein [EC:3.6.3.25],
sulT, active sulphate uptake K03321 176 5592 3758 1.04 47 2629 1599 0.83 TC.SULP; sulfate permease, SulP family, sulP, passive sulphate
uptake K00958 141 2847 2164 1.07 62 3758 1839 0.84 sat; sulfate adenylyltransferase [EC:2.7.7.4], sat, sulphate to APS K00956 39 1363 78 0.22 9 857 169 0.46 cysN; sulfate adenylyltransferase subunit 1 [EC:2.7.7.4], cysN,
sulphate to APS, ASR K00957 150 3375 368 0.31 36 1251 254 0.47 cysD; sulfate adenylyltransferase subunit 2 [EC:2.7.7.4], cysN,
sulphate to APS, ASR K00955 97 1898 442 0.71 19 274 43 0.46 cysNC; bifunctional enzyme CysN/CysC [EC:2.7.7.4 2.7.1.25],
cysNC, sulphate to PAPS, ASR K00860 99 2438 615 0.64 51 3478 718 0.45 cysC; adenylylsulfate kinase [EC:2.7.1.25], cysC, sulphate to APS,
ASR K00390 163 2974 483 0.62 71 3523 886 0.54 cysH; phosphoadenosine phosphosulfate reductase [EC:1.8.4.8
1.8.4.10], PAPS to sulphite, ASR

116
OL-KR6/125−130 m OL-KR13/405.5−414.5 m KO C A T Q C A T Q Description K00394 97 2504 2668 1.20 34 1365 375 0.47 aprA; adenylylsulfate reductase, subunit A [EC:1.8.99.2], aprAB,
APS to sulphite K00395 43 1305 24880 6.22 14 789 364 0.54 aprB; adenylylsulfate reductase, subunit B [EC:1.8.99.2], aprAB,
APS to sulphite K00392 34 244 0 0.00 11 240 39 0.46 sir; sulfite reductase (ferredoxin) [EC:1.8.7.1], sir, sulphite to
sulphde, ASR K00380 21 954 317 0.58 10 59 60 0.62 cysJ; sulfite reductase (NADPH) flavoprotein alpha-component
[EC:1.8.1.2], cysJI, sulphite to sulphide, ASR K00381 28 984 133 0.42 15 177 61 0.54 cysI; sulfite reductase (NADPH) hemoprotein beta-component
[EC:1.8.1.2], cysJI, sulphite to sulphide, ASR K16950 2 5 0 0.00 1 8 0 0.00 asrA; anaerobic sulfite reductase subunit A, asrABC, sulphite to
sulphide, ASR K16951 6 33 0 0.00 5 29 2 0.25 asrB; anaerobic sulfite reductase subunit B, asrABC, sulphite to
sulphide, ASR K00385 1 4 0 0.00 1 12 4 0.58 asrC; anaerobic sulfite reductase subunit C, asrABC, sulphite to
sulphide, ASR K11180 100 1937 816 0.69 28 1275 576 0.77 dsrA; sulfite reductase alpha subunit [EC:1.8.99.3 1.8.99.5],
dsrAB, sulphite to sulphide, DSR K11181 70 1962 1676 0.99 24 1240 382 0.59 dsrB; sulfite reductase beta subunit [EC:1.8.99.3 1.8.99.5], dsrAB,
sulphite to sulphide, DSR K17218 132 3389 1771 0.83 42 4314 2967 0.94 sqr; sulfide:quinone oxidoreductase [EC:1.8.5.-], sqr, sulphide to
polysulphide K17995 4 25 0 0.00 3 20 0 0.00 hydG; sulfhydrogenase subunit gamma (sulfur reductase)
[EC:1.12.98.4], polysulphide to sulphide K17996 11 65 0 0.00 7 107 78 0.91 hydB; sulfhydrogenase subunit beta (sulfur reductase)
[EC:1.12.98.4], polysulphide to sulphide K17993 32 254 12 0.30 13 251 58 0.50 hydA; sulfhydrogenase subunit alpha [EC:1.12.1.3 1.12.1.5],
polysulphide to sulphide

117
OL-KR6/125−130 m OL-KR13/405.5−414.5 m KO C A T Q C A T Q Description K17994 6 36 0 0.00 2 12 0 0.00 hydD; sulfhydrogenase subunit delta [EC:1.12.1.3 1.12.1.5],
polysulphide to sulphide K16936 1 6 0 0.00
doxA; thiosulfate dehydrogenase [quinone] small subunit [EC:1.8.5.2], thiosulphate to tetrathionate
K16937 8 648 162 0.43 3 20 3 0.43 doxD; thiosulfate dehydrogenase [quinone] large subunit [EC:1.8.5.2], thiosulphate to tetrathionate
K01011 73 3405 1033 0.60 31 2300 2776 1.20 TST, MPST, sseA; thiosulfate/3-mercaptopyruvate sulfurtransferase [EC:2.8.1.1 2.8.1.2], TST also known as rhodanese, 3-mercaptopyruvate to pyruvate and sulphite to thiosulphate
K02439 1 256 20 0.28
glpE; thiosulfate sulfurtransferase [EC:2.8.1.1], glpE also known as rhodanese, thiosulphate to sulphite
K08352 57 1354 333 0.59 16 134 28 0.60 phsA, psrA; thiosulfate reductase / polysulfide reductase chain A, phs, thiosulphate to sulphide
K17222 18 319 57 0.32 4 45 12 0.51 soxA; sulfur-oxidizing protein SoxA, sox, thiosulphate to sulphate K17223 12 297 28 0.29 6 60 18 0.57 soxX; sulfur-oxidizing protein SoxX, sox, thiosulphate to sulphate K17226 31 1123 553 0.88 6 71 9 0.37 soxY; sulfur-oxidizing protein SoxY, sox, thiosulphate to sulphate K17227 24 905 329 0.70 5 57 9 0.44 soxZ; sulfur-oxidizing protein SoxZ, sox, thiosulphate to sulphate K17224 28 400 94 0.34 9 137 17 0.31 soxB; sulfur-oxidizing protein SoxB, sox, thiosulphate to sulphate K17225 11 269 39 0.43 5 29 4 0.42 soxC; sulfane dehydrogenase subunit SoxC, sox, thiosulphate to
sulphate K08738 50 2023 1773 1.28 23 169 14 0.30 CYC; cytochrome c, sox, thiosulphate to sulphate K01738 422 7613 912 0.62 133 3646 6773 1.59 cysK; cysteine synthase A [EC:2.5.1.47], assimilation2 to cysteine K12339 82 1917 554 0.74 38 1236 277 0.42 cysM; cysteine synthase B [EC:2.5.1.47], assimilation2 to cysteine

118

119
APPENDIX I. KEGG PATHWAY MAP 02010
Boxes for each metabolic function have two column charts, the left chart is for the OL-KR6/125−130 m sample and the right chart is for the OL-KR13/405.5−414.5 m sample. Each column chart includes three columns, the first for the DNA adundancy, the second for the RNA abundancy and the last for the relative transcriptional activity.The height and color of each column may have five disctinct values; 0 for ‘no hits’, 1 for ‘gene rare’ (orange), 2 for ‘gene less abundant than average’ (yellow), 3 for ‘gene more abundant than average’ (light green), and 4 for ‘gene highly abundant’ (dark green).

120

121
APPENDIX J. KEGG PATHWAY MAP 00300
Boxes for each metabolic function have two column charts, the left chart is for the OL-KR6/125−130 m sample and the right chart is for the OL-KR13/405.5−414.5 m sample. Each column chart includes three columns, the first for the DNA adundancy, the second for the RNA abundancy and the last for the relative transcriptional activity.The height and color of each column may have five disctinct values; 0 for ‘no hits’, 1 for ‘gene rare’ (orange), 2 for ‘gene less abundant than average’ (yellow), 3 for ‘gene more abundant than average’ (light green), and 4 for ‘gene highly abundant’ (dark green).

122
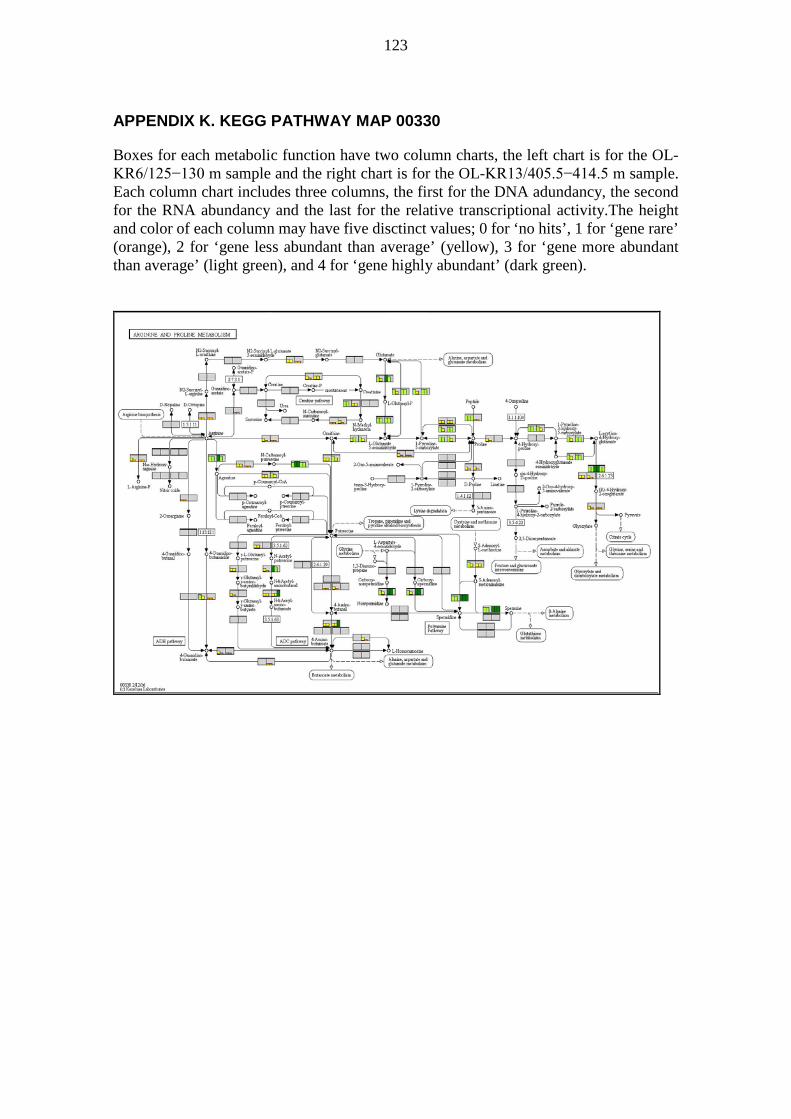
123
APPENDIX K. KEGG PATHWAY MAP 00330
Boxes for each metabolic function have two column charts, the left chart is for the OL-KR6/125−130 m sample and the right chart is for the OL-KR13/405.5−414.5 m sample. Each column chart includes three columns, the first for the DNA adundancy, the second for the RNA abundancy and the last for the relative transcriptional activity.The height and color of each column may have five disctinct values; 0 for ‘no hits’, 1 for ‘gene rare’ (orange), 2 for ‘gene less abundant than average’ (yellow), 3 for ‘gene more abundant than average’ (light green), and 4 for ‘gene highly abundant’ (dark green).

124
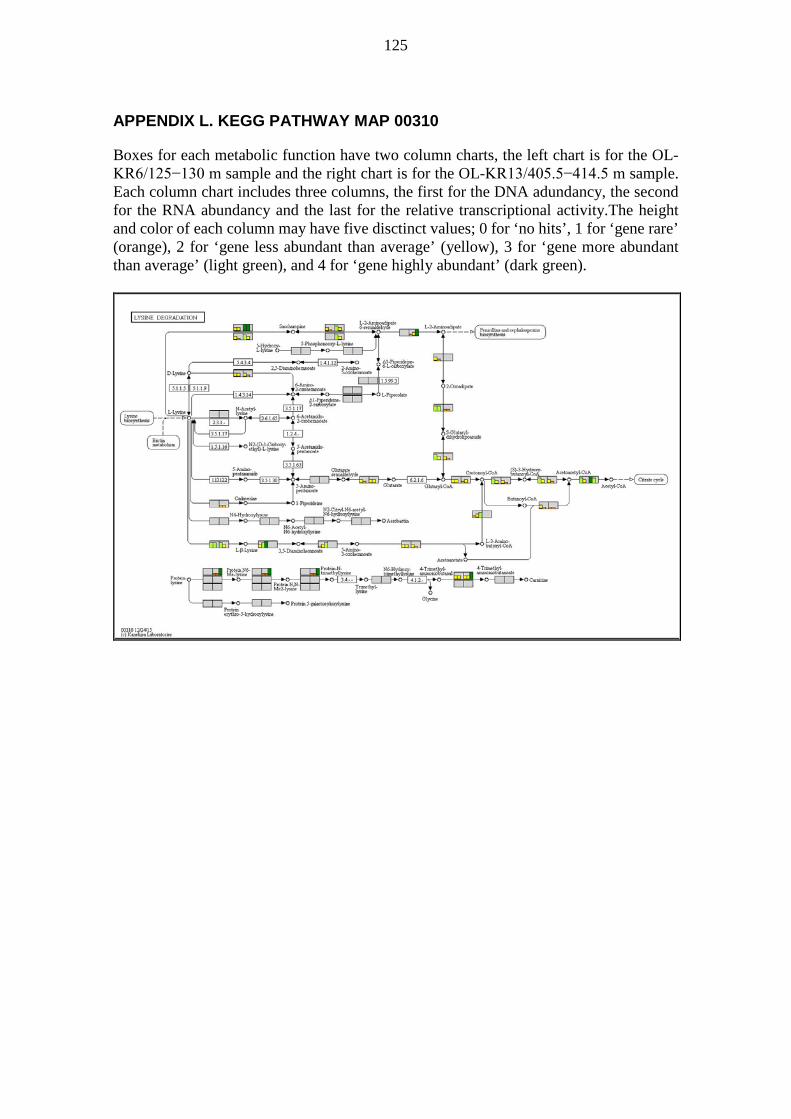
125
APPENDIX L. KEGG PATHWAY MAP 00310
Boxes for each metabolic function have two column charts, the left chart is for the OL-KR6/125−130 m sample and the right chart is for the OL-KR13/405.5−414.5 m sample. Each column chart includes three columns, the first for the DNA adundancy, the second for the RNA abundancy and the last for the relative transcriptional activity.The height and color of each column may have five disctinct values; 0 for ‘no hits’, 1 for ‘gene rare’ (orange), 2 for ‘gene less abundant than average’ (yellow), 3 for ‘gene more abundant than average’ (light green), and 4 for ‘gene highly abundant’ (dark green).

126
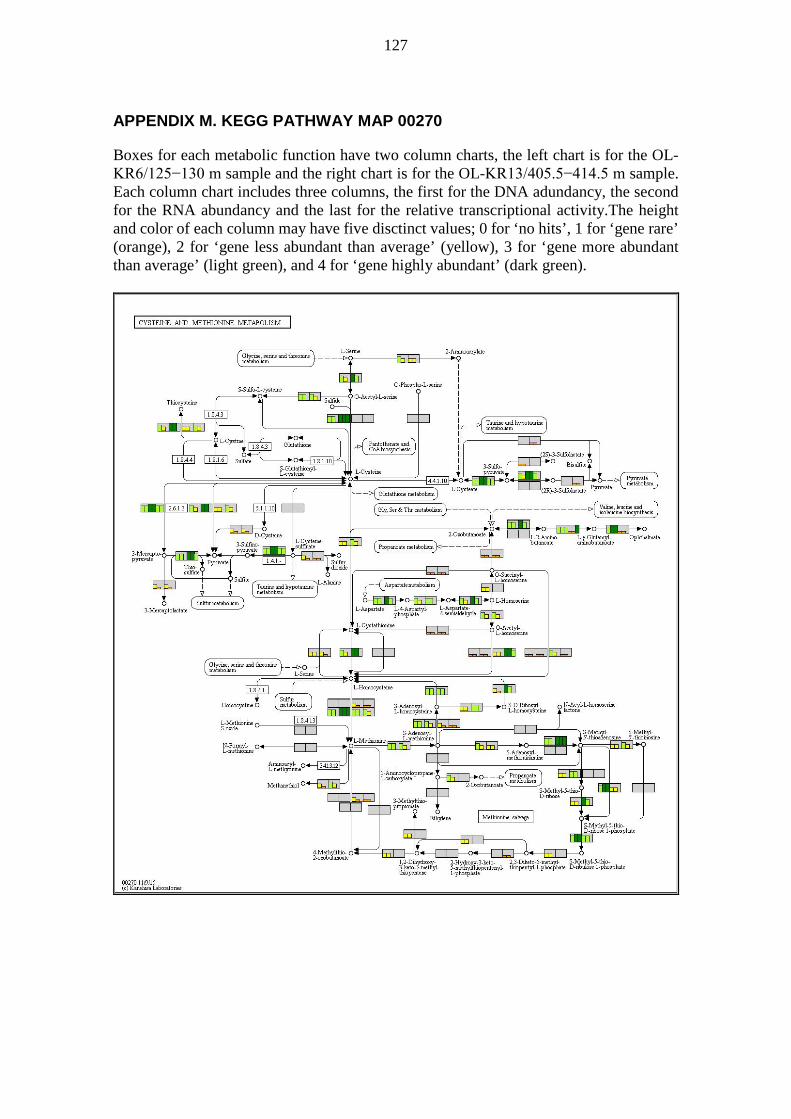
127
APPENDIX M. KEGG PATHWAY MAP 00270
Boxes for each metabolic function have two column charts, the left chart is for the OL-KR6/125−130 m sample and the right chart is for the OL-KR13/405.5−414.5 m sample. Each column chart includes three columns, the first for the DNA adundancy, the second for the RNA abundancy and the last for the relative transcriptional activity.The height and color of each column may have five disctinct values; 0 for ‘no hits’, 1 for ‘gene rare’ (orange), 2 for ‘gene less abundant than average’ (yellow), 3 for ‘gene more abundant than average’ (light green), and 4 for ‘gene highly abundant’ (dark green).

128

129
APPENDIX N. KEGG PATHWAY MAP 00790
Boxes for each metabolic function have two column charts, the left chart is for the OL-KR6/125−130 m sample and the right chart is for the OL-KR13/405.5−414.5 m sample. Each column chart includes three columns, the first for the DNA adundancy, the second for the RNA abundancy and the last for the relative transcriptional activity.The height and color of each column may have five disctinct values; 0 for ‘no hits’, 1 for ‘gene rare’ (orange), 2 for ‘gene less abundant than average’ (yellow), 3 for ‘gene more abundant than average’ (light green), and 4 for ‘gene highly abundant’ (dark green).

130

131
APPENDIX O. KEGG PATHWAY MAP 00020
Boxes for each metabolic function have two column charts, the left chart is for the OL-KR6/125−130 m sample and the right chart is for the OL-KR13/405.5−414.5 m sample. Each column chart includes three columns, the first for the DNA adundancy, the second for the RNA abundancy and the last for the relative transcriptional activity.The height and color of each column may have five disctinct values; 0 for ‘no hits’, 1 for ‘gene rare’ (orange), 2 for ‘gene less abundant than average’ (yellow), 3 for ‘gene more abundant than average’ (light green), and 4 for ‘gene highly abundant’ (dark green).

132

133
APPENDIX P. KEGG PATHWAY MAP 00240
Boxes for each metabolic function have two column charts, the left chart is for the OL-KR6/125−130 m sample and the right chart is for the OL-KR13/405.5−414.5 m sample. Each column chart includes three columns, the first for the DNA adundancy, the second for the RNA abundancy and the last for the relative transcriptional activity.The height and color of each column may have five disctinct values; 0 for ‘no hits’, 1 for ‘gene rare’ (orange), 2 for ‘gene less abundant than average’ (yellow), 3 for ‘gene more abundant than average’ (light green), and 4 for ‘gene highly abundant’ (dark green).

134

135
APPENDIX Q. KEGG PATHWAY MAP 00550
Boxes for each metabolic function have two column charts, the left chart is for the OL-KR6/125−130 m sample and the right chart is for the OL-KR13/405.5−414.5 m sample. Each column chart includes three columns, the first for the DNA adundancy, the second for the RNA abundancy and the last for the relative transcriptional activity.The height and color of each column may have five disctinct values; 0 for ‘no hits’, 1 for ‘gene rare’ (orange), 2 for ‘gene less abundant than average’ (yellow), 3 for ‘gene more abundant than average’ (light green), and 4 for ‘gene highly abundant’ (dark green).

136

137
APPENDIX R. KEGG PATHWAY MAP 00500
Boxes for each metabolic function have two column charts, the left chart is for the OL-KR6/125−130 m sample and the right chart is for the OL-KR13/405.5−414.5 m sample. Each column chart includes three columns, the first for the DNA adundancy, the second for the RNA abundancy and the last for the relative transcriptional activity.The height and color of each column may have five disctinct values; 0 for ‘no hits’, 1 for ‘gene rare’ (orange), 2 for ‘gene less abundant than average’ (yellow), 3 for ‘gene more abundant than average’ (light green), and 4 for ‘gene highly abundant’ (dark green).

138

139
APPENDIX S. KEGG PATHWAY MAP 00540
Boxes for each metabolic function have two column charts, the left chart is for the OL-KR6/125−130 m sample and the right chart is for the OL-KR13/405.5−414.5 m sample. Each column chart includes three columns, the first for the DNA adundancy, the second for the RNA abundancy and the last for the relative transcriptional activity.The height and color of each column may have five disctinct values; 0 for ‘no hits’, 1 for ‘gene rare’ (orange), 2 for ‘gene less abundant than average’ (yellow), 3 for ‘gene more abundant than average’ (light green), and 4 for ‘gene highly abundant’ (dark green).

140

141
APPENDIX T. KEGG PATHWAY MAP 00480
Boxes for each metabolic function have two column charts, the left chart is for the OL-KR6/125−130 m sample and the right chart is for the OL-KR13/405.5−414.5 m sample. Each column chart includes three columns, the first for the DNA adundancy, the second for the RNA abundancy and the last for the relative transcriptional activity.The height and color of each column may have five disctinct values; 0 for ‘no hits’, 1 for ‘gene rare’ (orange), 2 for ‘gene less abundant than average’ (yellow), 3 for ‘gene more abundant than average’ (light green), and 4 for ‘gene highly abundant’ (dark green).

142
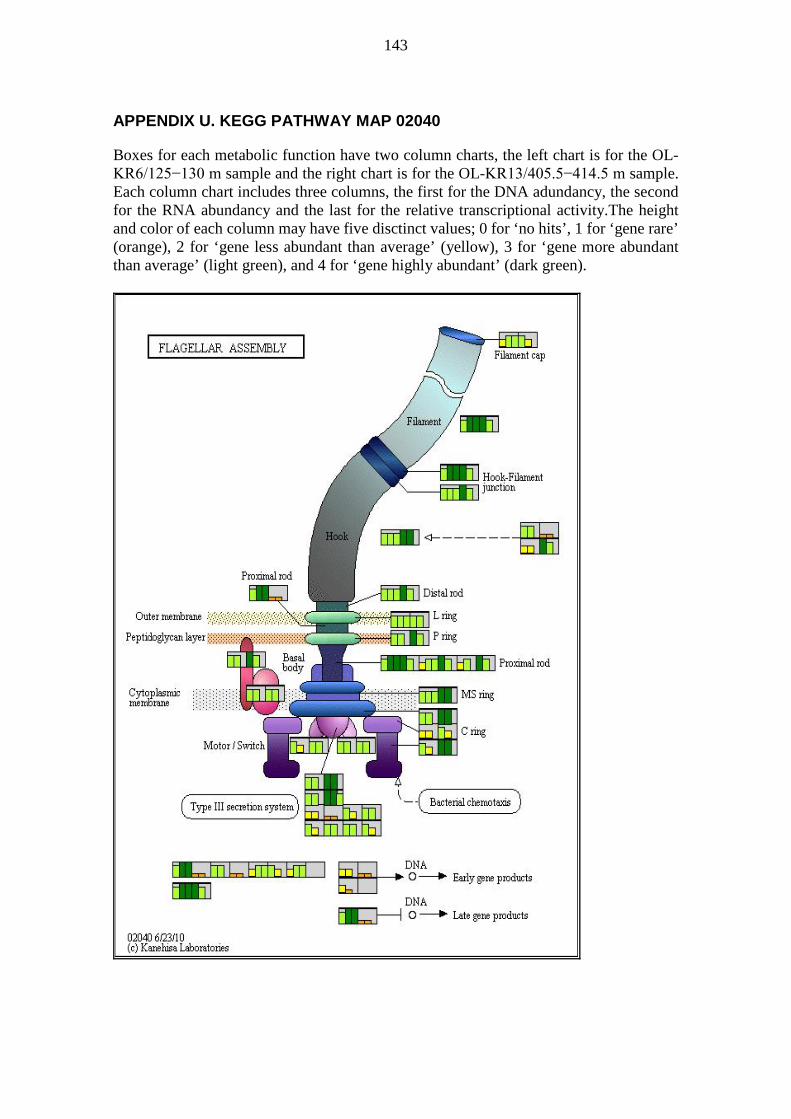
143
APPENDIX U. KEGG PATHWAY MAP 02040
Boxes for each metabolic function have two column charts, the left chart is for the OL-KR6/125−130 m sample and the right chart is for the OL-KR13/405.5−414.5 m sample. Each column chart includes three columns, the first for the DNA adundancy, the second for the RNA abundancy and the last for the relative transcriptional activity.The height and color of each column may have five disctinct values; 0 for ‘no hits’, 1 for ‘gene rare’ (orange), 2 for ‘gene less abundant than average’ (yellow), 3 for ‘gene more abundant than average’ (light green), and 4 for ‘gene highly abundant’ (dark green).

144

145
APPENDIX V. KEGG PATHWAY MAP 02030
Boxes for each metabolic function have two column charts, the left chart is for the OL-KR6/125−130 m sample and the right chart is for the OL-KR13/405.5−414.5 m sample. Each column chart includes three columns, the first for the DNA adundancy, the second for the RNA abundancy and the last for the relative transcriptional activity.The height and color of each column may have five disctinct values; 0 for ‘no hits’, 1 for ‘gene rare’ (orange), 2 for ‘gene less abundant than average’ (yellow), 3 for ‘gene more abundant than average’ (light green), and 4 for ‘gene highly abundant’ (dark green).

146

147
APPENDIX X. KEGG PATHWAY MAP 00633
Boxes for each metabolic function have two column charts, the left chart is for the OL-KR6/125−130 m sample and the right chart is for the OL-KR13/405.5−414.5 m sample. Each column chart includes three columns, the first for the DNA adundancy, the second for the RNA abundancy and the last for the relative transcriptional activity.The height and color of each column may have five disctinct values; 0 for ‘no hits’, 1 for ‘gene rare’ (orange), 2 for ‘gene less abundant than average’ (yellow), 3 for ‘gene more abundant than average’ (light green), and 4 for ‘gene highly abundant’ (dark green).

148
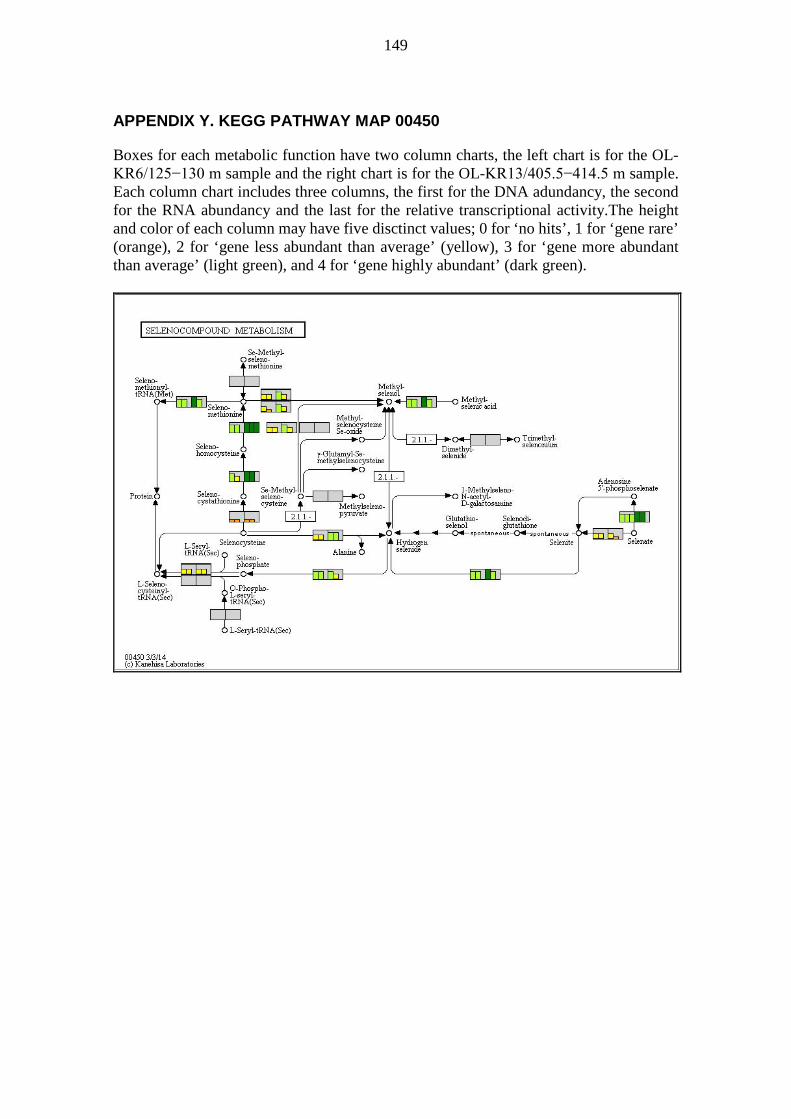
149
APPENDIX Y. KEGG PATHWAY MAP 00450
Boxes for each metabolic function have two column charts, the left chart is for the OL-KR6/125−130 m sample and the right chart is for the OL-KR13/405.5−414.5 m sample. Each column chart includes three columns, the first for the DNA adundancy, the second for the RNA abundancy and the last for the relative transcriptional activity.The height and color of each column may have five disctinct values; 0 for ‘no hits’, 1 for ‘gene rare’ (orange), 2 for ‘gene less abundant than average’ (yellow), 3 for ‘gene more abundant than average’ (light green), and 4 for ‘gene highly abundant’ (dark green).

150


Wo
rk
ing
Re
po
rt 2
01
4-4
4 •
Re
su
lts o
f Mo
nito
ring
at O
lkilu
oto
in 2
01
3 - H
yd
rog
eo
ch
em
istry