metabolic and transcriptional response to a high-fat diet in drosophila melanogaster
TRANSCRIPT

Original article
Metabolic and transcriptional response toa high-fat diet in Drosophila melanogaster%
Erilynn T. Heinrichsen 1,5, Hui Zhang 2, James E. Robinson 4,5, John Ngo 1, Soda Diop 6, Rolf Bodmer 6,William J. Joiner 4,5, Christian M. Metallo 2,*, Gabriel G. Haddad 1,3,5,7,**
ABSTRACT
Obesity has dramatically increased in prevalence, making it essential to understand its accompanying metabolic changes. Modeling diet-inducedobesity in Drosophila melanogaster (fruit flies), we elucidated transcriptional and metabolic changes in w1118
flies on a high-fat diet (HFD). Massspectrometry-based metabolomics revealed altered fatty acid, amino acid, and carbohydrate metabolism with HFD. Microarray analysis uncoveredtranscriptional changes in nitrogen metabolism, including CG9510, homolog of human argininosuccinate lyase (ASL). CG9510 knockdown in fliesphenocopied traits observed with HFD, namely increased triglyceride levels and decreased cold tolerance. Restoration of CG9510 expressionameliorated observed negative consequences of HFD. Metabolomic analysis of CG9510 knockdown flies confirmed functional similarity to ASL,regulating the balance of carbon and nitrogen metabolism. In summary, we found that HFD suppresses CG9510 expression, a gene required forproper triglyceride storage and stress tolerance. These results draw an important link between regulation of amino acid metabolism and theresponse to diet-induced obesity.
& 2013 The Authors. Published by Elsevier GmbH. All rights reserved.
Keywords Argininosuccinate lyase; Lifespan; Metabolism; Obesity; Triglyceride
1. INTRODUCTION
The negative impact of a high-fat diet on the human population isbecoming increasingly evident, with over 60% of the US populationobese or overweight [1], including a growing percentage of children andadolescents [2]. The strain that obesity creates within the bodycontributes to a multitude of diseases, including type 2 diabetes, stroke,sleep apnea, and cardiovascular diseases [1,3]. With a severelyincreased risk of morbidity and mortality in obese adults, as well as apredisposition for adult-onset disease in obese children and adolescents[2,4–7], it is vital to better understand the underlying mechanisticchanges that occur with the onset of obesity.It has been hypothesized that metabolic homeostasis is deranged indisorders associated with obesity, such as insulin resistance anddiabetes. While many of the metabolic regulatory pathways affected inthese disorders, such as AMPK, mTOR, and insulin, have their specificindividual function, they are all interconnected in a larger network toregulate organismal and cellular responses [8]. In order to elucidate themechanisms underlying the response to dietary changes, it is necessary
http://dx.doi.org/10.1016/j.molmet.2013.10.003
Abbreviations: AcCoA, acetyl-coenzyme A; arm-GAL4, armadillo-GAL4; ASL, argininosuccinate lyase; BCAnalysis Systematic Explorer (DAVID analysis); FAME, fatty acid methyl ester; Fdr, false discovery rate; GCchain reaction; RT-PCR, reverse-transcriptase PCR; TBDMS, tert-butyldimethylsilyl; TCA, tricarboxylic acid
%This is an open-access article distributed under the terms of the Creative Commons Attributioreproduction in any medium, provided the original author and source are credited.
1Department of Pediatrics (Division of Respiratory Medicine), University of California, San Diego, 9500 Gilm9500 Gilman Drive, La Jolla, CA 92093, USA 3Department of Neurosciences, University of California, SCalifornia, San Diego, 9500 Gilman Drive, La Jolla, CA 92093, USA 5Biomedical Sciences Graduate Progand Aging Program, NASCR Center, Sanford/Burnham Medical Research Institute, 10901 North Torrey Pi92123, USA
*Correspondence to: 9500 Gilman Drive Mail Code 0412, La Jolla, CA 92093, USA. Tel.: þ1 858 5
**Correspondence to: 9500 Gilman Drive, Mail Code 0735, La Jolla, CA 92093, USA. Tel.: þ1 858
Received October 9, 2013 � Revision received October 16, 2013 � Accepted October 17, 2013 � Av
42 MOLECULAR METABOLISM 3 (2014) 42–54
to look beyond a single metabolic pathway and instead at the interplaybetween fat, carbohydrate, and amino acid metabolism. A clear exampleof this relationship can be found in obesity-related insulin resistance andtype 2 diabetes. Although most investigations of these disorders havefocused on glucose metabolism, increasing evidence suggests that othermetabolic disturbances are at play, including changes in fat and aminoacid metabolism [9,10], which could contribute to the disorders.Given the complexity of the whole-body response to dietary changes,invertebrate model organisms can serve as useful tools to examine theinterplay between genes, signaling pathways, and metabolism [11–14].Regulatory pathways such as insulin/IGF signaling and TOR are highlyconserved and exert significant control over metabolism, includinglipid and glucose homeostasis, in invertebrates just as in mammals[12,15–20].We previously found that a high-fat diet (HFD) had a clearly deleteriousphenotype in Drosophila melanogaster, characterized by increasedtriglyceride and glucose levels, decreased stress tolerance anddecreased lifespan [21]. It has also been shown that a HFD caninduce cardiac fat accumulation and dysfunction in Drosophila [18].
AA, branch chain amino acid; CAFE, capillary feeder; da-GAL4, daughterless-Gal4; EASE, Expression/MS, gas chromatography/mass spectrometry; HFD, high-fat Diet; MeOH, methanol; PCR, polymerase; TG, triglyceride; TMS, trimethylsilyl; VDRC, Vienna Drosophila RNAi Center; w1118, white-1118
n-NonCommercial-ShareAlike License, which permits non-commercial use, distribution, and
an Drive, La Jolla, CA 92093, USA 2Department of Bioengineering, University of California, San Diego,an Diego, 9500 Gilman Drive, La Jolla, CA 92093, USA 4Department of Pharmacology, University ofram, University of California, San Diego, 9500 Gilman Drive, La Jolla, CA 92093, USA 6Developmentnes Road, La Jolla, CA 92037, USA 7Rady Children’s Hospital, 3020 Children’s Way, San Diego, CA
34 8209.
822 4740. Email: [email protected] (C.M. Metallo), [email protected] (G.G. Haddad).
ailable online 23 October 2013
& 2013 The Authors. Published by Elsevier GmbH. All rights reserved. www.molecularmetabolism.com

These phenotypic changes resemble those seen in human obesity[6,7,22,23], strengthening the use of Drosophila as a model system forstudying obesity.In this work, we examined the transcriptional and metabolic responsesto a HFD in our Drosophila model, given that (a) many of the metabolicand signaling pathways involved in fat metabolism and insulin signalingin humans are conserved in flies and (b) Drosophila have many organsystems analogous to humans that control uptake, storage andmetabolism [24–28]. To better understand the molecular changesassociated with HFD, we performed microarray analyses in conjunctionwith mass spectrometry-based metabolomics. We then took advantageof the many genetic tools available in fruit flies, in particular the UAS-GAL4 system, to determine the role of genes associated with thephenotypic and molecular changes we identified. Our data lead us topropose that (a) specific metabolic pathways are altered by HFD, and(b) corresponding key transcriptional changes are occurring in responseto disrupted metabolic homeostasis.
2. MATERIALS AND METHODS
2.1. Fly rearing and collectionAll stocks were maintained on standard cornmeal Drosophila medium inan incubator at 25 1C and 30–50% humidity. Adult flies were collectedat 0–3 days and transferred to a separate vial of the standard cornmealmedium. After aging for 3 more days, male and female flies wereseparated and, to remain consistent with previous work in our lab [21],only the females were transferred to the experimental diets and kept inroom air.
2.2. Drosophila stocksAll UAS-RNAi transgenic lines, as well as their controls w1118 and y,w[1118]; P{attP, y[þ ], w[3′]}, were obtained from the VDRC [8,29]. TheGAL4 driver stocks and P-element (w1118; PBac{PB}CG9510c05706
CG9515c05706) (referred to as CG9510-PBac) were obtained fromBloomington Drosophila Stock Center (Bloomington, IN, USA). Thetransgenic P{CaryP}attP2-UAS9510 (UAS-CG9510) line was created inour lab. To create this line, CG9510 cDNA was subcloned into thepUAST-attB vector from GM20637 (DGRC) using EcoRI and XbaI sitesappended to the PCR product using the following primers: 5′-ATATAGAATTCATGAGCAACTTTTGTTTTAAAGATAAC-3′ and 5′-ATATATC-TAGACTACGACTGTTTGGCCAAATC-3′. Transgenic flies were generatedby injecting embryos carrying P{CaryP}attP2 at 68A4 (Rainbow Trans-genic Flies, Inc).
2.3. Experimental diets: regular and high-fatJazz Mix Drosophila food from New Horizon Foods was prepared asdirected and placed in plastic vials as the regular diet (RD). The high-fatdiet (HFD) was based on a recipe developed by Dr. Sean Oldham at theSanford/Burnham Institute, adding coconut oil to the regular food as asource for increased saturated fat in the diet [18]. The recipe has beenspecialized for the current model, with coconut oil added in the amountof 20% weight per volume in the HFD (approximately 70% calories fromfat) [21].
2.4. Metabolite extraction and GC/MS analysisMetabolite extraction, derivatization and analysis are described in detailin the Supporting Information. Briefly, female flies were kept on RD orHFD for one week, after which groups of 5 flies were placed in 2 mlceramic bead tubes (1.4 mm, MoBio 13113-50) and weighed.
MOLECULAR METABOLISM 3 (2014) 42–54 & 2013 The Authors. Published by Elsevier GmbH. All rig
Immediately �80 1C 9:1 methanol water mixture (MeOH, Cat#34860, Sigma-Aldrich) was added and the tube was placed in a coolingbath of dry ice and isopropanol (approximately �78 1C) [30]. Flies werehomogenized, transferred to an eppendorf tube and mixed with ice coldwater. To separate polar and non-polar phases, ice-cold chloroform wasadded and the tube was vortexed and centrifuged at room temperature.For analysis of general free polar metabolites and uric acid, two aliquotsof the aqueous phase were transferred to the gas chromatography/massspectrometry (GC/MS) sampler tube for evaporation in a refrigeratedvacuum centrifuge. For analysis of total fatty acids, the aliquot of theorganic phase containing the non-polar fraction was collected in theeppendorf tube and evaporated under airflow at room temperature. Forderivatization of polar metabolites, dried polar metabolite aliquots weredissolved in 2% methoxyamine hydrochloride in pyridine and incubatedat 37 1C. Subsequent conversion to their tert-butyldimethylsilyl(TBDMS) and trimethylsilyl (TMS) derivatives was accomplished byadding N-methyl-N-(tert-butyldimethylsilyl) trifluoroacetamideþ1% tert-butyldimethylchlorosilane or N-Methyl-N-(trimethylsilyl) trifluoroaceta-mide and incubating at 37 1C. Fatty acid methyl esters were generatedby dissolving dried fatty acid aliquots in 2% (v/v) methanolic sulfuric acidand subsequently extracted in hexane with saturated NaCl.GC/MS analysis was performed using an Agilent 7890A with a 30 m DB-35MS capillary column (Agilent Technologies) connected to an Agilent5975C MS. For quantification of metabolites, selected ion fragmentswere integrated using a MATLAB-based in-house algorithm [31–33].Additional ions are listed in Supporting Information. The relativequantification of total fly metabolites was determined by normalizingto the intensity of the added internal standards during extraction andmeasured fly body weights.
2.5. Oxygen consumptionOxygen consumption rates in normoxia were measured as previouslydescribed [34], with some modifications. Adult female flies were placedon either RD or HFD on Day 1 after eclosion and remained on their dietfor 7 days. On the final day, flies were transferred to a 5 ml vial ingroups of 150 flies per oxygen consumption measurement. After 20 minof acclimation, the testing vial was sealed and oxygen levels weremonitored over 35-60 minutes. Following measurements, flies werefrozen and weighed.
2.6. Microarrays and data analysisGeneChipH Drosophila Genome 2.0 Arrays (Affymetrix, Santa Clara, CA)were used in this study, with three arrays per diet group (w1118 on RDand HFD). Following one week on RD or HFD, flies were homogenizedand total RNA was extracted from each sample using Trizol (Invitrogen,Carlsbad, CA) followed by purification with RNeasy Kit (Qiagen, Carlsbad,CA) as per manufacturer's instructions. Hybridization of the RNA to theAffymetrix GeneChipsH, washing and scanning were done according toprotocols recommended by Affymetrix using an Affymetrix GeneChipfluidic station and scanner (Affymetrix, Santa Clara, CA). The raw datawere normalized using Bioconductor Affy software (www.bioconductor.org/packages/2.0/bioc/html/affy.html), followed by analysis of thenormalized data for each array spot with VAMPIRE microarray suite[35]. A spot was considered differentially expressed between twosamples when the threshold of false discovery rate (fdr) was smallerthan 0.05. Significance limits were set at changes of 1.5-fold (forup-regulated genes) and 0.67-fold (for down-regulated genes).Further analysis was done with genes at or above 72.0-fold change.DAVID Bioinformatics software was used to identify genes involved insignificantly affected KEGG pathways and functional clusters, as
hts reserved. www.molecularmetabolism.com 43

Original article
determined by the EASE (Expression Analysis Systematic Explorer)analysis implemented in DAVID functional annotation tool (http://david.niaid.nih.gov/david/ease.htm) [36,37]. The microarray analysis data fromthis publication have been submitted to the Gene Expression Ominibusdatabase at http://www.ncbi.nlm.nih.gov/geo and assigned the accessnumber GSE46358.
2.7. Quantitative real-time PCR analysisFollowing one week on RD or HFD, flies were homogenized and totalRNA was extracted using Trizol (Invitrogen, Carlsbad, CA), followed bypurification with the RNeasy kit (Qiagen, Carlsbad, CA) as permanufacturer's instructions. cDNA was produced from total RNA throughRT-PCR using Superscript III First-Strand Synthesis system (Invitrogen,Carlsbad, CA). Real-time PCR was performed using a GeneAmp 7500sequence detection system using POWER SYBR Green chemistry(Applied Biosystems, Foster City, CA). Two primers used were usedfor CG9510: CG9510-A (fwd: GAAGATTCTACCCGGTGACG; rev: GAC-CACCTGGTCATTTCTGC); and CG9510-B (fwd: ATCCATCATGACCCA-GATCC; rev: TAGAGGCGAGAATCGTAGGG) [38]. The expression level ofactin was used as an internal control to normalize the results (fwd:CTAACCTCGCCCTCTCCTCT; rev: GCAGCCAAGTGTGAGTGTGT). The foldchange was calculated relative to the expression level of the respectivecontrol (w1118 or the progeny of w1118 crossed with the UAS-RNAi orUAS-CG9510) on RD.
2.8. Triglyceride, protein and glucose measurementsAfter one week in a specific oxygen condition, flies were collected ingroups of five female flies and placed in 1.5 ml microcentrifuge tubes.Their live weight was determined and the flies were frozen on dry ice.They were then homogenized using Precelly's 24 homogenizer andprepared as described in Grönke 2003 [39] to measure absolutetriglyceride levels using the Thermo Infinity Triglyceride kit and proteinlevels using Pierce BCA protein assay. Whole-body total glucose wasdetermined as described in Birse 2010 [18]. Groups of five female flieswere homogenized in 500 ml 100 mM PIPES buffer (Sigma P6757) with1.25 ml porcine kidney trehalase (Sigma T8778), allowing for measure-ment of total available glucose by hydrolyzing trehalose into glucose.The homogenates were incubated at 37 1C for 1 h and the supernatantstransferred to a 96-well plate in triplicate. Glucose levels were quantifiedusing the Glucose GO assay kit (Sigma-Aldrich, Saint Louis, MO)according to the manufacturer's instructions. In brief, glucose is oxidizedto gluconic acid and hydrogen peroxide by glucose oxidase. Thehydrogen peroxide then reacts with o-dianisidine in the presence ofperoxide to form a colored product, and the oxidized o-dianisidine reactswith sulfuric acid to form a more stable colored product. The intensity ofthe color is proportional to the original glucose concentration and wasmeasured at 520 nm using a BioTek Synergy HT microplate reader.
2.9. Capillary feeder (CAFE) assayFlies were placed on RD for 4 days. Following that time, groups of 5 flieswere placed in a plastic vial with only a piece of filter paper containing500 μl water. Through the top plug, a capillary tube was insertedcontaining 5 μl liquid food (5% yeast, 5% sucrose) as described in Jaet al. [40]. The capillary tube was removed every 24 h and replaced witha new capillary tube containing 5 μl of food. The flies were allowed toadjust to the new setup for the initial 24 h, after which measurementswere taken each time the capillary was removed, measuring thedifference in level of food (in mm). Knowing the initial height (in mm) ofthe 5 μl, the calculated μl/mm could be multiplied by the change in foodlevel to determine how much food (in μl) was consumed.
44 MOLECULAR METABOLISM 3 (2014) 42–54
2.10. Cold stress toleranceThe cold tolerance assay was performed immediately following a weekon RD or HFD. A �5 1C bath was made using water, ice and salt. Foreach group, sets of 10 female flies were placed in empty plastic vialsand into the water bath. Flies fell unconscious almost immediately andvials were checked to make sure all flies were at the bottom and thussubmerged in the cold bath. They remained as such for 2 h, with thetemperature being checked regularly throughout. At the end of the 2 h,vials were removed from the water bath, and flies transferred to RD andleft to recover at room temperature. After 24 h, survival was recorded asthe number of flies that had regained consciousness.
2.11. LifespanFemale adult flies were placed on RD or HFD, with 10 flies per vial offood. The lifespan of the flies on each diet was observed by recordingthe number of flies alive each day. Flies were transferred to fresh RD orHFD food every 3–4 days. The experiment was concluded when therewere no flies remaining in a group or when one group was below 50%survival and there was a clear difference between groups.
2.12. Semi-intact Drosophila heart preparation and digital high-speedmovie analysisAll the dissection steps were done in artificial hemolymph containing108 mM NaCl2, 5 mM KCl, 2 mM CaCl2, 8 mM MgCl2, 1 mM NaH2PO4,4 mM NaHCO3, 15 mM HEPES, 10 mM Sucrose, 5 mM trehalose, at pH7.1 [41]. The flies were anesthetized with fly-nap, followed by transferto a Petri dish coated with Vaseline for dissection [42]. After thedissection, the submerged hearts were oxygenated for 15 min at roomtemperature for equilibration. Next, the dish chamber is installed on aLeica DM-LFSA microscope with a 10� water immersion lens. Thedigital high-speed movies of the heartbeats are acquired using aHamamatsu EM-CCD digital high-speed camera and HCI image capturesoftware (Compix Imaging System). Movie analysis of the heart activityis then carried out according to previous reports [41,43].
2.13. Statistical analysisGraphpad Prism was used for statistical analysis. A t-test was used todetermine significance between RD and HFD results in most assays. Inlifespan measurement, the significance was determined by comparingthe survival curves with a log-rank (Mantel–Cox) test. A chi (χ) squaretest was used in analyzing heart dysfunction.
3. RESULTS
3.1. Metabolomic analysis of flies on HFDWe previously showed that adult female flies fed a HFD exhibit increasedtriglyceride levels and decreased stress tolerance relative to theircounterparts on RD [21]. In this work we explored the underlyingchanges in metabolism occurring in these flies, using mass spectro-metry to analyze the relative abundance of metabolites in control (w1118)flies on RD compared to genetically identical flies on a HFD. HFDsignificantly increased (1.2–2.7-fold of normal) total fatty acid abun-dance, including myristate, palmitate, oleate and stearate (Figure 1A).Flies on a HFD had altered carbohydrate metabolism, as evidenced bydramatically increased lactate (20-fold of normal) and pyruvate (2.8-foldof normal) levels. Amino acid metabolism was also affected by HFD,with an increase in both urea and uric acid abundance and an overalldecrease in many amino acids (Figure 1B and C). Additionally, weobserved slight decreases in some tricarboxylic acid (TCA) metabolites,
& 2013 The Authors. Published by Elsevier GmbH. All rights reserved. www.molecularmetabolism.com

Figure 1: Increased fatty acids and altered carbohydrate and amino acid metabolism due to HFD. Adult female w1118 flies were put on RD or HFD for one week prior to metabolite extraction withwhole-body homogenate and GC/MS analysis. Shown is the relative abundance of (A) fatty acids, (B) organic acids and (C) amino acids in flies on RD and HFD, normalized to body weight anddivided by the average metabolite abundance in the RD flies. For metabolites with multiple fragments available, consistent changes were observed in each and one fragment was selected torepresent the metabolite. Three sets of five female flies were analyzed for each diet condition. Error bars indicate standard error. Significance between relative abundance values of the HFD and RDgroups for each metabolite was determined with a t-test, *¼p o0.05 **¼po0.01 ***¼p o0.001 ****¼p o0.0001.
including fumarate, alpha-ketoglutarate, and malate, though individuallynone of these changes was statistically significant. As seen in other HFDmodels [44–46], the overall metabolic rate of flies on a HFD wassignificantly increased, with a 1.4-fold increase in oxygen consumptionin flies on a HFD compared to RD (Figure S1).
3.2. Transcriptional changes in flies on HFDThe correlation between HFD and amino acid metabolism was also seenat a transcriptional level. When we performed a microarray of whole flieson either RD or HFD, flies on HFD altered the expression of 1327 genes(1030 up, 297 down), with 381 genes (273 up, 108 down) chan-gingZ two-fold (Figure 2A, Supplementary Dataset). Using specificcriteria intended to sort out genes with a potentially higher likelihood ofimpacting the phenotype, the initial list of genes was narrowed down to33 candidate genes. These criteria selected genes (a) within the groupof 381 genes with a Z two-fold change in gene expression and (b) thatare part of a statistically significant pathway or functional cluster asdetermined with DAVID bioinformatics software [36,37]. The functionalclusters with the highest biological significance ranking contained gene-
MOLECULAR METABOLISM 3 (2014) 42–54 & 2013 The Authors. Published by Elsevier GmbH. All rig
annotation groups that included extracellular region or secretion,immune response, carbohydrate binding, and ion transport(Figure 2B). Significantly affected pathways were those involved in themetabolism of amino acids, metabolism of glycerophospholipids, andbreakdown of sugars and waste products (Figure 2C).To further understand the roles of these candidate genes in metabolichomeostasis, we evaluated the phenotypes of flies following RNAiknockdown by the ubiquitously expressed daughterless (da)–GAL4 orarmadillo (arm)–GAL4 drivers (Table I). This approach allowed us to testwhether the changes in gene expression we observed by microarraywere necessary for or merely correlated with the HFD phenotype(Figure 3A). We previously established that cold tolerance wasconsistently and dramatically decreased in flies on HFD, making it aclear phenotype to evaluate in the transgenic flies [21]. Thus, the sameassay was used in the present study to test sensitivity to cold. After thetransgenic flies had been on their respective diets for one week, theywere stressed with severe cold and their survival compared to controlflies on the same diet (Figure 3B and C). As expected, most control flieson RD were able to survive the cold stress (65%), while only 9% of
hts reserved. www.molecularmetabolism.com 45

Figure 2: Gene expression changes in Drosophila on HFD compared to RD. Adult female w1118 flies (d3-5) were placed on RD or HFD for one week prior to microarray analysis. (A) Distribution offold-changes of gene expression in Drosophila on a HFD (vs. RD). (B and C) Analysis of genes with at least 2-fold change in expression due to HFD was done with DAVID bioinformatics software[36,37] to show statistically significant functional clusters and KEGG pathways. (B) Functional clusters of gene-annotation groups involved in extracellular region or secretion, immune response,carbohydrate binding, and ion transport had the highest biological significance ranking, as determined using the EASE score in DAVID. (C) For enriched KEGG pathways, P-values are shown on y-axison a log scale, and the number of genes significantly changed within the pathway is listed in parenthesis at the top of each bar. Pathways and p-values from DAVID: dme00511: Other glycandegradation (po0.0001), dme04142: Lysosome (po0.01), dme00260: Glycine, serine and threonine metabolism (po0.05), dme00564: Glycerophospholipid metabolism (po0.05),dme00250: Alanine, aspartate and glutamate metabolism (po0.05).
Original article
those on HFD survived (Figure 3B and C). This effect suggests thatchanges have occurred in flies on a HFD that prevent them fromactivating mechanisms necessary for recovery from a severe stress. Wethen tested the roles of specific genes in cold stress caused by HFD.RNAi knockdown or mutation of two different genes on RD reducedsurvival, even on RD, indicating that down-regulating those candidategenes act like HFD to impair the cold stress response (Figure 3B). Incontrast, knockdown of four genes increased survival compared tocontrols on HFD. Down-regulating these genes thus render flies moreresistant to cold stress on HFD (Figure 3C). Based on these results, atleast six candidate genes may be required for the effects of HFD onsensitivity to cold stress. These genes are CG9510, CG6806, CG18108,CG32356, CG5873, and CG1934.Triglyceride (TG) levels are also strikingly affected by HFD. Indeed,control flies on RD store an average of 47.6713.2 μg/mg bodyweightcompared to 77.978.6 μg/mg bodyweight in flies on HFD. Todetermine if the six candidate genes that modulate sensitivity to coldstress induced by HFD also regulate TG levels, these genes wereknocked down and TGs measured in animals on RD or HFD (Figure 3Dand E). We found that knockdown of CG9510 caused triglyceride levelsto increase (Figures 3D and S2). CG9510 is involved in argininebiosynthesis and was down-regulated 2.3 fold by HFD. Importantly,ubiquitous knockdown using two RNAi lines as well as an apparent loss-of-function P-element mutation in CG9510 (Figure S3) increasedsensitivity to cold stress and increased TG levels in response to HFD.This relation could not be accounted for by an increase in foodconsumption in the knockdown and mutant animals (Figure S4). Ourdata thus suggests that increased TG levels and sensitivity to cold stressshare underlying genetic mechanisms.
3.3. Characterization of CG9510 in HFD phenotypeGiven the results of the metabolomic analysis and the affected pathwaysuncovered by our microarray studies, we decided to pursue the relation
46 MOLECULAR METABOLISM 3 (2014) 42–54
between amino acid metabolism and HFD by further characterizing thefunction of CG9510. We took advantage of tissue-specific GAL4 driversto knockdown expression of CG9510 in various cell types, includingseveral classes of neurons, glia, muscle, fat body, imaginal discs andmalpighian tubules. In most tissues examined, knockdown of CG9510led to increased cold sensitivity and increased TG levels, with thestrongest effect seen when knockdown occurred in dopaminergic andserotonergic neurons (Figure 4). Since similar effects were obtained byknockdown in any of various tissues, we believe CG9510 is requiredsystemically for metabolic homeostasis. Knockdown of CG9510 did notphenocopy HFD in all respects, however, since glucose levels wereelevated only by HFD (Figure S5).Since down-regulation of CG9510 increases TG levels of RD flies, weasked whether up-regulation of CG9510 could restore normal TG levelsof flies on a HFD and improve their stress tolerance. To address thisquestion, we made a transgenic line with CG9510 under UAS control.When crossed to animals bearing ubiquitously expressing da-GAL4, thisline produced progeny in which CG9510 expression was elevated nearly10-fold compared to controls (Figure S3). Importantly, ubiquitousexpression of UAS-CG9510 under da-GAL4 control restored normalRD-like cold tolerance and TG levels to animals on HFD (Figure 5Aand B).CG9510 is unusual in that it is dicistronically transcribed with anothergene, CG9515. To confirm that CG9510 expression is sufficient torescue the observed phenotypes of flies on HFD, we rescued similarphenotypes observed in a mutant in which a transposon disrupted theCG9510/CG9515 transcriptional unit. This mutant, which we refer to asCG9510-PBac, showed increased survival after cold stress whenCG9510 expression was elevated under UAS/da-GAL4 control(Figure 5C). da-GAL4 driven expression of CG9510 also reduced mutantTG levels to those of controls (Figure 5D). These data demonstrate thatCG9510 is necessary and sufficient for normal sensitivity to cold stressand TG levels, which are perturbed during HFD.
& 2013 The Authors. Published by Elsevier GmbH. All rights reserved. www.molecularmetabolism.com
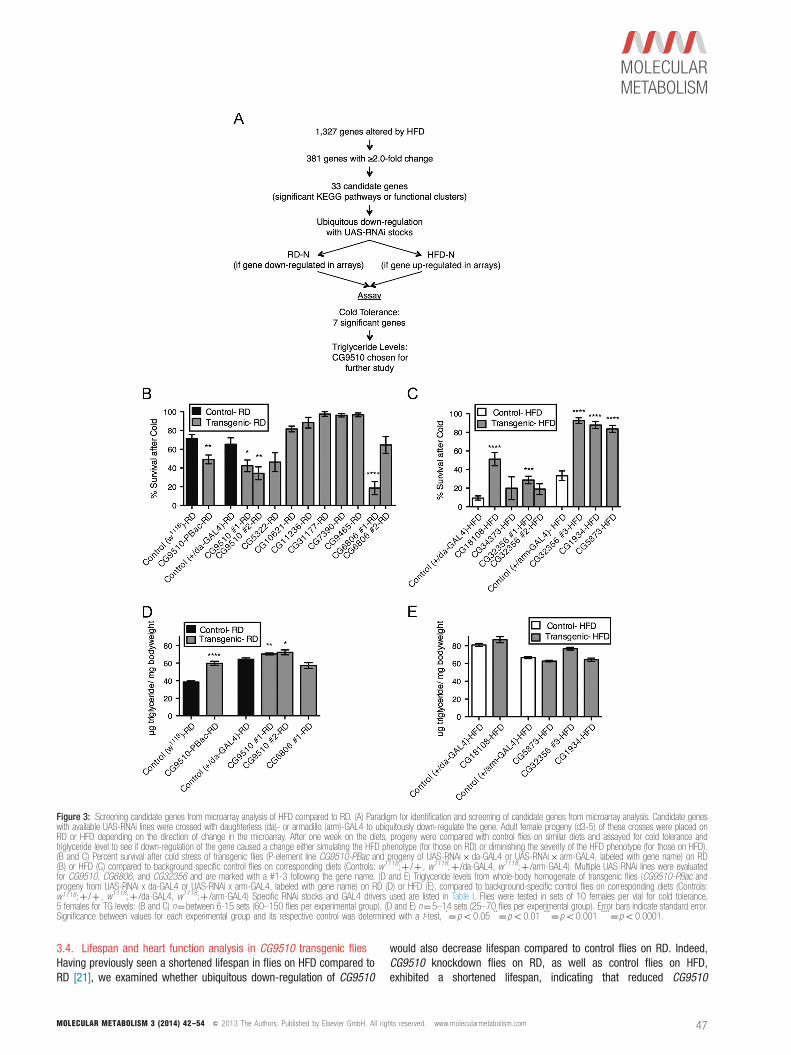
Figure 3: Screening candidate genes from microarray analysis of HFD compared to RD. (A) Paradigm for identification and screening of candidate genes from microarray analysis. Candidate geneswith available UAS-RNAi lines were crossed with daughterless (da)- or armadillo (arm)-GAL4 to ubiquitously down-regulate the gene. Adult female progeny (d3-5) of these crosses were placed onRD or HFD depending on the direction of change in the microarray. After one week on the diets, progeny were compared with control flies on similar diets and assayed for cold tolerance andtriglyceride level to see if down-regulation of the gene caused a change either simulating the HFD phenotype (for those on RD) or diminishing the severity of the HFD phenotype (for those on HFD).(B and C) Percent survival after cold stress of transgenic flies (P-element line CG9510-PBac and progeny of UAS-RNAi� da-GAL4 or UAS-RNAi� arm-GAL4, labeled with gene name) on RD(B) or HFD (C) compared to background-specific control flies on corresponding diets (Controls: w1118;þ /þ , w1118;þ /da-GAL4, w1118;þ /arm-GAL4). Multiple UAS-RNAi lines were evaluatedfor CG9510, CG6806, and CG32356 and are marked with a #1-3 following the gene name. (D and E) Triglyceride levels from whole-body homogenate of transgenic flies (CG9510-PBac andprogeny from UAS-RNAi x da-GAL4 or UAS-RNAi x arm-GAL4, labeled with gene name) on RD (D) or HFD (E), compared to background-specific control flies on corresponding diets (Controls:w1118;þ /þ , w1118;þ /da-GAL4, w1118;þ /arm-GAL4) Specific RNAi stocks and GAL4 drivers used are listed in Table I. Flies were tested in sets of 10 females per vial for cold tolerance,5 females for TG levels: (B and C) n¼between 6-15 sets (60–150 flies per experimental group), (D and E) n¼5–14 sets (25–70 flies per experimental group). Error bars indicate standard error.Significance between values for each experimental group and its respective control was determined with a t-test, *¼po0.05 **¼po0.01 ***¼po0.001 ****¼po0.0001.
3.4. Lifespan and heart function analysis in CG9510 transgenic fliesHaving previously seen a shortened lifespan in flies on HFD compared toRD [21], we examined whether ubiquitous down-regulation of CG9510
MOLECULAR METABOLISM 3 (2014) 42–54 & 2013 The Authors. Published by Elsevier GmbH. All rig
would also decrease lifespan compared to control flies on RD. Indeed,CG9510 knockdown flies on RD, as well as control flies on HFD,exhibited a shortened lifespan, indicating that reduced CG9510
hts reserved. www.molecularmetabolism.com 47

Figure 4: Down-regulating CG9510 in various tissues simulates HFD phenotype. Adult female progeny (d3-5) from crosses between the UAS-RNAi line (CG9510 #1) and various GAL4 drivers, aswell as control progeny from a w1118� CG9510 UAS-RNAi cross (þ /RNAi) were put on RD for one week prior to the assay. (A) Percent survival after cold stress (2 h at �51, with 24 h recoveryin room air) and (B) triglyceride levels (per mg of bodyweight) from whole-body homogenate of flies with CG9510 down-regulated in specific tissues were compared to control values. Tissuesaffected by GAL4 drivers included: neurons (elav-GAL4), dopaminergic and serotonergic neurons (Ddc-GAL4), neurons of the dorsal protocerebrum, mushroom body and fan-shaped body (c061-GAL4), mushroom body (Tab2-GAL4), glia (repo-GAL4), imaginal discs (c601-GAL4), malpighian tubules and hindgut (c591-GAL4), muscles (24B-GAL4) or fat body (lsp2-GAL4). Flies weretested in sets of 10 females per vial for cold tolerance, 5 females for TG levels: (A) n¼5–12 sets (50–120 flies per experimental group), (B) n¼6–10 sets (30–50 flies per experimental group).Error bars indicate standard error. Significance between values for each experimental group and control was determined with a t-test, *¼po0.05 ***¼po0.001 ****¼po0.0001.
Original article
expression possibly affects lifespan in a similar fashion as HFD, althoughnot as severely (Figure 6A). It is important to note that each differenttransgenic line is tested against controls specific to its geneticbackground, so while there is some variation between controls indifferent experiments, within each experiment the control is geneticallyspecific to the transgenic line.HFD has been previously shown to lead to heart dysfunction in flies [18].Therefore, we asked whether down-regulation of CG9510 associatedwith HFD could cause this phenotype. After one week of HFD using a20% coconut oil-supplemented diet, we found that control animals hadslightly constricted heart tubes, although not statistically significant(Figure 6B). This phenotype is qualitatively similar to what was observedby Birse et al. (2010), though our data show less of an effect of HFD,probably because we used 30% less coconut oil. However, homozygousCG9510-PBac flies on RD also showed a more dramatically decreaseddiastolic diameter (Figure 6B). Previously, it was shown that 30% HFDdisrupts heart function in other ways as well, including causing non-contractile heart regions, dysfunctional ostia, and asynchronous beatingpattern between anterior and posterior regions [18,47,48]. The 20%HFD regime used here also produces some of these heart phenotypes,but to a lesser extent (Figure 6C). Interestingly, with regard to thediastolic diameter phenotype, CG9510-PBac homozygotes again showedsimilar but more pronounced heart defects than flies on 20% HFD,consistent with more extreme cardiac dysfunction observed at 30% HFD[18]. These findings demonstrate that reduced function of CG9510causes systemic TG accumulation and associated heart dysfunction likecontrol flies on a HFD, thus implicating the CG9510 gene in metabolichomeostasis and heart function.
3.5. Role of CG9510 in Drosophila metabolismWhile relatively uncharacterized in Drosophila, CG9510 has sequencehomology with the human gene argininosuccinate lyase, or ASL, whichis involved in amino acid metabolism as part of the urea cycle. ASL liesat the junction of the urea and aspartate-argininosuccinate shuntof the tricarboxylic acid (TCA) cycle, catalyzing the breakdown of
48 MOLECULAR METABOLISM 3 (2014) 42–54
argininosuccinate into arginine and fumarate. To verify the importance ofthis pathway in the HFD phenotype, we evaluated flies in which CG1315expression was knocked down. This gene is homologous to humanargininosuccinate synthase, which lies immediately upstream of ASL inthe arginine biosynthesis pathway, and is responsible for catalyzing thesynthesis of argininosuccinate from citrulline and aspartate (Figure 7A).When CG1315 expression was ubiquitously knocked down, the flies hadsignificantly decreased cold tolerance and increased TG levels comparedto controls (Figure 7B and C). These results provide independentevidence that modulation of this pathway through a separate enzymegenerates a similar phenotypic response/adaptation to HFD.In mammals, ASL functions at a key intersection between carbon andnitrogen metabolism. We used mass spectrometry to characterize therole of CG9510 in Drosophila metabolism. Reducing CG9510 expressionled to an overall increase in fatty acid abundance even though the fliesate an RD (Figure 8A), with no change in the glycolytic metabolitespyruvate and lactate (Figure 8B). These results support our findings thatCG9510 is required for normal low TG levels (Figure 3) but not forglucose levels (Figure S5). In addition, flies with reduced CG9510showed a drastic decrease in the whole-body relative abundance ofurea, alpha-ketoglutarate and citrate, as well as increased aspartate(Figure 8B and C), but an unchanged pool of remaining free amino acids(Figure 8C). Importantly, uric acid levels were significantly increased,consistent with the observed deficiency in urea production and need foran alternate route for nitrogen disposal (Figure 8B). Given the observedalterations in nitrogen metabolism and citric acid cycle intermediates,these data confirm that CG9510 has a similar role to human ASL inbalancing carbon and nitrogen metabolism.In summary, we found that the effects of a HFD on Drosophila extendbeyond lipid metabolism, perturbing the balance of amino acid andcarbohydrate metabolism. In metabolomic studies, flies on a HFDhave increased fatty acid, glycolytic metabolites and urea abundance,and decreased free amino acid levels. Our microarray analysis allowedus to identify a critical gene, CG9510, associated with amino acidmetabolism that is involved in response to HFD. Reducing CG9510 led to
& 2013 The Authors. Published by Elsevier GmbH. All rights reserved. www.molecularmetabolism.com

Figure 5: Up-regulation of CG9510 increases cold tolerance, decreases stored triglyceride levels. (A) Survival following cold stress was counted for flies with up-regulated CG9510 (;da-GAL4/UAS-CG9510) and control flies (w1118;þ /UAS-CG9510) after one week on RD or HFD. (B) Triglyceride (TG) levels (per mg of bodyweight) were determined in whole-body homogenate of flieswith up-regulated CG9510 expression compared to control. Adult female flies (d3-5) from the GAL4-control cross (w1118;þ /da-GAL4) or UAS-control cross (w1118;þ /UAS-CG9510) wereplaced on RD and progeny from the experimental cross (;UAS-CG9510/da-GAL4) were placed either RD or HFD for one week prior to the assay. (C and D) Transgenic flies with rescued CG9510expression (;P/P;UAS-CG9510/da-GAL4, where “P”¼CG9510-PBac) and their controls (;P/P;þ /UAS-CG9510 and;P/P;þ /da-GAL4) were assayed for cold tolerance (C) and TG levels in whole-body homogenate (D) after one week on RD. Flies were tested in sets of 10 females per vial for cold tolerance, 5 females for TG levels: (A) n¼6 sets (60 flies per group), (B) n¼15–20 sets(75–100 flies per group), (C) n¼4 sets (40 flies per group), (D) n¼9–16 sets (45–80 flies per group). Error bars indicate standard error. Significance between values for the experimental groupand control was determined with a t-test, *¼po0.05 **¼po0.01 ***¼po0.01 ****¼po0.0001.
increased TG levels, decreased cold tolerance, and heart dysfunction,even when animals were on an RD diet. Further characterization ofCG9510 revealed that it is required for carbon and nitrogen metabolism,similar to its human homolog ASL. These results demonstrate that flieson a HFD have an imbalance in amino acid and carbohydratemetabolism, and HFD causes transcriptional changes at the junctionof these two metabolic pathways that are mediated at least in part byCG9510.
4. DISCUSSION
In this work, we have identified a strong association between amino acidmetabolism and HFD by uncovering key metabolic and transcriptional
MOLECULAR METABOLISM 3 (2014) 42–54 & 2013 The Authors. Published by Elsevier GmbH. All rig
changes in flies consuming a HFD. Flies on a HFD exhibited significantalterations in the abundance of compounds involved in fatty acid,carbohydrate and amino acid metabolism. Expression of genes involvedin several metabolic pathways was affected, including amino acidmetabolism and glycan degradation. Knockdown of one of the geneswith reduced transcription in flies on HFD, CG9510, phenocopied theeffects of HFD, indicating that this gene is a key regulator of HFD. Theseeffects included changes in triglyceride (TG) levels and cold tolerance.CG9510 is a homolog to the human argininosuccinate lyase (ASL) and,like ASL, affects both carbon and nitrogen metabolism. Our observationslead us to ask two key questions: (1) What are the metabolic events thatoccur during HFD that cause such dramatic changes in amino acid andcarbohydrate metabolite abundance; and (2) What effect does thereduction in CG9510 expression have during HFD?
hts reserved. www.molecularmetabolism.com 49

Figure 6: Altered lifespan and heart function with ubiquitous down-regulation of CG9510. (A) Lifespan measurement of flies with down-regulated CG9510 compared to controls. Adult femaleprogeny (d3-5) with down-regulated CG9510, from the cross between UAS-RNAi line (CG9510 #1) and daughterless (da)–GAL4 (;UAS-RNAi CG9510/da-GAL4), were placed on RD. Control flieswere adult female progeny (d3-5) of the cross between UAS-RNAi line (CG9510 #1) and w1118 (;þ /UAS-RNAi CG9510), and were placed on either RD or HFD. Flies with down-regulation ofCG9510 on RD had a significantly shorter lifespan than control flies on RD (po0.0001), and longer lifespan than control flies on HFD (po0.0001) (n¼40 per group). Significance wasdetermined by comparing the survival curves with a log-rank (Mantel–Cox) test. (B) Diastolic heart diameter measurements when CG9510 is down-regulated. Bar graph representation of changes indiastolic diameter of wildtype w1118 (Control (w1118 )-RD, n¼33; Control (w1118 )-HFD, n¼17) and homozygous CG9510-PBac (CG9510-PBac-RD, n¼30) hearts. Note significant decrease indiastolic diameter of CG9510-PBac-RD hearts, compared to Control-RD. Error bars indicate standard error. Significance between experimental group and control was determined with a t-test,****¼po0.0001. (C) Heart dysfunction analysis. Graph represents the percentage of hearts (n¼ same as Figure 6B) displaying non-contractile regions, asynchronous beating pattern anddysfunctional ostia (inflow tracks). Note increased heart defects in Control-HFD and CG9510-PBac-RD compared to Control-RD. Statistical analysis was chi () square test. Control-RD compared toCG9510-PBac-RD flies: 2¼18.84, po0.001. Control-RD compared to Control-HFD: 2¼1.42, p¼0.1. Control-HFD compared to CG9510-PBac-RD: 2¼2.45, p¼0.1.
Original article
4.1. Metabolic imbalance in flies on HFDThe link between an imbalance in metabolism and HFD has beendemonstrated in literature. HFD is known to influence glucosemetabolism, including increased levels of lactate in obese humansubjects [10,49], and increased pyruvate and lactate in mice on a HFD[50]. Mice on a HFD show elevated TCA cycle flux [51], as do cows withhigh liver fat content [52]. Recent studies have consistently revealedalteration of amino acid metabolism in obese, insulin resistant statesand type 2 diabetes [9]. Additionally, a HFD has been shown to diminishskeletal muscle growth in mice [53], similar to decreased protein levelsseen in flies on HFD in our studies (Figure S6). Our work expands on thisby demonstrating for the first time a link between HFD and metabolicimbalance in a Drosophila model. Further analysis allowed us to link anamino acid metabolic regulator to this imbalance due to HFD.Our targeted metabolomic analysis of flies fed a control diet or a HFDidentified changes in compounds involved in carbohydrate, fatty acid,and amino acid metabolism (indicated by green arrows in Figure 9). Theincreased pyruvate and lactate observed in flies consuming a HFDprovide evidence that fatty acid oxidation may occur at the expense ofpyruvate metabolism by the pyruvate dehydrogenase complex inmitochondria. Both processes serve as important sources of acetyl-coenzyme A (AcCoA) to fuel the TCA cycle, and the increased availabilityof triglycerides and fatty acids could displace the use of pyruvate as a
50 MOLECULAR METABOLISM 3 (2014) 42–54
substrate for oxidative mitochondrial metabolism. In turn, pyruvateaccumulates and is subsequently diverted to generate large amounts oflactate (Figure 9, green arrows). Meanwhile, we observed significantdecreases in the abundance of nearly all amino acids detected in ouranalysis. Along with the increases in urea and uric acid, these datasuggest that HFD induces a tangible change in nitrogen/amino acidmetabolism. Such an effect can be explained by the increased need foranaplerotic substrates in the TCA cycle (indicated by purple arrows inFigure 9).In order for AcCoA to enter the TCA cycle, oxaloacetate is required to actas a co-substrate for citrate synthesis. Unlike glucose and amino acids,lipids cannot enter the TCA cycle via anaplerotic pathways and generateAcCoA via β-oxidation. In the context of HFD, glucose may be primarilymetabolized to lactate. Therefore, increased amino acid catabolism canserve as a more significant source of anaplerotic substrates to sustainTCA cycling when HFD is provided. In turn, amino acids that arecatabolized in the TCA cycle become more depleted under theseconditions. Importantly, the observed increase in oxygen consumptionindicates that oxidative phosphorylation and flux through the TCA cycleare maintained or elevated on a HFD, despite the fact that glycolyticmetabolism increases. This provides independent support for the notionthat amino acid oxidation is increased in flies on a HFD to sustainanaplerosis in mitochondria.
& 2013 The Authors. Published by Elsevier GmbH. All rights reserved. www.molecularmetabolism.com

Figure 7: Down-regulating CG1315 simulates HFD phenotype. Evaluating the phenotype of CG1315, gene immediately upstream of CG9510 in argininosuccinate metabolism as shown in (A).Adult female progeny (d3-5) from a CG1315 UAS-RNAi� daughterless (da)-GAL4 cross (;UAS-RNAi CG1315/da-GAL4) and control progeny from a w1118� da-GAL4 cross (w1118;þ /da-GAL4)were put on RD for 1 week prior to the assay. (B) Percent survival after cold stress (2 h at �51, with 24 h recovery in room air) and (C) triglyceride levels (per mg of bodyweight) from whole-bodyhomogenate of control flies and flies with CG1315 down-regulated ubiquitously. Flies were tested in sets of 10 females per vial for cold tolerance, 5 females for TG levels: (B) n¼6–8 sets (60–80flies per group), (C) n¼12–15 sets (60–75 flies per group). Error bars indicate standard error. Significance between values for the experimental group and control was determined with a t-test,****¼po0.0001.
Metabolomic profiling in human subjects has also showed a change inamino acid metabolism, specifically branch chain amino acid (BCAA)catabolism, in obese compared to lean subjects [10]. While we observeda decrease in BCAA abundance in the Drosophila model, human studieshave shown an overall increase in plasma BCAA levels. This may be dueto the fact that human subjects are eating a typical American diet withhigh levels of both fat and protein. Dietary protein has 420% BCAA,and given that dietary BCAAs reach the blood at nearly the same levelsas in the diet [54], this would lead to a large increase in circulatingBCAA levels. In our study, on the other hand, Drosophila consumes aHFD with an increase only in saturated fat levels. Furthermore, as aminoacids are broken down, nitrogen is released which must be converted tourea or uric acid. Indeed, we observed significantly elevated levels ofboth in flies on HFD.
4.2. Transcriptional regulation of CG9510 in response to HFDThe impact of HFD on metabolic pathways was also seen at atranscriptional level with altered pathways important in transport,metabolism of amino acids and breakdown of sugars and wasteproducts. HFD decreased expression of CG9510 (Supplementary
MOLECULAR METABOLISM 3 (2014) 42–54 & 2013 The Authors. Published by Elsevier GmbH. All rig
Dataset), and with independent manipulation of the expression of thisparticular gene, TG levels and cold tolerance were both impacted inthese flies (Figures. 3 and 4). One caveat to note is that in thetransgenic flies, expression of CG9510 was altered throughoutdevelopment, while HFD only affected flies in adulthood. While itwould be interesting to evaluate adult-specific expression of CG9510,using an inducible system would bring with it additional confoundingfactors.CG9510 has sequence homology to human ASL, an enzyme atthe intersection between carbon and nitrogen metabolism, catalyzingthe breakdown of argininosuccinate into arginine and fumarate.Interestingly, mammals on HFD or with high liver fat also presentdecreased levels of urea cycle enzymes [52], including decreasedASL [50].Metabolomic analysis confirmed the function of CG9510 in flies assimilar to ASL. As would be expected given the complexity of an entireorganism responding to dietary change, not all changes seen in theHFD were manifested in the CG9510 transgenic flies. Transgenic flieswith decreased expression of CG9510 had increased fatty acidabundance, similar to those on HFD, even though the transgenic flies
hts reserved. www.molecularmetabolism.com 51

Figure 8: Increased fatty acid accumulation and altered urea and TCA metabolite abundance with down-regulation of CG9510. Adult female flies (d3-5) from a P-element line down-regulatingCG9510 (CG9510-PBac) and female w1118 flies (control) were put on RD for one week prior to metabolite extraction with whole-body homogenate and GC/MS analysis. Shown is the relativeabundance of (A) fatty acids, (B) organic acids and (C) amino acids in CG9510-PBac and control flies on RD, normalized to body weight and divided by the average metabolite abundance in thecontrol flies. For metabolites with multiple fragments available, consistent changes were observed in each and one fragment was selected to represent the metabolite. Three sets of five female flieswere analyzed for each diet condition. Error bars indicate standard error. Significance between relative abundance values of the CG9510-PBac and control group was determined with a t-test,*¼po0.05 **¼po0.01.
Original article
were on RD. It is possible that the transgenic CG9510 flies are unableto oxidize fatty acids as efficiently, which also would explain theincreased TG levels seen in these flies. The fact that the relativeabundance of aspartate is elevated, while urea and citrate aredecreased, establishes that CG9510, similar to ASL, plays a role inmaintaining the balance of carbon and nitrogen metabolism. In supportof this role, the transgenic flies had increased uric acid levels, as thedramatic decrease in urea production would have required themto rely instead on the uric acid pathway for disposing of nitrogen.This demonstrates that by modulating CG9510 during HFD, fliesattempt to compensate for specific components of the metabolicimbalance caused by the diet (indicated by blue arrows in Figure 9).In doing so, however, the end result may be detrimental to theoverall phenotype given the increased TG and decreased stresstolerance and lifespan that accompany down-regulation of CG9510in transgenic flies. Although more detailed studies are required todisplay changes in pathway fluxes proposed in our model, our
52 MOLECULAR METABOLISM 3 (2014) 42–54
metabolomic, transcriptional, and phenotypic results provide a com-pelling link between HFD and an imbalance in carbohydrate, lipid, andamino acid metabolism.
4.3. ConclusionHFD dramatically alters the balance of metabolism in Drosophila. With anincreased availability of fatty acids from the diet, flies seem to shift awayfrom pyruvate as a source for AcCoA, allowing pyruvate to be convertedinto lactate. We see a decrease in amino acid abundance in HFD flies andan increase in urea levels, likely due to an increased demand for TCAcycle intermediates through anaplerosis in order for the increased supplyof AcCoA to enter the cycle. The influence of HFD on nitrogen metabolismis seen through transcriptional changes as well, with several metabolicpathways altered in microarray analysis. During HFD, flies alter expressionof the homolog for human ASL, CG9510, potentially to compensate for theimbalance in nitrogen metabolism. The importance of regulating this geneis also seen in respect to TG storage, stress tolerance, heart function and
& 2013 The Authors. Published by Elsevier GmbH. All rights reserved. www.molecularmetabolism.com
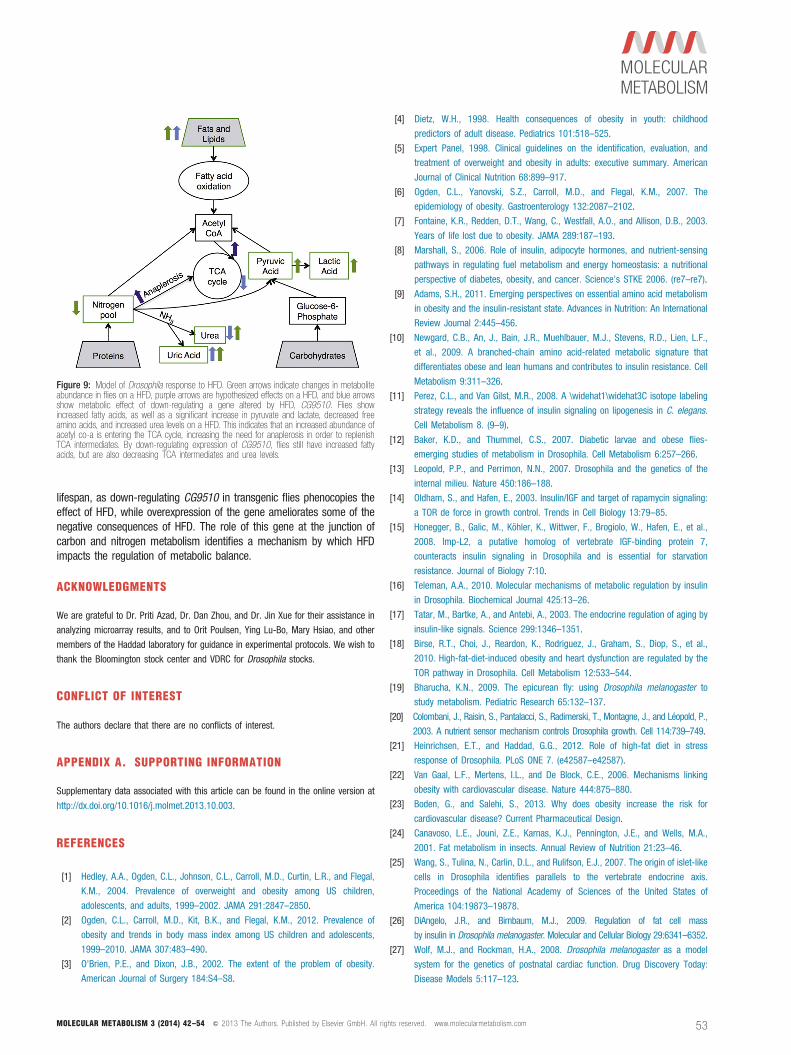
Figure 9: Model of Drosophila response to HFD. Green arrows indicate changes in metaboliteabundance in flies on a HFD, purple arrows are hypothesized effects on a HFD, and blue arrowsshow metabolic effect of down-regulating a gene altered by HFD, CG9510. Flies showincreased fatty acids, as well as a significant increase in pyruvate and lactate, decreased freeamino acids, and increased urea levels on a HFD. This indicates that an increased abundance ofacetyl co-a is entering the TCA cycle, increasing the need for anaplerosis in order to replenishTCA intermediates. By down-regulating expression of CG9510, flies still have increased fattyacids, but are also decreasing TCA intermediates and urea levels.
lifespan, as down-regulating CG9510 in transgenic flies phenocopies theeffect of HFD, while overexpression of the gene ameliorates some of thenegative consequences of HFD. The role of this gene at the junction ofcarbon and nitrogen metabolism identifies a mechanism by which HFDimpacts the regulation of metabolic balance.
ACKNOWLEDGMENTS
We are grateful to Dr. Priti Azad, Dr. Dan Zhou, and Dr. Jin Xue for their assistance in
analyzing microarray results, and to Orit Poulsen, Ying Lu-Bo, Mary Hsiao, and other
members of the Haddad laboratory for guidance in experimental protocols. We wish to
thank the Bloomington stock center and VDRC for Drosophila stocks.
CONFLICT OF INTEREST
The authors declare that there are no conflicts of interest.
APPENDIX A. SUPPORTING INFORMATION
Supplementary data associated with this article can be found in the online version at
http://dx.doi.org/10.1016/j.molmet.2013.10.003.
REFERENCES
[1] Hedley, A.A., Ogden, C.L., Johnson, C.L., Carroll, M.D., Curtin, L.R., and Flegal,
K.M., 2004. Prevalence of overweight and obesity among US children,
adolescents, and adults, 1999–2002. JAMA 291:2847–2850.
[2] Ogden, C.L., Carroll, M.D., Kit, B.K., and Flegal, K.M., 2012. Prevalence of
obesity and trends in body mass index among US children and adolescents,
1999–2010. JAMA 307:483–490.
[3] O'Brien, P.E., and Dixon, J.B., 2002. The extent of the problem of obesity.
American Journal of Surgery 184:S4–S8.
MOLECULAR METABOLISM 3 (2014) 42–54 & 2013 The Authors. Published by Elsevier GmbH. All rig
[4] Dietz, W.H., 1998. Health consequences of obesity in youth: childhood
predictors of adult disease. Pediatrics 101:518–525.
[5] Expert Panel, 1998. Clinical guidelines on the identification, evaluation, and
treatment of overweight and obesity in adults: executive summary. American
Journal of Clinical Nutrition 68:899–917.
[6] Ogden, C.L., Yanovski, S.Z., Carroll, M.D., and Flegal, K.M., 2007. The
epidemiology of obesity. Gastroenterology 132:2087–2102.
[7] Fontaine, K.R., Redden, D.T., Wang, C., Westfall, A.O., and Allison, D.B., 2003.
Years of life lost due to obesity. JAMA 289:187–193.
[8] Marshall, S., 2006. Role of insulin, adipocyte hormones, and nutrient-sensing
pathways in regulating fuel metabolism and energy homeostasis: a nutritional
perspective of diabetes, obesity, and cancer. Science's STKE 2006. (re7–re7).
[9] Adams, S.H., 2011. Emerging perspectives on essential amino acid metabolism
in obesity and the insulin-resistant state. Advances in Nutrition: An International
Review Journal 2:445–456.
[10] Newgard, C.B., An, J., Bain, J.R., Muehlbauer, M.J., Stevens, R.D., Lien, L.F.,
et al., 2009. A branched-chain amino acid-related metabolic signature that
differentiates obese and lean humans and contributes to insulin resistance. Cell
Metabolism 9:311–326.
[11] Perez, C.L., and Van Gilst, M.R., 2008. A \widehat1\widehat3C isotope labeling
strategy reveals the influence of insulin signaling on lipogenesis in C. elegans.Cell Metabolism 8. (9–9).
[12] Baker, K.D., and Thummel, C.S., 2007. Diabetic larvae and obese flies-
emerging studies of metabolism in Drosophila. Cell Metabolism 6:257–266.
[13] Leopold, P.P., and Perrimon, N.N., 2007. Drosophila and the genetics of the
internal milieu. Nature 450:186–188.
[14] Oldham, S., and Hafen, E., 2003. Insulin/IGF and target of rapamycin signaling:
a TOR de force in growth control. Trends in Cell Biology 13:79–85.
[15] Honegger, B., Galic, M., Köhler, K., Wittwer, F., Brogiolo, W., Hafen, E., et al.,
2008. Imp-L2, a putative homolog of vertebrate IGF-binding protein 7,
counteracts insulin signaling in Drosophila and is essential for starvation
resistance. Journal of Biology 7:10.
[16] Teleman, A.A., 2010. Molecular mechanisms of metabolic regulation by insulin
in Drosophila. Biochemical Journal 425:13–26.
[17] Tatar, M., Bartke, A., and Antebi, A., 2003. The endocrine regulation of aging by
insulin-like signals. Science 299:1346–1351.
[18] Birse, R.T., Choi, J., Reardon, K., Rodriguez, J., Graham, S., Diop, S., et al.,
2010. High-fat-diet-induced obesity and heart dysfunction are regulated by the
TOR pathway in Drosophila. Cell Metabolism 12:533–544.
[19] Bharucha, K.N., 2009. The epicurean fly: using Drosophila melanogaster to
study metabolism. Pediatric Research 65:132–137.
[20] Colombani, J., Raisin, S., Pantalacci, S., Radimerski, T., Montagne, J., and Léopold, P.,
2003. A nutrient sensor mechanism controls Drosophila growth. Cell 114:739–749.
[21] Heinrichsen, E.T., and Haddad, G.G., 2012. Role of high-fat diet in stress
response of Drosophila. PLoS ONE 7. (e42587–e42587).
[22] Van Gaal, L.F., Mertens, I.L., and De Block, C.E., 2006. Mechanisms linking
obesity with cardiovascular disease. Nature 444:875–880.
[23] Boden, G., and Salehi, S., 2013. Why does obesity increase the risk for
cardiovascular disease? Current Pharmaceutical Design.
[24] Canavoso, L.E., Jouni, Z.E., Karnas, K.J., Pennington, J.E., and Wells, M.A.,
2001. Fat metabolism in insects. Annual Review of Nutrition 21:23–46.
[25] Wang, S., Tulina, N., Carlin, D.L., and Rulifson, E.J., 2007. The origin of islet-like
cells in Drosophila identifies parallels to the vertebrate endocrine axis.
Proceedings of the National Academy of Sciences of the United States of
America 104:19873–19878.
[26] DiAngelo, J.R., and Birnbaum, M.J., 2009. Regulation of fat cell mass
by insulin in Drosophila melanogaster. Molecular and Cellular Biology 29:6341–6352.[27] Wolf, M.J., and Rockman, H.A., 2008. Drosophila melanogaster as a model
system for the genetics of postnatal cardiac function. Drug Discovery Today:
Disease Models 5:117–123.
hts reserved. www.molecularmetabolism.com 53

Original article
[28] Pandey, U.B., and Nichols, C.D., 2011. Human disease models in Drosophilamelanogaster and the role of the fly in therapeutic drug discovery. Pharmaco-
logical Reviews 63:411–436.
[29] Dietzl, G., Chen, D., Schnorrer, F., Su, K.-C., Barinova, Y., Fellner, M., et al.,
2007. A genome-wide transgenic RNAi library for conditional gene inactivation
in Drosophila. Nature 448:151–156.
[30] Rondeau, R.E., and Baths, Slush, 1966. Journal of Chemical and Engineering Data.
[31] Grassian, A.R., Metallo, C.M., Coloff, J.L., Stephanopoulos, G., and Brugge, J.S.,
2011. Erk regulation of pyruvate dehydrogenase flux through PDK4 modulates
cell proliferation. Genes & Development 25:1716–1733.
[32] Metallo, C.M., Walther, J.L., and Stephanopoulos, G., 2009. Evaluation of
\widehat1\widehat3C isotopic tracers for metabolic flux analysis in mammalian
cells. Journal of Biotechnology 144:8.
[33] Antoniewicz, M.R., Kelleher, J.K., and Stephanopoulos, G.G., 2007. Accurate
assessment of amino acid mass isotopomer distributions for metabolic flux
analysis. Analytical Chemistry 79:7554–7559.
[34] Krishnan, S., Sun, Y., Mohsenin, A., Wyman, R., and Haddad, G., 1997.
Behavioral and electrophysiologic responses of Drosophila melanogaster to
prolonged periods of anoxia. Journal of Insect Physiology 43:203–210.
[35] Hsiao, A., Ideker, T., Olefsky, J.M., and Subramaniam, S., 2005. VAMPIRE
microarray suite: a web-based platform for the interpretation of gene expression
data. Nucleic Acids Research 33:W627–W632.
[36] Huang, D.W., Sherman, B.T., and Lempicki, R.A., 2009. Bioinformatics
enrichment tools: paths toward the comprehensive functional analysis of large
gene lists. Nucleic Acids Research 37:1–13.
[37] Da Wei Huang, B.T., and Sherman, R.A., 2009. Lempicki, Systematic and
integrative analysis of large gene lists using DAVID bioinformatics resources.
Nature Protocols 4:44–57.
[38] Rozen, S., and Skaletsky, H., 2000. Primer3 on the WWW for general users and
for biologist programmers. Methods in Molecular Biology 132:365–386.
[39] Grönke, S., Beller, M., Fellert, S., Ramakrishnan, H., Jäckle, H., and Kühnlein, R.P.,
2003. Control of fat storage by a Drosophila PAT domain protein. Current Biology
13:603–606.
[40] Ja, W.W., Carvalho, G.B., Mak, E.M., de la Rosa, N.N., Fang, A.Y., Liong, J.C.,
et al., 2007. Prandiology of Drosophila and the CAFE assay. Proceedings
of the National Academy of Sciences of the United States of America
104:8253–8256.
[41] Ocorr, K., Reeves, N.L., Wessells, R.J., Fink, M., Chen, H.-S.V., Akasaka, T.,
et al., 2007. KCNQ potassium channel mutations cause cardiac arrhythmias in
Drosophila that mimic the effects of aging. Proceedings of the National Academy
of Sciences of the United States of America 104:3943–3948.
[42] Vogler, G., and Ocorr, K., 2009. Visualizing the beating heart in Drosophila.
Journal of Visualized Experiments 31:1425, http://dx.doi.org/10.3791/1425.
54 MOLECULAR METABOLISM 3 (2014) 42–54
[43] Fink, M., Callol-Massot, C., Chu, A., Ruiz-Lozano, P., Belmonte, J.C.I., Giles, W., et al.,
2009. A new method for detection and quantification of heartbeat parameters in
Drosophila, zebrafish, and embryonic mouse hearts. Biotechniques 46:101–113.
[44] Araujo, R.L., Andrade, B.M., Padrón, A.S., Gaidhu, M.P., Perry, R.L.S., Carvalho, D.P.,
et al., 2010. High-fat diet increases thyrotropin and oxygen consumption without
altering circulating 3,5,3′-triiodothyronine (T3) and thyroxine in rats: the role of
iodothyronine deiodinases, reverse T3 production, and whole-body fat oxidation.
Endocrinology 151:3460–3469.
[45] Fanelli, M.T., and Kaplan, M.L., 1978. Effects of high fat and high carbohydrate
diets on the body composition and oxygen consumption of ob/ob mice. Journal
of Nutrition 108:1491–1500.
[46] So, M., Gaidhu, M.P., Maghdoori, B., and Ceddia, R.B., 2011. Analysis of time-
dependent adaptations in whole-body energy balance in obesity induced by
high-fat diet in rats. Lipids in Health and Disease 10:99.
[47] Birse, R.T., and Bodmer, R., 2011. Lipotoxicity and cardiac dysfunction in
mammals and Drosophila. Critical Reviews in Biochemistry and Molecular
Biology 46:376–385.
[48] Diop, S.B., and Bodmer, R., 2012. Drosophila as a model to study the genetic
mechanisms of obesity-associated heart dysfunction. Journal of Cellular and
Molecular Medicine 16:966–971.
[49] Lovejoy, J., Newby, F.D., Gebhart, S.S., and DiGirolamo, M., 1992. Insulin
resistance in obesity is associated with elevated basal lactate levels and
diminished lactate appearance following intravenous glucose and insulin.
Metabolism 41:22–27.
[50] Toye, A.A., Dumas, M.E., Blancher, C., Rothwell, A.R., Fearnside, J.F., Wilder, S.P.,
et al., 2007. Subtle metabolic and liver gene transcriptional changes underlie diet-
induced fatty liver susceptibility in insulin-resistant mice. Diabetologia 50:1867–1879.
[51] Satapati, S., Sunny, N.E., Kucejova, B., Fu, X., He, T.T., Méndez-Lucas, A.A., et al.,
2012. Elevated TCA cycle function in the pathology of diet-induced hepatic insulin
resistance and fatty liver. Journal of Lipid Research 53:1080–1092.
[52] Schäff, C., Börner, S., Hacke, S., Kautzsch, U., Albrecht, D., Hammon, H.M.,
et al., 2012. Increased anaplerosis, TCA cycling, and oxidative phosphorylation
in the liver of dairy cows with intensive body fat mobilization during early
lactation. Journal of Proteome Research 11:5503–5514.
[53] Sitnick, M., Bodine, S.C., and Rutledge, J.C., 2009. Chronic high fat feeding
attenuates load-induced hypertrophy in mice. The Journal of Physiology
587:5753–5765.
[54] Layman, D.K., and Walker, D.A., 2006. Potential importance of leucine in
treatment of obesity and the metabolic syndrome. Journal of Nutrition
136:319S–323S.
& 2013 The Authors. Published by Elsevier GmbH. All rights reserved. www.molecularmetabolism.com