member finra/sipc - s3.amazonaws.com · value stocks have asserted market leadership, ... style...
TRANSCRIPT

Member FINRA/SIPC

Stock markets, bond markets, the economy, policy — some years they push and pull on each other lightly as markets follow their own path; in others, one influence, such
as monetary policy, dominates. But sometimes, often following a period of change, understanding the pushes and pulls and how they interact becomes a key to reassessing market dynamics for the next year and beyond.
2016 was a milestone year, a year of important changes for markets, the economy, and certainly politics. S&P 500 corporate earnings turned positive reversing more than a year of declines. After a one-year hiatus, the Federal Reserve raised rates for the second time in the current cycle, in what might finally be the start of a more regular path to interest rate normalization. Fears of deflation shifted to talk of “reflation.” Oil ended a multi-year decline that saw prices fall from over $110/barrel in 2011 to a low of just over $26 in February 2016. And most dramatically, the American electorate rebuked the political establishment by choosing the nation’s first president who has held neither a prior political office nor high military rank, but instead has built an entire career in the private sector. The U.S. election, along with the U.K.’s referendum vote to leave the European Union (EU), may also come to be viewed as important milestones, if it leads to nations shifting away from a decades-long trend toward increased globalization.
We have already seen a number of changes taking place as markets try to assess the dynamic new environment. Heading into the New Year, interest rates have moved dramatically, cyclically oriented value stocks have asserted market leadership, and oil prices found a new foothold as several major oil producing countries agreed to production cuts. New gears have been engaged, energy is building in some places, relief valves have let off some steam in others, and market drivers have been hoisted and repositioned. Being prepared for 2017 is about gauging these market milestones,
understanding their significance, and responding without overreacting. The way to assess the new environment is not to ask, “What’s broken?” or “What’s fixed?” but “How will businesses, markets, and the economy adapt?” The theme for tackling portfolios may be similar. Read the gauges and make adjustments, while staying strategic and maintaining a long-term view.
With a likely pickup in the pace of economic growth as rising business investment and fiscal stimulus complement steady consumer spending, here are some key themes we’ll be watching:
� Smoother path to policy changes. A Republican president working with a Republican Congress should smooth the path for implementing policy changes. Both the timing and the actual details on issues such as fiscal stimulus, tax reform, deregulation, and trade will help set the market direction.
� Earnings growth returns. With the earnings recession at an end, in 2017 we expect mid- to high-single-digit earnings growth potentially supported by an accelerating U.S. economy, rebounding energy sector profits as oil prices stabilize, and steady profit margins.
� Fed in play. Fed policy is driven by the dual mandate of keeping inflation low and the economy near maximum employment. Both sides of the mandate may look different in 2017, as the labor market approaches full employment and inflationary pressures increase.
Gauging the market milestones as they impact 2017 will require a good plan and the right attitude. It’s about smart, not fast; patience, not impulsiveness; judicious adaptation, not careless return-chasing. After a momentous year, use LPL Research’s Outlook 2017: Gauging Market Milestones to help keep a firm but responsive touch on the controls and eyes on the right gauges as you pursue your financial goals.
2

P olicy dr i ver sEmphasis on small cap friendly
policy likely to be well-received early in the year.
C ycle dr i ver sCycle favors large caps, but
policy influence may continue.
Policy pending: corporate tax reform may benefit small caps;
cash repatriation may benefit large caps.
C yclicalEconomic growth, reflation
may benefit cyclicals.
De f ensi veRate sensitivity, lower growth
potential may limit gains.
Leading indicators show low odds of recession.
BalancedEarnings growth, yield curve may put cyclically-oriented value on par with growth.
UnbalancedCyclicals versus defensives likely to be more important than value versus growth.
Technology and healthcare may re-emerge with
reassurance on policy risks.
U.S .Supportive economic
backdrop with good prospects for earnings growth.
Developed in t er na t ionalElections, Brexit follow-through may limit upside.
Risks have increased for emerging markets, but
fundamentals remain strong.
In t er media t e -t er m bondsBelow-benchmark duration
may be able to weather a modest rise in rates.
L ong ma t ur it yHigher sensitivity to rate changes.
Investment-grade corporates’ modest credit risk may help offset
typically longer maturities.
Moder a t e cr edit sensit i v it yValuations richer, but economic
growth would be supportive.
High qualit yCan be an important diversifier,
but lower return opportunity.
Bank loans’ adjustable rate lowers interest rate sensitivity.
Credit risk may be low if economic growth improves.
Power Up Power Down Standby ModeConsider activating these investment
ideas in portfolios in 2017.Investment ideas that may be
running out of juice in 2017.Within a supportive environment,
monitor these potential opportunities.
Size
Economic Cycle
Style
Geography
Maturity
Credit Quality
3

4
In 2016, the U.S. economy navigated some difficult challenges including low oil prices, a strong dollar, tightening financial conditions, and the threat of
deflation. As we turn the calendar to 2017, concerns have shifted. Oil prices have stabilized; while the dollar, despite receiving a post-election boost, is unlikely to create the kinds of headwinds it created over the last three years. Increased anxiety over deflation in 2015 and early 2016 has flipped to “reflation” concerns. Conversations about fiscal austerity, through mechanisms like budget sequestration that left the economy relying on monetary stimulus through the Federal Reserve (Fed), have turned to a drum beat for fiscal stimulus through tax reform and infrastructure spending while the Fed slowly normalizes monetary policy. We have even started to see steadying
in the manufacturing sector, following contraction under the influence of low oil prices, a strong dollar, and weaker global growth. Although the economy remains more fragile than during most prior expansions, these turning points have marked the economy’s ability to navigate a challenging period.
Momentum ShiftsTaking into account all of these milestones, we believe the economic recovery that began in mid-2009 will likely pass its eighth birthday in 2017, as leading economic indicators continue to suggest low odds of a recession starting next year. However, the risk of a recession due to a policy mistake has risen over the course of 2016. The pro-growth policies likely to be enacted in the first half of 2017 by Trump, including corporate and personal tax cuts, increased spending on infrastructure and defense, and deregulation, may help to boost economic growth in 2017 and 2018 and increase the economy’s potential growth rate (while changing the mix of growth drivers). However, they may also lead to some of the “overs” that tend to emerge at the end of expansions (overconfidence, overborrowing, overspending), naturally accelerating the economic cycle and bringing a recession sooner than otherwise might have been the case.
Focusing on 2017, between the economic momentum that started in late 2016, the boost from fiscal policy likely to be enacted by mid-2017, and a more business-friendly regulatory environment, real gross domestic product (GDP) growth may accelerate to a range closer to 2.5% in 2017, after spending most of the first seven-plus years of the expansion averaging just over 2.1%. The boost in 2017 comes as the main drivers of growth shift from an emphasis on the consumer to a mix that
%100
80
60
40
20
0
-20‘83–’90 ‘91–’00 ‘02–’07 ‘09–’14 ‘15–Present
Median % Contribution to GDP During Expansions Consumer Spending Federal GovernmentBusiness Investment 2017 Estimate
Source: LPL Research, Bureau of Economic Analysis 11/30/16
*Chart does not include all economic sectors that make up GDP. Total GDP rescaled to reflect median contributions. 2009 – 2014 and 2015 to present are both part of the current expansion and are separated to highlight the recent economic environment.
GDP Could Receive a Boost From a Better Mix of Growth Drivers1
ECONOMY
APPROACHING MID-CYCLE ACCELERATION

5
includes manufacturing, capital expenditures, and government spending [Figure 1]. Potential contribution from trade (net exports) remains a wild card, as the Trump administration’s trade policies, while attempting to shift the balance of exports and imports, may have a dampening impact on long-term trade growth. In addition, the deficit could make a comeback as a key economic topic for markets and policymakers in the aftermath of a potential shift to fiscal stimulus through lower taxes and increased infrastructure and military spending.
The timing of the passage of Trump’s proposals on taxes and infrastructure, as well as the speed of implementation, will be an important factor in their growth impact in 2017. We assume passage by mid-year 2017 [Figure 2], but an earlier passage and start to implementation would pull more of the growth effect forward into 2017, while passage and implementation delays into late 2017 may push back the impact on growth, employment, and inflation until very late 2017 or early 2018.
Of course, new risks could be around the corner. The Fed may start raising rates in earnest, if slowly, after a one-year hiatus between December 2015 and December 2016. Raising rates at this stage would simply reflect an improving economy, but finding the proper pace for rate increases will be a challenge. President-elect Donald Trump has expressed intentions to renegotiate trade agreements, but will face the challenge of improving them without starting a harmful trade war. And although fiscal stimulus may give a boost to growth, long-term challenges for the federal debt and budget deficit loom in the background.
Path to Normalization: Federal Reserve Is Fueling UpAt the start of 2016, the disconnect between the Federal Reserve and the federal funds futures market about the anticipated future direction of monetary policy was striking. The Fed, which had just initiated its first
tightening cycle in more than 11 years in December 2015, anticipated raising rates by 200 basis points (2.0%)* over the course of 2016 and 2017, which would put the fed funds target rate at around 2.375% by the end of 2017. Meanwhile, the market was pricing in just four 25 basis point hikes over the course of 2016 and 2017, putting the fed funds target rate at just 1.375% by year-end 2017. The 100 basis point disparity, the equivalent of four 25 basis point rate hikes, was so wide that it led to a number of destabilizing global imbalances in the first few months of 2016, which in turn contributed to the financial market turmoil over the first six weeks of the year.
As of late 2016, the Fed has raised rates just once more, at its final meeting of the year in December, leaving the fed funds target rate at about 0.625%. If its outlook for the economy, labor market, and inflation is met, the Fed said it would raise rates 75 basis points in 2017 and 75 basis points in 2018, leaving the fed funds target rate at 2.125% at the end of 2018. Meanwhile, the market now sees roughly two hikes in 2017 and two in 2018, putting the fed funds target rate around 1.825% at year-end 2018. At around 25 basis points, the disagreement on the path of rates over the next two years is likely to prove much more manageable for global markets to absorb than the 100 basis point gap at the start of 2016.
Our view is that we may meet the Fed’s forecasts for the economy, labor market, and inflation in 2017, leading the Fed to raise rates twice during the year. The economy might receive a boost from fiscal stimulus, which can lead to a virtuous cycle of added confidence and the release of what economists colorfully refer to as the economy’s “animal spirits,” where greater confidence leads to increased activity. If this happens, it will push GDP growth above its currently muted potential, tighten resources, increase labor costs, and ultimately drive inflation. Given this possibility, our estimate of two rate hikes has an upward bias with three hikes more likely than one, especially if inflation moves above 2.0% and remains there, as we expect.
President Action Date Passed Months Into New Term
Kennedy Spending Increases Jun ‘61 5
Nixon Tax Cut Dec ‘69 11
Ford Tax Cut Mar ‘75 7
Reagan Tax Cut Aug ‘81 7
Clinton Tax Increase Aug ‘93 7
George W. Bush Tax Cut Jun ‘01 5
Obama Tax Cut and Spending Increases Feb ‘09 1
Average: 6 Months
There’s Typically a Six-Month Delay from Taking Office to Fiscal Legislation
Source: LPL Research 11/30/16
2
*Basis points (bps) refer to a common unit of measure for interest rates and other percentages in finance. One basis point is equal to 1/100th of 1%, or 0.01%, and is used to denote the percentage change in a financial instrument.

6
Pressure Increases on Labor MarketThe disconnect between the Fed and the market regarding the path of interest rates will likely narrow further in 2017; however, the disconnect between the Fed and the market on the labor market will likely widen. The market may view a potential slowdown in the pace of job creation as a recession signal, while the Fed may continue to see it as consistent with a labor market near full employment.
Since early 2010, the unemployment rate has dropped from nearly 10% to the most recent reading of 4.6%, a new cycle low. In its most recent set of economic projections (released in mid-December 2016), the Fed’s policy arm, the Federal Open Market Committee (FOMC), projected the unemployment rate at 4.5% by the end of 2017, just a modest improvement from current levels. Fed Chair Janet Yellen has noted that although the unemployment rate is not the perfect measure of slack in the labor force, if she had to focus on just one number, that would be it. Of course Yellen has often noted that the Fed watches a “broad range of labor market indicators” to gauge the health of the labor market [see “Employment Progress Monitor”]. On balance, all but a handful of these indicators have returned to their pre-Great Recession levels.
One of the reasons the Fed cares about the labor market is that less slack in the labor market leads to wage pressures. Wages represent around two-thirds
of business costs and, over time, higher wages lead to higher inflation. Wage inflation (as measured by the year-over-year gain in average hourly earnings) has moved from a low of near 1.5% in 2012 to near 3.0% at the end of 2016, but has not yet reached its pre-Great Recession pace of 4 – 4.5%. But the market, and perhaps even the Fed, may be surprised by how quickly wages could accelerate toward pre-Great Recession levels even if job creation slows in 2017.
In the six years from early 2010 (when the U.S. economy began regularly creating jobs again after the end of the Great Recession) to mid-2016, the economy created a total of just under 15 million jobs, or an average of just under 200,000 per month. Since the middle of 2016, job creation has slowed to 175,000 per month and is likely to slow further over the course of 2017. A few Fed officials are on record saying monthly job growth as low as 80,000 per month would be sufficient to push the unemployment rate lower, but the center of gravity of the Fed probably sees that number closer to 100,000 – 125,000. As we look ahead to 2017, we continue to expect a slowdown in job creation as the recovery matures, but in our view it would take a slowdown to around 25,000 – 50,000 jobs per month to signal that a recession is imminent. The market, on the other hand, may see a fairly typical later-cycle slowdown in jobs to the 100,000 to 125,000 per month range as a recession signal.
Source: LPL Research, Bureau of Labor Statistics, Haver Analytics 11/30/16
Shaded area indicates recession.
The Consumer Price Index (CPI) is a measure of the average change over time in the prices paid by urban consumers for a market basket of consumer goods and services.
Commodity-linked investments may be more volatile and less liquid than the underlying instruments or measures, and their value may be affected by the performance of the overall commodities baskets as well as weather, geopolitical events, and regulatory developments.
Commodities and Services Are Both Contributing to Higher Inflation3
CPI, Year-over-Year % Change
%8
4
0
-4
-8‘02 ‘04 ‘06 ‘08 ‘10 ‘12 ‘14 ‘16
Headline Service SectorGoods

7
Inflation Bubbles Up, But Doesn’t Boil OverIn the aftermath of the Great Recession, inflation expectations have swung between concerns over hyper-inflation in the years following the launch of quantitative easing (QE) in 2009 to concerns about deflation in late 2015, as the impact of sharply lower oil prices and plenty of spare global capacity exacerbated already slow GDP growth. In general, slow economic growth, spare capacity (available labor and production resources), and the globalization of product and labor markets have all acted as restraints on inflation in recent years, and except for a few brief periods in 2009 and early 2015, the Consumer Price Index (CPI) has exhibited neither hyperinflation (as feared in response to central bank “money printing”) nor protracted deflation. Instead, the CPI experienced stagnant or declining (but still positive) growth, also known as disinflation, for much of this recovery. Fears of deflation by late 2015 had led to ramped-up efforts by central banks outside the U.S. to expand QE and a year-long delay in the Fed raising rates a second time.
By the second half of 2016, in the U.S. at least, the factors pushing inflation higher may have begun to win the battle over disinflationary forces, marking an important transition for the economy [Figure 3]. For most of 2015 and 2016, as headline CPI was held down by falling oil prices, inflation in the service sector (which accounts for 80% of GDP and two-thirds of the CPI) accelerated to a new cycle high of 3.0%. Goods prices (one-third of the CPI), which have been in a deflationary environment for most of the past three years, remained in negative territory for the majority of 2016, but as oil prices stabilized near $45/barrel in late 2016, goods deflation began to give way to year-over-year price increases. If oil and gasoline prices stay in their recent ranges, the CPI for commodities will turn positive in early 2017 and push overall CPI above the Fed’s 2% target.
How to InvestThe second half of an economic cycle usually sees increased financial market volatility, and we believe the current cycle may continue that pattern. But despite the greater uncertainty that comes with a potentially less accommodative Fed, increased policy uncertainty, and the broad increase in populist political movements, we believe economic milestones passed in 2016 have provided an improved backdrop for corporate America that will help support equities while creating a mild headwind for bonds.
Historically, when the 10-year Treasury yield has been below 5%, stock market returns and interest rates have tended to rise and fall together (positive correlation) [see Figure below]. When rates are still relatively low, rising rates usually indicate improving growth prospects, while the risk that the economy will soon overheat tends to remain low. At higher interest rate levels, however, rising rates have historically been associated with below-historical stock performance, as higher corporate borrowing costs, the impact of a potentially stronger dollar on exports and overseas profits, and possibly undesirable levels of inflation create added risk for equities.
Interest rates currently remain low with the 10-year Treasury yield still in the 2.25 – 2.75 range as 2016 ends — good news for stocks — although we acknowledge that unconventional Fed policy, an unusually long period of low interest rates, and lower potential GDP growth may mean that interest rates could begin to weigh on stock market gains at levels below 5%. Still, we believe stocks have some cushion before the negative consequences of higher rates overtake the potential lift from better growth.
How worried should stock investors be about higher bond yields?
Source: Bloomberg, FactSet 11/30/16
Data since 1968.
Correlation ranges between -1 and +1. Perfect positive correlation (a correlation co-efficient of +1) implies that as one security moves, either up or down, the other security will move in lockstep, in the same direction. Alternatively, perfect negative correlation means that if one security moves in either direction the security that is perfectly negatively correlated will move in the opposite direction. If the correlation is 0, the movements of the securities are said to have no correlation; they are completely random.
Stocks Not Hurt as Much by Higher Interest Rates When Rates Are Low
2-Year Correlation Between S&P 500 & 10-Year Treasury Yield
10-Y
ear T
reas
ury
Yiel
d
%18
16
14
12
10
8
6
4
2
0-0.8 -0.6 -0.4 -0.2 0.0 0.2 0.4 0.6 0.8

88

9
Over the course of 2014, Fed Chair Janet Yellen mentioned several labor market indexes that she and other Federal Open Market Committee (FOMC) members were watching closely to assess the effectiveness of monetary policy. In May 2014, Fed staffers released a white paper
introducing the Labor Market Conditions Index (LMCI). This paper received a great deal of attention from market participants who believed it may contain clues to the timing of interest rate hikes. Several of these labor market indexes — which have been referred to as the “Yellen
indicators” — are being closely monitored by the Fed chair and the FOMC. This infographic details the progress of these indicators over the last two years. In our view, movement toward maximum employment keeps the Fed on track to raise rates twice in 2017, with three more likely than one.
Label DescriptionPrerecession
High – Recession LowCurrent Reading
Change From 2015
UR Unemployment rate: % of labor force 4.40% – 10.00% 4.6% 23%
LFPR Labor force participation rate: year-over-year change, % of unemployed 0.4% – -1.1% 0.2% 13%
PTER Part-time employment for economic reasons: % of labor force 2.7% – 6.7% 3.7% 27%
LTU Long-term unemployed: 27 weeks or more, % of unemployed 15.9% – 45.3% 24.8% 24%
DU Duration of unemployment: weeks 7.3 – 25 10.1 20%
PPE Private payroll employment: millions of workers 116.0 – 107.2 122.9 58%
GPE Government payroll employment: millions of workers 22.6 – 21.8 22.2 43%
THE Temporary help employment: millions of workers 2.7 – 1.7 3.0 8%
AWH Average weekly hours (jobs): hours 33.9 – 33.0 33.6 -22%
AWHPW Average weekly hours of persons at work: hours 39.7 – 36.2 38.3 -11%
WR Wage rates: average hourly earnings, year-over-year % change 4.2% – 1.3% 2.4% 5%
HW Composite help-wanted: index 4250 – 2750 4723 -23%
HR Hiring rate: % of payroll employment 4.5% – 3.2% 3.5% -31%
TRUE Transition rate from unemployment to employment : % of unemployment 29.6% – 15.9% 25.3% 13%
JPHG Jobs plentiful vs. hard to get: diffusion index 11.4% – - 46.1% 4.8 9%
HP Hiring plans: diffusion index 19% – -10% 15% 17%
JHF Jobs hard to fill: % 31% – 8% 31% 30%
IUR Insured unemployment rate: % of covered employment 1.9% – 5.0% 1.5% 10%
JLOS Job losers unemployed less than 5 weeks: % of employment 45.4% – 14.7% 36.3% 31%
QR Quit rate: % of payroll employment 60% – 39% 61% 15%
JLEA Job leavers unemployed less than 5 weeks: % of employment 48.8% – 17.5% 34.0% 5%
Source: LPL Financial Research, Bureau of Labor Statistics, Haver Analytics 11/30/16The time frame for all data is the last 12 years: 2004–2016.
Have reached or exceeded their prerecession levels
Tracking Yellen’s IndicatorsEm
ploy
men
tLa
bor F
orce
Job
Mar
ket
Layo
ffs &
Qui
ts
9

10
In 2016, we saw two key events that may be remembered as important markers in a reversal of trends favoring increased globalization and free trade loosely in
place since the end of World War II: the U.K.’s referendum vote to leave the EU (“Brexit”) and the U.S. election, where both candidates had campaigned on free trade skepticism. Trump’s trade platform, which included renegotiating the North American Free Trade Agreement (NAFTA), the imposition of select trade tariffs, and a more aggressive stance on foreign currency, was decidedly stronger. These two votes, growing from the unevenly distributed (and often misunderstood) impact of free trade, long-term trends in the global availability of cheap labor, and a growing wave of populism, demonstrated the power of the democratic process to capture views that may have fallen off the radar of the political establishment. This populist and anti-globalization sentiment will also be a major factor in several upcoming political events across Europe.
These economic and political forces and their uncertain impact on trade and currencies are casting a cloud over the improving economic and corporate fundamentals in many regions internationally. In particular, emerging markets (EM) have show signs of life after seeing near flat earnings growth since 2011, with earnings growth tracking to 15% in 2016 and further growth projected in
2017, based on the MSCI Emerging Markets Index analyst projections. Despite fundamental improvements, EM has not experienced the expansion in its price-to-earnings ratio seen in developed foreign markets and the U.S. over the last several years, making it attractively valued on both a relative and absolute basis. Developed foreign markets’ earnings, as defined by the MSCI EAFE Index, are tracking toward flat to very modest growth in 2016, and have reasonable growth expectations for 2017, based on analyst consensus. Overall, if the aforementioned political issues were not looming, the outlook for both markets, particularly EM, would be more positive.
Adjustments Ahead: Caution Remains Amid Political UncertaintyDespite these positive developments, we remain cautious on both developed foreign and EM economies and markets. They remain an important part of a strategic asset allocation plan, and we recommended establishing modest positions in EM early in 2016, but would only strengthen the recommendation under the right conditions. We will watch these economic and political events closely to determine if and when an additional investment might be warranted. The greatest risk may be in Europe. Over the next year, Europe will continue to see several important tests of the shifting global political mood reflected in the Brexit vote and U.S. election, highlighted by elections in France and Germany, and political wrangling around the structure and timing of the U.K.’s exit from the EU. An Italian referendum vote in December 2016 continued the trend of populist victories, although the outcome of presidential elections in Austria were considered pro-EU. Partial withdrawal from the EU, and perhaps even a rejection of the euro, are at issue in all of these political events, even if not formally on the ballot. This was not the case with the Brexit vote, since the U.K. never adopted the euro and continues to use the pound. While the Brexit vote was momentous, a change in currency for any individual country would be much more difficult, and riskier, than just leaving the EU, and a deeper threat to both the euro and the EU itself.
INTERNATIONAL
GLOBAL BALANCING ACT
The European Union (EU) is a group of 28 countries that have many common policies in areas such as trade, agriculture, the environment, and consumer protection. Essential to the EU are the “four freedoms,” freedom of movement for people, capital, trade, and services. Most, though not all, of the countries in the EU use the euro as their currency. These countries are referred to as the Eurozone.

11
The impact of the changing global policy environment on currencies also bears careful monitoring. The relative strength of the U.S. dollar is a major factor in the performance of international investments. Following the U.S. election, the dollar has rallied against almost all major currencies after moving in a broad trading range since the beginning of 2015 [Figure 4]. Continued dollar strength that recreates the strong dollar environment of mid-2014 to early 2015, when the dollar gained 20 – 25% in a short period, would weigh heavily on all non-U.S. assets, both equity and debt, in both developed and emerging markets. Despite the possibility of some dollar gains in 2017, we have long held that the dollar will likely face long-term headwinds due to the weight of the U.S. budget and trade deficits and an incrementally decreasing role in global trade. Trump’s policy impact on the U.S. budget deficit in particular may solidify the bearish long-term macroeconomic backdrop for the dollar that is already in place, likely improving the
benefits of international diversification looking beyond 2017 in the absence of any major destabilizing event.
How To InvestDespite improved fundamentals and attractive valuations, especially in emerging markets, we would want to see some further evidence of dollar stability before adding to positions. Should the dollar stabilize, emerging markets may provide a particularly attractive, albeit a higher risk, opportunity. The primary risks to international investing are a stronger dollar and changes to trade policy. These risks have us cautious on both developed and emerging markets. However, given the strength in underlying earnings growth in emerging markets, these markets are now better positioned to weather a stronger dollar than they were in 2014 or 2015. Currency hedging remains a viable option in developed markets, particularly in Europe, to help dampen some of the investment risks in those markets.
Source: LPL Research, Bloomberg 11/30/16
Currency risk is a form of risk that arises from the change in price of one currency against another. Whenever investors or companies have assets or business operations across national borders, they face currency risk if their positions are not hedged.
After a Multi-Year Downtrend, the U.S. Dollar Is Testing the Top of its Recent 18-Month Range 4
120
110
100
90
80
70‘00 ‘02 ‘04 ‘06 ‘08 ‘10 ‘12 ‘14 ‘16
U.S. Dollar (DXY Index)
Potential Breakout
One reason emerging market (EM) assets had been attractive for U.S. and European investors is their higher yields compared with the low, and even negative, rates across developed markets outside the U.S. Large global investors have been borrowing money in developed markets and buying higher yielding EM assets, a practice referred to as the “carry trade.” The spike in global interest rates after the U.S. election has made the carry trade less attractive. It has also made the trade riskier for those who borrowed money in a currency that has
been appreciating (such as the U.S. dollar). This “unwinding” of the carry trade has exacerbated the movement of investors out of EM assets (equity, debt, and currencies) and back into U.S. dollar-denominated assets. Although this unwinding can cause significant short-term volatility, such as the recent rise in the dollar and decline in international assets, it also tends to be a temporary phenomenon. Currency values can adjust sharply to changing interest rates and other factors, but they typically stabilize after a period of time.
Letting Off Steam: The Carry Trade

12
Stocks fundamentally represent ownership of a share of a company (i.e., equity), and appreciation in stock prices is ultimately driven by earnings growth. S&P 500
earnings passed an important milestone in 2016, returning to growth in the third quarter after mildly contracting for several quarters during an extended mid-cycle earnings recession. Expected mid- to high-single-digit earnings gains from corporate America in 2017 should help support the continuation of the nearly eight-year-old bull market for U.S. equities, and we expect mid-single-digit returns for the S&P 500 in 2017, consistent with historical mid-to-late economic cycle performance. In addition to earnings growth, we expect those gains to be driven by: 1) a pickup in U.S. economic growth, partially due to fiscal stimulus, 2) stable valuations as measured by the price-to-earnings ratio
(a stable price-to-earnings ratio (PE) of 18 – 19), and 3) an expansion in bank lending. However, gains will likely come with increased volatility as the economic cycle ages further and interest rates may rise, increasing borrowing costs and making bonds a more competitive alternative to stocks. Risks to our forecast include:
� a sharp rise in inflation that leaves the Fed playing catch-up;
� a trade war with key U.S. trading partners; or
� a policy mistake, domestic or foreign, that causes a recession or significant market disruption.
Mid-Cycle Support Suggests Solid Stock Market GainsOur forecast for U.S. economic growth in 2017 supports our expectation for stock market gains next year and the continuation of the bull market past its eighth birthday. In years when the U.S. economy does not enter recession, the S&P 500 produced an average gain of 12%. These numbers are also consistent with the first year of the presidential cycle. In the first year of the four-year presidential cycle (as 2017 will be), when the U.S. economy does not enter into a recession, the S&P 500 posts gains 92% of the time, with an average return of 9.3% (data back to 1950) [Figure 5].†
Company Earnings Picking Up SteamEarnings growth returned in late 2016 and may continue to gain momentum in the coming year. We expect earnings growth in the mid- to high-single-digits in 2017, well above the flat earnings of 2016 and more consistent with long-term averages. Better economic growth, potentially the fastest since the end of the Great Recession, would be supportive of corporate profits [Figure 6]. Our forecast of
Source: LPL Research, FactSet 11/30/16
All indexes are unmanaged and cannot be invested into directly. Unmanaged index returns do not reflect fees, expenses, or sales charges. Index performance is not indicative of the performance of any investment. All performance referenced is historical and is no guarantee of future results.
*Indicates first year of each four-year presidential cycle. Mid-cycle years (highlighted) are defined as more than a year away from the start or end of a recession.
Stock Market Gains Tend to Accompany Mid-Cycle Economies5
-25% to -15% -15% to -5%< -25% -5% to +5% +5% to +15% +15% to +25% > +25%
Annual S&P 500 Gains/Losses Without Dividends Since 1950Mid-Cycle Years Highlighted
19 6 019 9 4
1957* 201119 6 6 1970
20 01* 197819 62 19 8 4
1977* 19 8719 69* 195 620 0 0 20 05*
19 81* 20 0720 0 8 20 02 195 3* 20151974 1973* 19 9 0 19 92
1972195119 8 319 6 3197619 9 919 6719 9 6195 0
19 61*20 0 9*
19 85*19 8 0
19 91195520 0 319 9 8
19 89*2013*19 97*197519 95195 8195 4
19 6 8195920 0 4
19 4 919 65*197120141952197919 8 8201019 6 4201220 0 619 8 619 82
19 9 3
STOCKS
GEARS ARE TURNING, BUT PARTS MAY NEED GREASE
† The modern design of the S&P 500 stock index was first launched in 1957. Performance back to 1950 incorporates the performance of predecessor index, the S&P 90.
13
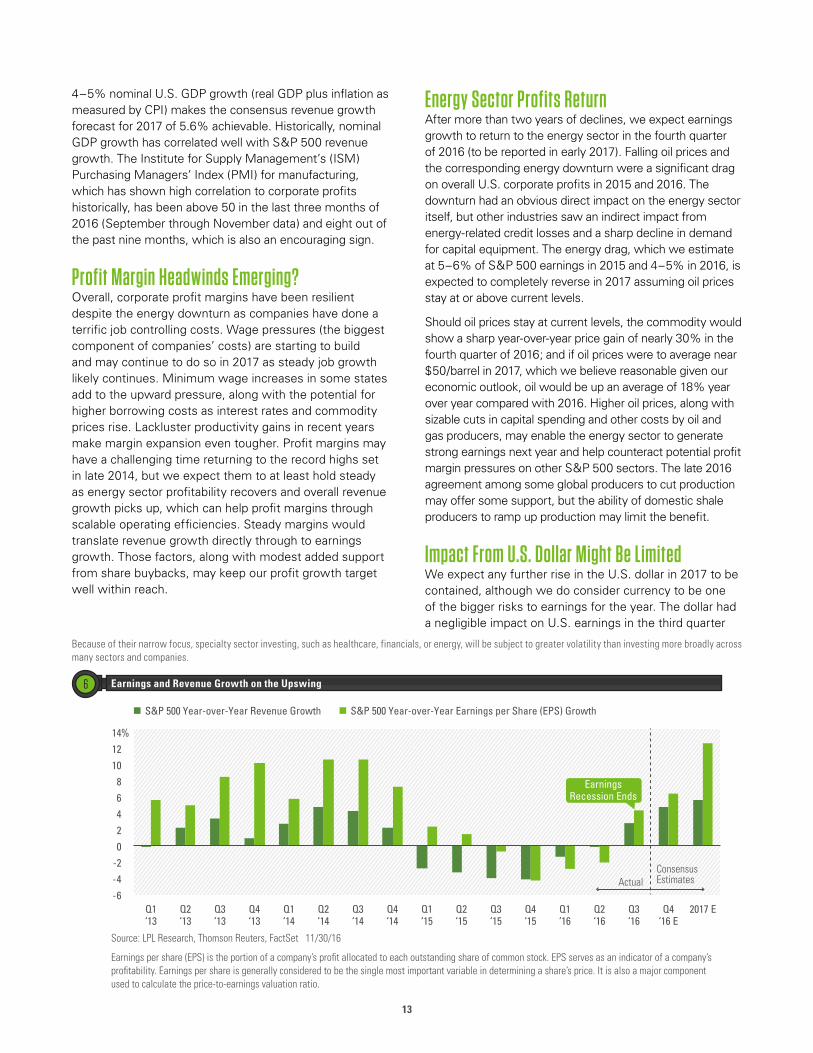
4 – 5% nominal U.S. GDP growth (real GDP plus inflation as measured by CPI) makes the consensus revenue growth forecast for 2017 of 5.6% achievable. Historically, nominal GDP growth has correlated well with S&P 500 revenue growth. The Institute for Supply Management’s (ISM) Purchasing Managers’ Index (PMI) for manufacturing, which has shown high correlation to corporate profits historically, has been above 50 in the last three months of 2016 (September through November data) and eight out of the past nine months, which is also an encouraging sign.
Profit Margin Headwinds Emerging?Overall, corporate profit margins have been resilient despite the energy downturn as companies have done a terrific job controlling costs. Wage pressures (the biggest component of companies’ costs) are starting to build and may continue to do so in 2017 as steady job growth likely continues. Minimum wage increases in some states add to the upward pressure, along with the potential for higher borrowing costs as interest rates and commodity prices rise. Lackluster productivity gains in recent years make margin expansion even tougher. Profit margins may have a challenging time returning to the record highs set in late 2014, but we expect them to at least hold steady as energy sector profitability recovers and overall revenue growth picks up, which can help profit margins through scalable operating efficiencies. Steady margins would translate revenue growth directly through to earnings growth. Those factors, along with modest added support from share buybacks, may keep our profit growth target well within reach.
Energy Sector Profits ReturnAfter more than two years of declines, we expect earnings growth to return to the energy sector in the fourth quarter of 2016 (to be reported in early 2017). Falling oil prices and the corresponding energy downturn were a significant drag on overall U.S. corporate profits in 2015 and 2016. The downturn had an obvious direct impact on the energy sector itself, but other industries saw an indirect impact from energy-related credit losses and a sharp decline in demand for capital equipment. The energy drag, which we estimate at 5 – 6% of S&P 500 earnings in 2015 and 4 – 5% in 2016, is expected to completely reverse in 2017 assuming oil prices stay at or above current levels.
Should oil prices stay at current levels, the commodity would show a sharp year-over-year price gain of nearly 30% in the fourth quarter of 2016; and if oil prices were to average near $50/barrel in 2017, which we believe reasonable given our economic outlook, oil would be up an average of 18% year over year compared with 2016. Higher oil prices, along with sizable cuts in capital spending and other costs by oil and gas producers, may enable the energy sector to generate strong earnings next year and help counteract potential profit margin pressures on other S&P 500 sectors. The late 2016 agreement among some global producers to cut production may offer some support, but the ability of domestic shale producers to ramp up production may limit the benefit.
Impact From U.S. Dollar Might Be LimitedWe expect any further rise in the U.S. dollar in 2017 to be contained, although we do consider currency to be one of the bigger risks to earnings for the year. The dollar had a negligible impact on U.S. earnings in the third quarter
Source: LPL Research, Thomson Reuters, FactSet 11/30/16
Earnings per share (EPS) is the portion of a company’s profit allocated to each outstanding share of common stock. EPS serves as an indicator of a company’s profitability. Earnings per share is generally considered to be the single most important variable in determining a share’s price. It is also a major component used to calculate the price-to-earnings valuation ratio.
Earnings and Revenue Growth on the Upswing6
141210
86420
-2-4-6
%
Q1‘13
Q2‘13
Q3‘13
Q4‘13
Q1‘14
Q2‘14
Q3‘14
Q4‘14
Q1‘15
Q2‘15
Q3‘15
Q4‘15
Q1‘16
Q2‘16
Q3‘16
Q4‘16 E
2017 E
S&P 500 Year-over-Year Revenue Growth S&P 500 Year-over-Year Earnings per Share (EPS) Growth
Consensus EstimatesActual
EarningsRecession Ends
Because of their narrow focus, specialty sector investing, such as healthcare, financials, or energy, will be subject to greater volatility than investing more broadly across many sectors and companies.

14
of 2016 and may only have a minimal negative impact in the fourth quarter of 2016, after reducing earnings by an estimated 4 – 5% during mid-2015 when the annual increase in the U.S. dollar index approached 20%. Should the dollar remain at current levels — at the high end of its recent range — the year-over-year change would average about 3% in 2017.
Earnings and ProtectionismS&P 500 firms derive a substantial amount of their revenue overseas in foreign currencies (we estimate 35 – 40%, on average), so a more protectionist U.S. trade policy could hurt corporate profits. Trump has expressed interest in using tariffs on imported goods from China and Mexico in support of fairer trade. It is difficult to predict how U.S. trade policy will play out, but we see Trump moderating his stance based on his desire to drive economic growth, which would be at odds with a strongly protectionist policy. Checks and balances in Congress, competing priorities, and the time involved in rewriting trade rules suggest the earnings risk from trade in 2017 would be manageable.
Elevated Valuations, But For How Long?Elevated stock market valuations are another risk to our forecast, but one we believe is only relevant in a scenario in which the market begins to, or actually does, price in a recession. The current PE of 18.7 (trailing four quarters) is above the long-term average of 15.2 going back to 1950, and even above the higher post-1980 average of 16.4.
We don’t see high valuations as a reason to sell, as they have not been good indicators of stock market performance over the subsequent year, as shown in Figure 7. The correlation between the S&P 500’s PE and the index’s return over the following year, at -0.31, is relatively low (based on 45 years of data). Stocks can stay overvalued longer than we might think they should, so we focus more on macroeconomic and fundamental factors for indications of an impending market correction or bear market.
How To InvestWe see similar performance between growth and value, with accelerating economic growth and improved financial sector performance, based on a steeper yield curve and reduced regulatory burden, favoring the value style while our sector views and relative valuations generally favor growth. Small caps may outperform early in 2017, due to the possibility of supportive policies and expanding bank credit under a Trump presidency. An aging business cycle may favor larger caps later in the year.
On a sector basis:
� Healthcare may benefit from a more benign regulatory environment.
� Technology valuations reflect overly pessimistic expectations based on assumed policy impact, and may present an attractive opportunity.
� Industrials may benefit from increased infrastructure spending.
� Reduced regulatory barriers and potentially higher oil prices support master limited partnerships, though rising interest rates carry risk.
Source: LPL Research, FactSet, Thomson Reuters 11/30/16Data are from 1970 to the present. The S&P 500 is an unmanaged index which cannot be invested into directly. Past performance is no guarantee of future results. The PE ratio (price-to-earnings ratio) is a measure of the price paid for a share relative to the annual net income or profit earned by the firm per share. It is a financial ratio used for valuation: a higher PE ratio means that investors are paying more for each unit of net income, so the stock is more expensive compared to one with lower PE ratio. Earnings per share (EPS) is the portion of a company’s profit allocated to each outstanding share of common stock. EPS serves as an indicator of a company’s profitability. Earnings per share is generally considered to be the single most important variable in determining a share’s price. It is also a major component used to calculate the price-to-earnings valuation ratio.
Little Relationship Between Stock Valuations and Short-Term Performance7
S&P 500 1-Year Return vs. S&P 500 PE %40
30
20
10
0
-10
-20
-30Current PE: 18.7
5 10 15 20S&P 500 PE Ratio
1-Ye
ar Fo
rwar
d S&
P 50
0 To
tal R
etur
ns
25 30

15
There are several politically sensitive sectors that may get a boost from a Trump presidency:
Energy. Trump will likely be positive for fossil fuels. He has promised less regulation on drilling, along
with expansion of drilling areas. Should oil and natural gas prices hold up, some pipelines may get built that would not have under Democratic leadership. Refiners may see easing ethanol requirements. Companies tied to energy infrastructure may also benefit. A risk is that increased production sends oil prices down and hampers sector performance.
Financials. The election outcome has put upward pressure on interest rates and steepened the yield
curve (the difference between short- and long-term interest rates), supporting bank profitability. Trump has indicated a desire to roll back financial regulations, including the Dodd-Frank Wall Street reform law. Implementation of the U.S. Department of Labor’s fiduciary standard for retirement plan accounts, slated for April 2017, could now be delayed, which could benefit the financial services industry. Finally, deregulation and infrastructure spending may boost bank lending.
Healthcare. Trump has stated his desire to repeal and replace the Affordable Care Act (ACA), which
could negatively impact the segments of healthcare that rely most on ACA-insured patients, such as hospitals. But with the form of the ACA’s potential replacement still unclear, it is uncertain how many people, if any, might
actually lose coverage. Lowering drug prices through regulatory action is unlikely to be a top priority for Trump, which is good news for pharmaceuticals and biotech stocks. And some health insurers, which have been experiencing widely reported profit pressures through the ACA exchanges, may benefit from an overhaul.
Industrials and materials. Trump has put infrastructure spending at the top of his agenda,
discussing numbers as high as $1 trillion in additional spending over 10 years. Within industrials, construction and engineering firms are poised to benefit, as are related materials companies. Industrials are also poised to benefit from increased defense spending, another emphasis of the Trump campaign. Less energy regulation may support the segment of industrials tied to energy infrastructure, and we expect fiscal policy to boost U.S. and perhaps global growth, also benefiting the sector. More restrictive trade policy would be a significant risk for these sectors.
Small caps. Lower corporate tax rates and other policies aimed at bringing jobs back to the U.S.,
a key campaign goal for Trump, are positive for small cap stocks. More bank lending is also positive because small companies are generally more dependent on bank credit. Conversely, small caps do not benefit as much as large caps if tax repatriation occurs since larger companies have more cash parked overseas.
Commodity returns may be competitive with equity market returns in 2017 as fiscal stimulus and stronger global growth potentially offset existing supply overhangs in the oil patch and certain other commodity markets. A stronger U.S. dollar is a risk to broad commodities prices, particularly gold.
The fundamental outlook for select oil and gas investments, including master limited partnerships, remains positive. Years of high prices until 2015 spurred successful exploration for oil, resulting in an oil glut. Barring a major geopolitical event, this oil glut will likely keep prices subdued — averaging below $60/barrel — through 2017. There will be winners even at these prices, such as the production, drilling, and service companies operating in low cost areas, notably West Texas. The late 2016 agreement by the Organization of Petroleum Exporting Countries (OPEC) and key non-OPEC oil producers to curtail production may provide some added support for oil prices, but the ability of U.S. oil producers to bring new production on line quickly is likely to prevent a major price increase.
Trump has promised to ease regulations on energy production, boosting the profitability of the companies involved. However, improving drilling economics and a looser regulatory environment may increase oil supply, limiting its potential price appreciation.
Industrial metals stand to benefit from more growth spurred by fiscal stimulus, specifically infrastructure spending that may boost prospects for metals, such as copper. Policy uncertainty remains high, but our bias is positive.
We see precious metal prospects as limited due to expectations of additional Fed rate increases and the potential for further U.S. dollar appreciation. Higher Treasury yields may dampen demand for precious metals as a safe haven investment. A more remote but positive scenario for precious metals involves a surge in inflation that may increase investor interest in gold.
Power Factor: Trump and Markets
Commodities Pulse
15

16
Reaching a milestone is often an accomplishment, but many milestones require some hardship to achieve. Such may be the case with the fixed income markets
in 2017. After achieving interest rate liftoff at December 2015’s FOMC meeting, the Fed was on hold for a year as slow growth, low oil prices, and the Brexit vote kept inflation low and increased economic uncertainty. The second rate hike at the December 2016 FOMC meeting may be the marker for the Fed to start gradually
normalizing interest rates in earnest from the emergency levels instituted post-financial crisis in 2009.
Immediately following the election of Trump and a Republican majority in both houses of Congress, interest rates rose, the Treasury yield curve steepened, and the market digested increased prospects of fiscal stimulus through spending and tax cuts and its potential impact on economic growth and inflation, two of the key drivers of interest rates. Higher rates of economic growth and inflation, along with our base case of two potential Fed rate hikes, would put bond prices under pressure in 2017, leaving most of the return potential for bonds in their income component, or “coupon.” Low and negative yields on sovereign bonds in international developed markets, however, may continue to put downward pressure on U.S. yields, limiting the future strength of the post-U.S. election run-up in rates as 2017 begins. The restraining effect of international rates could become larger if additional countries vote to leave the EU, as in the case of Brexit, potentially forcing the European Central Bank (ECB) to expand or extend quantitative easing. Nevertheless, for rates to decline meaningfully, we would likely need to see the onset of a recession in the U.S. in 2017, a scenario we believe to be unlikely.
Gauging Gradual Progress Despite our expectation for muted bond market performance in 2017, we continue to believe fixed income plays a vital role in a well-diversified portfolio. Even in a low return, low-yield environment, high-quality bonds serve as an important diversifier, helping to manage risk from equities and other higher risk asset classes. During equity market pullbacks since 2010, the S&P 500
Stock Market Peak to Trough
Duration (~Weeks)
S&P 500 Total ReturnBarclays Aggregate Bond Total Return
Difference
12/29/15 – 02/11/16 6 -11.8% 2.5% 14.3%
08/17/15 –0 9/28/15 6 -10.5% 0.3% 10.8%
09/18/14 – 10/15/14 4 -7.4% 2.1% 9.5%
05/21/13 – 06/24/13 5 -5.8% -3.1% 2.7%
09/14/12 – 11/14/12 9 -7.5% 1.2% 8.7%
04/02/12 –0 6/01/12 9 -9.9% 2.2% 12.1%
07/07/11 – 10/03/11 13 -18.8% 4.2% 23.0%
04/23/10 – 07/02/10 10 -16.0% 3.0% 19.0%
Average -11.0% 1.6% 12.6%
Source: LPL Research, Bloomberg, Standard & Poor’s, Barclays 11/30/16
All performance referenced is historical and is no guarantee of future results.
Bond Performance Relative to Equities Shows Diversifying Role of High-Quality Fixed Income8
BONDS
DESPITE LIFTOFFS, EXPECT MUTED BOND RETURNS

17
averaged a -11% total return, while the broad bond market returned 1.6%, on average [Figure 8]. Although this absolute return is not very exciting, the outperformance relative to equities (+12.6%, on average) demonstrates high-quality fixed income’s value as a risk mitigation tool.
Returns Losing Steam, Not BrokenScenario analysis for the broad bond market in 2017 shows the influence that interest rates can have on high-quality fixed income returns [Figure 9]. If Treasury yields are flat it would result in an estimated 3.1% total return. A 0.25% increase in intermediate-term Treasury yields could reduce the total return to an estimated 1.6%, while a 0.25% decrease could boost the broad bond market’s total return to 4.5% for the year. We expect the 10-year Treasury yield to end 2017 in its current 2.25 – 2.75% range, leaving bond prices near flat with the majority of their total returns driven by coupon income. Our bias is toward the upper end of the range, and we do see the potential for the 10-year Treasury yield to end the year as high as 3.0%, should meaningful fiscal stimulus be enacted. Even with that wider range, our return estimates for the broad bond market range from approximately 0.5% to 4.0%. This drives our expectation for the broad high-quality bond market’s “muted” return, relative to the 10-year average total return of 4.6% and 25-year average of 6.3%.
The onset of a U.S. recession or a major unexpected shock to the global economy could push rates lower and bond prices higher; however, prices on high-quality fixed income securities are more likely to be under pressure from several major sources in 2017.
� Fiscal stimulus. Long-term bond yields compensate investors primarily for the risk of not being invested in higher return opportunities related to economic growth and inflation (which eats away at real returns). The “term premium” in fixed income markets represents the additional compensation that investors demand for holding longer-term bonds relative to shorter-
term bonds. If Trump is able to pass fiscal stimulus measures, including tax cuts, through a united Congress, that term premium could continue to rise with the increased prospect of greater growth and higher inflation. This would push long-term yields higher, pressuring bond prices. In addition, at least one top rating agency has warned that should all of Trump’s proposed economic and fiscal policies be enacted, it would be negative for U.S. sovereign creditworthiness due to its impact on the deficit, which may also be putting upward pressure on yields.
� Ongoing Fed rate hikes. Fed rate hikes will likely push short-term interest rates higher in 2017. Though potentially painful for many fixed income investors, normalization of interest rate policy by the Fed is also a positive milestone for the health of the economy. Raising interest rates further will also give the Fed more tools at their disposal should the economic recovery sputter.
� Foreign selling. Foreign countries have been liquidating Treasuries during 2016 at a pace above that seen in recent years. Many foreign nations sell Treasuries to fund international payment obligations or to devalue their currencies in response to liquidity issues, export weakness, or defaults at home. Investors are less apt to hold longer duration Treasuries if they find Trump’s tariff proposals credible, due to the possibility of a trade war. Until clarity on U.S. trade policy is provided, we expect more volatility in the Treasury market.
� Increasing risk premiums due to political uncertainty. Trump’s policies are likely to be pro-business and anti-regulation, but his outsider status and complicated mix of priorities may increase policy uncertainty from the nation’s highest office. Investors demand additional compensation in the form of higher yields for the added risk. The more Trump’s plans are known and understood by markets, the lower this additional yield compensation may need to be.
Change in 10-Year Treasury Yield, % -0.75% -0.50% -0.25% 0.00% 0.25% 0.50% 0.75%
Total Bond Return, % 7.5% 6.0% 4.5% 3.1% 1.6% 0.2% -1.3%
Source: LPL Research, Barclays 11/30/16
Scenario analysis is based on an average coupon of 3.1% as of 11/30/16 for the Barclays Aggregate, based upon one-year time horizon, parallel shifts in the yield curve, no change to yield spreads, and no reinvestment of interest income.
This is a hypothetical example and is not representative of any specific situation. Your results will vary. The hypothetical rates of return used do not reflect the deduction of fees and charges inherent to investing.
Indexes are unmanaged and cannot be invested into directly.
Broad Bond Market Returns May be Muted in 20179
18
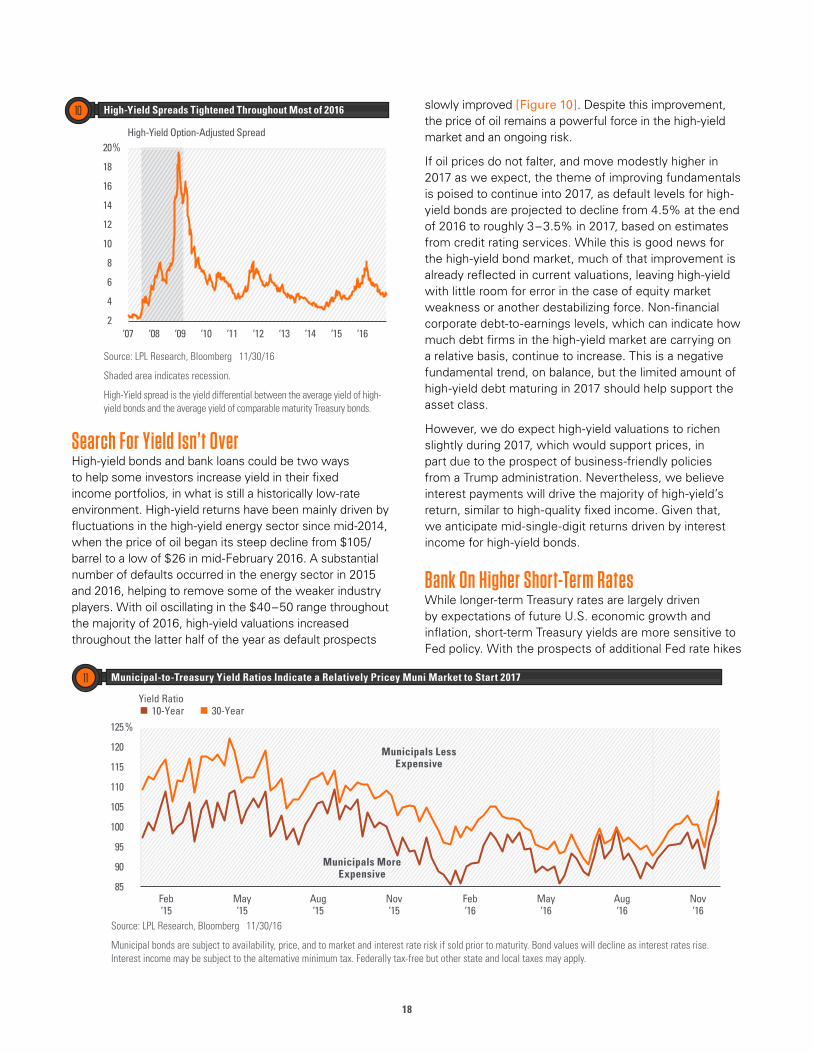
Search For Yield Isn’t OverHigh-yield bonds and bank loans could be two ways to help some investors increase yield in their fixed income portfolios, in what is still a historically low-rate environment. High-yield returns have been mainly driven by fluctuations in the high-yield energy sector since mid-2014, when the price of oil began its steep decline from $105/barrel to a low of $26 in mid-February 2016. A substantial number of defaults occurred in the energy sector in 2015 and 2016, helping to remove some of the weaker industry players. With oil oscillating in the $40 – 50 range throughout the majority of 2016, high-yield valuations increased throughout the latter half of the year as default prospects
slowly improved [Figure 10]. Despite this improvement, the price of oil remains a powerful force in the high-yield market and an ongoing risk.
If oil prices do not falter, and move modestly higher in 2017 as we expect, the theme of improving fundamentals is poised to continue into 2017, as default levels for high-yield bonds are projected to decline from 4.5% at the end of 2016 to roughly 3 – 3.5% in 2017, based on estimates from credit rating services. While this is good news for the high-yield bond market, much of that improvement is already reflected in current valuations, leaving high-yield with little room for error in the case of equity market weakness or another destabilizing force. Non-financial corporate debt-to-earnings levels, which can indicate how much debt firms in the high-yield market are carrying on a relative basis, continue to increase. This is a negative fundamental trend, on balance, but the limited amount of high-yield debt maturing in 2017 should help support the asset class.
However, we do expect high-yield valuations to richen slightly during 2017, which would support prices, in part due to the prospect of business-friendly policies from a Trump administration. Nevertheless, we believe interest payments will drive the majority of high-yield’s return, similar to high-quality fixed income. Given that, we anticipate mid-single-digit returns driven by interest income for high-yield bonds.
Bank On Higher Short-Term RatesWhile longer-term Treasury rates are largely driven by expectations of future U.S. economic growth and inflation, short-term Treasury yields are more sensitive to Fed policy. With the prospects of additional Fed rate hikes
Source: LPL Research, Bloomberg 11/30/16
Municipal bonds are subject to availability, price, and to market and interest rate risk if sold prior to maturity. Bond values will decline as interest rates rise. Interest income may be subject to the alternative minimum tax. Federally tax-free but other state and local taxes may apply.
Municipal-to-Treasury Yield Ratios Indicate a Relatively Pricey Muni Market to Start 201711
Yield Ratio
%125
120
115
110
105
100
95
90
85Feb‘15
May‘15
Aug‘15
Nov‘15
Feb‘16
May‘16
Aug‘16
Nov‘16
10-Year 30-Year
Municipals Less Expensive
Municipals MoreExpensive
Source: LPL Research, Bloomberg 11/30/16
Shaded area indicates recession.
High-Yield spread is the yield differential between the average yield of high-yield bonds and the average yield of comparable maturity Treasury bonds.
High-Yield Spreads Tightened Throughout Most of 201610
%20
18
16
14
12
10
8
6
4
2‘07 ‘08 ‘09 ‘10 ‘11 ‘12 ‘13 ‘14 ‘15 ‘16
High-Yield Option-Adjusted Spread

19
in 2017, short-term rates are poised to continue to move upward. One potential beneficiary is bank loans, which are similar to high-yield bonds in that they are below investment grade, but different in that they are generally less volatile and have interest payments that fluctuate based on global short-term interest rate benchmarks. Bank loans may represent a similar, but somewhat more conservative option than high-yield bonds for investors who seek yield while simultaneously mitigating interest rate risk. Bank loans are also less sensitive to the energy sector, which only represents approximately 3% of the bank loan market, compared to roughly 14% of the high-yield market. Although the yield of bank loans is lower than that of high-yield bonds and the prospects for capital appreciation are more limited, the sector remains a solid option for income for investors who understand their risks, in our view.
Municipal OutlookPost-election, as fixed income markets digested the economic implications of a Trump presidency, yields in the tax-sensitive municipal market began to spike, though not as much as Treasury yields, making relative valuations more expensive [Figure 11]. Prices should stabilize relative to Treasuries once the new administration clarifies its tax policy.
The overhang of underfunded pension liabilities may drive credit risk up in certain states until they shore up their fiscal positions. If Trump’s infrastructure plan necessitates borrowing by states and municipalities, excess supply could also pressure the municipal market in 2017, but this is another area where the impact cannot be fully evaluated until we have greater policy clarity.
How to InvestWe continue to favor intermediate-term bonds for 2017, with an emphasis on investment-grade corporates and mortgage-backed securities, given the backdrop of range bound interest rates. Lower-quality fixed income will likely be supported by business friendly policies, in line with our positive view on equities. Therefore, a small allocation to high-yield and/or bank loans may make sense for some investors.
Alternative investments have been challenged over the past few years, causing some investors to reconsider their allocations to these investments. We believe that there may still be a place for alternative investments as the market environment changes. By their nature, most alternative investments have relatively low, if not negative, correlations to both stocks and high-quality bonds. Given that the past few years can be characterized as a bull market in both of these areas, it is not surprising that alternative investments have had flat performance.
However, the future is not destined to mirror the past. We may be entering a period of lower returns for both bonds and stocks. Alternative investment managers with flexibility in their mandates may be able to find sources of additional return not available through traditional asset classes and strategies. This extra return may come with additional risks, such as reduced liquidity or a higher degree of volatility. There are a number of investment strategies that fall under the label “alternative” with different risk and return characteristics and not all may be appropriate for every market condition.
Master limited partnerships (MLP) are one non-traditional asset class that may be poised to deliver strong returns in 2017 after a relatively strong 2016. Notable tailwinds for the asset class include a pro-energy administration taking over the White House and a more balanced crude oil market. These factors may result in higher U.S. energy production, which should benefit pipeline MLPs. Growth opportunities also exist in the export market for various natural gas products. Interest rate risk is a consideration but, given the history of MLPs in rising rate periods, we don’t believe that this risk is as prevalent as with traditional “bond proxies,” such as real estate investment trusts (REIT) and utilities.
Alternative Investments: Ready for a Tune-Up?
Alternative strategies may not be suitable for all investors and should be considered as an investment for the risk capital portion of the investor’s portfolio. The strategies employed in the management of alternative investments may accelerate the velocity of potential losses.
Bank loans are loans issued by below investment-grade companies for short-term funding purposes with higher yield than short-term debt and involve risk.
20
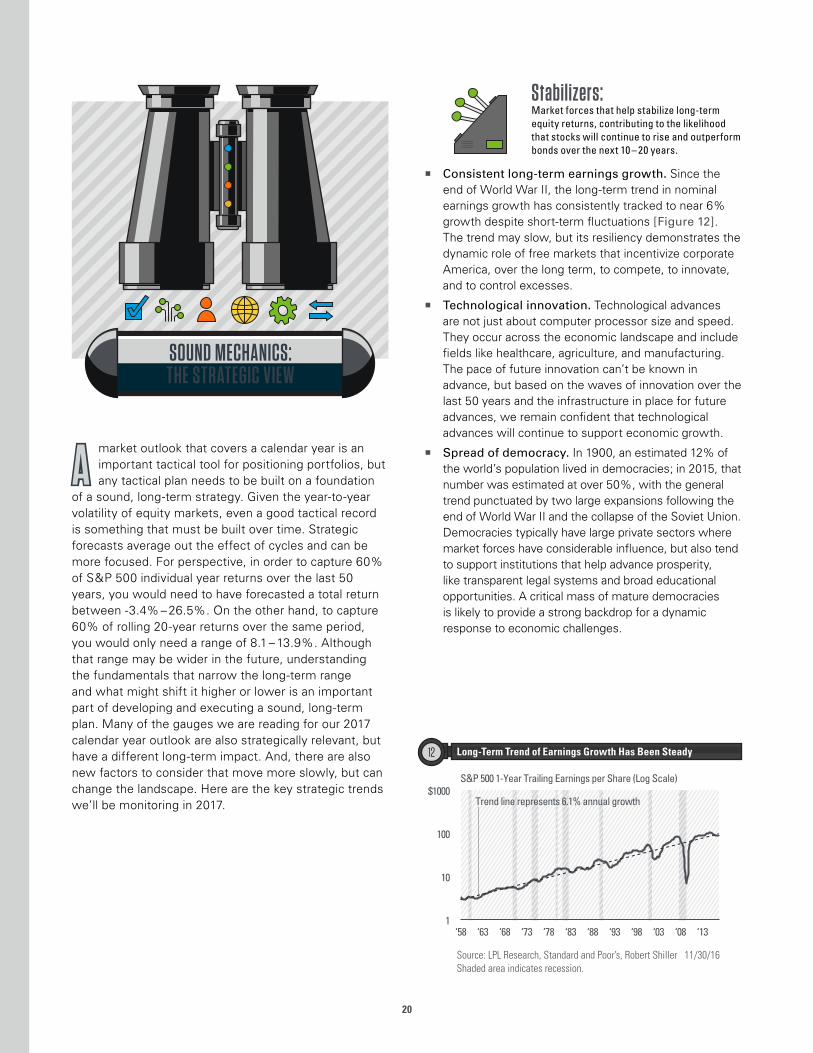
A market outlook that covers a calendar year is an important tactical tool for positioning portfolios, but any tactical plan needs to be built on a foundation
of a sound, long-term strategy. Given the year-to-year volatility of equity markets, even a good tactical record is something that must be built over time. Strategic forecasts average out the effect of cycles and can be more focused. For perspective, in order to capture 60% of S&P 500 individual year returns over the last 50 years, you would need to have forecasted a total return between -3.4% – 26.5%. On the other hand, to capture 60% of rolling 20-year returns over the same period, you would only need a range of 8.1 – 13.9%. Although that range may be wider in the future, understanding the fundamentals that narrow the long-term range and what might shift it higher or lower is an important part of developing and executing a sound, long-term plan. Many of the gauges we are reading for our 2017 calendar year outlook are also strategically relevant, but have a different long-term impact. And, there are also new factors to consider that move more slowly, but can change the landscape. Here are the key strategic trends we’ll be monitoring in 2017.
Stabilizers:Market forces that help stabilize long-term equity returns, contributing to the likelihood that stocks will continue to rise and outperform bonds over the next 10 – 20 years.
� Consistent long-term earnings growth. Since the end of World War II, the long-term trend in nominal earnings growth has consistently tracked to near 6% growth despite short-term fluctuations [Figure 12]. The trend may slow, but its resiliency demonstrates the dynamic role of free markets that incentivize corporate America, over the long term, to compete, to innovate, and to control excesses.
� Technological innovation. Technological advances are not just about computer processor size and speed. They occur across the economic landscape and include fields like healthcare, agriculture, and manufacturing. The pace of future innovation can’t be known in advance, but based on the waves of innovation over the last 50 years and the infrastructure in place for future advances, we remain confident that technological advances will continue to support economic growth.
� Spread of democracy. In 1900, an estimated 12% of the world’s population lived in democracies; in 2015, that number was estimated at over 50%, with the general trend punctuated by two large expansions following the end of World War II and the collapse of the Soviet Union. Democracies typically have large private sectors where market forces have considerable influence, but also tend to support institutions that help advance prosperity, like transparent legal systems and broad educational opportunities. A critical mass of mature democracies is likely to provide a strong backdrop for a dynamic response to economic challenges.
SOUND MECHANICS: THE STRATEGIC VIEW
Source: LPL Research, Standard and Poor’s, Robert Shiller 11/30/16Shaded area indicates recession.
Long-Term Trend of Earnings Growth Has Been Steady12
$1000
100
10
1‘58 ‘63 ‘68 ‘73 ‘78 ‘83 ‘88 ‘93 ‘98 ‘03 ‘08 ‘13
S&P 500 1-Year Trailing Earnings per Share (Log Scale)
Trend line represents 6.1% annual growth

21
Expect added friction:These factors have worked their way into the machinery and may lead to decreased returns over the next 10 – 20 years.
� Valuations. S&P 500 valuations, as measured by PE, are above average relative to history. A strong relationship exists between higher valuations and below-average long-term returns. Although a changing sector mix, low interest rates, and low inflation have likely raised the level of fair valuations, current valuations may put pressure on stock returns versus their long-term average over the next 10 or more years. The timing of this impact is difficult to estimate, and historically valuations have had no real significance for forecasting one-year returns [see Figure 7].
� Profit margins. As with valuations, a changing sector mix and technological developments have likely shifted the sustainable long-term level of profit margins higher, but companies may be running leaner now than is sustainable long term, based on the age of assets and low investment levels. In addition, long-term forces that have helped expand margins for decades, such as a large international supply of inexpensive labor, may be running their course as the global economy rebalances.
� Demographics. The ratio of the nonworking age population to the working age population is expected to continue to rise in every major developed economy over the next 25 years and beyond. An aging population provides some benefits that could partially offset slower growth of the workforce, but it does put pressure on other areas of the economy and is likely to weigh on growth.
� Monetary and fiscal policy “reserves.” Although there is capacity for further monetary or fiscal support if needed, both may have reached levels of diminishing returns regarding their overall economic impact. Even a neutral stance may limit growth compared with the multi-decade trend in global deficit spending and the loose monetary policy still in place across much of the globe.
Gauges to watch:A major change in these factors could meaningfully shift return expectations over the next 10 – 20 years, positively or negatively, and should be monitored.
� Productivity. Productivity growth slowed considerably during the Great Recession, and there are no signs yet of the trend reversing [Figure 13]. The reason for slower growth has been attributed to many sources, including declining returns from technological development, underinvestment, lost skills during the deep contraction in employment, and even mismeasurement. Productivity gains would have to play a key role in improving the growth trajectory of the economy and should remain under careful watch.
� Trade policy. The U.S. and other developed economies have generally favored increased trade liberalization since the end of World War II. More recently, global trends of increased populism have raised concerns about a return to protectionist policies that could lead to a trade war. While far from where we are now, increasingly restrictive trade policy could weigh on global growth and contribute to a significant rise in inflation. Free trade, however, is not an unqualified good and vigilance is required to make sure that free trade also remains fair trade.
� Geopolitical tensions. Geopolitics always remain a wild card for markets. Declining tensions may open markets and create a “peace dividend,” whereas rising tensions can restrict economic growth.
On balance, we believe the stabilizers will continue to fulfill their function, but frictional forces may lower the expected range of returns compared with the last 50 years, pulling it down an estimated 1 – 3%. There are gauges to watch that might mitigate or increase that shift. A longer timeline does also increase the chance that something unforeseen might occur or that something will come along that can change market dynamics. At the same time, markets and corporate America have been able to rebound from such high-impact global events as the Great Depression and World War II. Lower return expectations compared with the last 50 years increase the value of good planning and put a premium on the value of sound, conflict-free investment advice to help formulate a reasonable set of goals, understand potential returns and their risks, and, often most difficult, patiently execute that plan.
Source: LPL Research, U.S. Bureau of Labor Statistics 11/30/16Shaded area indicates recession.
Productivity Rebound Essential for a Better Growth Trajectory13
%4
3
2
1
0‘86 ‘88 ‘90 ‘92 ‘94 ‘96 ‘98 ‘00 ‘02 ‘04 ‘06 ‘08 ‘10 ‘12 ‘14 ‘16
Growth in U.S. Real Output per Hour (5-Year Average)

Milestones provide markers for the completion of one stage of a journey and the start of the next. They are a time to review progress and anticipate what’s ahead. Our outlook for 2017 requires gauging a
number of significant changes in short and long-term market trends and judging how financial markets, corporations, policymakers, and the broad economy might respond. 2016 saw imbalances and corrections, sentiment shifts, inaccurate political projections, and meaningful reversals in some asset classes. Looking ahead to 2017, we will be watching for accelerating economic growth, the extension of the earnings rebound, a steadier path toward interest rate normalization, and the impact of potential policy changes such as tax reform, increased government spending, deregulation, and a more aggressive trade stance. Only time will tell if the market’s post-election optimism is warranted, or if markets are pricing in too much too soon. But no matter what happens, we’ll continue to help you monitor the changes and keep your hands on the controls.
Individuals also have their own milestones: life events, educational and career accomplishments, major purchases, and many smaller milestones that represent personal achievements. When it comes to meeting investing goals, the truly important accomplishments are not particular portfolio values but the actions that help to create and maintain an achievable path to getting there, actions like meeting with a financial planner; setting up direct deposit for a retirement account; creating an education savings account; or making a first retirement withdrawal.
The significance of some of these milestones are only recognized looking back, when you can see the steps that you took to set yourself up for success. It starts with one change, which then becomes a lever for others, helping to put new connections in place and fuel best practices. Looking toward 2017, your advisor can help you read the gauges as wheels start turning on a possible mid-to-late cycle growth rebound, a new presidential cycle, and the efforts of corporate America to deliver profit growth. With conflict-free advice in hand, you’ll be able to calibrate your long-term financial plan in order to keep on course for reaching the milestones that are important to you.
22

IMPORTANT DISCLOSURES
The opinions voiced in this material are for general information only and are not intended to provide or be construed as providing specific investment advice or recommendations for any individual security. To determine which investments may be appropriate for you, consult your financial advisor prior to investing. All performance referenced is historical and is no guarantee of future results. All indexes are unmanaged and cannot be invested into directly.
Economic forecasts set forth may not develop as predicted, and there can be no guarantee that strategies promoted will be successful.
Investing in stock includes numerous specific risks including: the fluctuation of dividend, loss of principal, and potential illiquidity of the investment in a falling market.
Bonds are subject to market and interest rate risk if sold prior to maturity. Bond and bond mutual fund values and yields will decline as interest rates rise and bonds are subject to availability and change in price.
Investing in foreign and emerging market securities involves special additional risks. These risks include, but are not limited to, currency risk, political risk, and risk associated with varying accounting standards. Investing in emerging markets may accentuate these risks.
Investing in MLPs involves additional risks as compared with the risks of investing in common stock, including risks related to cash flow, dilution, and voting rights. MLPs may trade less frequently than larger companies due to their smaller capitalizations, which may result in erratic price movement or difficulty in buying or selling. MLPs are subject to significant regulation and may be adversely affected by changes in the regulatory environment, including the risk that an MLP could lose its tax status as a partnership. Additional management fees and other expenses are associated with investing in MLP funds.
Investing in real estate/REITs involves special risks such as potential illiquidity and may not be suitable for all investors. There is no assurance that the investment objectives of this program will be attained.
Government bonds and Treasury bills are guaranteed by the U.S. government as to the timely payment of principal and interest and, if held to maturity, offer a fixed rate of return and fixed principal value. However, the value of fund shares is not guaranteed and will fluctuate.
There is no guarantee that a diversified portfolio will enhance overall returns or outperform a non-diversified portfolio. Diversification does not ensure against market risk.
Investing in foreign and emerging markets debt securities involves special additional risks. These risks include, but are not limited to, currency risk, geopolitical and regulatory risk, and risk associated with varying settlement standards.
High-yield/junk bonds are not investment-grade securities, involve substantial risks, and generally should be part of the diversified portfolio of sophisticated investors.
DEFINITIONS
Purchasing Managers Indexes are economic indicators derived from monthly surveys of private sector companies, and are intended to show the economic health of the manufacturing sector. A PMI of more than 50 indicates expansion in the manufacturing sector, a reading below 50 indicates contraction, and a reading of 50 indicates no change. The two principal producers of PMIs are Markit Group, which conducts PMIs for over 30 countries worldwide, and the Institute for Supply Management (ISM), which conducts PMIs for the U.S.
The U.S. Institute for Supply Managers (ISM) manufacturing index is an economic indicator derived from monthly surveys of private sector companies, and is intended to show the economic health of the U.S. manufacturing sector. A PMI of more than 50 indicates expansion in the manufacturing sector, a reading below 50 indicates contraction, and a reading of 50 indicates no change.
Gross Domestic Product (GDP) is the monetary value of all the finished goods and services produced within a country’s borders in a specific time period, though GDP is usually calculated on an annual basis. It includes all of private and public consumption, government outlays, investments and exports less imports that occur within a defined territory.
Quantitative easing (QE) is a government monetary policy occasionally used to increase the money supply by buying government securities or other securities from the market. Quantitative easing increases the money supply by flooding financial institutions with capital in an effort to promote increased lending and liquidity.
INDEX DEFINITIONS
The U.S. Dollar Index (DXY) indicates the general international value of the U.S. dollar. The DXY Index does this by averaging the exchange rates between the US dollar and six major world currencies.
The S&P 500 Index is a capitalization-weighted index of 500 stocks designed to measure performance of the broad domestic economy through changes in the aggregate market value of 500 stocks representing all major industries.
The Barclays U.S. Aggregate Bond Index is a broad-based flagship benchmark that measures the investment-grade, U.S. dollar-denominated, fixed-rate taxable bond market. The index includes Treasuries, government-related and corporate securities, MBS (agency fixed-rate and hybrid ARM pass-throughs), ABS, and CMBS (agency and non-agency).
The MSCI Emerging Markets Index is a free float-adjusted, market capitalization index that is designed to measure equity market performance of emerging markets.
The MSCI EAFE Index is a free float-adjusted, market-capitalization index that is designed to measure the equity market performance of developed markets, excluding the United States and Canada.
23

www.lpl.com
RES 5728 1216Tracking #1-564062 (Exp. 12/17)
This research material has been prepared by LPL Financial LLC.
To the extent you are receiving investment advice from a separately registered independent investment advisor, please note that LPL Financial LLC is not an
affiliate of and makes no representation with respect to such entity.
Not FDIC/NCUA Insured | Not Bank/Credit Union Guaranteed | May Lose Value Not Guaranteed by Any Government Agency | Not a Bank/Credit Union Deposit
Member FINRA/SIPC