melanoma image segmentation using self organized features maps
TRANSCRIPT

Melanoma Image Segmentation Using Self Organized Feature Maps
Anirudh MunnangiGraduate Student EECS
University of [email protected]
Overview• Outline of Skin Cancer Detection
• Literature Survey
• Motivation
• Problem Formulation
• SOFM Model
• Model Fitting
• Simulation Results
• Conclusion
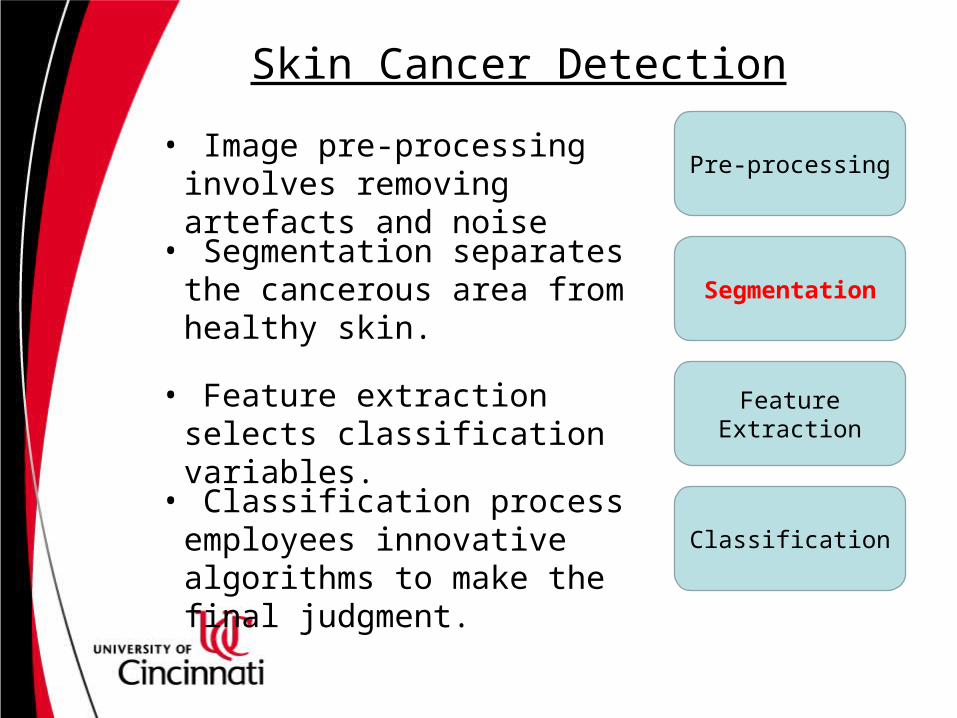
Pre-processing• Image pre-processing involves
removing artefacts and noise
Segmentation• Segmentation separates the
cancerous area from healthy skin.
Feature Extraction• Feature extraction selects
classification variables.
Classification• Classification process
employees innovative algorithms to make the final judgment.
Skin Cancer Detection

• Image Processing Models:Adaptive thresholdingFuzzy C means approachRegion growing/merging algorithmsOtsu’s method
• Neural Network Models:MLP using back propagationRadial basis networksUsage of binary image for learning phase
Relevant Literature

• Simple, easy to implement algorithm• Quite novel, no reference in literature• Clustering and segmentation relation• Gray-Scale advanced model• Quite good comparative performance• Scope for further training
Motivation for SOFM

• Effective segmentation • Problems if cancerous area is missed• Role in the detection process• Pixels can be color/grayscale• Computational parameters• Scalability in images
Problem Formulation

Inputs
Neuron Field/Map Each Neuron is connected to all the inputs by weights.
Inputs are binary values; generation is discussed in future slides.
SOFM Model

Learning in SOFM
Courtesy of Ali A Minai, Professor, University of Cincinnati
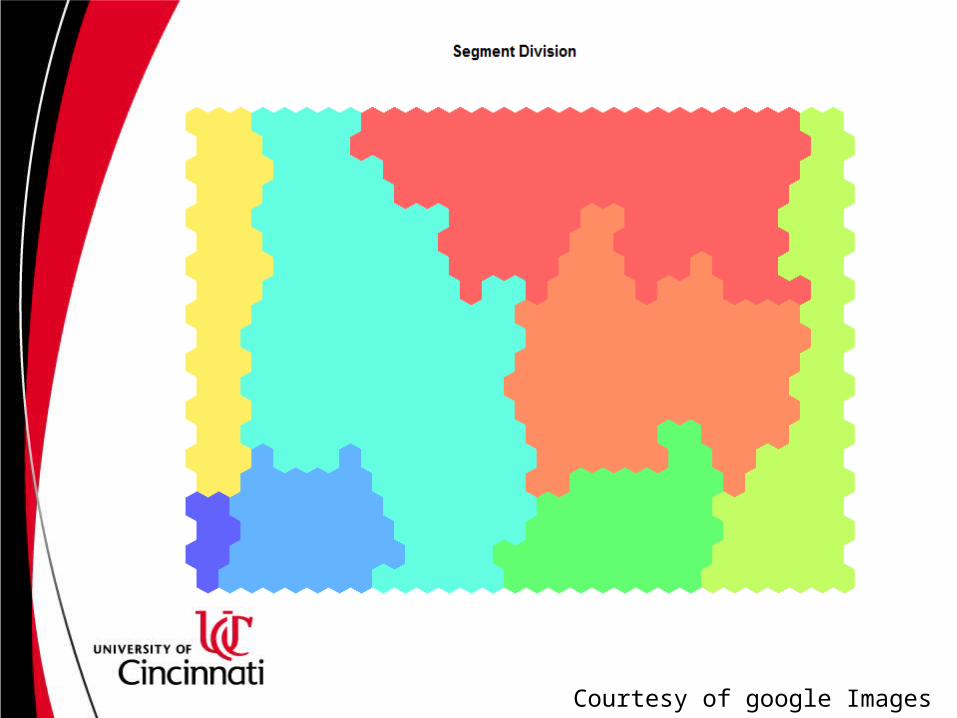
Courtesy of google Images

• All images are of fixed size 150x200.• Each pixel is treated as a Neuron.• Input is a 1x26 vector.• First 8 elements are X coordinate in binary.• Second 8 elements are Y coordinate in binary.• Third 8 elements are grayscale value in binary.• Last two elements are [1,0] or [0,1] for
cancerous/non cancerous pixel.• While testing; the last two elements are [0,0]
Model Fitting

• Inp_Vec (A) = [01001011 01001011 11111111 10]• Inp_Vec (B) = [10000010 10100000 00101000 01]
A255/ Yes
Y75
X75
B40/No X130
Y160
Model Fitting Sample

Evaluation Parameters
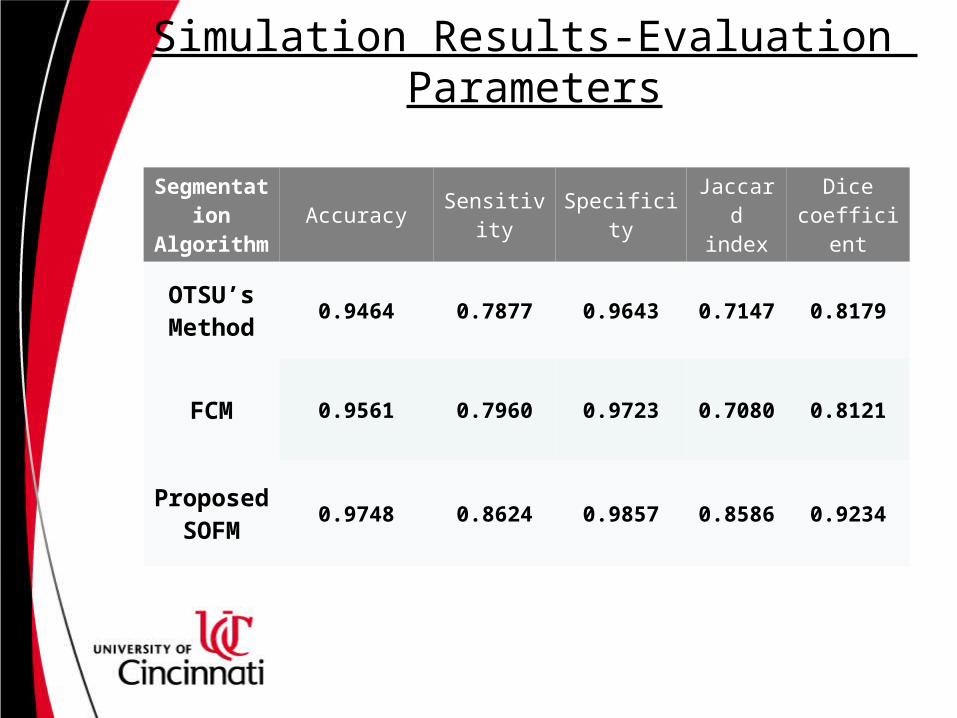
Segmentation
AlgorithmAccuracy Sensitivity Specificity Jaccard
indexDice
coefficient
OTSU’sMethod 0.9464 0.7877 0.9643 0.7147 0.8179
FCM 0.9561 0.7960 0.9723 0.7080 0.8121
Proposed SOFM 0.9748 0.8624 0.9857 0.8586 0.9234
Simulation Results-Evaluation Parameters

Simulation Results-Images

Simulation Results- Evaluation Trends

• Better results are generated.• Evaluation parameters converge in a well behaving
way.• Performs well on an entirely novel test data.• Easy to implement algorithm.• Computational time is high. Once training is done,
results are good.• Can result in slow performance when scaled to
higher resolution images.
Conclusion

Thank you !!