megha tropiques (gp retrieval and applications plan) vijay k. agarwal, mog/sac oct. 17-20, 2005
TRANSCRIPT

Megha Tropiques
(GP Retrieval and Applications plan)
Vijay K. Agarwal, MOG/SAC
Oct. 17-20, 2005

MT- Utilization Plan: Themes• Geo-Physical Retrievals and validations• Synergy of data from different sources & value addition• Scientific Studies
– Convective systems
– Cloud-Radiation interaction
– Data assimilation in models
– Air-sea interaction
• Applications on semi-operational level– Synoptic studies– Near real time applications in weather forecast– Ocean state forecast– Land applications

Geo-physical Retrieval Components
• MADRAS – Simulation studies using Radiative Transfer– Basic algorithms for retrieval of rainfall and other GPP– Validation experiments using TRMM
• SAPHIR– Simulations using RT– Experiments with AMSR, ATOVS data
• ScaRAB– Experiments with ERBE data– Experiments with NOAA derived radiative fluxes

MADRAS Retrievals• RT simulations continued using a data base from
TRMM and PR for more than three years on optimum spatial and temporal scales.
• First version of rainfall using integrated Scattering Index (SI) and Polarization Corrected Temperature (PCT) methods in final stages of testing using DWR observations.
• Work has been initiated for blending Geo-St. IR and polar orbiting MW observations from INSAT & TRMM.
• Algorithm for inversion of MT measurements for WV and other geo-physical parameters based on Bayesian approach

COMPARISON OF RAINFALL FROM NASA, PR & PRESENT ALGORITHMS
NASA TMI RAINRATE NASA PR RAINRATE
TMI RAINRATE (PRESENT ALGORITHM)
OCTOBER 10, 2002

VALIDATIONS: TRMM VS. DWR RAINFALL
0 10 20 30 40 50 60D WR R ain R ate (m m / h)
0
10
20
30
40
50
60
TM
I R
ain
Rat
e (m
m/h
)
C om parison of T M I and D WR rain rates (17 O ctober 2002)R (TM I) = 0 .68 R (DWR) - 3 .83N o. of P ts.= 460r=0.80bias= -7 .99 m m / hrm s diff=10.12 m m / hrm s after bias rem oval=6.31 m m / h
OCTOBER 17, 2002
NASA-GPR OF RAINFALL PRODUCT

TMI DERIVED GEOPHYSICAL PARAMETERS) OVER LAND (03/06/2003-15GMT)

SAPHIR: Humidity profile
• Emission based RT simulations using simulated atmospheres
• Retrievals using Statistical & EOF techniques
• Improvement in lower level humidity profile through total water vapour content
• Impact of viewing geometry & surface contamination on retrievals
•At nadir view with dry atmosphere, the low freq channels are contaminated by surface contributions
•At oblique view with moist atmosphere, the low freq channels are less sensitive to boundary layer humidity which contributes the most to many meteorological & oceanographic processes

SAPHIR CHANNELS’ RESPONSE (NADIR VIEW)
At nadir view with dry atmosphere, the low freq channels are contaminated by surface contributions
Dry Atmosphere Moist Atmosphere
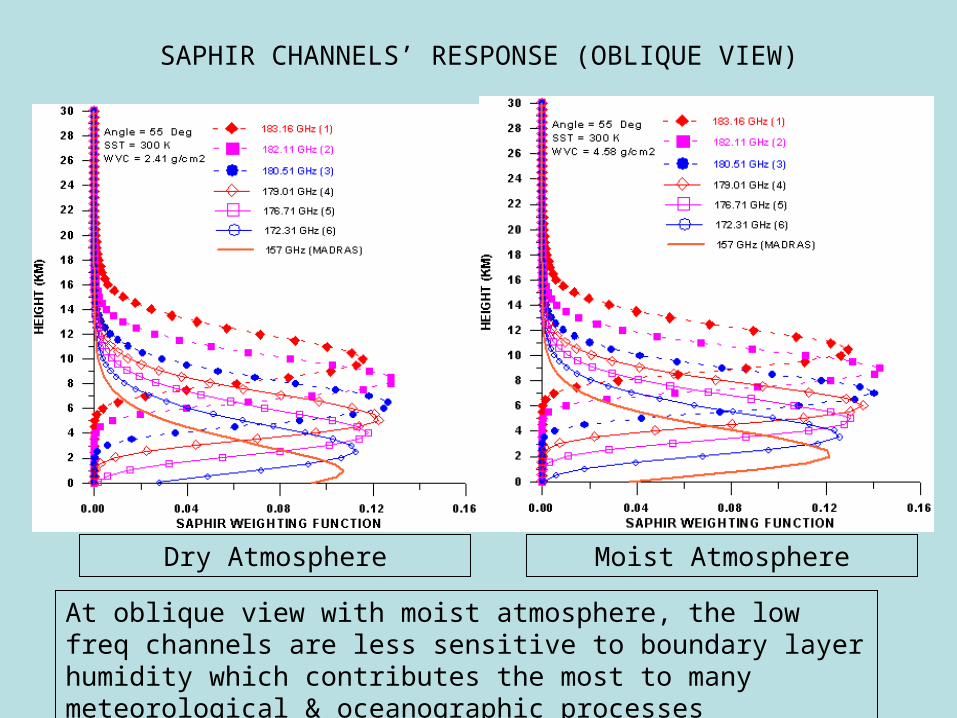
SAPHIR CHANNELS’ RESPONSE (OBLIQUE VIEW)
At oblique view with moist atmosphere, the low freq channels are less sensitive to boundary layer humidity which contributes the most to many meteorological & oceanographic processes
Moist AtmosphereDry Atmosphere

ATMOSPHERIC HUMIDITY PROFILE FROM AMSU-B DATA
}{ .exp1
,,0 i
Ni
i
pipp TBLARH AA
RETRIEVAL MODEL FOR LAYER AVERAGED RELATIVE HUMIDITY
Date: 9 June, 2002: 0711 GMT
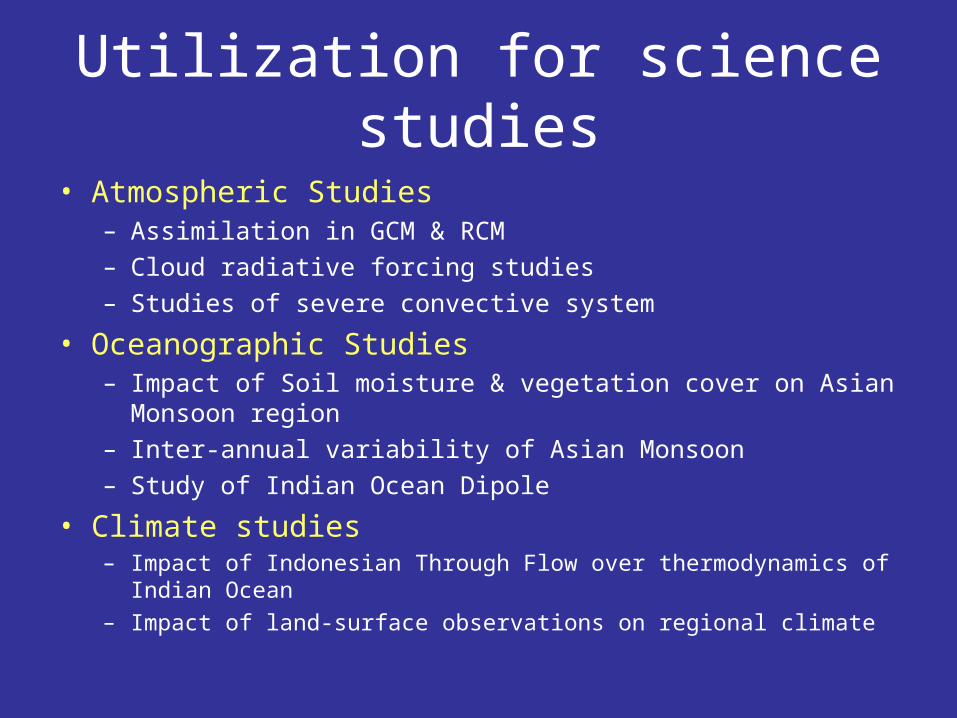
Utilization for science studies
• Atmospheric Studies – Assimilation in GCM & RCM
– Cloud radiative forcing studies
– Studies of severe convective system
• Oceanographic Studies– Impact of Soil moisture & vegetation cover on Asian Monsoon
region
– Inter-annual variability of Asian Monsoon
– Study of Indian Ocean Dipole
• Climate studies– Impact of Indonesian Through Flow over thermodynamics of Indian
Ocean– Impact of land-surface observations on regional climate

Atmospheric studies

Data Assimilation in Atmospheric Models
NCEP Analysis
Assimilation of MSMR-derived soil moisture in ERMP model
(July 2001)
Control Run SM assimilation
Rainrate (mm/day)
Assimilation of scatterometer winds in MM5
(PSLV-C3 Launch October 2001)
Control
Quikscat
Analysis
CMV & Q-Scat winds in GCM & MM5
Rainfall in GCM
Soil moisture in GCM
(Singh et al)

-25 -20 -15 -10 -5 0 5
-80
-60
-40
-20
0
20Y = -5.95 +1.8 X
R = 0.48
NCRF
Velocity (ms-1)
0
30
60
90
120
150
180Y = 51.3 - 1.2 X
R = -0.37
LCRF
Clo
ud R
adia
tive
Forc
ing
(Wm
-2)
-180
-150
-120
-90
-60
-30
0Y = -56.6 + 3.03 X
R = 0.56
SCRF
SCRF Vs Wind
LCRF Vs Wind
NCRF Vs Wind
Association between Jet speed and Cloud Radiative Forcing
For a 10 m/s increase in the speed of jet
SCRF increases by 30Wm-2
LCRF increases by 12 Wm-2
NCRF increases by18 Wm-2

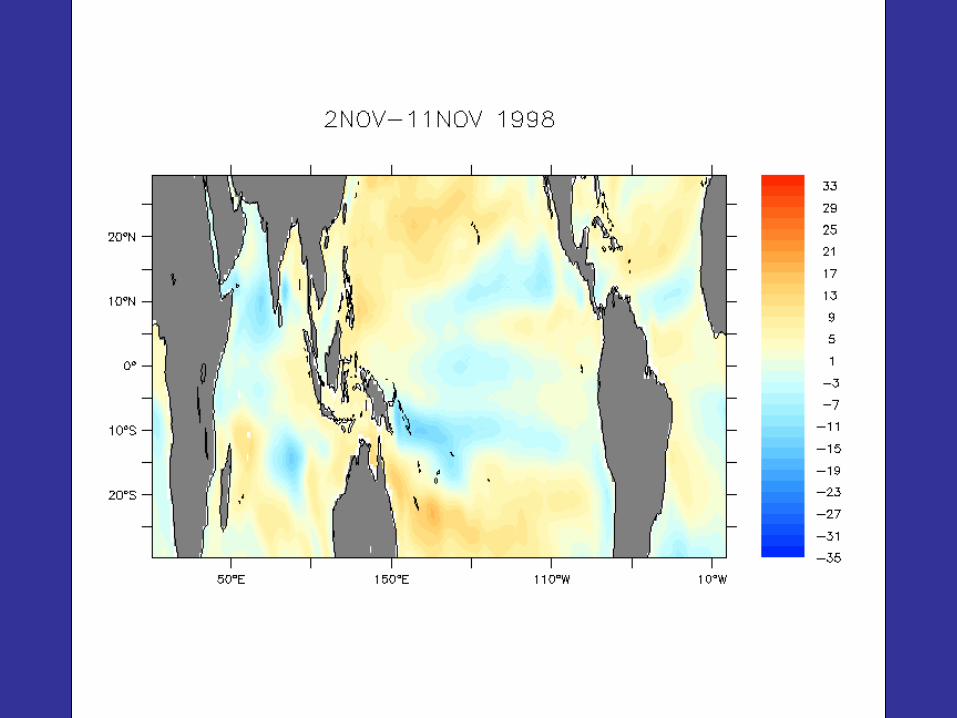
Oceanographic studies
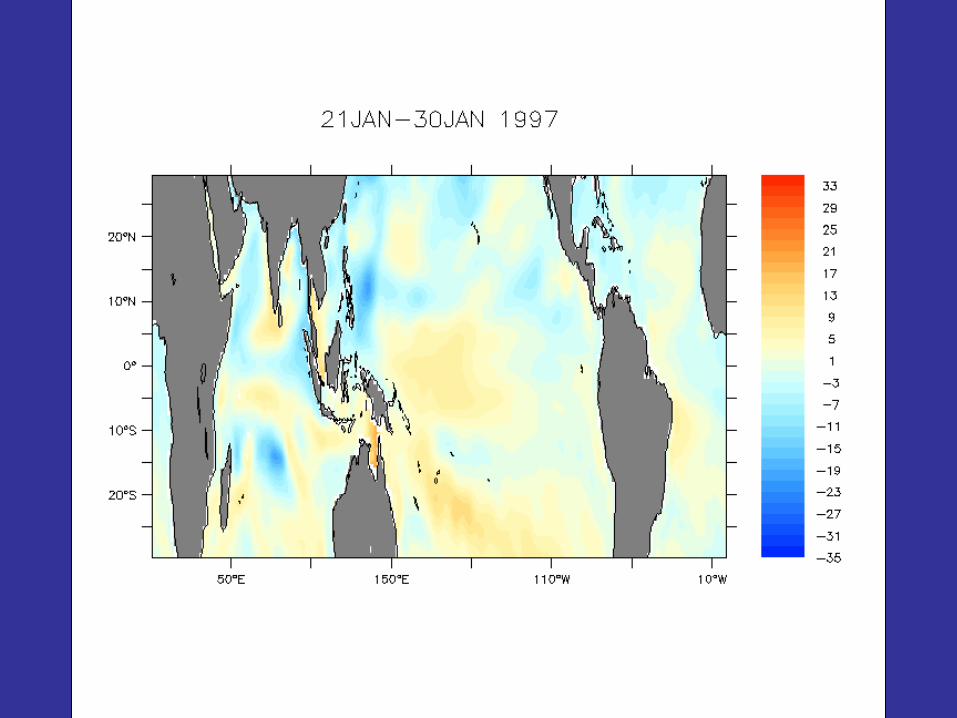
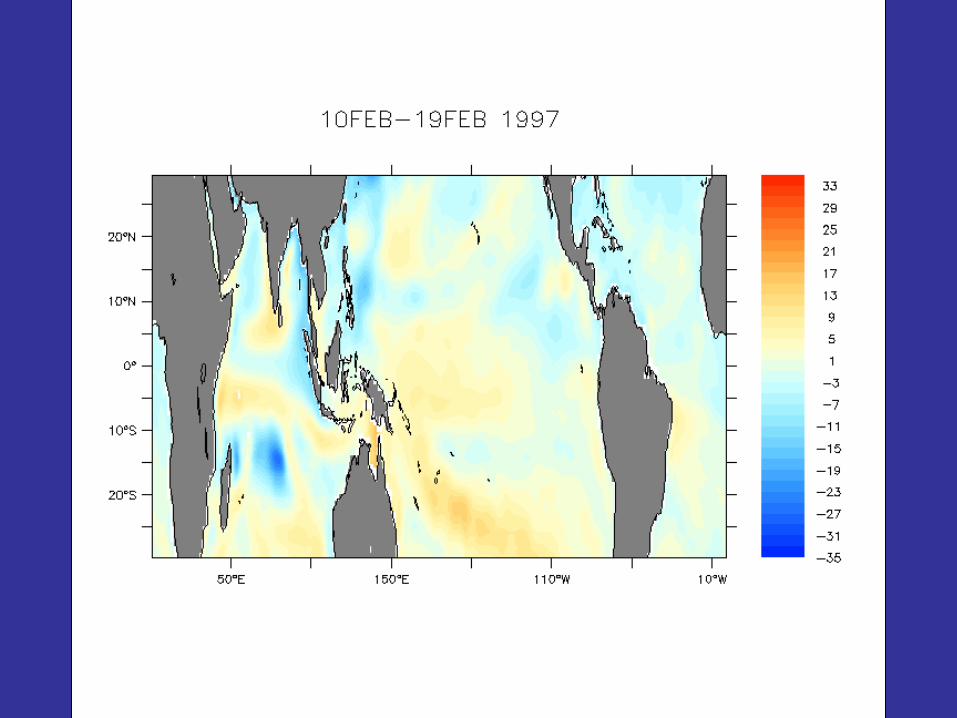
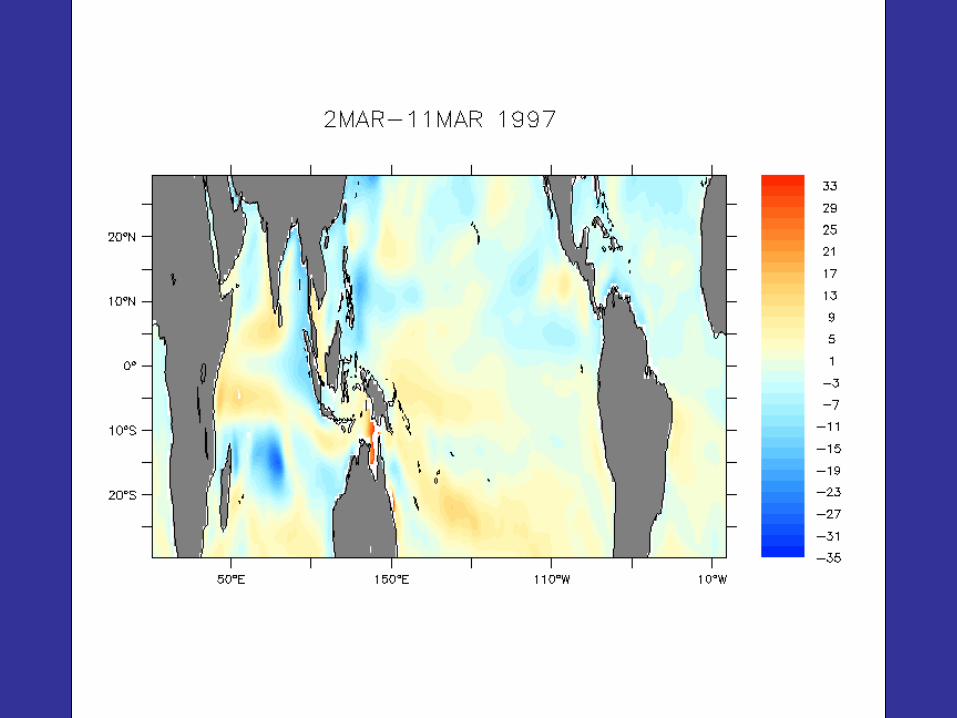
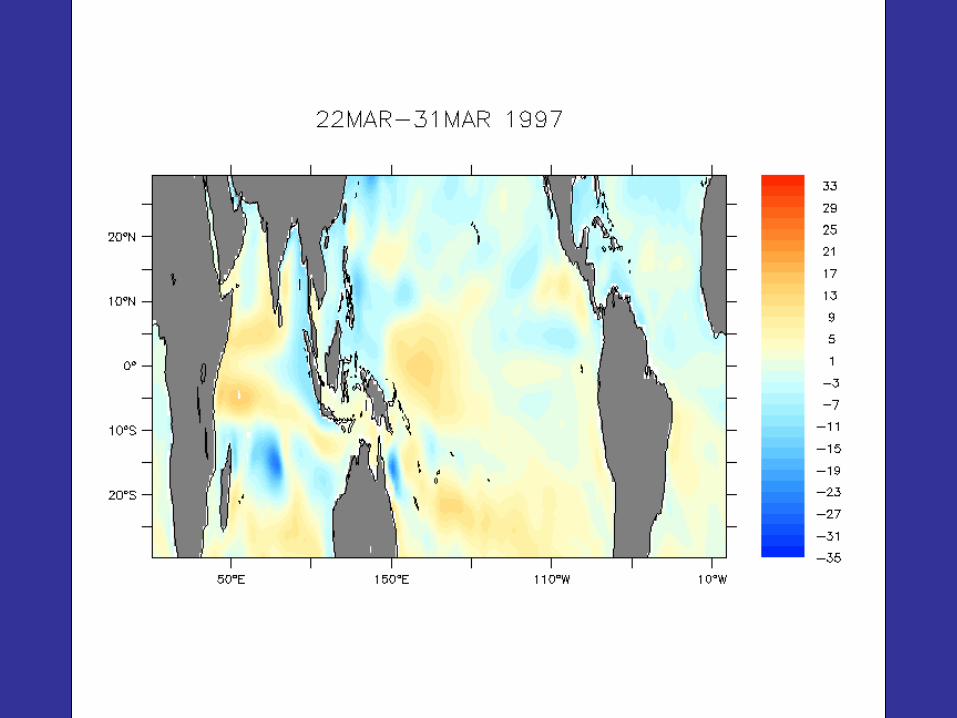
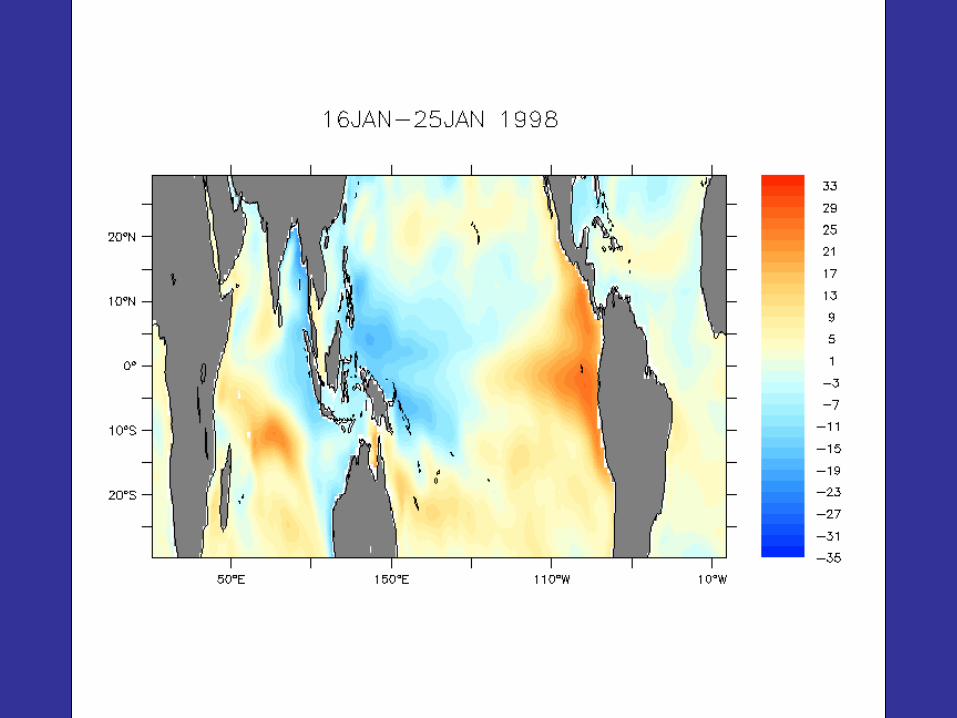
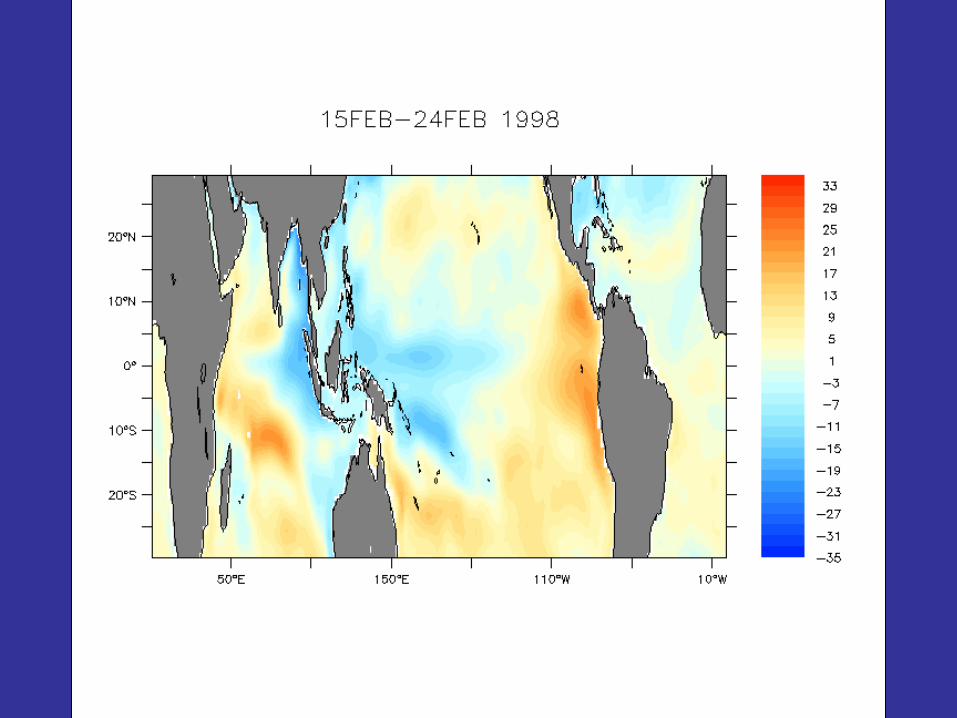
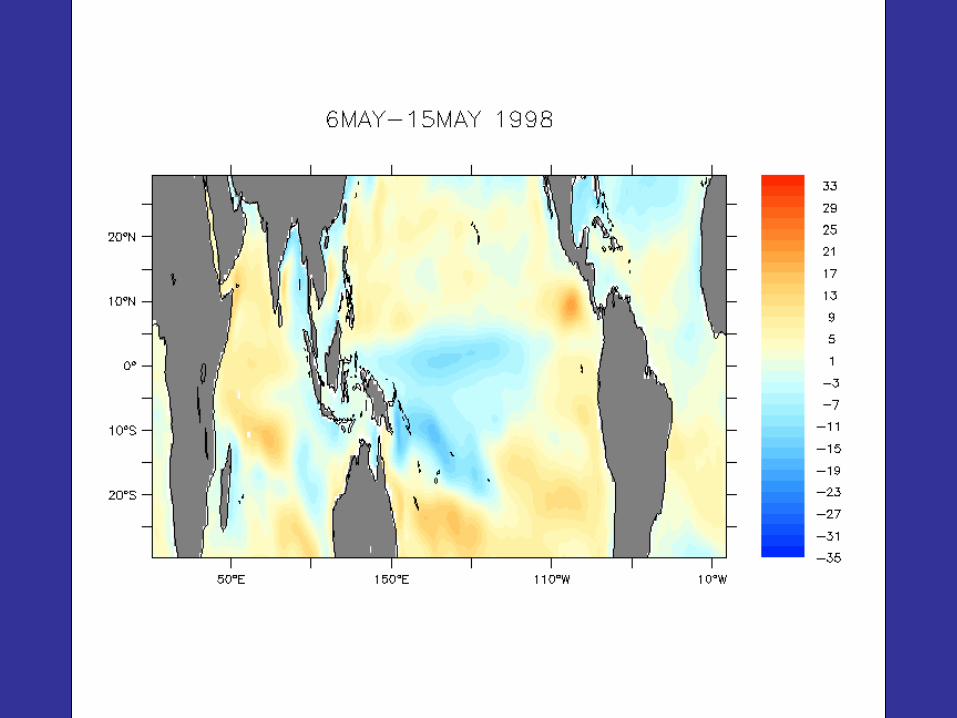
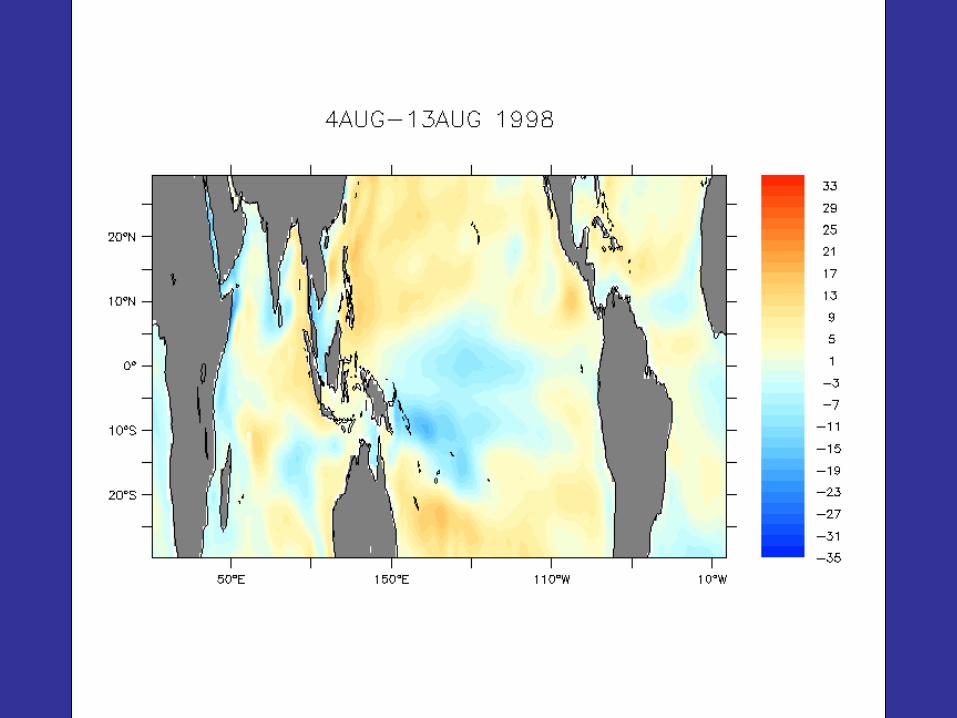
Studies of IO, El-Nino
Fresh water flux
Radiative & heat fluxes

Data Assimilation in Ocean Models
• Ocean state using SACMOM
• Monsoon variability using AGCM
•Cyclone simulations using MM5
•Coupled ocean-atmosphere models
SST ANOMALY SEP-DEC 1997

Relative performance of the model using the two wind products
From 1997 till 1999 The model is forcedwith NCEP and then till 2004 with scatterometer winds
Buoy
Model
SST
D20 Isotherm

Errors in SW Fluxes: NCEP (61 watts/m2 ),
LY (37 watts/m2 ) and OLR-based (45 watts/m2)
Wa
tts/
m2
LY
OLR
NCEP
Time Variation of SW Radiation in central Bay of Bengal
Experiment 2: Impact of Shortwave Radiation on model simulations

Climatic studies
Impact of land usage

Model Simulated Rainfall (cm) For July 1998
TRMM Observed Rainfall (cm)Model Simulated Rainfall (cm) For July 1998
TRMM Observed Rainfall (cm)

Applications Demonstration
• Synoptic studies– Weather forecast– cyclone studies
• Ocean State Forecast• Land applications
– Applications in agro-meteorology– Variation of land surface emissivities
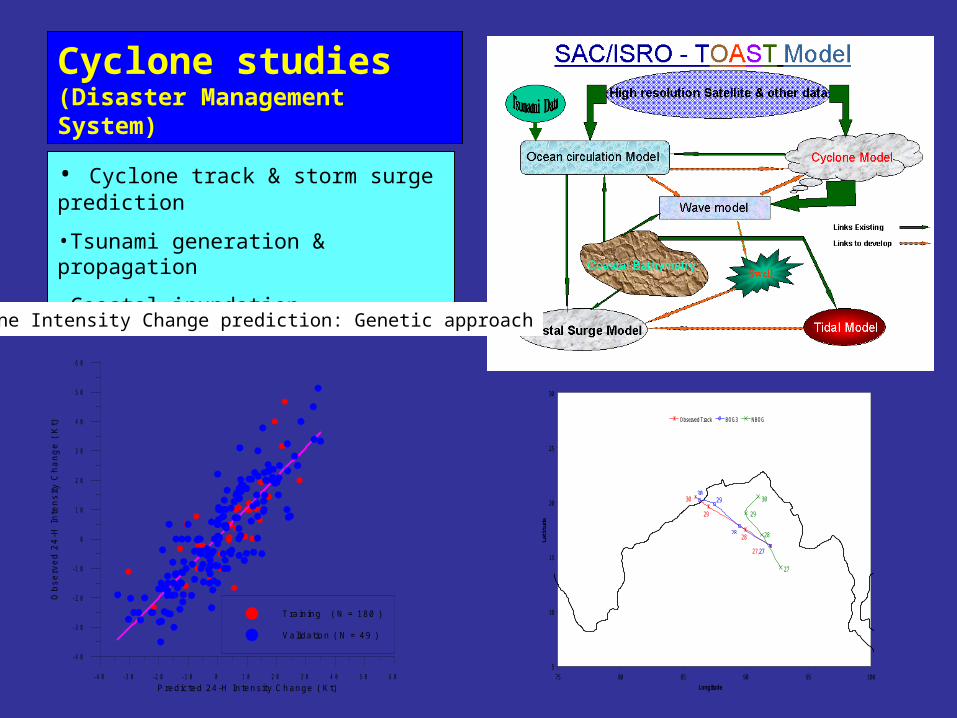
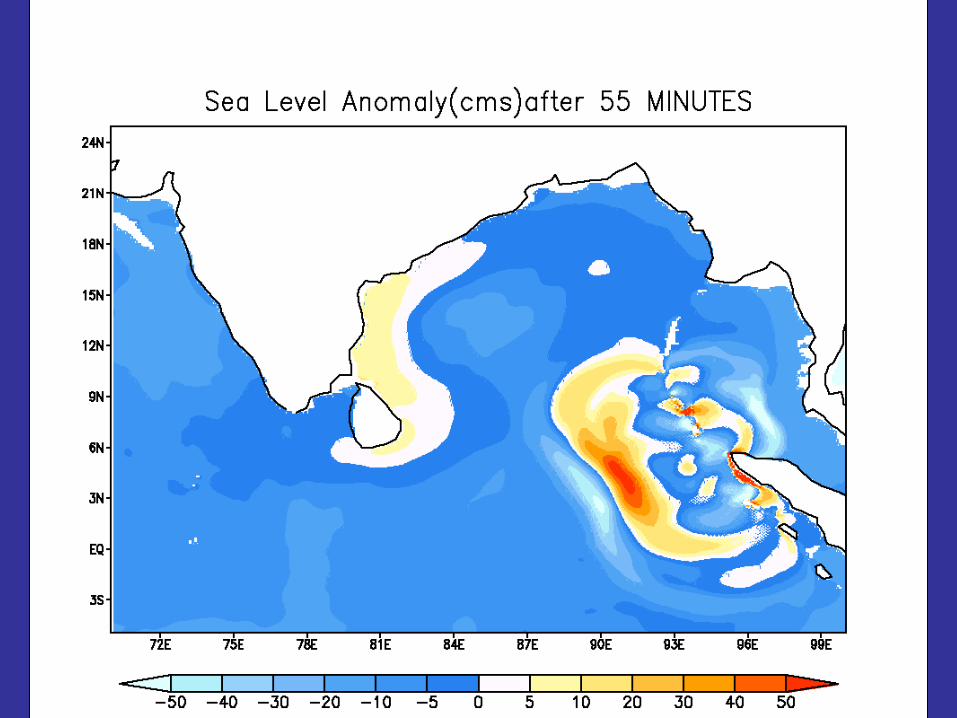
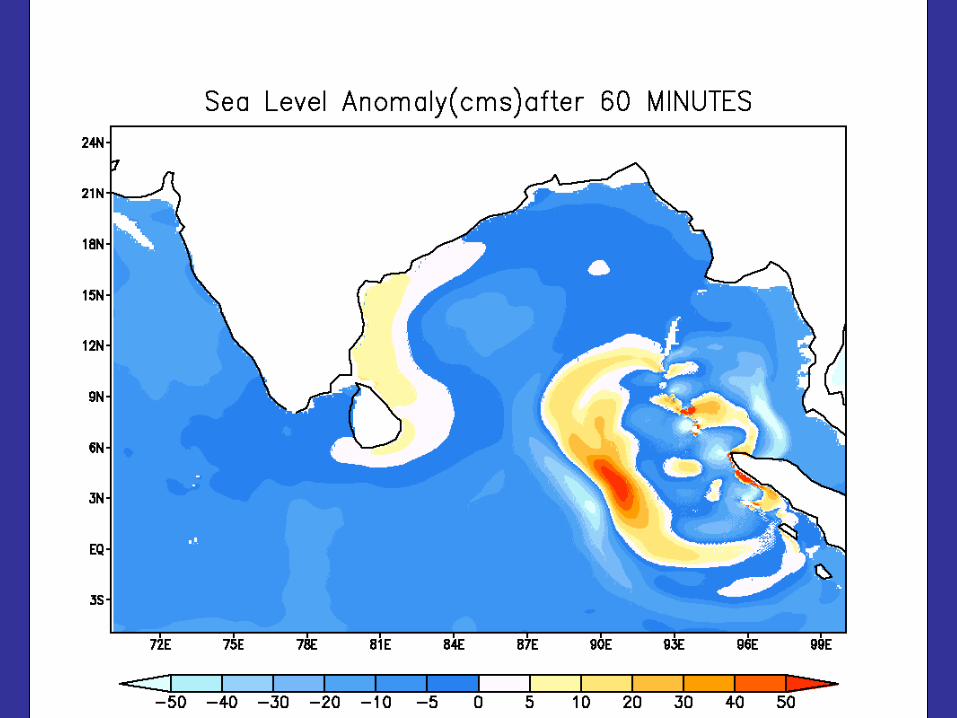
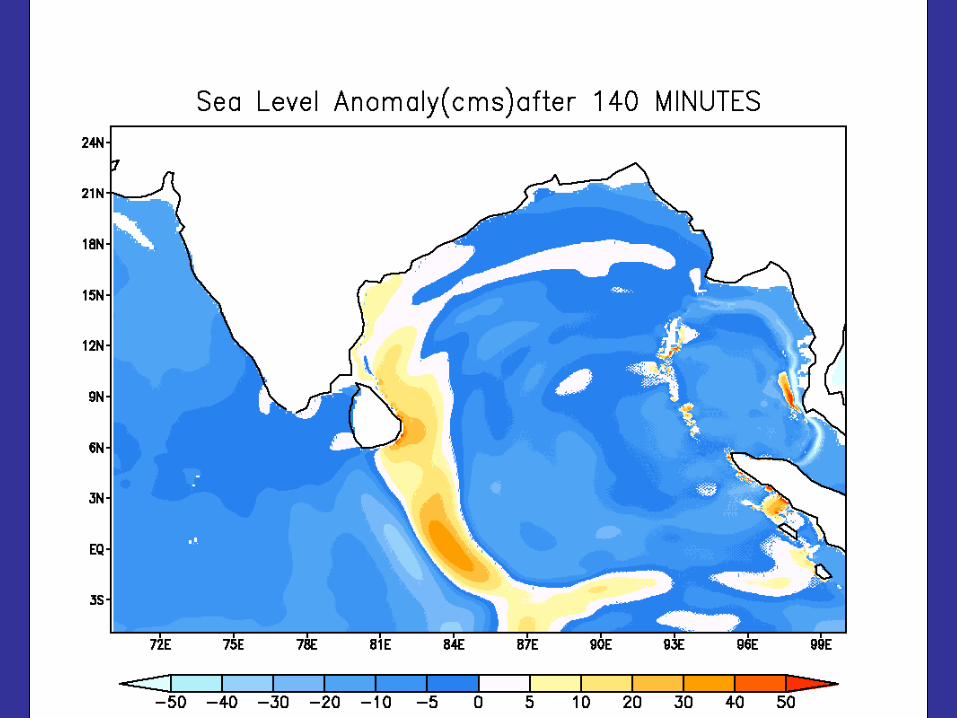
Cyclone studies (Disaster Management System)
• Cyclone track & storm surge prediction
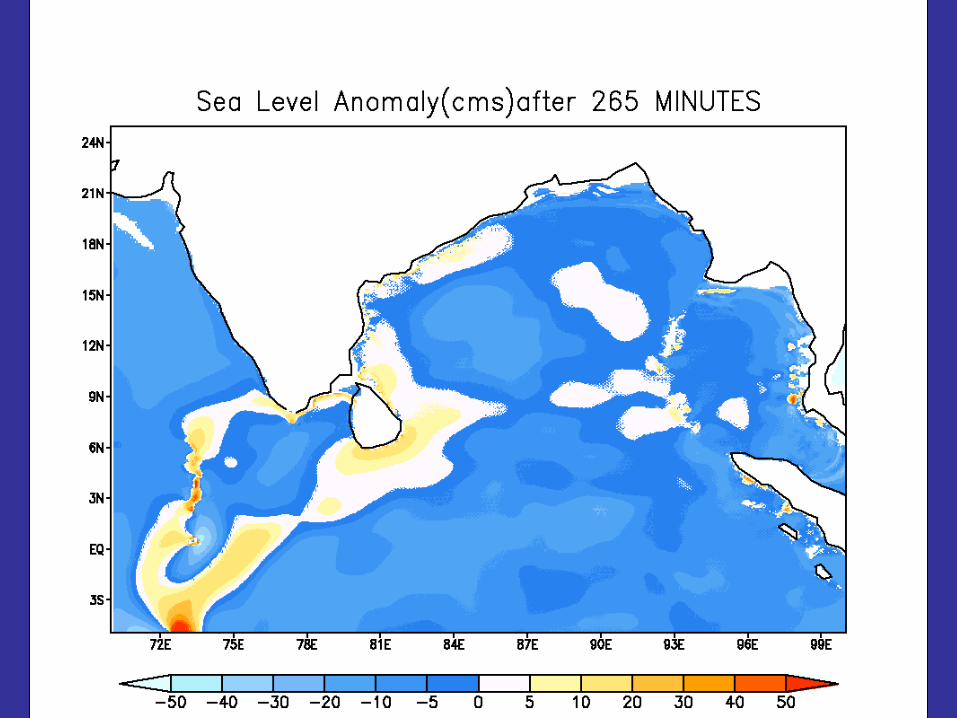
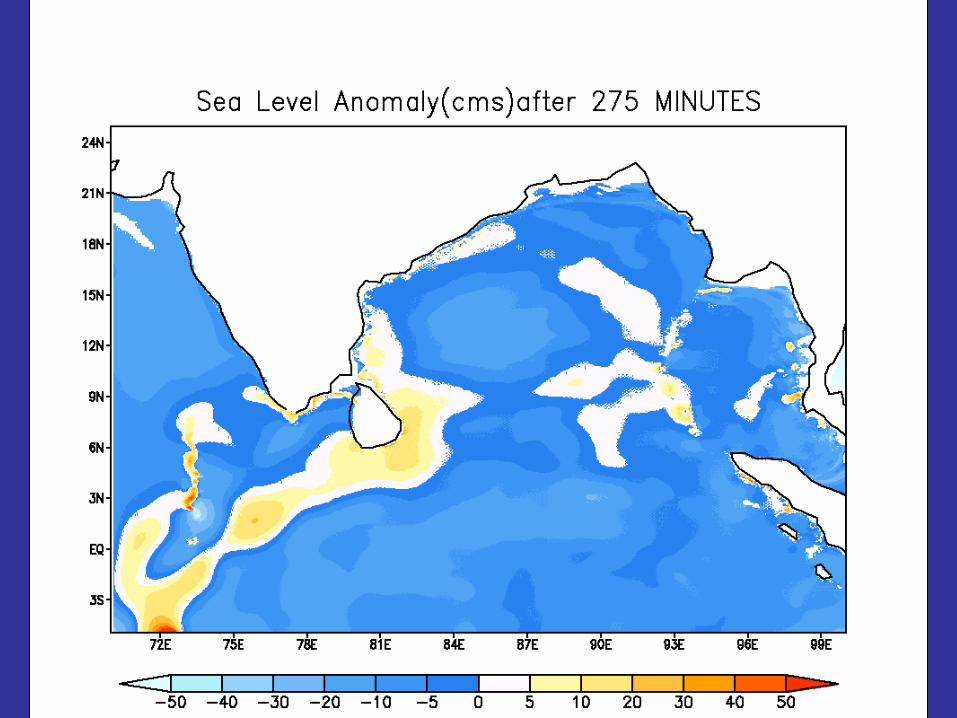
•Tsunami generation & propagation
•Coastal inundation
-40 -30 -20 -10 0 10 20 30 40 50 60Predicted 24-H In tensity C hange ( K t)
-40
-30
-20
-10
0
10
20
30
40
50
60
Obs
erve
d 24
-H In
tens
ity C
hang
e (
Kt)
T ra in ing ( N = 180 )
Validation ( N = 49 )
Cyclone Intensity Change prediction: Genetic approach
5
10
15
20
25
30
75 80 85 90 95 100
Longitude
Latit
ude
Observed Track BOG3 NBOG
27
28
30
29
27,27
2828
29
29
3030

PredictorsPattern-Based
PredictorsPattern-Based
Minimum PCT in inner coreAverage PCT in inner coreAverage 10V BT inner coreAverage 10V BT in outer core
Convective SHEAR ( angular shift b/w high density region of high BT(37H) and that of low PCT in 85 GHz image.
BT (37-H)
PCT

OCEAN WAVE FORECASTComponents are:
• Ocean waves• Ocean surface winds• Sea Surface temperature• Ocean currents• Ocean Eddies• Mixed Layer depth• Ocean heat content and• Lower level currents
Applications:
• Optimal Ship routing• Design of off-shore structures• Ocean disaster management (e.g. Tsunami run-off, storm
surge distribution etc.)
Tsunami Propagation (26 Dec)
24 Hr Wave F/c for Coasts
Uses Satellite & Buoys data, and
Ocean numerical models


Animation of SSH for 1997-98