meem5750 final project final report - sites at penn...
TRANSCRIPT

Michigan Technological University
MEEM 5750 Distributed Embedded Control Systems
Final Project – Final Report
Embedded Control System Development
For A Configurable Hybrid Vehicle by Using Model Based Design
Poowanart Poramapojana
April 28, 2011
Project Summary
The major tasks of the final project are to design a control system of the configurable hybrid vehicle.
Then the control designed was validated by the simulation for each sub‐model. To validate the control
system, after complete the simulation process, the control model was created by the MotoHawk
program and uploaded it in to the MotoTron ECU for testing output signals. Seven sub models were
design to execute input signals: a driving mode model, two look‐up tables for blending factor, a throttle
request model, an engine start – stop model, an engine state model, and E‐motor start – stop model and
a stepper motor driving model. The control logic of input and output signals for each sub‐model is
provided by this class. With appropriate combined input signals, the control model was validated. The
results show that the control model was successful development. It can provide correct output signals.
Developed Sub‐Model
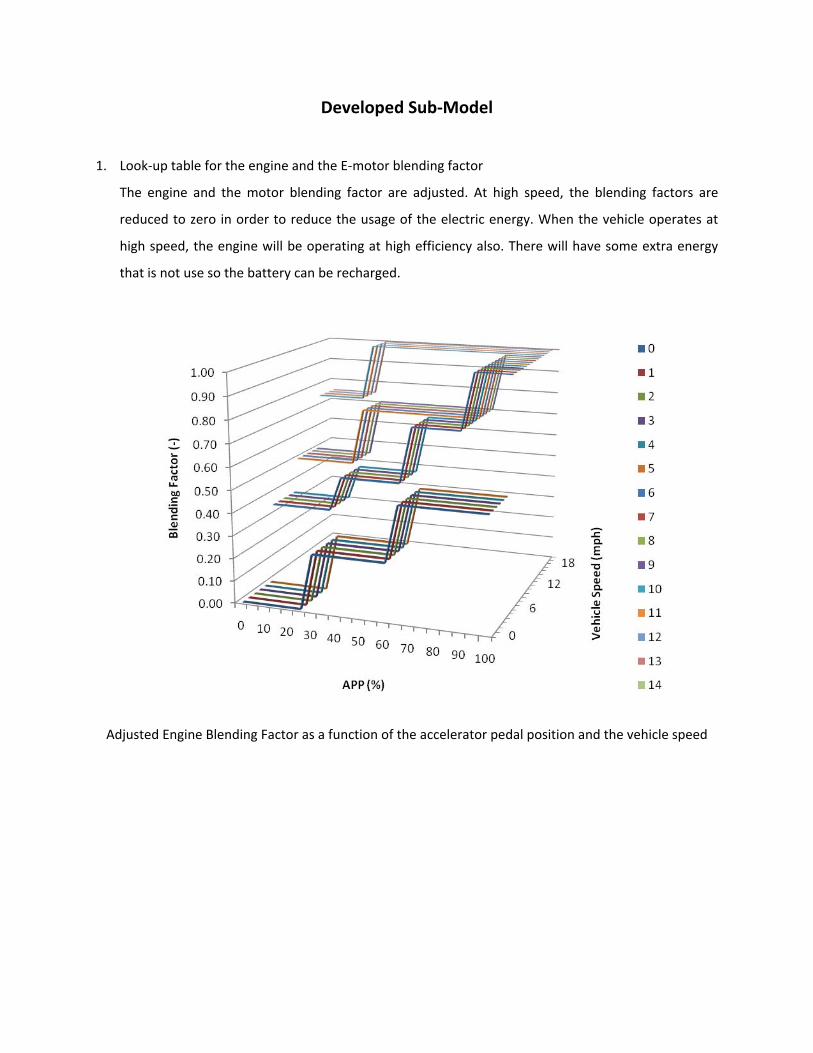
1. Look‐up table for the engine and the E‐motor blending factor
The engine and the motor blending factor are adjusted. At high speed, the blending factors are
reduced to zero in order to reduce the usage of the electric energy. When the vehicle operates at
high speed, the engine will be operating at high efficiency also. There will have some extra energy
that is not use so the battery can be recharged.
Adjusted Engine Blending Factor as a function of the accelerator pedal position and the vehicle speed

Adjusted E‐motor Blending Factor as a function of the accelerator pedal position and the vehicle speed
2. Driving Mode
State of Charge (SOC) was added into the condition for determining the driving mode for low vehicle
speed (vehicle speed < 1 mph). If SOC is less than 40%, the vehicle cannot operate on the electric
motor both the electric solo mode and the blending mode.
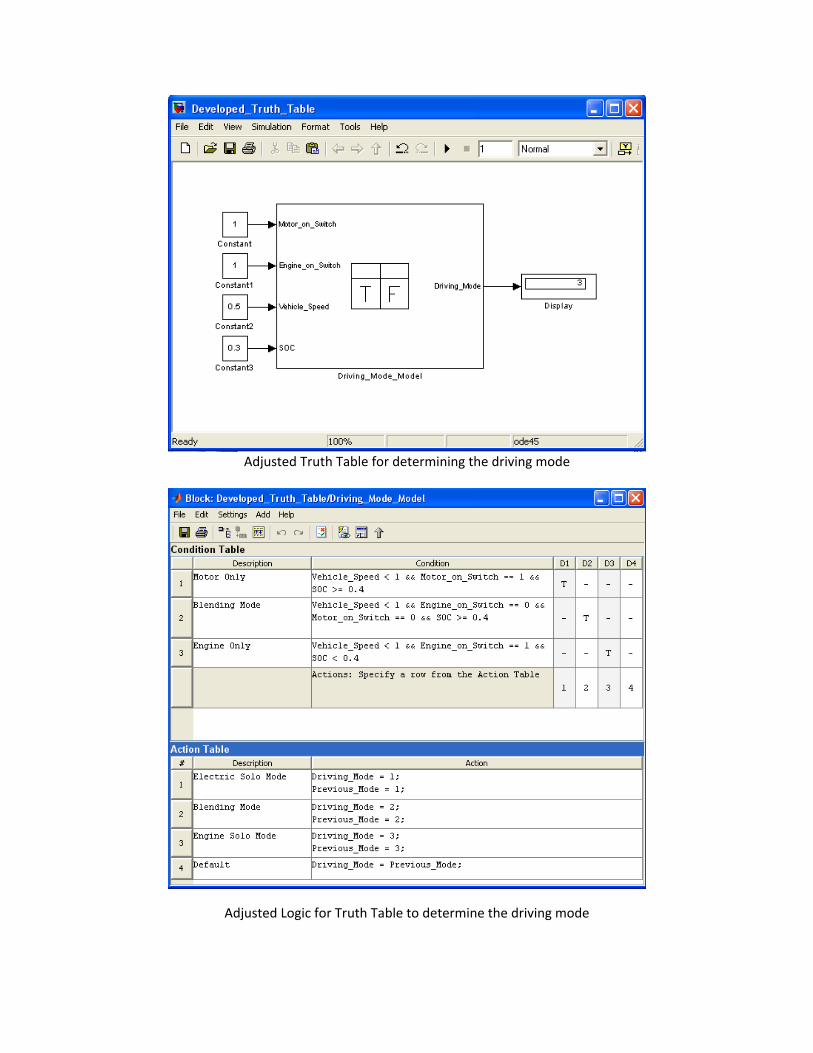
Adjusted Truth Table for determining the driving mode
Adjusted Logic for Truth Table to determine the driving mode

CONTENTS
Page
Project Summary
Developed Model
1. Introduction……………………………………………………………………………………………………………………………… 1
2. Objective………………………………………………………………………………………………………………………………..… 1
3. Control Model Design…………………………………………………………………………………………………………….… 2
3.1 Driving Mode Model………………………………………………………………………………………………………… 2
3.2 Look‐up Table for Blending Factor…………………………………………………………………………………… 3
3.3 Throttle Request Model…………………………………………………………………………………………………… 5
3.4 Engine Start – Stop Model………………………………………………………………………………………………… 7
3.5 Engine State Model...……………………………………………………………………………………………………..… 10
3.6 E‐motor Start – Stop Model……………………………………………………………………………………………… 11
3.7 Stepper Motor Driving Model…………………………………………………………………………………………… 13
4. Model for Validation………………………………………………………………………………………………………………… 15
‐ MotoHawk Model…………………………………………………………………………………………………………….… 15
‐ Model for receiving the input signals from sensors ……………………………………………………….….… 16
‐ Model for sending the output signals to actuators……………………………………………………..…….…. 17
‐ Controller Model...………………………………………………………………………………………………………......… 18
5. Results and Discussions……………………………………………………………………………………………………………. 19
5.1 Simulation Results……………………………………………………………………………………………………………….…. 19
5.1.1 Driving Mode Model……………………………………………………………………………………………………… 20
5.1.2 Look‐up Table for Blending Factor…………………………………………………………………………………. 22
5.1.3 Throttle Request Model………………………………………………………………………………………………… 23

5.1.4 Engine Start – Stop Model…………………………………………………………………………………………….. 24
5.1.5 Engine State Model...……………………………………………………………………………………………………. 25
5.1.6 E‐motor Start – Stop Model…………………………………………………………………………………………… 26
5.1.7 Stepper Motor Driving Model……………………………………………………………………………………..… 27
5.2Model Validation…………………………………………………………………………………………………………………….. 29
5.2.1 Calibrated parameters for Reading Input Signals…………………………………………………………… 28
5.2.2 Test the E‐motor Output Signal…………………………………………………………………………………….. 29
5.2.3 Test the Forward and the Reverse Output Signals…………………………………………………………. 29
5.2.4 Test the Engine Kill Output Signal………………………………………………………………………………….. 33
5.2.5 Test the Engine Crank Output Signal……………………………………………………………………………… 34
5.2.6 Test the E‐motor Throttle Request Output Signals………………………………………………………… 34
5.2.7 Test the Sequence of the Stepper Motor Driving Signals…………………………………………….… 37
5.2.8 Test the Engine State Output Signals………………………………………………………………………..…… 38
6. Conclusions…………………………………………………………………………………………………………….……………….. 39

MEEM5750 – Final Report P. Poramapojana P a g e | 1 of 39
1. Introduction
This final report provides a control model design, a model for validation on an ECU and results of the
simulations and the validations. For the control model design, there are seven sub models including in
the controller: a driving mode model, two look‐up table for blending factor, a throttle request model, an
engine start – stop model, an engine state model, and E‐motor start – stop model and a stepper motor
driving model. Required input signals and output signal of the control module is shown in figure 1. Logic
for determining each output signals are shown in each sub models. To illustrate different types of
signals clearly, the input signals to the control module are labeled as green, the output signals of
the control module are labeled as red, and the intermediate signals among sub‐models within the
control module are labeled as blue. With appropriate combined input signals, the model was validated
and the results are shown by screens captured of MotoTune windows.
2. Objective
To develop an embedded control system for a configurable hybrid vehicle by using model – based
design.
Figure 1: Overview of the control system for a configurable hybrid vehicle

MEEM5750 – Final Report P. Poramapojana P a g e | 2 of 39
3. Control Model Design
3.1 Driving Mode Model
Figure 2 shows a driving mode model for the vehicle controller. The driving modes depend on a motor
on switch, an engine on switch and the vehicle speed. The logic for selecting driving modes is shown in
figure 3.
Figure 2: Driving Mode Model
Figure 3: Truth Table Logic for determining the driving mode

MEEM5750 – Final Report P. Poramapojana P a g e | 3 of 39
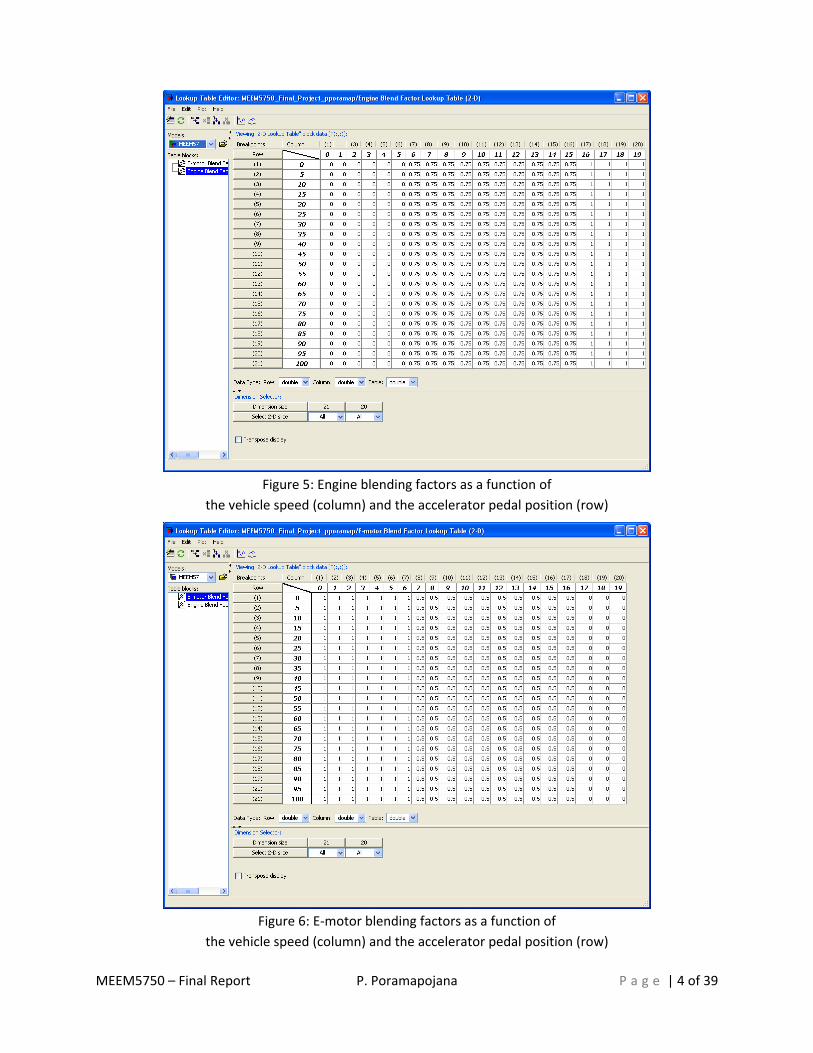
3.2 Look‐up Table for Blending Factor
Both engine and E‐motor blending factors rely on the vehicle speed and the accelerator pedal position
of the vehicle as show in figure 4. Figure 5 and 5 demonstrate the blending factor of the engine and the
E‐motor as a function of the vehicle speed and the accelerator pedal position, respectively. By increasing
the vehicle speed and the accelerator pedal position, the blending factor of the engine is increased but
the blending factor of the E‐motor is decreased.
Figure 4: Look‐up tables for the engine and the E‐motor blending factors
MEEM5750 – Final Report P. Poramapojana P a g e | 4 of 39
Figure 5: Engine blending factors as a function of
the vehicle speed (column) and the accelerator pedal position (row)
Figure 6: E‐motor blending factors as a function of
the vehicle speed (column) and the accelerator pedal position (row)
MEEM5750 – Final Report P. Poramapojana P a g e | 5 of 39
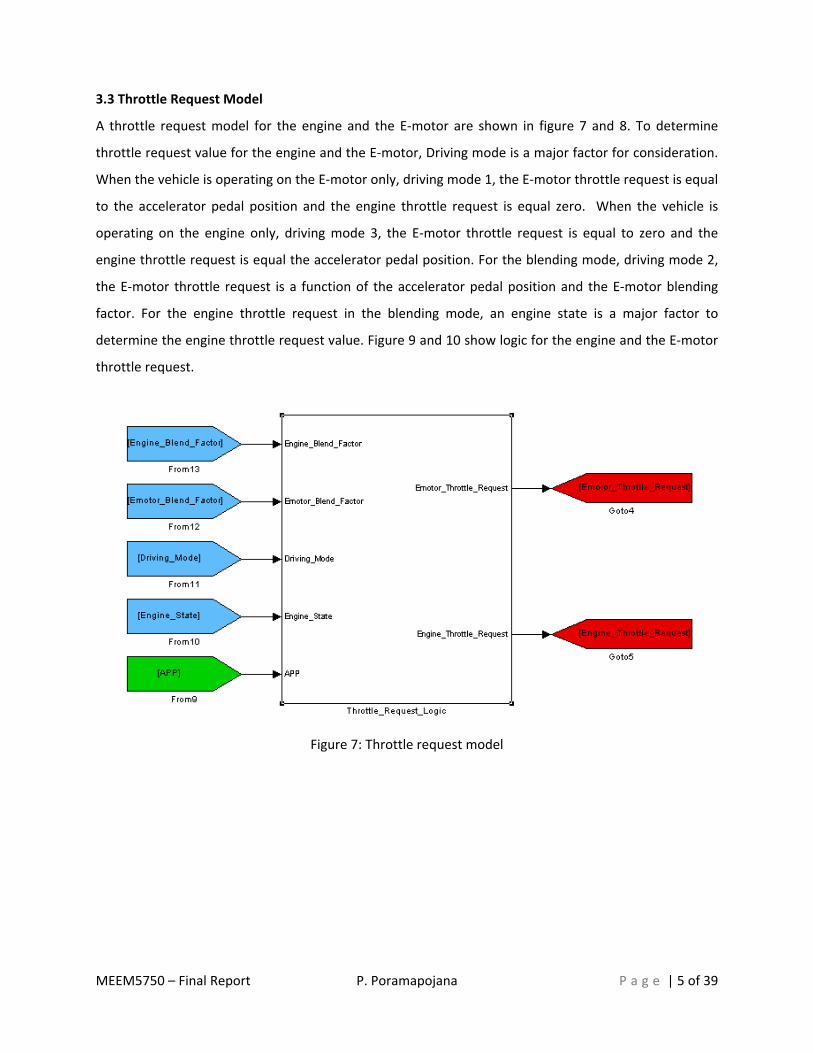
3.3 Throttle Request Model
A throttle request model for the engine and the E‐motor are shown in figure 7 and 8. To determine
throttle request value for the engine and the E‐motor, Driving mode is a major factor for consideration.
When the vehicle is operating on the E‐motor only, driving mode 1, the E‐motor throttle request is equal
to the accelerator pedal position and the engine throttle request is equal zero. When the vehicle is
operating on the engine only, driving mode 3, the E‐motor throttle request is equal to zero and the
engine throttle request is equal the accelerator pedal position. For the blending mode, driving mode 2,
the E‐motor throttle request is a function of the accelerator pedal position and the E‐motor blending
factor. For the engine throttle request in the blending mode, an engine state is a major factor to
determine the engine throttle request value. Figure 9 and 10 show logic for the engine and the E‐motor
throttle request.
Figure 7: Throttle request model

MEEM5750 – Final Report P. Poramapojana P a g e | 6 of 39
Figure 8: Inside the throttle request model
Figure 9: Logic for the E‐motor throttle request
MEEM5750 – Final Report P. Poramapojana P a g e | 7 of 39
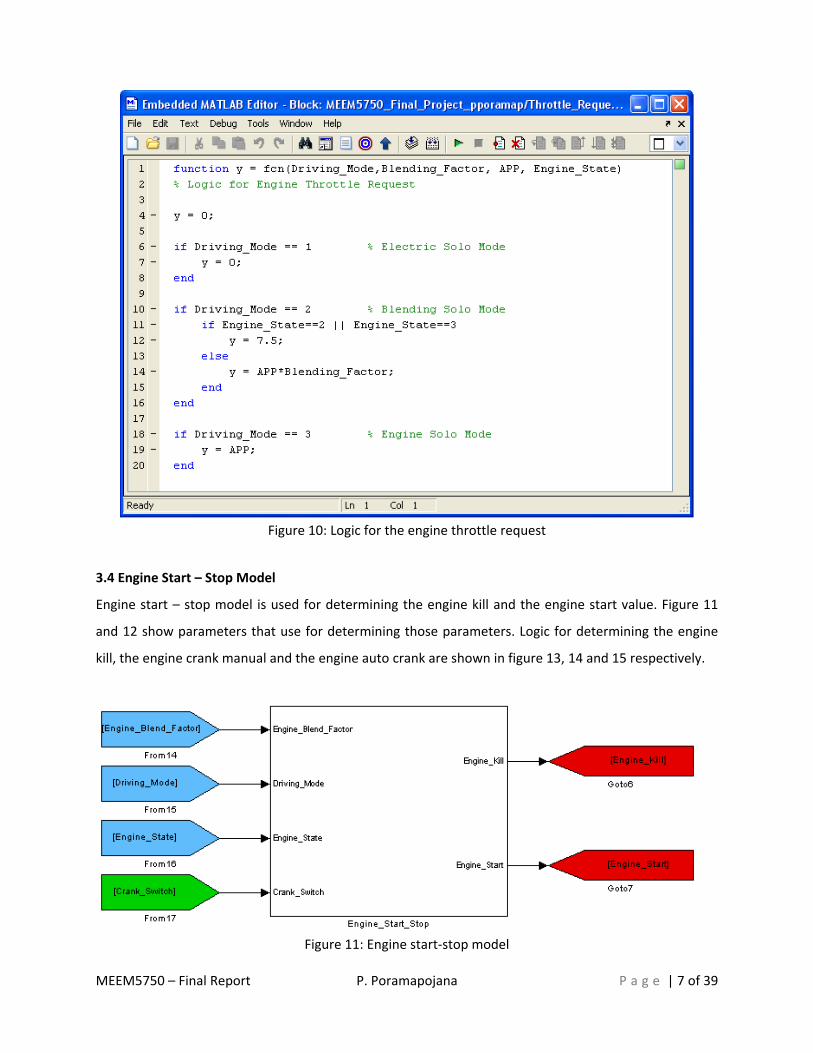
Figure 10: Logic for the engine throttle request
3.4 Engine Start – Stop Model
Engine start – stop model is used for determining the engine kill and the engine start value. Figure 11
and 12 show parameters that use for determining those parameters. Logic for determining the engine
kill, the engine crank manual and the engine auto crank are shown in figure 13, 14 and 15 respectively.
Figure 11: Engine start‐stop model

MEEM5750 – Final Report P. Poramapojana P a g e | 8 of 39
Figure 12: Inside engine start‐stop subsystem
Figure 13: Engine Kill Logic
MEEM5750 – Final Report P. Poramapojana P a g e | 9 of 39
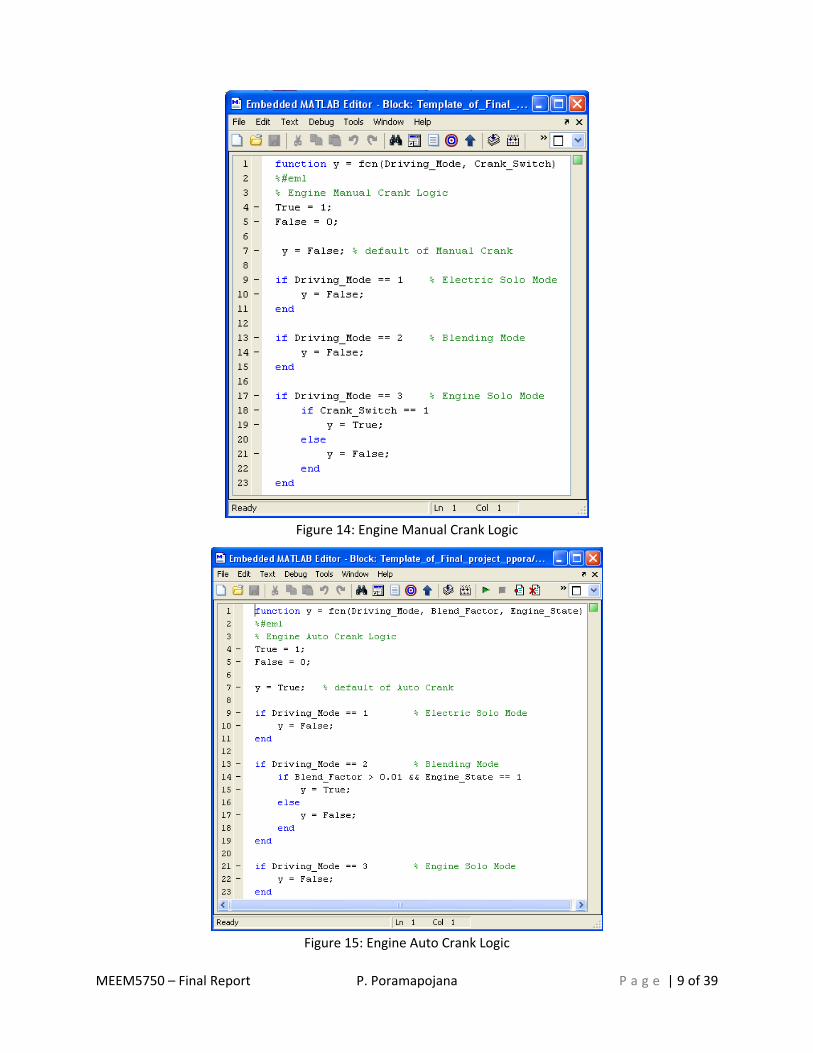
Figure 14: Engine Manual Crank Logic
Figure 15: Engine Auto Crank Logic
MEEM5750 – Final Report P. Poramapojana P a g e | 10 of 39
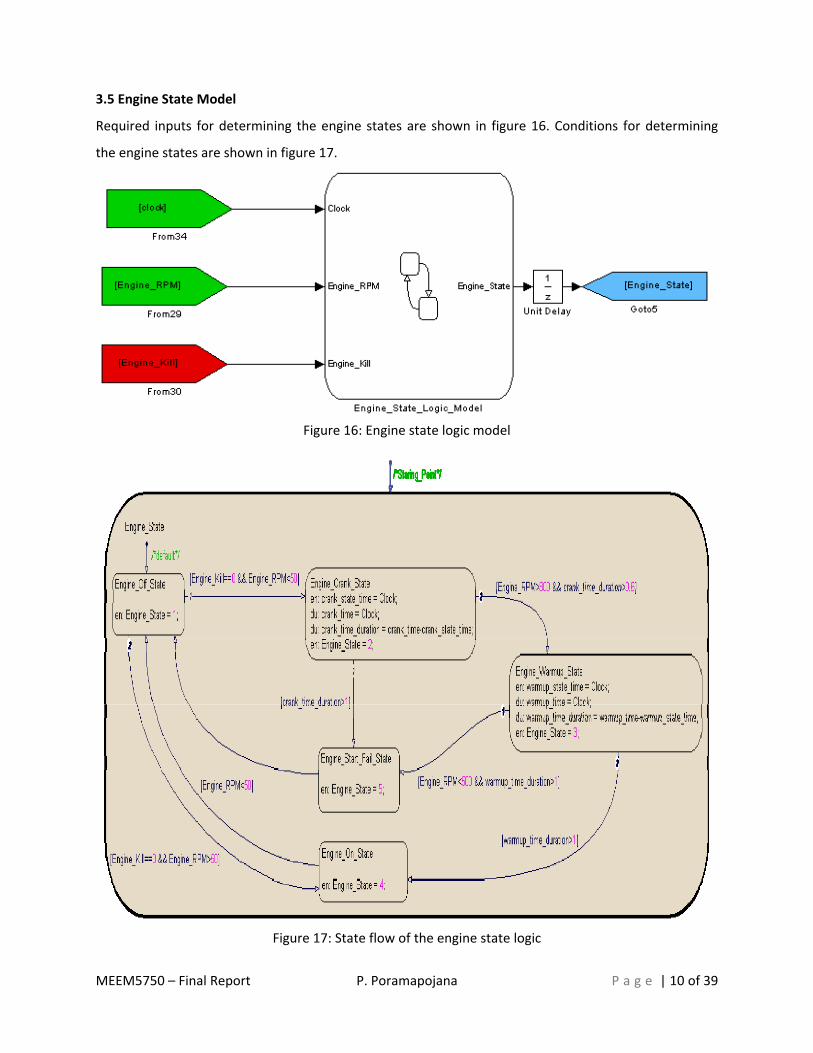
3.5 Engine State Model
Required inputs for determining the engine states are shown in figure 16. Conditions for determining
the engine states are shown in figure 17.
Figure 16: Engine state logic model
Figure 17: State flow of the engine state logic

MEEM5750 – Final Report P. Poramapojana P a g e | 11 of 39
3.6 E‐motor Start – Stop Model
E‐motor starts – stop model is used for determining the E‐motor on switch and operating direction of
the E‐motor, forward and reverse direction. Figure 18 and 19 demonstrate required inputs for
determining those parameters. Figure 20 and 21 illustrate logic for determining the E‐motor on switch,
the forward and the reverse direction of the E‐motor respectively.
Figure 18: Subsystem for E‐motor start‐stop model
Figure 19: Inside E‐motor start‐stop subsystem

MEEM5750 – Final Report P. Poramapojana P a g e | 12 of 39
Figure 20: E‐motor Start – Stop Logic
Figure 21: E‐motor forward and reverse Logic
MEEM5750 – Final Report P. Poramapojana P a g e | 13 of 39
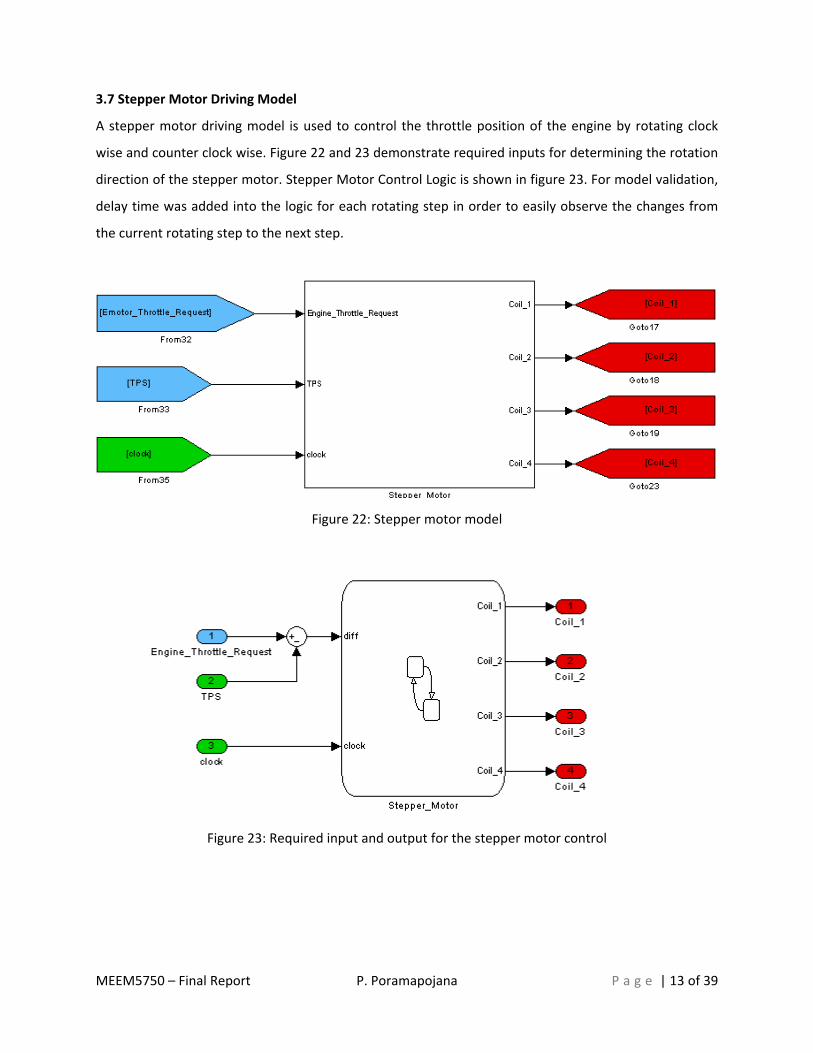
3.7 Stepper Motor Driving Model
A stepper motor driving model is used to control the throttle position of the engine by rotating clock
wise and counter clock wise. Figure 22 and 23 demonstrate required inputs for determining the rotation
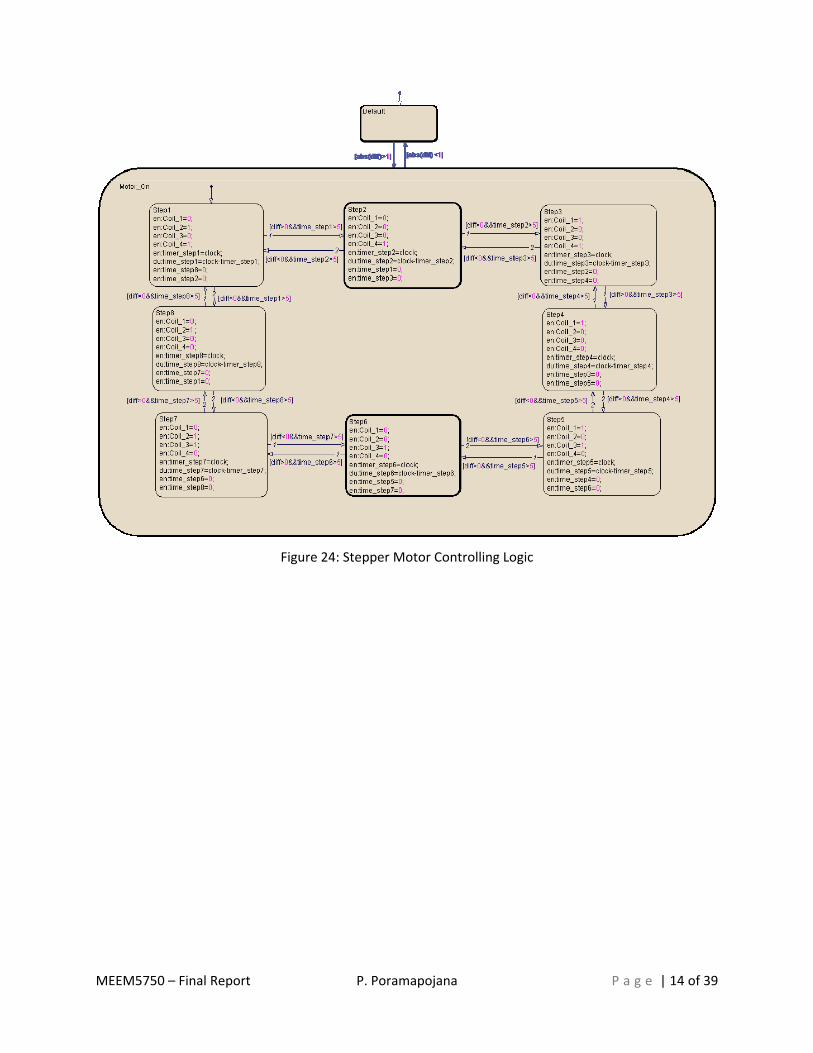
direction of the stepper motor. Stepper Motor Control Logic is shown in figure 23. For model validation,
delay time was added into the logic for each rotating step in order to easily observe the changes from
the current rotating step to the next step.
Figure 22: Stepper motor model
Figure 23: Required input and output for the stepper motor control
MEEM5750 – Final Report P. Poramapojana P a g e | 14 of 39
Figure 24: Stepper Motor Controlling Logic
MEEM5750 – Final Report P. Poramapojana P a g e | 15 of 39
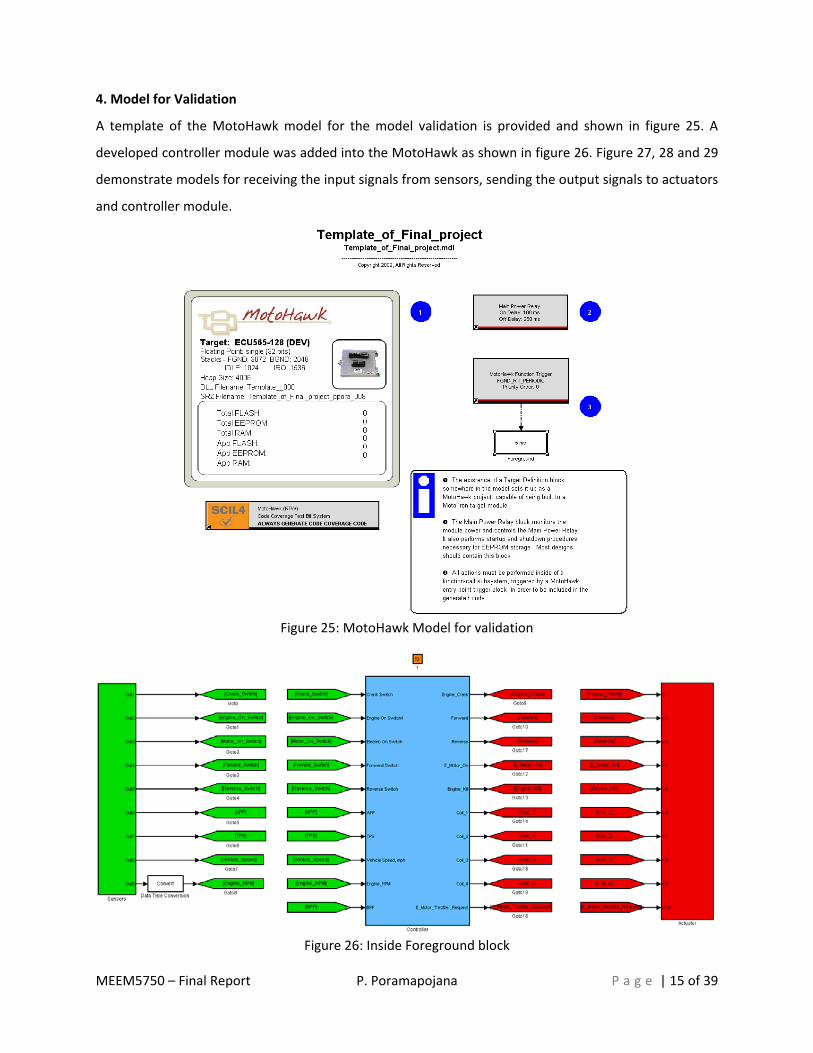
4. Model for Validation
A template of the MotoHawk model for the model validation is provided and shown in figure 25. A
developed controller module was added into the MotoHawk as shown in figure 26. Figure 27, 28 and 29
demonstrate models for receiving the input signals from sensors, sending the output signals to actuators
and controller module.
Figure 25: MotoHawk Model for validation
Figure 26: Inside Foreground block

MEEM5750 – Final Report P. Poramapojana P a g e | 16 of 39
Figure 27: Model for receiving the input signals from sensors

MEEM5750 – Final Report P. Poramapojana P a g e | 17 of 39
Figure 28: Model for sending the output signals to actuators

MEEM5750 – Final Report P. Poramapojana P a g e | 18 of 39
Figure 29: Controller Model

MEEM5750 – Final Report P. Poramapojana P a g e | 19 of 39
5. Results and Discussion
5.1 Simulation Results
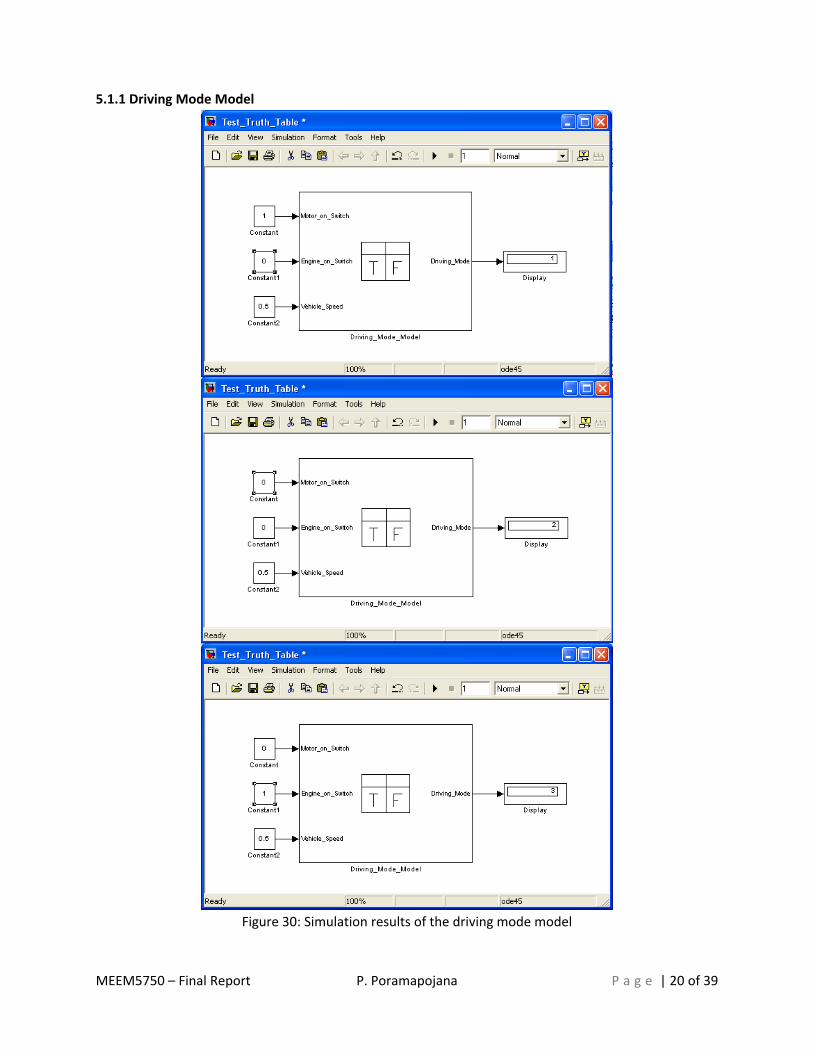
Driving mode model
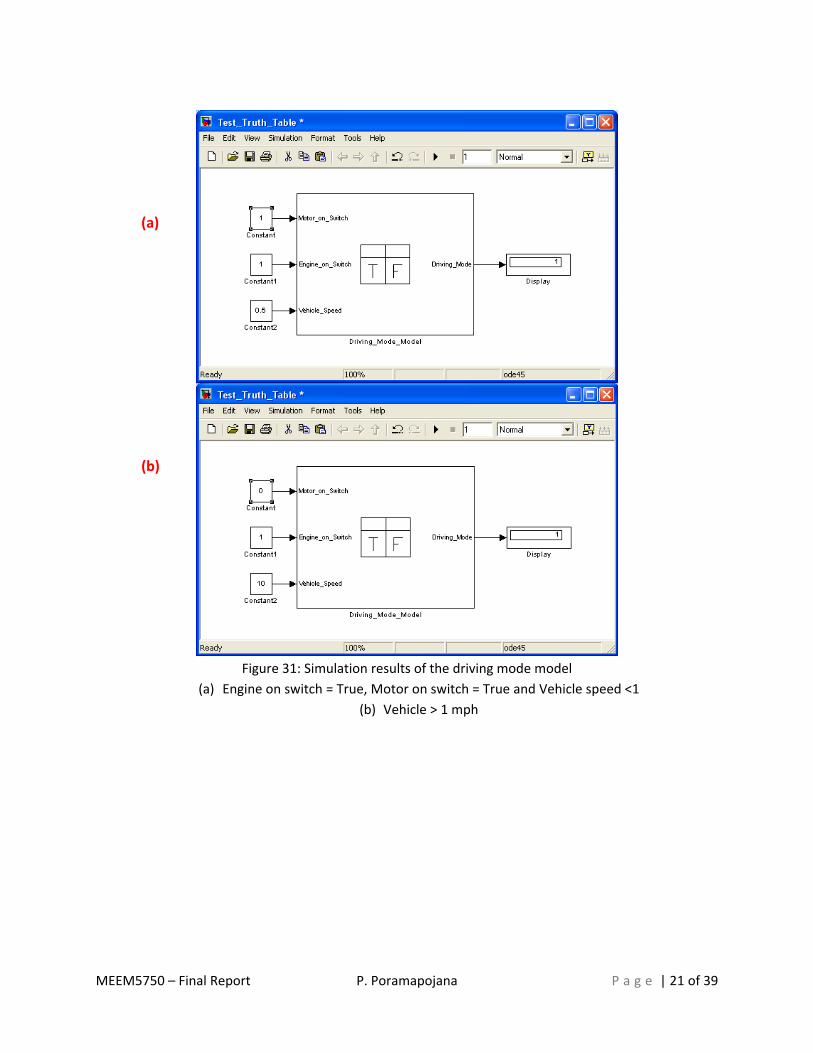
The model was tested three modes when the vehicle speed is less than one mile per hour as shown in
figure 30. Figure 31 show the changing vehicle speed from 0.5 mph to 10 mph (>1 mph). The driving
mode unchanged when the velocity increase.
Look‐up Table for Blending Factor
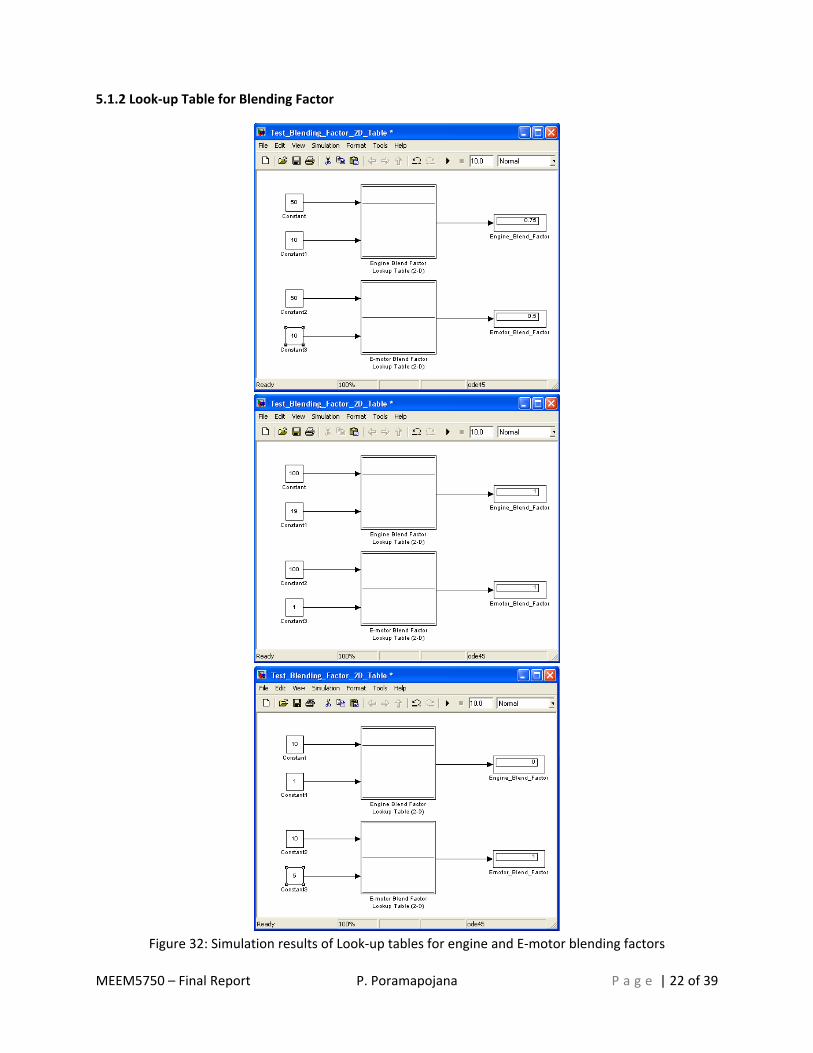
The look‐up table for the engine and the E‐motor blending factors was tested at low, medium and high
values of the accelerator pedal position and the vehicle speed as shown in figure 32.
Throttle Request Model
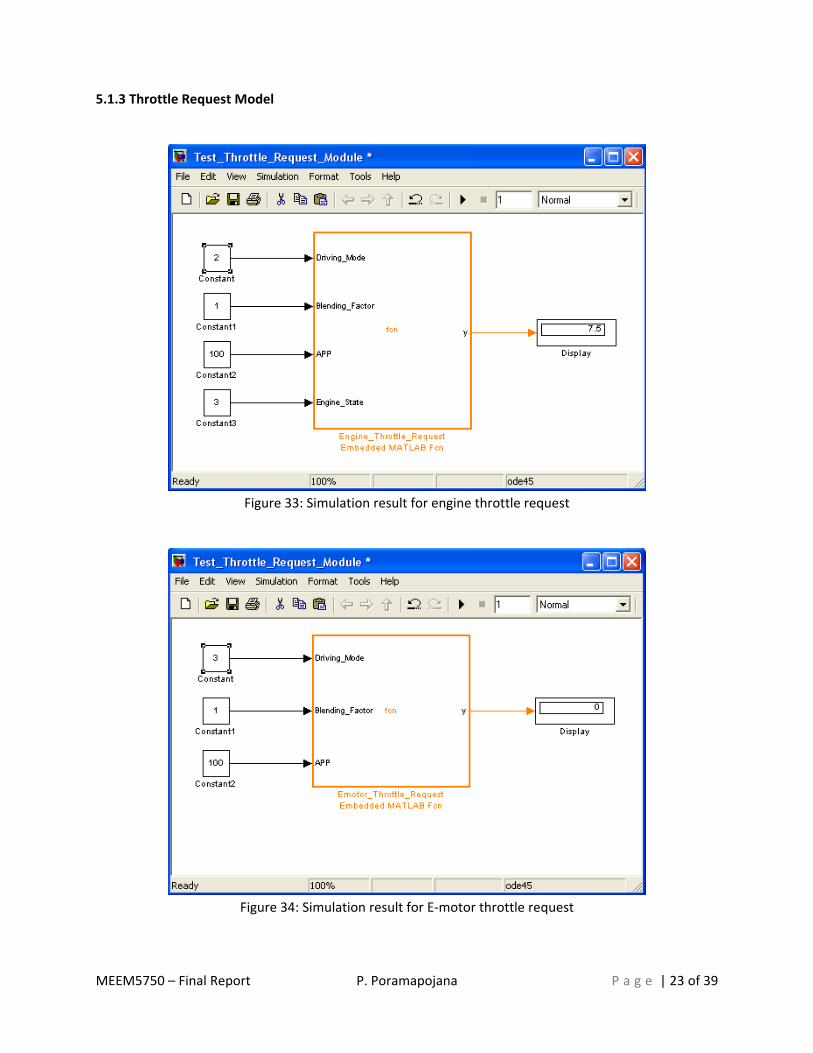
The engine and the E‐motor throttle request model was tested with different driving modes. Figure 33
shows a simulation result for the engine. Figure 34 shows a simulation result of the E‐motor.
Engine Start – Stop Model
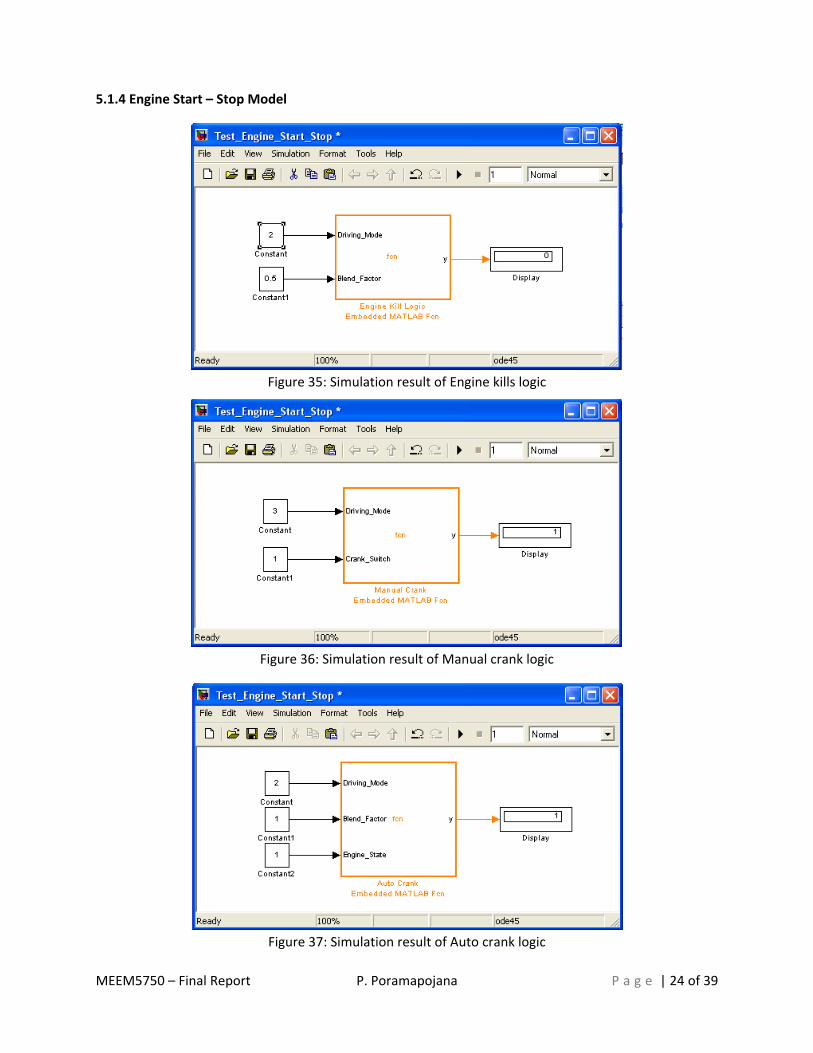
The engine kill model was tested for a signal output of “False” as shown in figure 35. For the manual
crank and the auto crank logic, the models were tested for signal output of “True” as shown in figure 36
and 37 respectively.
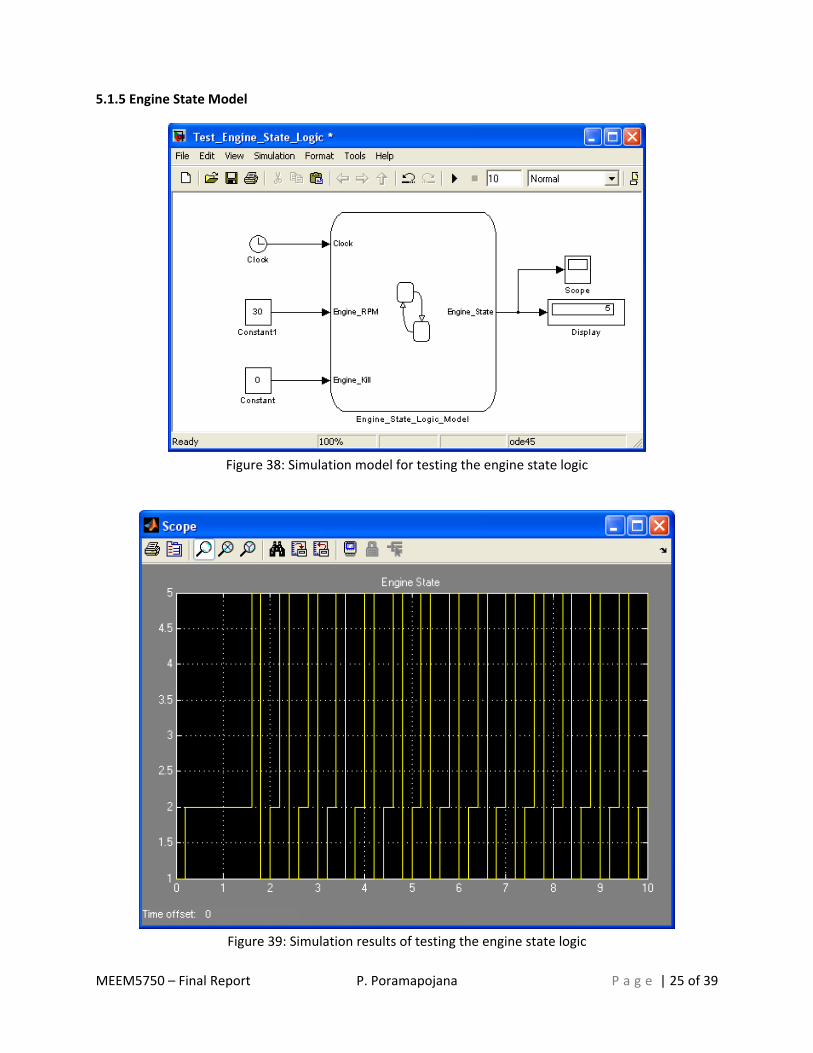
Engine State Model
Figure 39 demonstrates the test condition with constant engine speed and engine on mode (engine kill =
0). A simulation of the test is shown in figure 39.
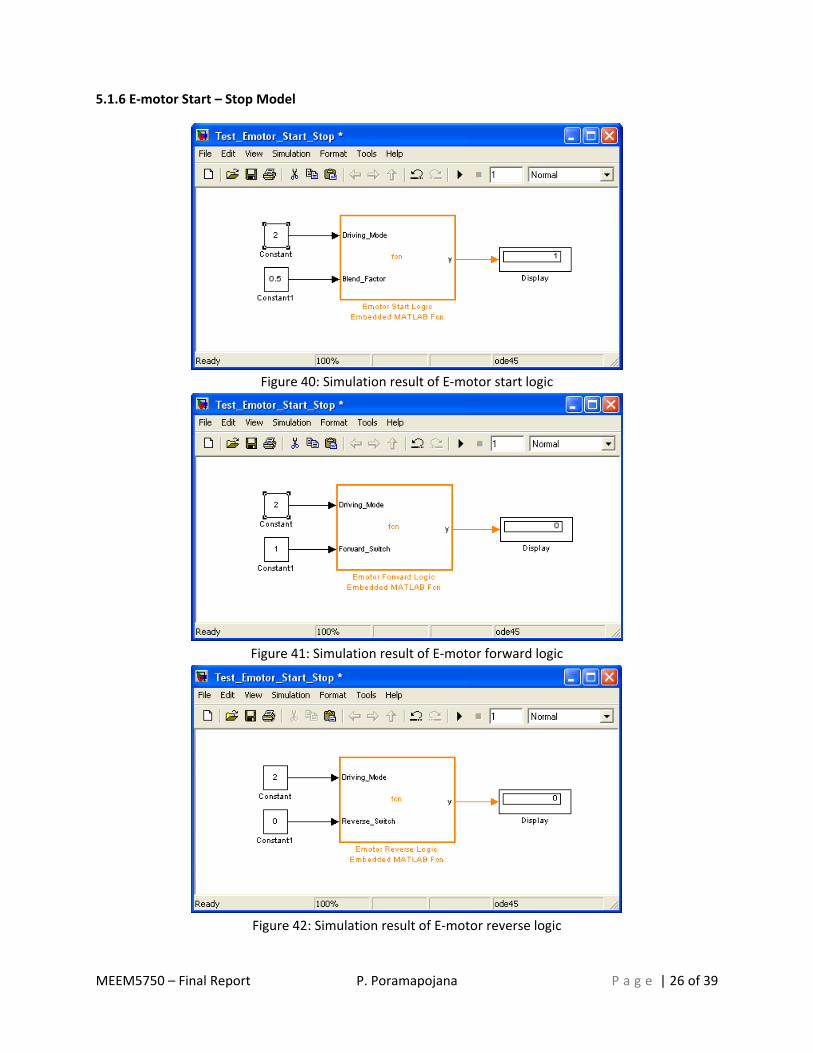
E‐motor Start – Stop Model
The E‐motor start – stop model was tested for a signal output of “True” as shown in figure 40. For the
forward and the reverse logic, the models were tested for signal output of “False” as shown in figure 41
and 42 respectively.
Stepper Motor Driving Model
The stepper motor driving model was tested with both clockwise and counter clockwise direction. Figure
43 and 44 show output signals for clockwise and counter clockwise direction respectively. Note that the
delay time for each step is 5 seconds.
MEEM5750 – Final Report P. Poramapojana P a g e | 20 of 39
5.1.1 Driving Mode Model
Figure 30: Simulation results of the driving mode model
MEEM5750 – Final Report P. Poramapojana P a g e | 21 of 39
Figure 31: Simulation results of the driving mode model
(a) Engine on switch = True, Motor on switch = True and Vehicle speed <1
(b) Vehicle > 1 mph
(a)
(b)
MEEM5750 – Final Report P. Poramapojana P a g e | 22 of 39
5.1.2 Look‐up Table for Blending Factor
Figure 32: Simulation results of Look‐up tables for engine and E‐motor blending factors
MEEM5750 – Final Report P. Poramapojana P a g e | 23 of 39
5.1.3 Throttle Request Model
Figure 33: Simulation result for engine throttle request
Figure 34: Simulation result for E‐motor throttle request
MEEM5750 – Final Report P. Poramapojana P a g e | 24 of 39
5.1.4 Engine Start – Stop Model
Figure 35: Simulation result of Engine kills logic
Figure 36: Simulation result of Manual crank logic
Figure 37: Simulation result of Auto crank logic
MEEM5750 – Final Report P. Poramapojana P a g e | 25 of 39
5.1.5 Engine State Model
Figure 38: Simulation model for testing the engine state logic
Figure 39: Simulation results of testing the engine state logic
MEEM5750 – Final Report P. Poramapojana P a g e | 26 of 39
5.1.6 E‐motor Start – Stop Model
Figure 40: Simulation result of E‐motor start logic
Figure 41: Simulation result of E‐motor forward logic
Figure 42: Simulation result of E‐motor reverse logic

MEEM5750 – Final Report P. Poramapojana P a g e | 27 of 39
5.1.7 Stepper Motor Driving Model
Figure 43: Simulation result of the stepper motor for clock wise direction
(delay 5 seconds for each step)

MEEM5750 – Final Report P. Poramapojana P a g e | 28 of 39
Figure 44: Simulation result of the stepper motor for counter clockwise direction
(delay 5 seconds for each step)

MEEM5750 – Final Report P. Poramapojana P a g e | 29 of 39
5.2 Model Validation Results
5.2.1 Input Signals Calibrated parameters
Vehicle speed input signal, the frequency input signal was calibrated from 100 – 290 Hz to 0 – 19 mph.
Average of the engine speed, the frequency input signal was calibrated from 10 – 1000 Hz to 10 – 1000
RPM. The accelerator pedal positon and the throttle position was calibrated counts number of 330 –
1023 to 0 – 100 percent. Gain and offset for the calibration are shown in table 1
Table 1: Input signals calibrated parameters
Signals Gain Offset
Vehicle speed 0.001 ‐10
Engine Average RPM 0.01 0
Throttle Pedal Position (TPS) 0.1443 ‐47.619
Accelerator Pedal Position (APP) 0.1443 ‐47.619
5.2.2 Test the E‐motor Output Signal
The “E‐motor On” output signal was tested for “True” when the driving mode is 2. Figure 45 and 46
demonstrate the results.
Figure 45: E‐motor on = 1 when Driving mode = 2 and E‐motor blending factor = 1 (>0.01)
MEEM5750 – Final Report P. Poramapojana P a g e | 30 of 39
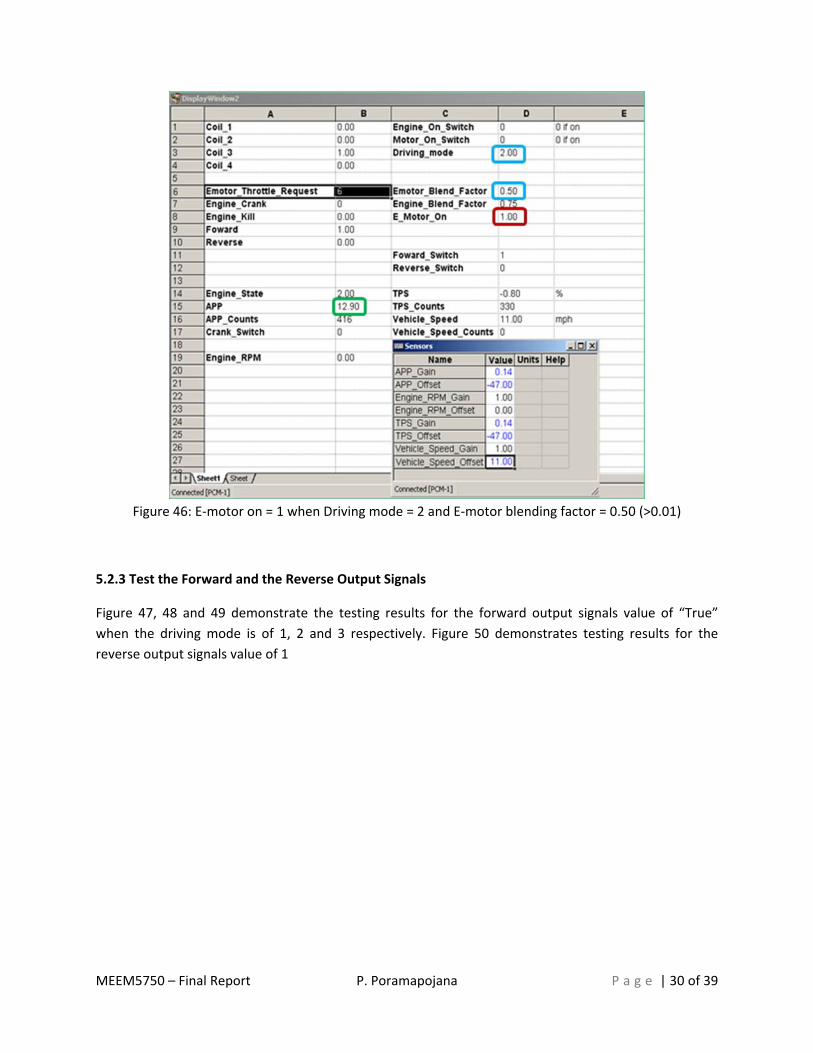
Figure 46: E‐motor on = 1 when Driving mode = 2 and E‐motor blending factor = 0.50 (>0.01)
5.2.3 Test the Forward and the Reverse Output Signals
Figure 47, 48 and 49 demonstrate the testing results for the forward output signals value of “True”
when the driving mode is of 1, 2 and 3 respectively. Figure 50 demonstrates testing results for the
reverse output signals value of 1

MEEM5750 – Final Report P. Poramapojana P a g e | 31 of 39
Figure 47: Forward = 1 when Driving Mode = 1 and Forward Switch = 1
Figure 48: Forward = 1 when Driving Mode = 2 and Forward Switch = 1

MEEM5750 – Final Report P. Poramapojana P a g e | 32 of 39
Figure 49: Forward = 0 when Driving Mode = 3 and Forward Switch = 1
Figure 50: Reverse = 1 when Driving Mode = 1 and Reverse Switch = 1
MEEM5750 – Final Report P. Poramapojana P a g e | 33 of 39
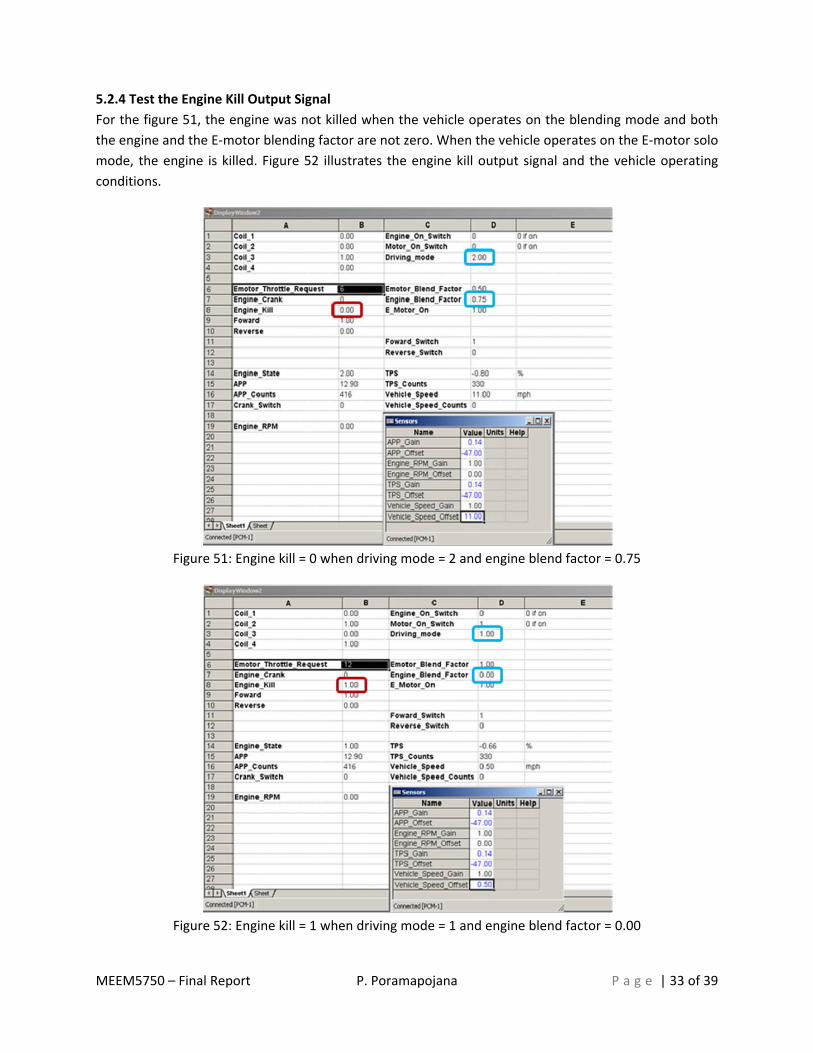
5.2.4 Test the Engine Kill Output Signal
For the figure 51, the engine was not killed when the vehicle operates on the blending mode and both
the engine and the E‐motor blending factor are not zero. When the vehicle operates on the E‐motor solo
mode, the engine is killed. Figure 52 illustrates the engine kill output signal and the vehicle operating
conditions.
Figure 51: Engine kill = 0 when driving mode = 2 and engine blend factor = 0.75
Figure 52: Engine kill = 1 when driving mode = 1 and engine blend factor = 0.00
MEEM5750 – Final Report P. Poramapojana P a g e | 34 of 39
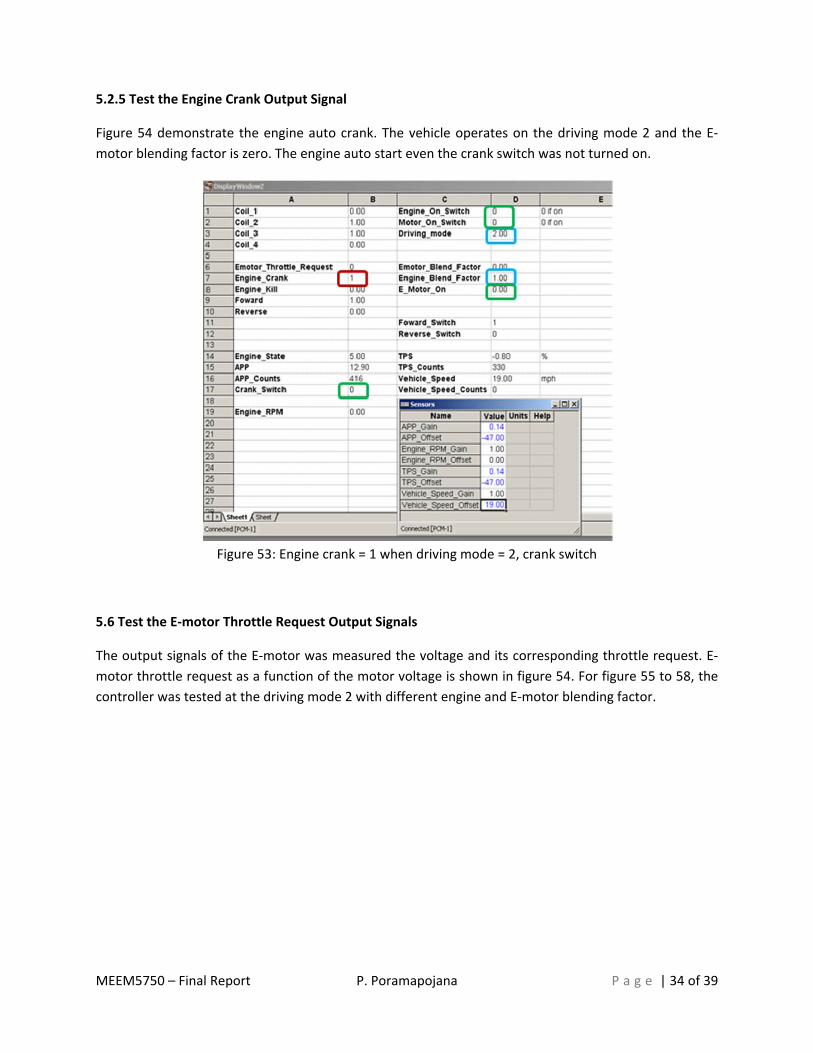
5.2.5 Test the Engine Crank Output Signal
Figure 54 demonstrate the engine auto crank. The vehicle operates on the driving mode 2 and the E‐
motor blending factor is zero. The engine auto start even the crank switch was not turned on.
Figure 53: Engine crank = 1 when driving mode = 2, crank switch
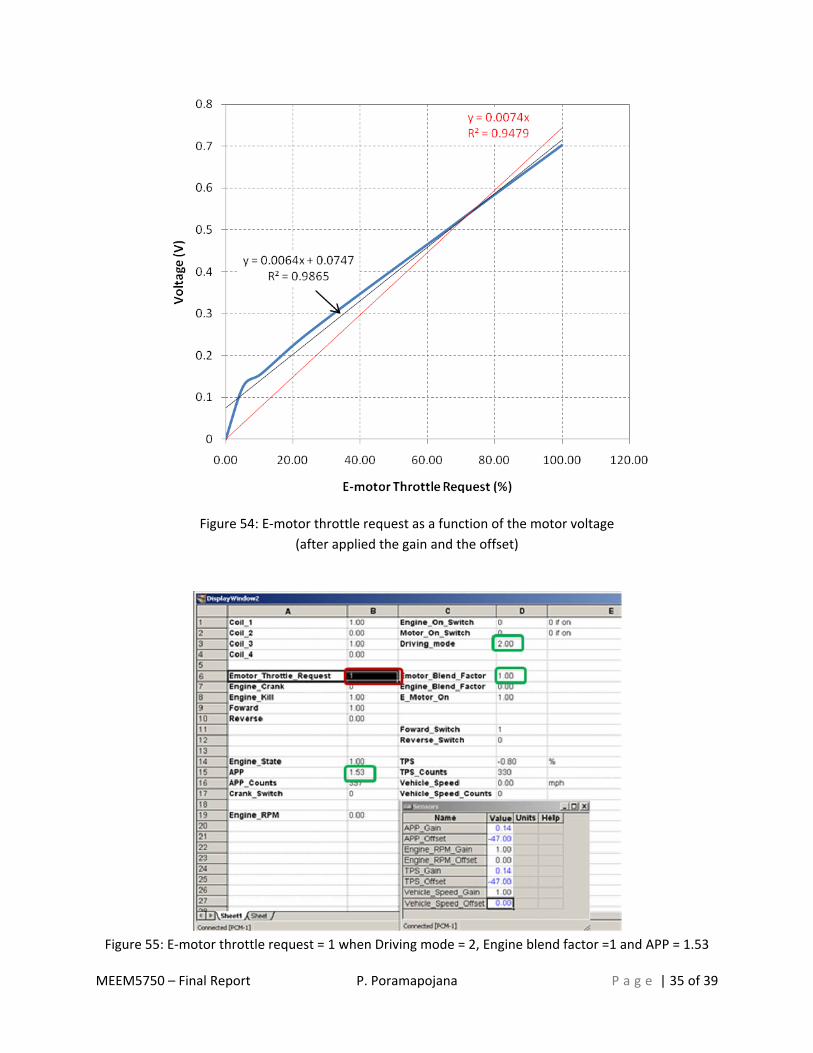
5.6 Test the E‐motor Throttle Request Output Signals
The output signals of the E‐motor was measured the voltage and its corresponding throttle request. E‐
motor throttle request as a function of the motor voltage is shown in figure 54. For figure 55 to 58, the
controller was tested at the driving mode 2 with different engine and E‐motor blending factor.
MEEM5750 – Final Report P. Poramapojana P a g e | 35 of 39
Figure 54: E‐motor throttle request as a function of the motor voltage
(after applied the gain and the offset)
Figure 55: E‐motor throttle request = 1 when Driving mode = 2, Engine blend factor =1 and APP = 1.53

MEEM5750 – Final Report P. Poramapojana P a g e | 36 of 39
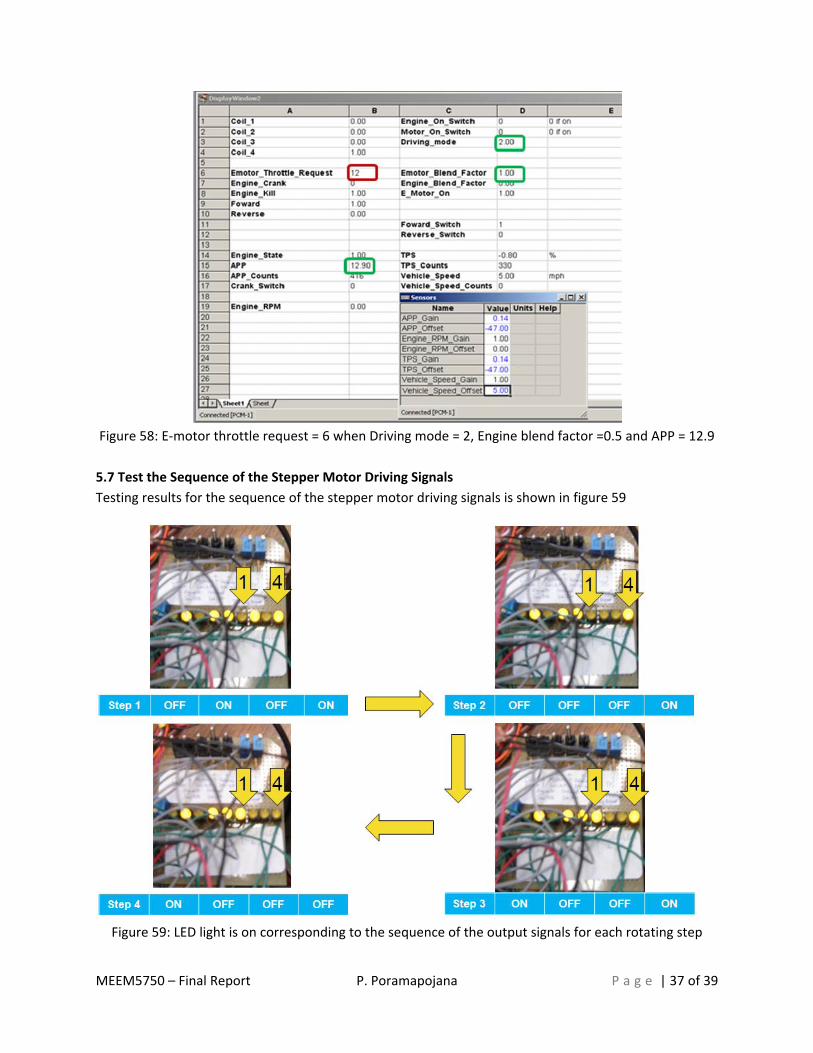
Figure 56: E‐motor throttle request = 6 when Driving mode = 2, Engine blend factor =0.5 and APP = 12.9
Figure 57: E‐motor throttle request = 0 when Driving mode = 2, Engine blend factor =0 and APP = 12.9
MEEM5750 – Final Report P. Poramapojana P a g e | 37 of 39
Figure 58: E‐motor throttle request = 6 when Driving mode = 2, Engine blend factor =0.5 and APP = 12.9
5.7 Test the Sequence of the Stepper Motor Driving Signals
Testing results for the sequence of the stepper motor driving signals is shown in figure 59
Figure 59: LED light is on corresponding to the sequence of the output signals for each rotating step

MEEM5750 – Final Report P. Poramapojana P a g e | 38 of 39
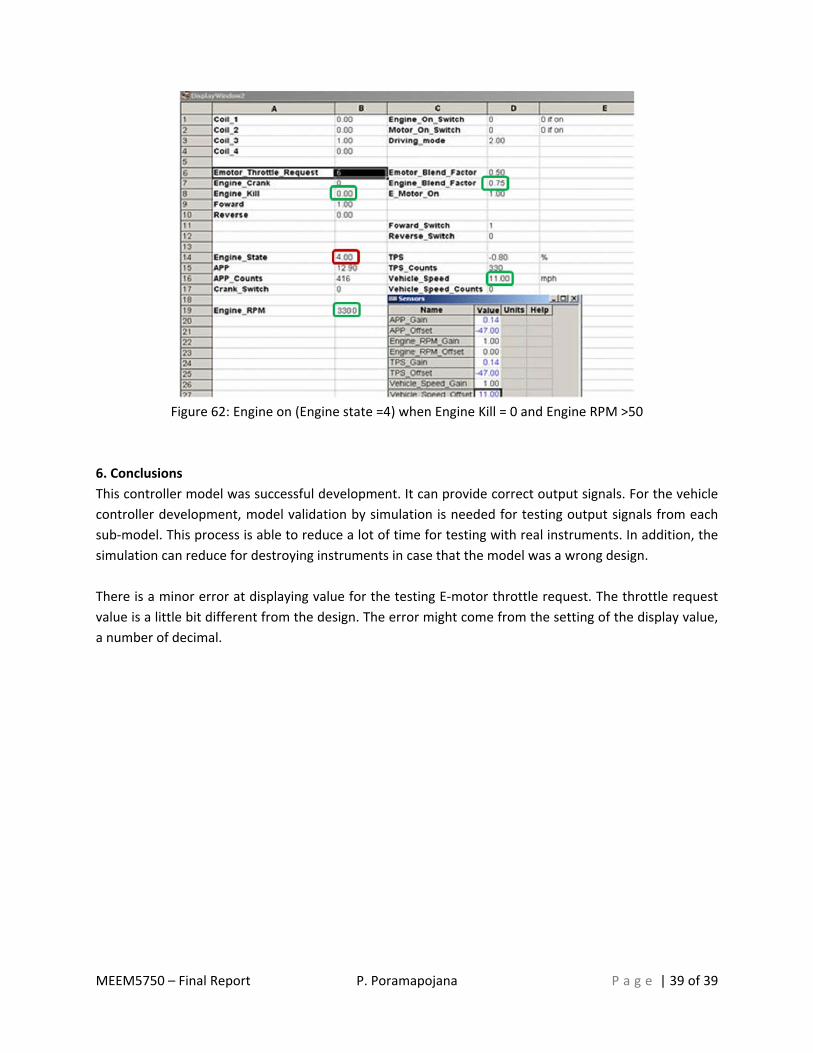
5.8 Test the Engine State Output Signals
Figure 60 show the engine off (engine state = 1) when the engine kill is 1 and the engine RPM is 0. Figure
61 shows the engine on (engine state = 2) when the engine kill is 0 and the engine RPM is 0. Figure 62
show the engine on (Engine state = 4) when Engine Kill = 0 and Engine RPM >50.
Figure 60: Engine Off (engine state = 1) when Engine Kill = 1 and Engine RPM = 0
Figure 61: Engine Off (engine state = 2) when Engine Kill = 0 and Engine RPM = 0
MEEM5750 – Final Report P. Poramapojana P a g e | 39 of 39
Figure 62: Engine on (Engine state =4) when Engine Kill = 0 and Engine RPM >50
6. Conclusions
This controller model was successful development. It can provide correct output signals. For the vehicle
controller development, model validation by simulation is needed for testing output signals from each
sub‐model. This process is able to reduce a lot of time for testing with real instruments. In addition, the
simulation can reduce for destroying instruments in case that the model was a wrong design.
There is a minor error at displaying value for the testing E‐motor throttle request. The throttle request
value is a little bit different from the design. The error might come from the setting of the display value,
a number of decimal.