medicaid 101 jul y 8, 2013 presented by senate staff: adriane crouse marga hoelscher adam...
TRANSCRIPT
Medicaid 101Jul y 8, 2013
Presented by Senate Staff:Adriane Crouse
Marga HoelscherAdam Koenigsfeld
Interim Committee on Medicaid Transformation and Reform
1
Presentation Highlights
• Background and Overview• Missouri Medicaid • Services and Service Delivery Systems • Provider Reimbursement Levels• Financing and Budget• Hospital Reimbursement• Provider Tax • ACA and Federal Health Reform• Transformation Considerations
2

Background and Overview
3

What is Medicaid? Nation’s largest public health program for low-income
Americans
Medicaid is NOT Medicare Two separate programs with different federal rules and
regulations Different eligibility focus
Children Pregnant Women
Majority of Spending goes to Elderly and Disabled Long-Term Services and Supports
Nursing Homes Home and Community -based Services
4

What is Medicaid?• Medicaid is Considered an Entitlement
• Anyone meeting income and eligibility requirements can enroll
• Jointly Financed by State and Federal governments
• Federal law requires states offer a basic set of benefits
• Federal law requires certain groups of people to be covered
• Medicaid programs differ greatly from state to state
5

Federal and State Agreements• Medicaid State Plan
• Agreement between federal government and each state • Documents specifics regarding each state’s program• Covers specifics like: services, eligibility, provider reimbursement
and cost sharing
• Waivers• Necessary to innovate• Very difficult process
• Medicaid Partnership Plan• Specific to Missouri• Documents Provider Tax Requirements• Requires Missouri to submit Additional Documentation
6
Missouri Medicaid
7
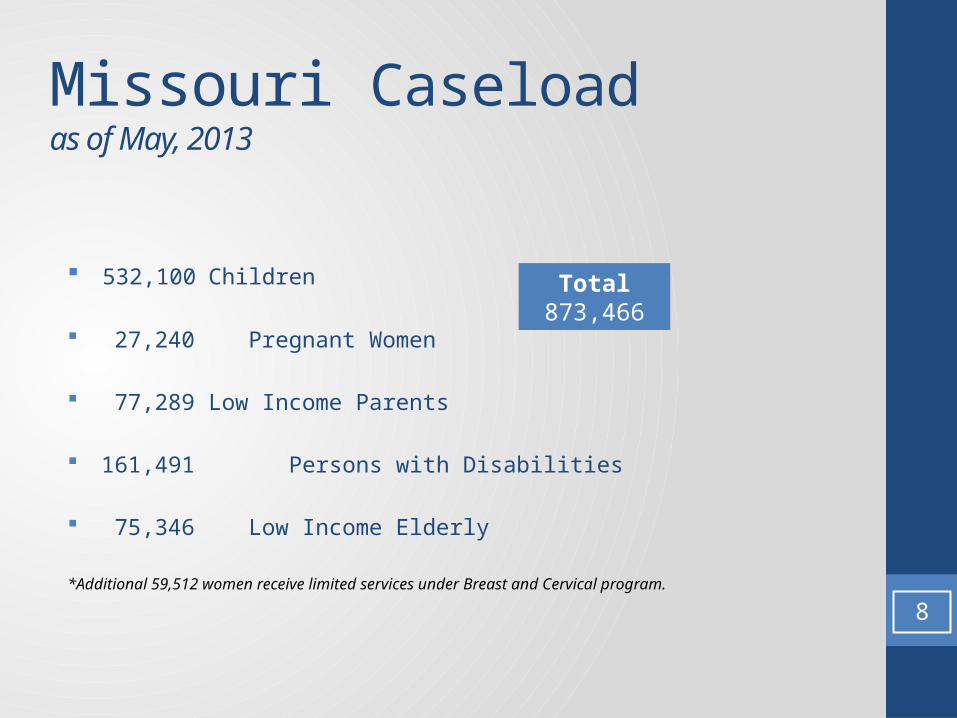
Missouri Caseload as of May, 2013
532,100 Children
27,240 Pregnant Women
77,289 Low Income Parents
161,491 Persons with Disabilities
75,346 Low Income Elderly
*Additional 59,512 women receive limited services under Breast and Cervical program.
Total 873,466
8

9

In Missouri:• DSS is Single State Agency
• Designation required in federal law• Agency responsible for administering Medicaid State Plan
• MO HealthNet is state’s Medicaid agency
• Medicaid services also administered by • Department of Mental Health• Department of Health and Senior Services• Department of Elementary and Secondary Education
10

11
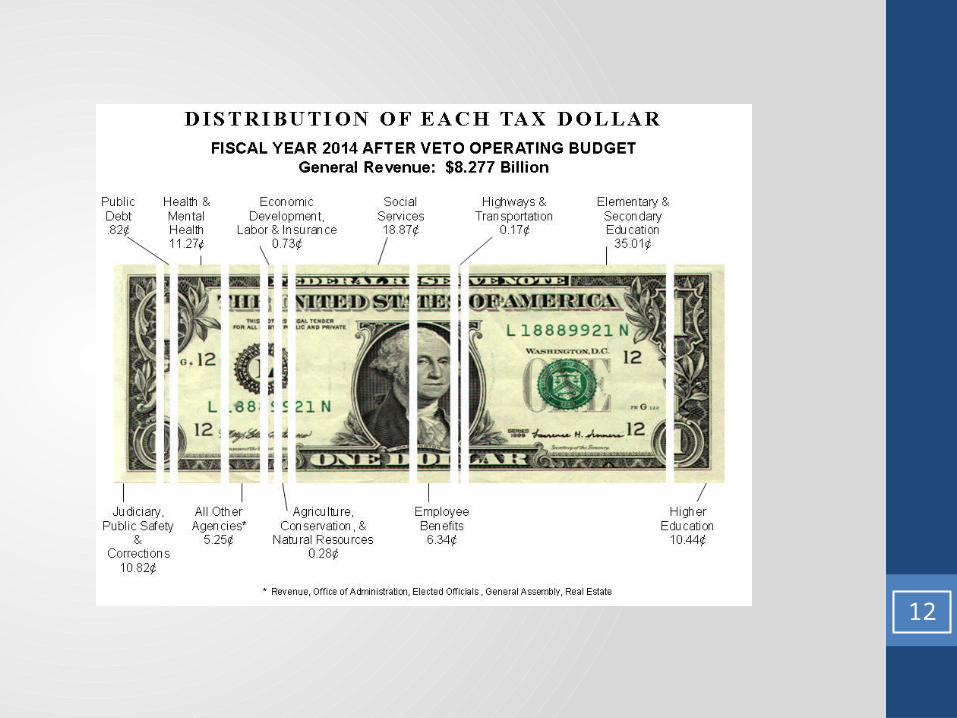
12

TOTAL MEDICAID ALL AGENCIES
FY 2014 Proposed
GR FED OTHER TOTAL
Elementary and Secondary Education $0 $1,000,000 $7,000,000 $8,000,000
Mental Health $356,799,977 $726,941,916 $32,385,406 $1,116,127,299
Health and Senior Services $234,605,038 $450,951,832 $485,831 $686,042,701
Social Services $1,194,009,324 $3,563,640,541 $2,407,772,614 $7,165,422,479
Total $1,785,414,339 $4,742,534,289 $2,447,643,851 $8,975,592,479
13
State Agencies & Medicaid
14
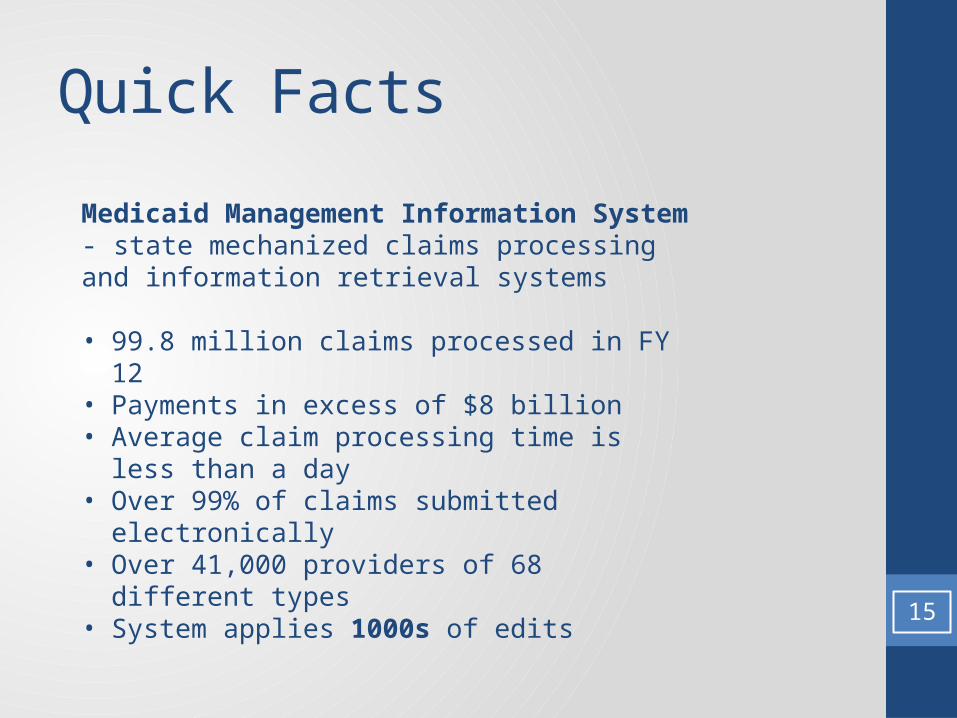
Quick Facts
Medicaid Management Information System - state mechanized claims processing and information retrieval systems
• 99.8 million claims processed in FY 12• Payments in excess of $8 billion• Average claim processing time is less than a day • Over 99% of claims submitted electronically• Over 41,000 providers of 68 different types• System applies 1000s of edits
15

Quick Facts
Pharmacy is an Optional Service available to all participants• 315,000 average monthly pharmacy users• 13.2 million claims• $1.16 billion budgeted for FY 14 • Is carved out of managed care contracts
Nursing Facilities is a Mandatory service for Medicaid programs• 23,387 average monthly users in FY 12• 8.3 million days provided• Average per diem rate in FY 12 was $138.37• Over 60% of occupied beds are paid by Medicaid 16

Provider Rates• 208.152 RSMo requires an annual parity study• Overall rate for SFY 2013 is 57% of Medicare
Program 2013 Rate as % of Medicare
Ambulance 40%
Audiology 45%
Dental 37% (UCR)
Durable Medicaid Equipment 86%
Optical 40%
Physician 59%
Rehabilitation Center Therapy 20%17

Clinical Management Examples
• Inpatient Pre-certification• Pharmacy
o Clinical Edits o Early Refill, o Dose Optimization
• Optical• DME Prior Authorizations• Psychology Prior Authorizations • Imaging Prior Authorizations• HCBS Assessments and Prior Authorizations• Psychology Prior Authorizations • Imaging Prior Authorizations• HCBS Assessments and Prior Authorizations 18

Eligibility
19

Source: Department of Social Services
20
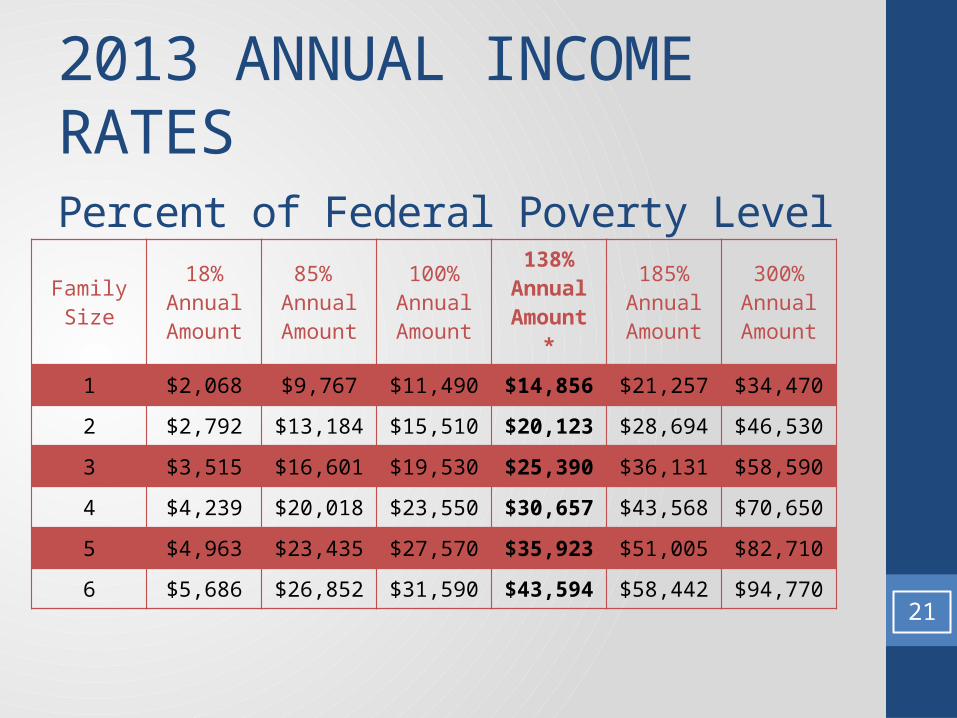
2013 ANNUAL INCOME RATESPercent of Federal Poverty Level
Family Size18%
Annual Amount
85% Annual Amount
100%Annual Amount
138%Annual
Amount *
185%Annual Amount
300%Annual Amount
1 $2,068 $9,767 $11,490 $14,856 $21,257 $34,470
2 $2,792 $13,184 $15,510 $20,123 $28,694 $46,530
3 $3,515 $16,601 $19,530 $25,390 $36,131 $58,590
4 $4,239 $20,018 $23,550 $30,657 $43,568 $70,650
5 $4,963 $23,435 $27,570 $35,923 $51,005 $82,710
6 $5,686 $26,852 $31,590 $43,594 $58,442 $94,770
21

22

MO HealthNet Enrollees and Expenditures
In SFY-2012, seniors and persons with disabilities comprised more than 27% of enrollees, however, they accounted for nearly 66% of MO HealthNet expenditures.
Number of People SFY-2012(Average Monthly)
Persons With Disabilities 167,367Seniors 77,460Pregnant Women & Custodial Parents
108,325
Children 540,824Total 893,976
*Data reflects Department of Social Services, Table 23, Medical Statistics excluding Women’s Health ServicesPersons with Disabilities include Permanently and Totally Disabled; Aid to the Blind; Blind Pension; Specified Low-Income Medicare Beneficiary; and, Ticket to Work Health Assurance Program (TWHAP)Seniors include Old Age Assistance; Qualified Medicare Beneficiary (QMB) and, Specified Low-Income Medicare Beneficiaries (SLMB)Pregnant Women & Custodial Parents include MO HealthNet for Families-Adult; Refugee; Women with Breast or Cervical Cancer; Independent Foster Care Children Ages 18-21; MO HealthNet for Pregnant Women (Poverty and Income); and, Presumptive Eligibility (Pregnant Women)Children includes MO HealthNet for Children; SCHIP (including no cost and premium enrollees); MO HealthNet for Families-Child; Foster Care; Child Welfare Services; Title XIX-Homeless, Dependent, Neglected (HDN); DYS-General Revenue; Children in a Vendor Institution; Missouri Children with Developmental Disabilities (MOCDD); Presumptive Eligibility for Children; and, Voluntary Placements
0%
25%
50%
75%
100%
60.5% - Children
25.2% - Children($1,762.1 M)
12.1% - Pregnant Women &Custodial Parents
8.7% - Seniors
17.4% - Seniors($1,218.6 M)
18.7% - Persons With Disabilities
48.5% - Persons With Disabilities
($3,398.0 M)
MO HealthNetSFY-2012
Percent of Enrollees(893,976* AverageMonthly Enrollees)
Percent of Expenditures($7,004.8 M)
8.9 % - Pregnant Women & Custodial Parents ($626.1 M)

Services and Service Delivery
24

Services
Mandatory• Physician, Nurse Practitioner, and
Nurse Midwife Services• Hospital Services–Inpatient and
Outpatient• Laboratory and Radiology
Services• Family Planning Services and
Supplies• Nonemergency Medical
Transportation (NEMT)• Federally-qualified Health Centers
and Rural Health Clinics• Comprehensive Access to Services
for Children (EPSDT)
Optional• Prescription Drugs• Eyeglasses, Prosthetic Devices• Case Management Services for
Specific Conditions
25

Service Delivery
Fee for Service
• Seniors• Persons with Disabilities• Children and Parents
outside Managed Care Counties
Managed Care
• Children and Parents inside Managed Care Counties
• $1.18 Billion budgeted for FY 12
State at Risk for Service Costs
Managed Care Plans are at Risk
for Costs of Services
26

27

Costs and Financing
28
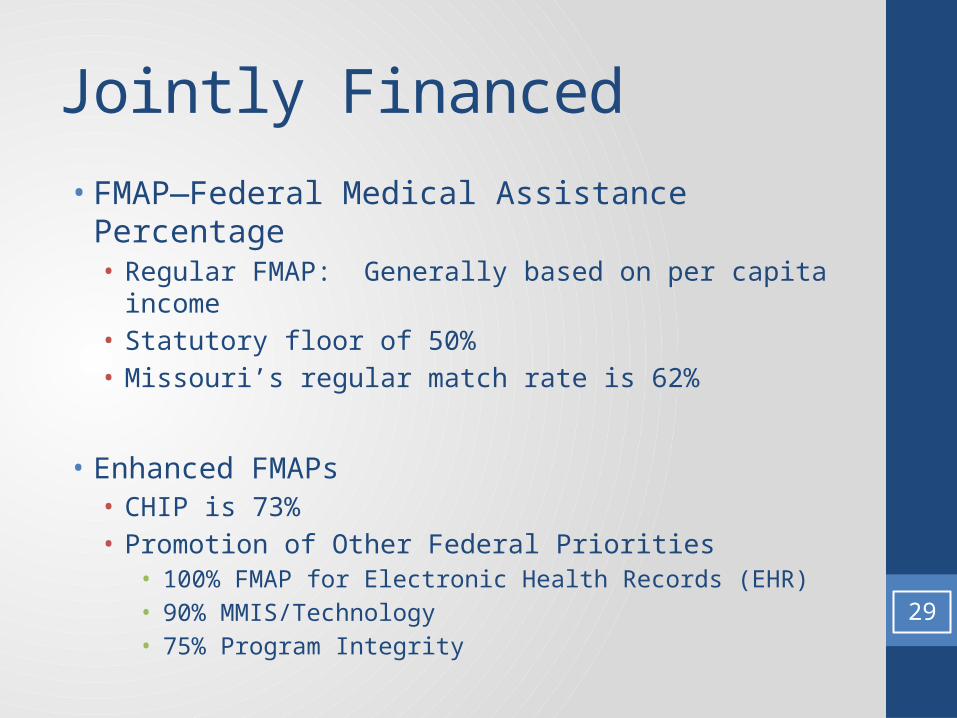
Jointly Financed
• FMAP—Federal Medical Assistance Percentage• Regular FMAP: Generally based on per capita income • Statutory floor of 50%• Missouri’s regular match rate is 62%
• Enhanced FMAPs• CHIP is 73%• Promotion of Other Federal Priorities
• 100% FMAP for Electronic Health Records (EHR)• 90% MMIS/Technology • 75% Program Integrity
• Administrative Match generally 50%29

30

Provider Taxes• Defined in federal statute
• Must be broad-based and uniform
• Providers cannot be “held harmless” from the tax• Safe harbor rate of 6% of net patient revenue
• Nearly all states have at least one provider tax• Most popular:
• Nursing home• Hospital• ICF-ID 31
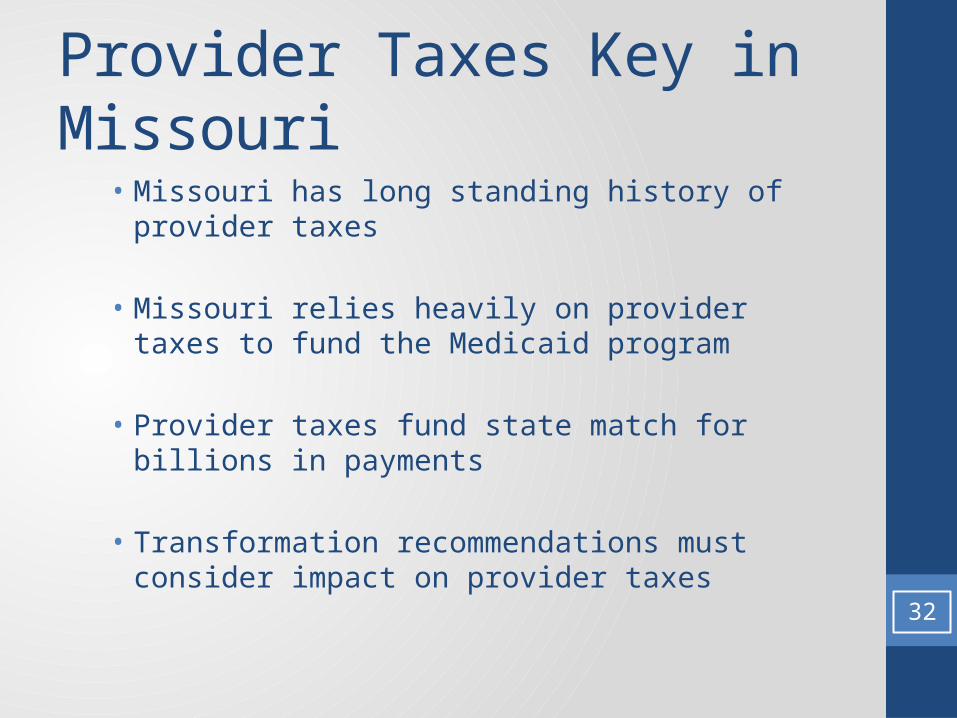
Provider Taxes Key in Missouri• Missouri has long standing history of provider taxes
• Missouri relies heavily on provider taxes to fund the Medicaid program
• Provider taxes fund state match for billions in payments
• Transformation recommendations must consider impact on provider taxes
32
Hospital Reimbursement
33

Hospital Reimbursement
Complicated Methodology Per Diem
• Based on 1995 Costs Trended to 2001 Medicaid Add-On Payments
• Makes up Difference Between old Costs and Today’s Cost• Paid for both Fee for Service and Managed Care Days• Upper Payment Level (UPL) Disproportionate Share Hospital (DSH)
Outpatient
Provider Tax funds about ½ of State Share of Payments34
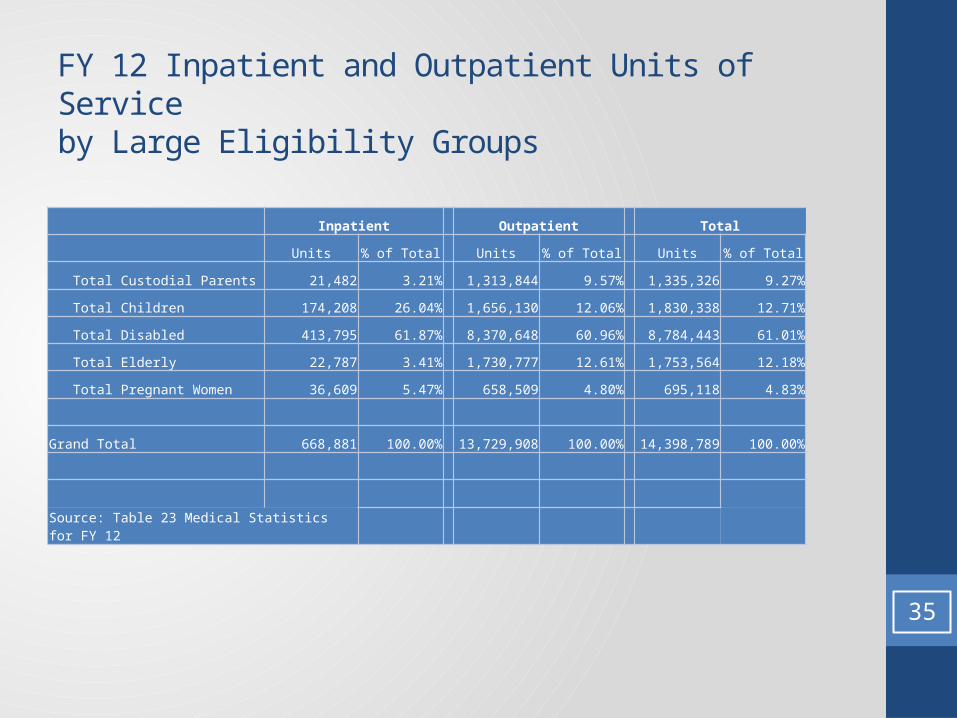
FY 12 Inpatient and Outpatient Units of Service by Large Eligibility Groups
Inpatient Outpatient Total
Units % of Total Units % of Total Units % of Total
Total Custodial Parents 21,482 3.21% 1,313,844 9.57% 1,335,326 9.27%
Total Children 174,208 26.04% 1,656,130 12.06% 1,830,338 12.71%
Total Disabled 413,795 61.87% 8,370,648 60.96% 8,784,443 61.01%
Total Elderly 22,787 3.41% 1,730,777 12.61% 1,753,564 12.18%
Total Pregnant Women 36,609 5.47% 658,509 4.80% 695,118 4.83%
Grand Total 668,881 100.00% 13,729,908 100.00% 14,398,789 100.00%
Source: Table 23 Medical Statistics for FY 12
35
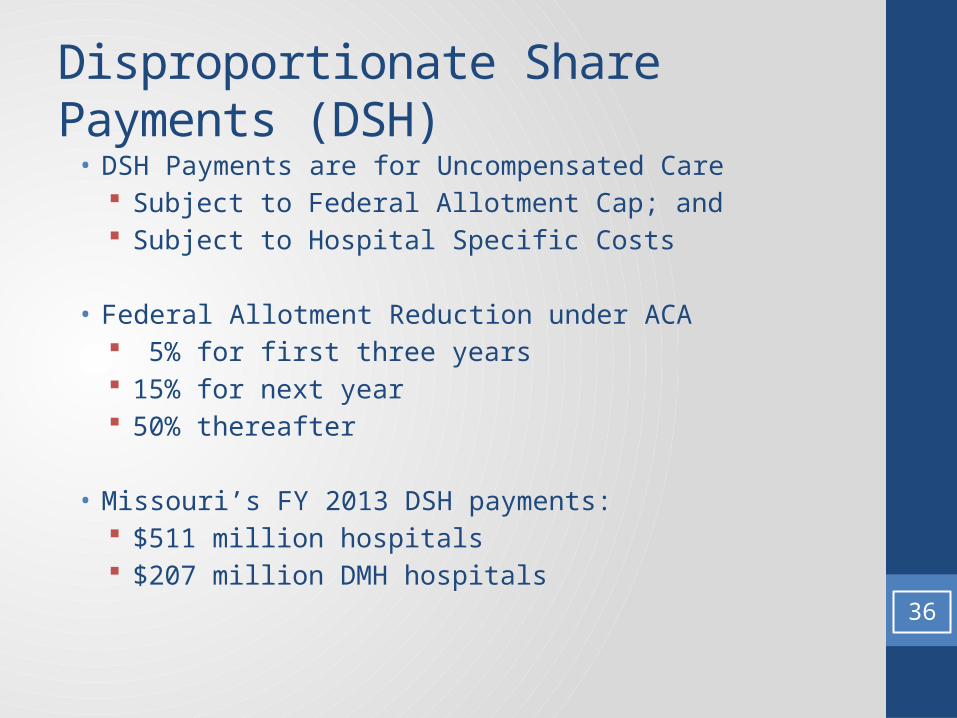
Disproportionate Share Payments (DSH)• DSH Payments are for Uncompensated Care
Subject to Federal Allotment Cap; and Subject to Hospital Specific Costs
• Federal Allotment Reduction under ACA 5% for first three years 15% for next year 50% thereafter
• Missouri’s FY 2013 DSH payments: $511 million hospitals $207 million DMH hospitals
36

Disproportionate Share Payments (DSH)
DSH Reductions written in the Federal Bill
• Secretary Determines Cut Formula based on:- Percentage of uninsured,- State’s use of DSH funds, and- State’s current DSH level
Federal Rule with Formula Issued in May
37

Why Increasing Medicaid Eligibility is Important to Missouri Hospitals?
• DSH Reductions Will Happen Both Medicare and Medicaid
• Many hospitals at Hospital Specific DSH Caps Unrelated to ACA
• Medicare DSH cuts Comparable to Medicaid
• Other Medicare Payments Impacted• Trend • Sequestration 38
ACA and Federal Health Reform
39
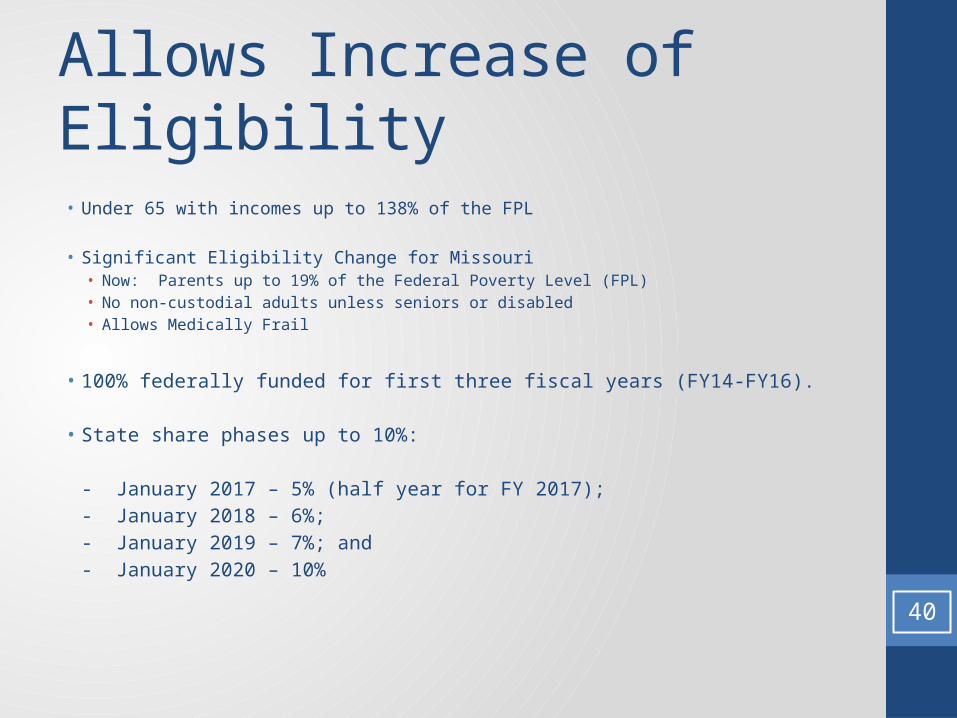
Allows Increase of Eligibility
• Under 65 with incomes up to 138% of the FPL
• Significant Eligibility Change for Missouri• Now: Parents up to 19% of the Federal Poverty Level (FPL)• No non-custodial adults unless seniors or disabled• Allows Medically Frail
• 100% federally funded for first three fiscal years (FY14-FY16).
• State share phases up to 10%:
- January 2017 – 5% (half year for FY 2017);
- January 2018 – 6%;
- January 2019 – 7%; and
- January 2020 – 10%40
41
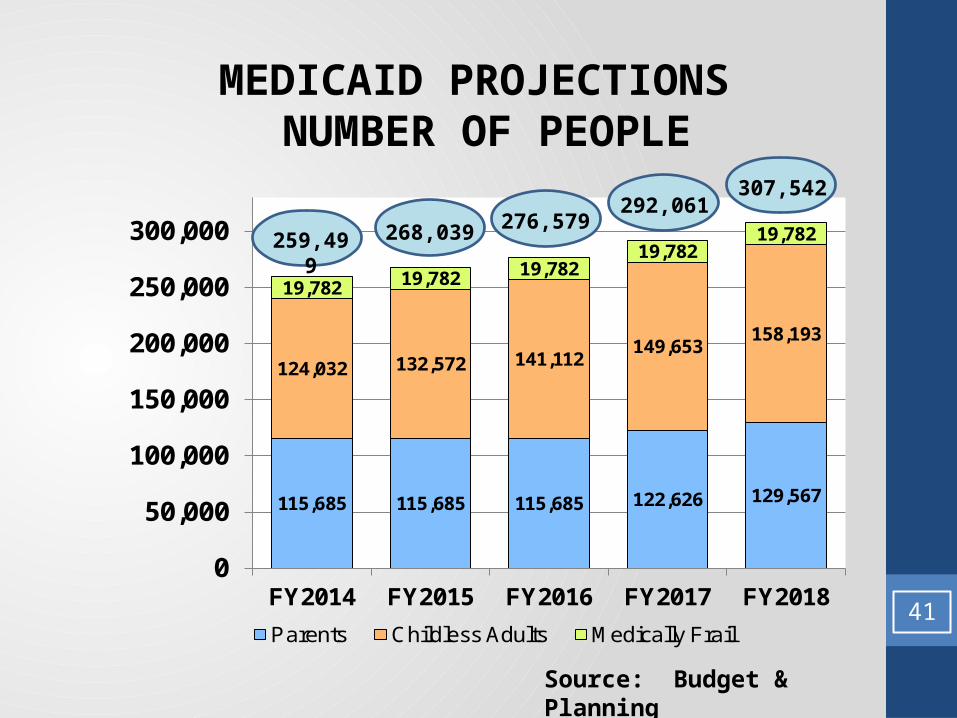
MEDICAID PROJECTIONS NUMBER OF PEOPLE
115,685 115,685 115,685 122,626 129,567
124,032 132,572 141,112149,653
158,193
19,782 19,782 19,78219,782
19,782
0
50,000
100,000
150,000
200,000
250,000
300,000
FY2014 FY2015 FY2016 FY2017 FY2018
Parents Childless Adults Medically Frail
259,499 268,039 276,579292,061
307,542
Source: Budget & Planning
Transformation Considerations
42
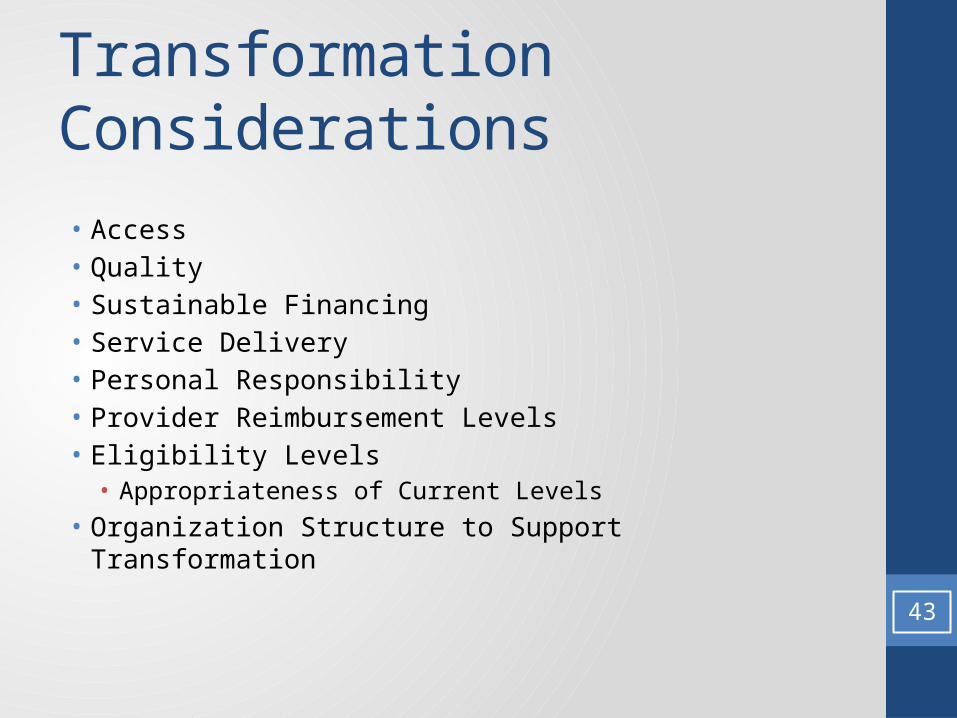
Transformation Considerations
• Access• Quality • Sustainable Financing• Service Delivery• Personal Responsibility• Provider Reimbursement Levels• Eligibility Levels
• Appropriateness of Current Levels• Organization Structure to Support Transformation
43