media. web viewsupplementary information. 1. behavioral-health variables . 2. working memory task....
TRANSCRIPT

Supplementary Information
1. Behavioral-Health Variables
2. Working memory task
3. Neuroimaging Acquisition and Preprocessing
4. WM network Activation
5. Functional Connectivity of the WM network
6. Effective connectivity of the WM network
7. Reliability Analyses
8. Alternative Analyses
9. Supplementary Discussion
10. Code Availability
11. References
12. Supplementary Figures
13. Supplementary Tables
1. Behavioral-Health DatasetWe considered 116 behavioral and health variables from the Human Connectome Project
(HCP) dataset. We excluded variables with the raw scores of measures for which age-adjusted
scores were also available and categorical variables where more than 90% of the group
endorsed the same outcome (n=130). For psychometric tests with multiple correlated outcome
variables we selected those that are more commonly reported in the literature. All variables
were considered together in the global analysis but were grouped into thematic subsets
(modules) for the modular analyses. These modules comprised psychometric variables for
affective cognitive tasks (affective cognition module), non-affective cognitive tasks (non-affective
cognition module), sensorimotor processing tasks (sensorimotor processing module),
personality and mental health variables (personality and mental health module) and physical
health and lifestyle variables (physical health and lifestyle module). All the variables are shown
in Supplementary Table 1 organized by module. Where necessary, the directionality of some
1

variables was reversed prior to entering the sparse canonical correlation analysis so that higher
values would always denote better cognitive performance, physical health or health promoting
behavior.
2. Working memory taskThe working memory (WM) task used in the HCP has a block design incorporating alternating
experimental (2-back) and sensorimotor control (0-back) conditions1. At the start of a block, a
written cue (lasting 2.5 seconds) informed participants about the type of condition to follow (2-
back or 0-back) and the designated target stimulus for the sensorimotor control condition. Four
different stimulus types (faces, places, tools and body parts) were presented in separate blocks.
Each stimulus was presented for 2 seconds, followed by a 500 millisecond (ms) inter-stimulus
interval. In the 2-back trials participants were asked to respond by pressing a button whenever
the current stimulus was the same as the one presented 2 trials back. In the 0-back condition,
participants were asked to respond by pressing a button each time they saw the designated
stimulus. Each run contained 8 blocks of 10 trials, each lasting 2.5 seconds, and 4 fixation
blocks each lasting 15 seconds.
3. Neuroimaging Acquisition and Preprocessing Task and resting-state functional magnetic resonance imaging (task- and rs-fMRI, respectively)
data were acquired on a Siemens Skyra 3T scanner according to HCP protocols. Both
acquisitions used an image matrix=104x90; voxel resolution=2 mm isotropic; slice thickness=2
mm; repetition time=720 ms; echo time=33.1 ms; field of view=208 x 180 mm; flip angle=52
degrees. Each task- and rs-fMRI dataset respectively comprised 405 and 1200 volumes.
All data were de-identified prior to release as described by van Essen and Barch2. Head
movement artifacts were minimized by using strict criteria regarding head motion and overall
quality control. Task- and rs-fMRI data were preprocessed using the HCP pipeline as described
by Glasser and colleagues3. Data preprocessing was carried out using tools from FSL4,
FreeSurfer5 and the HCP workbench6. For rs-fMRI, an additional preprocessing step was
applied to minimize head motion by removing structured artifacts using an automatic denoising
approach based on independent component analysis (ICA) followed by FMRIB's ICA-based X-
noiseifier7,8.
4. WM network activation
2

General linear model analyses were implemented using Statistical Parametric Mapping
(SPM12) (www.fil.ion.ucl.ac.uk/spm/software/spm12/). The baseline was not explicitly modeled.
The preprocessed single-participant images were analyzed using a linear convolution model,
with vectors of onset representing the experimental (2-back) and the sensorimotor control
condition (0-back). Six movement parameters were also entered as nuisance covariates. Serial
correlations were removed using an AR(1) model. A high-pass filter (128 seconds) was applied
to remove low-frequency noise. In each participant, images were produced for the 2-back vs 0-
back contrast and for the 0-back vs. baseline contrast.
Brain regions activated by the WM-network were identified using a random-effects one-sample
t-test of the single-participant contrast images for the 2-back vs 0-back condition. The statistical
threshold was set to p<0.05 with family-wise error (FWE) correction at voxel level. All results
were reported in Montreal Neurological Institute (MNI) space. Using the above parameters we
identified WM-network nodes bilaterally in the dorsolateral prefrontal cortex (dlPFC), inferior
parietal lobule (PAR), dorsal anterior cingulate cortex (dACC), and the visual cortex (VC)
(Supplementary Table 2 and Supplementary Figure 1). These regions are entirely consistent
with those expected based on previous meta-analyses of this task9,10. In each individual, we
then created 4-mm radius spherical volumes-of-interest (VOIs) centered on the group peak
coordinates of each network node and extracted the mean beta values, separately for the
experimental and sensorimotor control conditions. The beta values of these two contrasts were
correlated below an absolute value of 0.3. In total 24 variables per individual, representing the
task-related activation module of the imaging dataset, were entered in the sCCAs.
5. Functional ConnectivityFunctional connectivity in fMRI is inferred on the basis of pairwise correlations of the blood-
oxygen-level-dependent (BOLD) signal between brain regions. We extracted and averaged the
time series from the 12 VOIs defined above (Section 4: WM network Activation). For each
participant, we computed the functional connectivity between each pair of VOIs using Pearson’s
correlation followed by a Fisher-Z transformation. These metrics were computed separately in
the resting-state and task-related fMRI datasets. In total there were 66 task-related and 66
resting-state functional connectivity variables per individual (respectively comprising the task-
related and resting-state functional connectivity modules) that were then used for the sCCAs.
6. Effective connectivity
3

Effective connectivity is described as causal as it refers to the influence that one neural
grouping exerts over another; it is therefore time (i.e., dynamic) and experiment (i.e., task)
dependent11,12. We assessed effective connectivity in the WM-network using Dynamic Causal
Modeling (DCM) implemented in DCM12 within SPM12. In DCM for fMRI, the dynamics of the
neural states underlying regional BOLD responses are modeled by a bilinear differential
equation that describes how the neural states change as a function of their intrinsic (i.e., task-
independent) connections, the task-related modulatory effects on these intrinsic connections,
and the driving inputs13,14.
Model Selection and Specification of Model Architecture: The anatomic network was based on
prior evidence from meta-analytic studies of the n-back task9,10, our previous DCM studies of n-
back working memory15-17 and the current results (Section 4: WM network Activation). Therefore
for the anatomical DCM layout, we selected the VOIs in the dlPFC, PAR, dACC and VC that
were defined following the second-level analysis (Section 4: WM network Activation). Neural
network models of WM are not intended to reproduce all known aspects of WM. This is because
overly complex models will start fitting noise (over-fitting) and are less generalizable. A good
model represents the optimal balance between accuracy, complexity and generalizability 11,12. In
DCM, the WM-network is best modeled using the simplest possible circuit diagram that can
account for the observed data. Bayesian Model Selection, a robust statistical approach, is then
applied to derive model evidence to support model selection. Therefore, the bilateral
homologous VOIs were combined to form one time series and then adjusted for the F-contrast
of all conditions of interest (2-back and 0-back). Bidirectional intrinsic (i.e., task-independent)
connections were specified between the VOIs. Starting from this basic layout, a structured
model space was derived by considering the modulatory effect of the 2-back condition on each
connection to produce 12 alternative DCM models (Supplementary Figure 2A). For control
purposes we also computed a non-modulated model. The task-related information (driving
input) entered through the VC in all models17.
Bayesian Model Selection and Bayesian Model Averaging: We used random effects Bayesian
model selection (BMS) to compare the DCM models in terms of the (log) evidence of the model
(i.e., the probability of the observed data for any given model)18. We report the posterior
probabilities and protected exceedance probability of each model (i.e., the probability that this
model is more likely than any other tested models to generate the given group data) 18
(Supplementary Figure 2B). To accommodate uncertainty about the models, we used Bayesian
Model Averaging (BMA) to obtain average connectivity estimates (weighted by their posterior
model probability) across all models for each individual19. Models with a lower posterior
4

probability contribute less to the estimation of the marginal posterior. In total we computed 44
DCM variables that were used in the sCCAs.
7. Reliability Analyses7.1 Resampling
We tested the robustness of the results of the global analysis by randomly resampling half of the
sample (n=411) 5000 times and repeating the sCCA each time resulting in a mean r-value=
0.53, standard-deviation=0.03. The robustness of each modular result is presented in
supplementary table 7. The results of all replication analyses were within two standard
deviations for any of the significant sCCAs. For the global analysis, we additionally treated each
of those samples as a training and test set and used the weights from each of the 5000
permutation to create two scores (one for the behavioral data, one for the imaging data) for
each of the 412 participants in the training set. The mean r-value of these scores in the test set
was 0.39 (SD = 0.06), indicating that the overall sCCA overfits only slightly. Moreover, the
average correlation of the individual variables between the test set and both the training set and
the entire set (see Supplementary Figure 4) was r>0.98. The test sets had slightly lower mean |
r| value and fairly low standard deviations (imaging variables with the behavioral score: overall
set, mean |r| = 0.05; training set: mean |r| = 0.05, mean sd = 0.03; test set: mean |r| = 0.07,
mean sd = 0.03; behavioral variables with the imaging score: overall set, mean |r| = 0.09;
training set: mean |r| = 0.10, mean sd = 0.04; test set: mean |r| =0.07, mean sd = 0.04).
7.2. Confounders We tested the effect of potential confounders (i.e. intra-cranial volume, acquisition sequence,
and age) on our results. The sCCA results were virtually unchanged if we did regress these
confounds out of either dataset, or if we only regressed them out of the functional dataset. The
detail of the correlations between the confounders and the imaging dataset is reported in
supplementary table 10. We used sex to exemplify the lack of effect for potential confounders.
As shown in supplementary table 8, there was no major difference in the main results between
men and women only.
7.3. Comparison with non-Sparse CCATo confirm that our results were independent of the analytic method used, we also conducted a
non-sparse CCA. For this we applied similar methods to Smith et al.20, by first performing a
principal component analysis in order to reduce the number of variables to 100 on each side
5

and then perform non-sparse CCA. To test significance we performed 5000 permutations and
then repeated the non-Sparse CCA step for each of them. This CCA correlated at r=0.687 (p-
value=0.0002). As shown in supplementary table 9, individual variables correlated fairly similarly
to the imaging pattern as given in the CCA.
7.4. Accounting for familial structureThe HCP data contains numerous participants who were related (370 independent families from
1 to 4 members). In order to ensure that our findings were not overly influenced by this possible
genetic confounder, we performed an additional analysis accounting for family structure.
Following Smith et al.’s method20, we replaced all rows (in both imaging and non-imaging
datasets) from a given family with the average row across all family members, for each family,
and re-ran the sCCA. The global sCCA correlation remained highly significant (r=0.62,
p=0.0004). At the variable level, we found that the r-values of the individual variables with the
opposite variate from the original analysis (n=823) remained highly correlated with the r-values
from the model that accounted for family structure (n=370) (correlation of r-values of the 116
behavior-health variables with the imaging mode: r=0.97, correlation of the 200 imaging
variables with the behavioral mode: r=0.95). This suggests that our results are not directly
affected by familiality.
8. Alternative Analyses
8.1. DCM modular sCCA following removal of exceedance probabilities
In order to test whether the model exceedance probabilities contributed to the pattern of
correlation between the DCM and behavioral-health variates we conducted the analysis after
removing all information on exceedance probabilities. The results were not affected; as before
the DCM variate correlated with non-affective cognition (r=0.029, p=0.0006) but not with
affective cognition (r=0.20, p=0.15), physical health and lifestyle (r=0.18, p=0.85), personality &
mental health (r=0.20, p=0.41) or sensorimotor processing (r=0.19, p=0.62).
8.2. Alternative DCM model space
To ensure the reliability of the results in the sense that they may not depend on a specific model
space, we also explored an alternative model space (Supplementary Figure 3). These included:
(a) specification of anatomical WM-models with bilateral VOIs in the dlPFC, PAR, dACC and
6

VC; (b) simultaneous modelling of WM modulation in all forward, all backward, and all lateral
inter-hemispheric connections; and (c) combinations of these 3 modulatory options.
The choice of model space had no effect on the global analysis. Similarly, the results of the
modular sCCA remained unchanged, the DCM variate showed significant correlation with the
non-affective cognition variate, indicating that the specific choice of model space does not affect
the main results of the study in a major way.
8.3. Resting-state networks
To clarify whether the association between the physical health and lifestyle module and
functional connectivity measures was specific to the working memory network, we computed an
additional sCCA between resting-state functional connectivity measures extracted from 8 major
resting-state networks and the physical health and lifestyle module. We examined the eight
resting-state networks that are the most reliably described in the literature21,22: the ventral and
dorsal default-mode networks, the left and right executive control network, the salience network,
the sensorimotor network, the visual network, and the auditory network. We defined these
networks using their respective masks freely available on
http://findlab.stanford.edu/functional_ROIs.html23. We calculated the resting-state functional
connectivity between each pair of network, for each individual. These computations resulted in
28 resting-state functional connectivity measures per subject. We found that the modular sCCA
significant (r=0.29, p=0.0002), showing that higher body mass index and higher blood pressure
had a detrimental effect on resting-state functional connectivity (both p<0.05, Bonferroni
Corrected). This finding confirms that lifestyle and physical health has not only an impact on the
working memory network activity but also on the whole brain intrinsic organization.
9. Supplementary DiscussionConsistent with the notion that the WM-network identified via the 2-back task has a domain-
general role24,25, we found that WM-network activation and effective connectivity were
associated with a wide range of higher-order functions relating to executive control of attention,
visual orientation and language. Specifically, meta-analyses of neuroimaging studies have
shown that the WM regions, as identified here, are part of a super-ordinal network subserving
cognitive control across multiple tasks26. This network appears to overlap with a super-ordinal
network for affect processing, particularly in the dorsal prefrontal cortex and dorsal anterior
cingulate cortex and portions of the visual cortex27,28. This observation is consistent with the
7

correlation between WM-activation and the affective processing variate (Supplemental Table 5).
The mental health and personality variate was correlated with WM-network activation included
items reflecting personality dimensions and self-report ratings of affective state. Personality
dimensions, particularly those assessed with the NEO-Personality Inventory, are known to have
brain functional and structural correlates that also overlap with the WM-network29,30. The task-
related and resting-state functional connectivity of the WM showed some degree of correlation
with the affective, non-affective and mental health and personality variate (r range: 0.16-0.26)
which did not reach statistical significance. A possible explanation for this is that the functional
connectivity of a task-related network shows relative specificity for that particular task as they
may reflect the brain configuration necessary for task performance. Conversely, regional brain
activations are less likely to be task-specific shown by multiple meta-analyses of the
neuroimaging literature26-28,30. Task-activation, task- and resting-state functional connectivity
were correlated with the physical health and lifestyle variate. This close dependency between
physical traits and task-related brain activation and connectivity and resting state connectivity is
not specific to WM as it was also observed in connection to whole-brain resting-state
connectivity as shown in our supplemental analyses. The same correlation pattern has also
been reported in data from the 5000 participants of the UKBiobank31 and is likely to reflect the
fact that these imaging metrics are directly derived from changes in the hemodynamic brain
responses and seem sensitive to cardiometabolic factors that may affect blood oxygenation.
This observation is further supported by the lack of a significant correlation between physical
traits and DCM-derived connectivity which may be accounted for by the fact that DCM
measures derive from the transformation of neuronal activity into hemodynamic response13.
10. Code availability
The imaging and behavioral-health variables were z-standardized and entered into sCCAs
implemented in MatlabR2015b using an in-house script. This code is available under request to
Dr. Alex Ing ([email protected]).
11. References
1. Barch DM, Braver TS, Nystrom LE, Forman SD, Noll DC, Cohen JD. Dissociating working memory from task difficulty in human prefrontal cortex. Neuropsychologia 1997; 35(10): 1373-1380.
8

2. Van Essen DC, Barch DM. The human connectome in health and psychopathology. World Psychiatry 2015; 14(2): 154-157.
3. Glasser MF, Sotiropoulos SN, Wilson JA, Coalson TS, Fischl B, Andersson JL et al. The minimal preprocessing pipelines for the Human Connectome Project. Neuroimage 2013; 80: 105-124.
4. Jenkinson M, Beckmann CF, Behrens TE, Woolrich MW, Smith SM. Fsl. Neuroimage 2012; 62(2): 782-790.
5. Fischl B, Sereno MI, Dale AM. Cortical surface-based analysis. II: Inflation, flattening, and a surface-based coordinate system. Neuroimage 1999; 9(2): 195-207.
6. Marcus DS, Harms MP, Snyder AZ, Jenkinson M, Wilson JA, Glasser MF et al. Human Connectome Project informatics: quality control, database services, and data visualization. Neuroimage 2013; 80: 202-219.
7. Griffanti L, Salimi-Khorshidi G, Beckmann CF, Auerbach EJ, Douaud G, Sexton CE et al. ICA-based artefact removal and accelerated fMRI acquisition for improved resting state network imaging. Neuroimage 2014; 95: 232-247.
8. Salimi-Khorshidi G, Douaud G, Beckmann CF, Glasser MF, Griffanti L, Smith SM. Automatic denoising of functional MRI data: combining independent component analysis and hierarchical fusion of classifiers. Neuroimage 2014; 90: 449-468.
9. Owen AM, Herrod NJ, Menon DK, Clark JC, Downey SP, Carpenter TA et al. Redefining the functional organization of working memory processes within human lateral prefrontal cortex. Eur J Neurosci 1999; 11(2): 567-574.
10. Rottschy C, Langner R, Dogan I, Reetz K, Laird AR, Schulz JB et al. Modelling neural correlates of working memory: a coordinate-based meta-analysis. Neuroimage 2012; 60(1): 830-846.
11. Aertsen A, Preissl H. Dynamics of activity and connectivity in physiological neuronal networks. . In: Schuster HG (ed). Nonlinear Dynamics and Neuronal Networks. Wiley-VCH: New York, 1991, pp 281-302.
12. Friston KJ. Functional and effective connectivity: a review. Brain Connect 2011; 1(1): 13-36.
13. Friston KJ, Harrison L, Penny W. Dynamic causal modelling. Neuroimage 2003; 19(4): 1273-1302.
9

14. Stephan KE, Weiskopf N, Drysdale PM, Robinson PA, Friston KJ. Comparing hemodynamic models with DCM. Neuroimage 2007; 38(3): 387-401.
15. Dima D, Friston KJ, Stephan KE, Frangou S. Neuroticism and conscientiousness respectively constrain and facilitate short-term plasticity within the working memory neural network. Hum Brain Mapp 2015; 36(10): 4158-4163.
16. Dima D, Jogia J, Frangou S. Dynamic causal modeling of load-dependent modulation of effective connectivity within the verbal working memory network. Hum Brain Mapp 2014; 35(7): 3025-3035.
17. Dima D, Roberts RE, Frangou S. Connectomic markers of disease expression, genetic risk and resilience in bipolar disorder. Transl Psychiatry 2016; 6: e706.
18. Stephan KE, Penny WD, Daunizeau J, Moran RJ, Friston KJ. Bayesian model selection for group studies. Neuroimage 2009; 46(4): 1004-1017.
19. Penny WD, Stephan KE, Daunizeau J, Rosa MJ, Friston KJ, Schofield TM et al. Comparing families of dynamic causal models. PLoS Comput Biol 2010; 6(3): e1000709.
20. Smith SM, Nichols TE, Vidaurre D, Winkler AM, Behrens TE, Glasser MF et al. A positive-negative mode of population covariation links brain connectivity, demographics and behavior. Nat Neurosci 2015; 18(11): 1565-1567.
21. Damoiseaux JS, Rombouts SA, Barkhof F, Scheltens P, Stam CJ, Smith SM et al. Consistent resting-state networks across healthy subjects. Proc Natl Acad Sci U S A 2006; 103(37): 13848-13853.
22. Smith SM, Fox PT, Miller KL, Glahn DC, Fox PM, Mackay CE et al. Correspondence of the brain's functional architecture during activation and rest. Proc Natl Acad Sci U S A 2009; 106(31): 13040-13045.
23. Shirer WR, Ryali S, Rykhlevskaia E, Menon V, Greicius MD. Decoding subject-driven cognitive states with whole-brain connectivity patterns. Cereb Cortex 2012; 22(1): 158-165.
24. Engle RW, Kane MJ. Executive attention, working memory capacity and two-factor theory of cognitive control. In: Ross B (ed). The Psychology of Learning and Motivation. Elsevier: New York, 2004, pp 145–199.
10

25. Kane MJ, Conway ARA, Hambrick DZ, Engle RW. Variation in working memory capacity as variation in executive attention and control. In: Conway ARA, Jarrold C, Kane MJ, Miyake A, Towse JN (eds). Variation in working memory. Oxford University Press: New York, 2007.
26. Niendam TA, Laird AR, Ray KL, Dean YM, Glahn DC, Carter CS. Meta-analytic evidence for a superordinate cognitive control network subserving diverse executive functions. Cogn Affect Behav Neurosci 2012; 12(2): 241-268.
27. Fusar-Poli P, Placentino A, Carletti F, Landi P, Allen P, Surguladze S et al. Functional atlas of emotional faces processing: a voxel-based meta-analysis of 105 functional magnetic resonance imaging studies. J Psychiatry Neurosci 2009; 34(6): 418-432.
28. Lindquist KA, Satpute AB, Wager TD, Weber J, Barrett LF. The Brain Basis of Positive and Negative Affect: Evidence from a Meta-Analysis of the Human Neuroimaging Literature. Cereb Cortex 2016; 26(5): 1910-1922.
29. Kapogiannis D, Sutin A, Davatzikos C, Costa P, Jr., Resnick S. The five factors of personality and regional cortical variability in the Baltimore longitudinal study of aging. Hum Brain Mapp 2013; 34(11): 2829-2840.
30. O'Gorman RL, Kumari V, Williams SC, Zelaya FO, Connor SE, Alsop DC et al. Personality factors correlate with regional cerebral perfusion. Neuroimage 2006; 31(2): 489-495.
31. Miller KL, Alfaro-Almagro F, Bangerter NK, Thomas DL, Yacoub E, Xu J et al. Multimodal population brain imaging in the UK Biobank prospective epidemiological study. Nat Neurosci 2016; 19(11): 1523-1536.
11

12. Supplementary Figures
Figure 1. Overall study design. WMN: Working memory network
12

Figure 2. Dynamic Causal Model used in main analyses. The DCM is a 4-node working
memory model with the driving input to the visual cortex. (A) Each arrow represents the
connections between the model nodes; each number represents an individual model. Green
arrows represent modulated forward connections and blue arrows represent modulated
backward connections. (B) Posterior probabilities of the Bayesian Model Selection comparing all
12 tested including the null-model (no WM modulation) as control. (C) Results of the Bayesian
Model Selection comparing the exceedance probabilities of all models tested. The Bayesian
omnibus risk is < 0.001.
13

Figure 3. Alternative Dynamic Causal Models tested for reliability
14

The DCM is an 8-node working memory model with the driving input to the visual cortex in either Hemisphere. Each arrow represents the connections between the model nodes. Green arrows represent modulated forward connections and blue arrows represent modulated backward connections and brown connections represent lateral connections. The tested models included a model that modulated all forward connections (FW), one that modulated all backward connections (BW), one that connected all lateral connections (LAT) and combinations of these 3 models.
15

Figure 4. Reliability Analysis. The Y-axis represents the mean r-value of 5000 resampled test
sets (n=412 each). Each Y-value is the correlation (mean r-value) of an individual variable with
the opposing overall score (gained each time from the weights of the respective 5000 test sets).
(A) Each X-value is the correlation of an individual variable with the opposing overall score
within the overall sample (n=823). (B) Each X-value is the correlation (mean r-value) of an
individual variable with the opposing overall score within 5000 resampled training sets of n=411.
16

13. Supplementary Tables
Table 1. Behavioral Variables organized by module
Physical Health and Lifestyle Module (n = 24)Category Variable Name Full Description of the VariableSleep PSQI_Latency30Min Pittsburg Sleep Quality Index: No asleep within
30minSleep PSQI_Score Sleep Quality (Pittsburg Sleep Quality Index: Total
Score)Sleep PSQI_WakeUp1 Pittsburg Sleep Quality Index: Trouble to wake upSleep PSQI_AmtSleep Amount of Sleep (Pittsburg Sleep Quality Index:
Total Score)Sleep PSQI_Min2Asleep1 Pittsburg Sleep Quality Index: Total ScoreWeight BMI1 Body mass IndexDrug Use SSAGA_Mj_Times_Used1 Times used marijuanaDrug Use SSAGA_Mj_Age_1st_Use1 Age at first marijuana useDrug Use THC1 Use of Marijuana (Test for Marijuana)Alcohol Use SSAGA_Alc_12_Max_Drinks1 Previous drinking problems (Max drinks in a single
day in past 12 months)Alcohol Use SSAGA_Alc_Hvy_Frq_Drk1 Binge drinking (Drinks per day in heaviest 12-
month period)Smoking Habit Total_Any_Tobacco_7days1 Tobacco Use (Total times used/smoked any
tobacco in past 7 days)Hemoglobin HbA1C1 Hemoglobin A1C
Hematocrit Hematocrit_1 Hematocrit Sample 1Hematocrit Hematocrit_2 Hematocrit Sample 2Blood Pressure BPSystolic1 Systolic Blood Pressure
Blood Pressure BPDiastolic1 Diastolic Blood Pressure
Endurance Endurance_AgeAdj Physical Endurance (2-min walk endurance test)Handedness Handedness Handedness
Family History FamHist_Moth_None No Maternal History of psychiatric illness
Family History FamHist_Fath_None No Paternal History of psychiatric illness
Female Only Menstrual_AgeBegan Females only: age at menarche
Female Only Menstrual_DaysSinceLast
Females only: Number of Days since last menstrual cycle ((only used in sex-specific supplemental analysis)
Female Only Menstrual_CycleLength Females only: Length of cycle (only used in sex-
specific supplemental analysis)
Mental Health & Personality Module (n = 17)
17

Table 1. Behavioral Variables organized by module
Personality NEOFAC_C1 NEO-Five-Factor Model ConscientiousnessPersonality NEOFAC_E1 NEO-Five-Factor Model ExtroversionPersonality NEOFAC_A NEO-Five-Factor Model AgreeablenessPersonality NEOFAC_O NEO-Five-Factor Model OpennessPersonality NEOFAC_N NEO-Five-Factor Model NeuroticismLife Function ASR_Totp_T1 Adult self-report Total T scoreLife Function ASR_TAO_Sum1 Adult self-report : Sum of Thought, Attention, and
Other ProblemsLife Function ASR_Intn_T1 Adult self-report internalizing T scoreLife Function ASR_Extn_T1 Adult self-report externalizing T scoreLife Function ASR_Anxd_Pct1 Adult self-report anxious/depressedLife Function ASR_Witd_Pct1 Adult self-report withdrawnLife Function ASR_Soma_Pct1 Adult self-report somatic complainsLife Function ASR_Thot_Pct1 Adult self-report thought problemsLife Function ASR_Attn_Pct1 Adult self-report attention problemsLife Function ASR_Aggr_Pct1 Adult self-report aggressive behaviorLife Function ASR_Rule_Pct1 Adult self-rule breaking behaviorLife Function ASR_Intr_Pct1 Adult self-rule intrusive
Affective Cognition Module (n = 24)Emotion ER40SAD Penn Emotion Recognition: Correct Sad
IdentificationsEmotion ER40NOE Penn Emotion Recognition: Correct Neutral
IdentificationsEmotion ER40ANG Penn Emotion Recognition: Correct Anger
IdentificationsEmotion ER40HAP Penn Emotion Recognition: Correct Happy
IdentificationsEmotion ER40FEAR Penn Emotion Recognition: Correct Fear
IdentificationsEmotion ER40_CRT1 Penn Emotion Recognition: Correct Responses
median Response TimeEmotion ER40_CR Penn Emotion Recognition: Number of Correct
ResponsesEmotion Sadness_Unadj Sadness SurveyEmotion LifeSatisf_Unadj General Life Satisfaction SurveyEmotion MeanPurp_Unadj Meaning and Purpose SurveyEmotion PosAffect_Unadj Positive Affect SurveyEmotion PercReject_Unadj Perceived Rejection SurveyEmotion EmotSupp_Unadj Emotional Support SurveyEmotion PercStress_Unadj Perceived Stress SurveyEmotion SelfEff_Unadj Self-Efficacy SurveyEmotion AngAffect_Unadj1 Anger-Affect SurveyEmotion AngHostil_Unadj1 Anger Hostility SurveyEmotion AngAggr_Unadj1 Anger-Physical Aggression SurveyEmotion FearAffect_Unadj1 Fear-Affect SurveyEmotion FearSomat_Unadj1 Fear-Somatic Arousal Survey
18

Table 1. Behavioral Variables organized by module
Emotion Friendship_Unadj Friendship SurveyEmotion Loneliness_Unadj1 Loneliness SurveyEmotion PercHostil_Unadj1 Perceived hostility SurveyEmotion InstruSupp_Unadj Instrumental Support Survey
Non-Affective Cognition Module (n = 37)Verbal Episodic Memory
IWRD_TOT Penn Word Memory Test: Number of Correct Responses
Verbal Episodic Memory
IWRD_RTC1 Penn Word Memory Test: Correct Responses median Response Time
Sustained Attention
SCPT_SEN Short Penn Continuous Performance Test Sensitivity
Sustained Attention
SCPT_SPEC Short Penn Continuous Performance Test Specificity
Sustained Attention
SCPT_TP Short Penn Continuous Performance Test True Positives
Sustained Attention
SCPT_LRNR1 Short Penn Continuous Performance Test Longest Run of Non-Responses
Sustained Attention
SCPT_TN Short Penn Continuous Performance Test True Negatives
Sustained Attention
SCPT_FP1 Short Penn Continuous Performance Test False Positives
Sustained Attention
SCPT_FN1 Short Penn Continuous Performance Test False Negatives
Spatial Orientation
VSPLOT_OFF1 Penn Line Orientation: Total Positions Off for all Trials
Spatial Orientation
VSPLOT_CRTE Penn Line Orientation: Median Reaction Time Divided by expected number of Clicks for correct trials
Spatial Orientation
VSPLOT_TC Penn Line Orientation: Total Number Correct
Impulsivity DDisc_AUC_40K Delay Discounting: Area under the curve for discounting of $K40
Impulsivity DDisc_AUC_200 Delay Discounting: Area under the curve for discounting of $200
Impulsivity DDisc_SV_1mo_40K Delay Discounting: Subjective Value for $K40 at 1 month
Impulsivity DDisc_SV_6mo_40K Delay Discounting: Subjective Value for $K40 at 6 months
Impulsivity DDisc_SV_1yr_40K Delay Discounting: Subjective Value for $K40 at 1 year
Impulsivity DDisc_SV_3yr_40K Delay Discounting: Subjective Value for $K40 at 3 years
Impulsivity DDisc_SV_5yr_40K Delay Discounting: Subjective Value for $K40 at 5 years
Impulsivity DDisc_SV_10yr_40K Delay Discounting: Subjective Value for $K40 at
19

Table 1. Behavioral Variables organized by module
10 yearsImpulsivity DDisc_SV_1mo_200 Delay Discounting: Subjective Value for $200 at 1
monthImpulsivity DDisc_SV_6mo_200 Delay Discounting: Subjective Value for $200 at 6
monthsImpulsivity DDisc_SV_1yr_200 Delay Discounting: Subjective Value for $200 at 1
yearImpulsivity DDisc_SV_3yr_200 Delay Discounting: Subjective Value for $200 at 3
yearsImpulsivity DDisc_SV_5yr_200 Delay Discounting: Subjective Value for $200 at 5
yearsImpulsivity DDisc_SV_10yr_200 Delay Discounting: Subjective Value for $200 at
10 yearsLanguage PicVocab_AgeAdj Picture Vocabulary TestWorking Memory
ListSort_Unadj List Sorting Working Memory Test
Processing Speed
ProcSpeed_AgeAdj Pattern Completion Processing Speed scale score
Fluid Intelligence
PMAT24_A_SI1 Penn Matrix Test: Total Skipped Items
Fluid Intelligence
PMAT24_A_CR Fluid Intelligence (Penn Matrix Test: Number of Correct Responses)
Fluid Intelligence
PMAT24_A_RTCR1 Penn Matrix Test: Median Reaction Time for Correct Responses
Cognitive Status
MMSE_Score Mini Mental Status Exam Total Score
Episodic Memory
PicSeq_AgeAdj Picture Sequence memory Test
Executive Function
CardSort_AgeAdj Dimensional Change Card Sort Scale Score
Executive Function
Flanker_AgeAdj Flanker Inhibitory Control and Attention Test
Language ReadEng_AgeAdj Reading Recognition Scale Score
Sensorimotor Processing Module (n = 10)Sensory Mars_Errs1 Errors on Mars Contrast SensitivitySensory Mars_Final Final Contrast Sensitivity ScoreSensory Mars_Log_Score Contrast Sensitivity ScoreStrength Strength_AgeAdj Strength test scale scoreLocomotion GaitSpeed_Comp 4-Meter Walk Gait Speed TestTaste Taste_AgeAdj Taste IntensityAudition Noise_Comp AuditionDexterity Dexterity_AgeAdj Pegboard Dexterity test scale scorePain PainInterf_Tscore Pain Intensity and InterferenceOlfaction Odor_AgeAdj Odor Identification
More information on the variables:
20

Table 1. Behavioral Variables organized by module
https://www.humanconnectome.org/documentation/Q3/HCP_Q3_Release_Appendix_VII.pdf1 directionality of values reversed in the sparse canonical correlation analysis so that higher values denote better performance, outcome or physical health or health promoting behavior
21

Table 2. Suprathreshold activation clusters in the 2-back task
Region Laterality Cluster Size
Co-ordinatest
X Y ZInferior Parietal Lobe Right 9104 44 -38 42 33.12
Left -42 -48 44 31.42Dorsolateral Prefrontal Cortex Right 27417 28 8 58 32.66
Left -28 4 60 30.18Dorsal Anterior Cingulate Cortex
Right 2 22 44 26.90Left -2 24 44 26.88
Right 198 4 12 26 11.89Inferior Occipital Gyrus Left 513 -12 -94 0 15.32
Right 35 16 -90 -8 8.03Lingual Gyrus Left 79 -28 -86 -16 8.77Middle Temporal Gyrus Left 76 -50 -38 -6 8.29
Right 46 50 -42 -2 7.41Statistical threshold p<0.05, familywise error correction at voxel level; k>30; coordinates are in MNI space
22

Table 3: Global Analysis: Behavioral-health variables most strongly correlated to the complete imaging variateMeasure Correlation Module of the measurePenn Progressive Matrices(Fluid Intelligence)1 0.41 Non-Affective Cognition
Reading Recognition2 0.33 Non-Affective CognitionLine Orientation3 0.32 Non-Affective CognitionPicture Vocabulary Test4 0.29 Non-Affective CognitionList Sorting (Working Memory Test)5 0.26 Non-Affective CognitionPicture Sequence Memory Test6 0.24 Non-Affective CognitionDimensional Card Sorting Test(Cognitive Flexibility)7 0.22 Non-Affective Cognition
Sustained Attention (Specificity)8 0.19 Non-Affective Cognition
Emotion Recognition9 0.18 Personality & Mental Health
Physical Endurance10 0.17 Physical Health & Lifestyle
Thought Problems11 -0.09 Personality & Mental Health
Aggressive Behavior12 -0.09 Personality & Mental Health
Hemoglobin A1C13 -0.10 Physical Health & Lifestyle
Conscientiousness14 -0.10 Personality & Mental Health
Times Drunk Last Year15 -0.11 Physical Health & LifestyleBody Mass Index16 -0.12 Physical Health & LifestyleWeekly Tobacco Use17 -0.15 Physical Health & LifestyleContinuous Attention (False positives) 18 -0.19 Non-Affective CognitionErrors Line Orientation19 -0.32 Non-Affective CognitionSkipped Items Penn Progressive Matrices20 -0.39 Non-Affective Cognition
The different measures correspond to the following variables within the HCP dataset: 1PMAT24_A_CR, 2ReadEng_AgeAdj, 3VSPLOT_TC, 4PicVocab_AgeAdj,5 ListSort_Unadj, 6PicSeq_Unadj, 7 CardSort_Unadj, 8SCPT_SPEC, 9ER40_CR,
10Endurance_AgeAdj, 11ASR_Thot_Pct, 12ASR_Aggr_Pct, 13HbA1C, 14NEOFAC_C,
15SSAGA_Alc_Hvy_Frq_Drk, 16BMI, 17Total_Any_Tobacco_7days, 18SCPT_FP/SCPT_FN, 19VSPLOT_OFF, 20PMAT24_A_RTCR
23

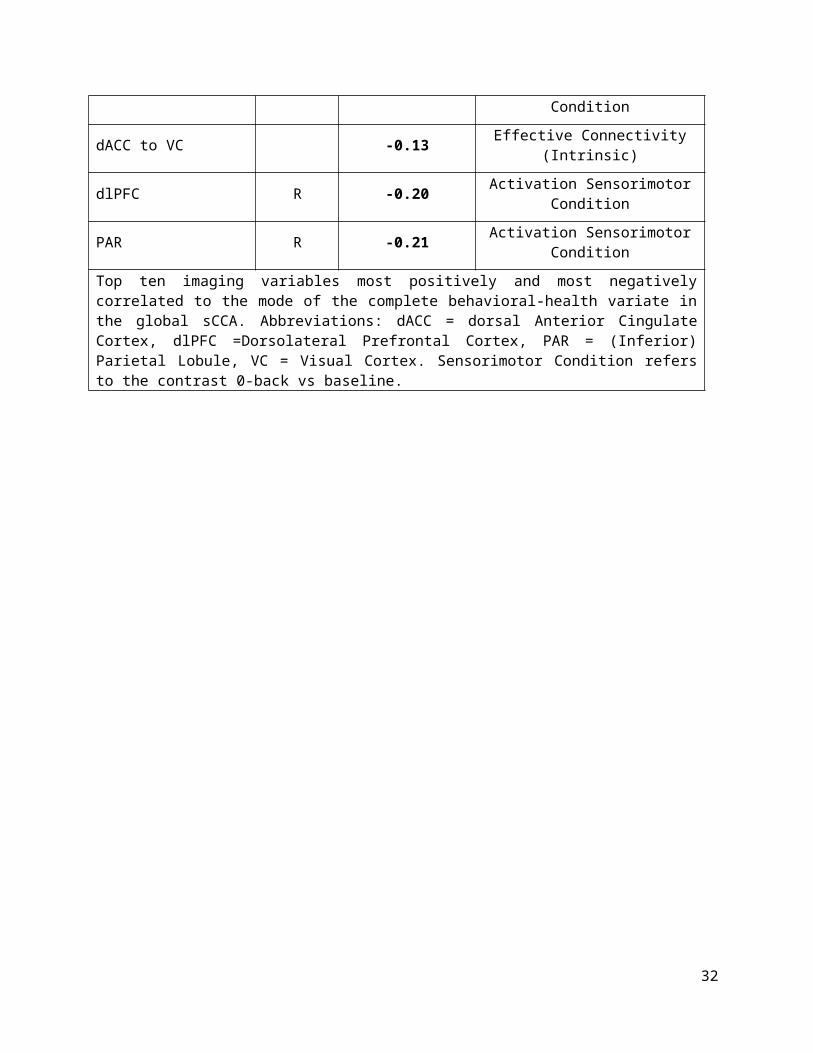
Table 4. Global Analysis: Imaging variables most strongly correlated to the complete behavioral-health variate
Region Laterality Correlation MeasuredlPFC R 0.38 Activation 2-back vs 0-back
dlPFC L 0.33 Activation 2-back vs 0-back
PAR L 0.31 Activation 2-back vs 0-back
dACC B 0.31 Activation 2-back vs 0-back
PAR R 0.31 Activation 2-back vs 0-back
VC L 0.23 Activation 2-back vs 0-back
Lingual Gyrus L 0.22 Activation 2-back vs 0-back
VC to dlPFC 0.20 Effective Connectivity (Intrinsic)
VC R 0.17 Activation 2-back vs 0-back
VC to PAR 0.16 Effective Connectivity(Bayesian Model Average)
dlPFC o dACC -0.10 Effective Connectivity (Intrinsic)
PAR with dACC -0.10 Functional Connectivity during the task
dlPFC to VC -0.11 Effective Connectivity (Intrinsic)
dACC -0.11 Activation Sensorimotor Condition
dlPFC L -0.12 Activation Sensorimotor Condition
PAR L -0.12 Activation Sensorimotor Condition
dACC to VC -0.13 Effective Connectivity (Intrinsic)
dlPFC R -0.20 Activation Sensorimotor Condition
PAR R -0.21 Activation Sensorimotor Condition
Top ten imaging variables most positively and most negatively correlated to the mode of the complete behavioral-health variate in the global sCCA. Abbreviations: dACC = dorsal Anterior Cingulate Cortex, dlPFC =Dorsolateral Prefrontal Cortex, PAR = (Inferior) Parietal Lobule, VC = Visual Cortex. Sensorimotor Condition refers to the contrast 0-back vs baseline.
24

Table 5. Results of the modular analyses
WM-Task Activation
(24)
WM- Dynamic Causal
Modeling(44)
WM-Task Functional
Connectivity(66)
WM-networksResting State
Functional Connectivity
(66)
Physical Health and Lifestyle (24)
r=0.27p=0.007
r=0.21p=0.60
r=0.31p=0.028
r=0.23p=0.012
Mental Health & Personality (17)
r=0.22p=0.004
r=0.21p =0.15
r=0.24p=0.52
r=0.16p=0.37
Affective Cognition (24)
r=0.23p =0.005
r=0.21p=0.29
r=0.26p=0.23
r=0.16p=0.45
Non-affective Cognition (37)
r=0.43p =0.00003
r=0.28p=0.002
r=0.24p=0.56
r=0.20p=0.07
Sensorimotor Processing (10)
r=0.18p =0.26
r=0.21p=0.21
r=0.26p=0.35
r=0.22p=0.008
Number of variables of the module is in parentheses. Bold indicates significant results at p<0.05, following 100000 permutations.; WM=working memory
25
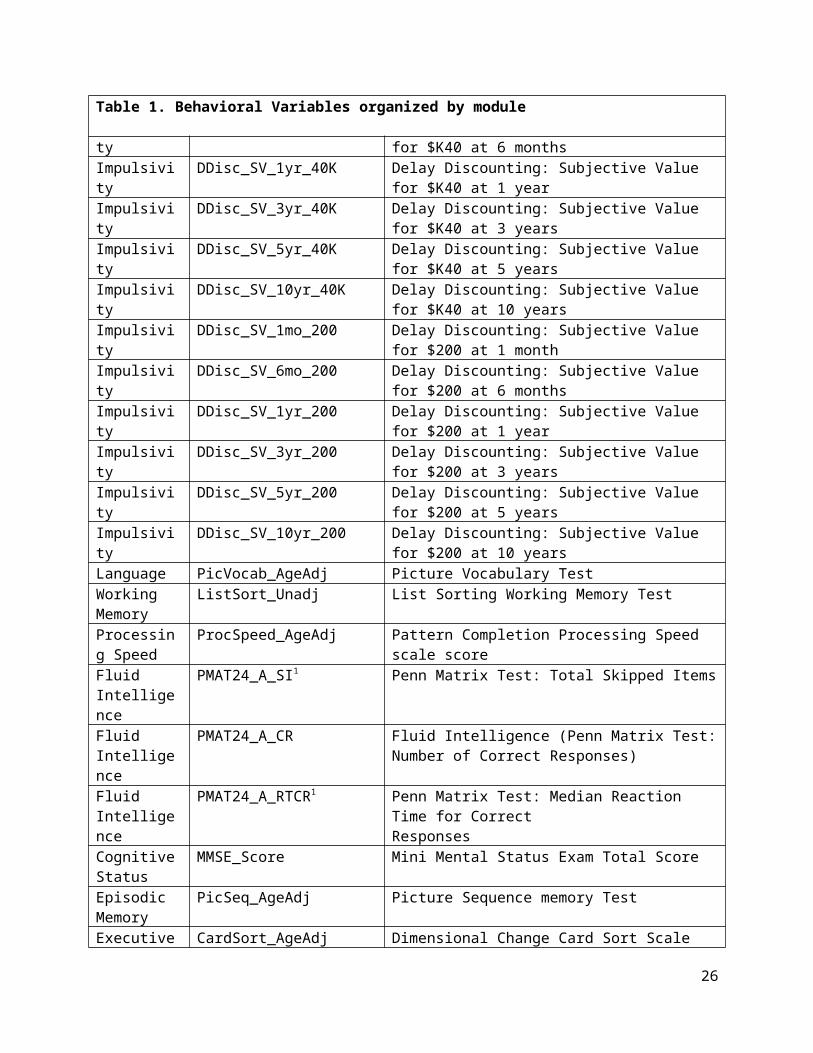
Table 6. Modular Analyses, Correlations of behavioral variables with the respective imaging mode
Non-Affective Cognition
WM-Task Activation
DCM Module
WM-Task Functional
Connectivity
Resting State Functional
ConnectivityModule sCCA r-value 0.43 0.28 0.24 0.20Module sCCA p-value 0.0004 0.002 0.54 0.12
Variable Name r-value r-value r-value r-value
PMAT24_A_CR 0.34 0.21 0.20 0.19ReadEng_AgeAdj 0.30 0.20 0.13 0.05PicVocab_AgeAdj 0.28 0.12 0.16 0.06ListSort_Unadj 0.27 0.11 0.05 0.08VSPLOT_TC 0.27 0.20 0.16 0.06PicSeq_AgeAdj 0.23 0.10 0.08 0.04CardSort_AgeAdj 0.21 0.16 0.11 -0.03SCPT_SPEC 0.17 0.10 0.13 0.03SCPT_TN 0.17 0.10 0.13 0.03ProcSpeed_AgeAdj 0.16 0.12 0.11 -0.04SCPT_SEN 0.16 0.05 0.00 0.05SCPT_TP 0.16 0.05 0.00 0.05PMAT24_A_RTCR 0.16 0.16 0.14 0.16DDisc_SV_1mo_40K 0.15 0.01 0.04 0.10Flanker_AgeAdj 0.14 0.14 0.09 -0.04DDisc_SV_1yr_40K 0.13 0.02 0.05 0.05MMSE_Score 0.13 0.06 0.02 0.00IWRD_TOT 0.12 0.02 0.01 0.02DDisc_SV_6mo_200 0.12 -0.02 0.02 0.01DDisc_SV_3yr_200 0.11 -0.02 0.04 -0.01DDisc_SV_1yr_200 0.11 0.00 0.04 0.02DDisc_AUC_200 0.10 -0.02 0.04 0.00DDisc_SV_5yr_200 0.07 -0.01 0.03 -0.01DDisc_SV_3yr_40K 0.07 0.02 0.02 0.01DDisc_SV_10yr_200 0.07 -0.05 0.03 -0.02DDisc_SV_6mo_40K 0.07 -0.04 0.03 0.03DDisc_AUC_40K 0.06 0.00 0.04 0.02DDisc_SV_5yr_40K 0.04 0.01 0.05 0.01DDisc_SV_1mo_200 0.03 -0.01 -0.01 0.01VSPLOT_CRTE 0.02 0.09 0.03 -0.01DDisc_SV_10yr_40K 0.02 -0.06 0.03 0.01SCPT_LRNR -0.06 0.00 0.06 -0.01IWRD_RTC -0.11 -0.03 -0.02 0.01SCPT_FN -0.16 -0.05 0.00 -0.05SCPT_FP -0.17 -0.10 -0.13 -0.03VSPLOT_OFF -0.25 -0.21 -0.16 -0.10PMAT24_A_SI -0.32 -0.22 -0.20 -0.19
26

Affective Cognition
WM-Task Activation
DCM Module
WM-Task Functional
Connectivity
Resting State Functional
ConnectivityModule sCCA r-value 0.23 0.21 0.26 0.16Module sCCA p-value 0.008 0.30 0.23 0.92
Variable Name
ER40_CR 0.20 0.19 0.06 0.05ER40FEAR 0.13 0.13 0.06 -0.01ER40SAD 0.12 0.09 0.06 0.10ER40NOE 0.11 0.07 -0.03 -0.03ER40ANG 0.07 0.11 0.02 0.05ER40HAP 0.06 0.10 0.09 0.02Sadness_Unadj 0.02 -0.02 -0.09 -0.02Loneliness_Unadj 0.00 0.01 -0.11 -0.07SelfEff_Unadj 0.00 0.06 0.11 0.00PercReject_Unadj 0.00 -0.04 -0.18 0.00EmotSupp_Unadj -0.01 0.03 0.16 0.05PosAffect_Unadj -0.02 0.05 0.08 0.04FearAffect_Unadj -0.02 0.00 -0.10 0.00Friendship_Unadj -0.02 0.04 0.14 0.06InstruSupp_Unadj -0.02 0.07 0.08 0.04PercStress_Unadj -0.03 -0.05 -0.15 -0.04LifeSatisf_Unadj -0.04 0.09 0.11 0.05MeanPurp_Unadj -0.04 0.01 0.07 0.11AngAffect_Unadj -0.04 0.01 -0.14 -0.05FearSomat_Unadj -0.05 0.07 -0.04 -0.04AngAggr_Unadj -0.06 -0.04 -0.10 -0.09ER40_CRT -0.07 -0.09 0.01 -0.03PercHostil_Unadj -0.07 -0.03 -0.26 -0.08AngHostil_Unadj -0.10 -0.08 -0.11 -0.02
Mental Health and Personality
WM-Task Activation
DCM Module
WM-Task Functional
Connectivity
Resting State Functional
ConnectivityModule sCCA r-value 0.22 0.21 0.24 0.16Module sCCA p-value 0.048 0.16 0.51 0.93
Variable Name
NEOFAC_O 0.15 -0.01 0.02 -0.03NEOFAC_A 0.08 0.06 0.16 0.10ASR_Intr_Pct 0.06 -0.09 -0.11 -0.05ASR_Attn_Pct 0.01 -0.11 -0.12 -0.16NEOFAC_E 0.00 -0.03 0.08 0.03ASR_TAO_Sum -0.03 -0.12 -0.19 -0.13NEOFAC_N -0.04 -0.09 -0.16 -0.05ASR_Totp_T -0.04 -0.11 -0.23 -0.11
27

ASR_Anxd_Pct -0.04 -0.10 -0.14 -0.07ASR_Rule_Pct -0.04 -0.09 -0.10 -0.04ASR_Extn_T -0.04 -0.13 -0.20 -0.06ASR_Intn_T -0.05 -0.07 -0.18 -0.08ASR_Witd_Pct -0.07 -0.03 -0.15 -0.06ASR_Soma_Pct -0.08 -0.07 -0.12 -0.04ASR_Thot_Pct -0.08 -0.10 -0.12 -0.05ASR_Aggr_Pct -0.10 -0.21 -0.21 -0.05NEOFAC_C -0.11 0.04 0.07 0.13
Physical Health and Lifestyle
WM-Task Activation
DCM Module
WM-Task Functional
Connectivity
Resting State Functional
ConnectivityModule sCCA r-value 0.27 0.21 0.31 0.23Module sCCA p-value 0.007 0.59 0.033 0.031
Variable Name
Endurance_AgeAdj 0.17 0.13 0.09 0.04FamHist_Moth_None 0.10 -0.05 0.06 0.06FamHist_Fath_None 0.09 0.00 0.05 -0.01SSAGA_Alc_12_Max_Drinks 0.09 0.05 -0.03 0.13
PSQI_AmtSleep 0.04 -0.03 0.02 -0.04Hematocrit_2 0.03 0.07 -0.04 0.15Menstrual_DaysSinceLast 0.02 -0.04 0.00 -0.04
Menstrual_CycleLength 0.02 0.02 0.00 0.00
Hematocrit_1 0.02 0.09 -0.04 0.16SSAGA_Mj_Age_1st_Use 0.01 -0.09 0.01 0.00
Handedness 0.00 -0.02 0.01 0.00BPSystolic -0.03 0.01 -0.12 -0.05Menstrual_AgeBegan -0.03 0.05 0.05 0.03SSAGA_Mj_Times_Used -0.03 0.05 -0.04 0.02
PSQI_Min2Asleep -0.04 0.05 -0.01 0.07BPDiastolic -0.04 0.05 -0.12 -0.09PSQI_Latency30Min -0.05 0.09 -0.02 0.07PSQI_Score -0.06 0.09 -0.03 0.10PSQI_WakeUp -0.07 0.03 -0.02 0.02HbA1C -0.08 -0.06 -0.07 -0.07BMI -0.09 -0.08 -0.31 -0.06SSAGA_Alc_Hvy_Frq_Drk -0.12 -0.09 -0.01 -0.03
THC -0.13 -0.04 -0.01 0.06Total_Any_Tobacco_7days -0.14 -0.05 -0.04 -0.05
28

Sensorimotor Processing
WM-Task Activation
DCM Module
WM-Task Functional
Connectivity
Resting State Functional
ConnectivityModule sCCA r-value 0.18 0.21 0.26 0.22Module sCCA p-value 0.75 0.20 0.36 0.07
Variable Name
Dexterity_AgeAdj 0.13 0.03 0.24 0.01Mars_Final 0.13 0.14 -0.03 -0.04Mars_Log_Score 0.10 0.17 -0.02 -0.02Odor_AgeAdj 0.04 -0.01 0.08 0.02Strength_AgeAdj -0.03 0.11 -0.08 0.21PainInterf_Tscore -0.03 -0.02 -0.06 -0.01GaitSpeed_Comp -0.05 0.14 0.09 -0.01Noise_Comp -0.05 0.08 0.00 -0.05Taste_AgeAdj -0.06 -0.03 -0.01 -0.01Mars_Errs -0.06 0.04 -0.01 0.04Full name of the variables can be found in Table S1. Bold indicates significant results at
p<0.05, following 5000 permutations.
29

Table 7. Results of the reliability analyses for the significant modular sCCAs
WM-Task Activation DCM Module
WM-Task Functional
Connectivity
Resting State Functional
ConnectivityPhysical Health and Lifestyle
r823 = 0.27meanr411 =0.31Std411= 0.027
r823 = 0.31meanr411 = 0.36Std411= 0.033
r823 = 0.23meanr411 = 0.28Std411=0.028
Mental Health & Personality
r823 =0.22meanr411 = 0.24Std411= 0.033
Affective Cognition
r823 = 0.23meanr411 =0.27Std411= .028
Non-affective Cognition
r823 = 0.43meanr411 = 0.45Std411=0.024
r823 = 0.28meanr411 = 0.32Std411= 0.026
Sensorimotor Processing
r823 = 0.22meanr411 = 0.24Std411=0.031
Reliability analyses for the significant modular analyses using 5000 permutations, each of which randomly selects 411 participants and then reruns the same analysis. Abbreviations: r821
= the r value in the actual sCCA using all 823 participants. meanr411= the mean r value among the 5000 randomly chosen samples of 411 participants. Std411 the standard deviation of the r values among the 5000 randomly chosen samples of 411 participants.
30

Table 8. Global Analysis: No effect of sex
All Participants(n=823)
Female(n=462)
Male(n=361)
Global sCCA r-value 0.497 0.522 0.556
Global sCCA p-value 0.0004 0.0004 0.0004
Variable Name
PMAT24_A_CR 0.41 0.43 0.44
ReadEng_AgeAdj 0.33 0.36 0.36
VSPLOT_TC 0.32 0.32 0.37
PicVocab_AgeAdj 0.29 0.33 0.33
ListSort_Unadj 0.26 0.25 0.28
PicSeq_AgeAdj 0.24 0.28 0.27
PMAT24_A_RTCR 0.23 0.22 0.27
CardSort_AgeAdj 0.22 0.19 0.31
SCPT_SPEC 0.19 0.19 0.22
SCPT_TN 0.19 0.19 0.22
ER40_CR 0.18 0.23 0.18
Endurance_AgeAdj 0.17 0.24 0.16
ProcSpeed_AgeAdj 0.17 0.16 0.25
Flanker_AgeAdj 0.17 0.13 0.21
SCPT_SEN 0.15 0.11 0.29
SCPT_TP 0.15 0.11 0.29
NEOFAC_O 0.14 0.16 0.17
DDisc_SV_1mo_40K 0.14 0.17 0.20
Dexterity_AgeAdj 0.14 0.14 0.23
DDisc_SV_1yr_40K 0.13 0.12 0.22
MMSE_Score 0.12 0.10 0.17
ER40FEAR 0.12 0.13 0.12
IWRD_TOT 0.11 0.15 0.10
SSAGA_Alc_12_Max_Drinks 0.11 0.11 0.11
LifeSatisf_Unadj 0.11 0.14 0.18
Mars_Final 0.10 0.10 0.15
31
ER40ANG 0.09 0.14 0.09
DDisc_SV_1yr_200 0.09 0.09 0.16
ER40NOE 0.09 0.05 0.12
DDisc_SV_6mo_200 0.08 0.06 0.20
DDisc_SV_3yr_200 0.08 0.08 0.17
NEOFAC_A 0.08 0.10 0.13
Hematocrit_2 0.08 0.04 0.08
ER40HAP 0.08 0.13 0.05
Hematocrit_1 0.08 0.04 0.06
Mars_Log_Score 0.07 0.08 0.14
FamHist_Fath_None 0.07 0.12 0.06
ER40SAD 0.07 0.16 0.04
DDisc_AUC_200 0.07 0.07 0.18
FamHist_Moth_None 0.07 0.14 0.03
DDisc_SV_3yr_40K 0.07 0.08 0.15
SelfEff_Unadj 0.07 0.04 0.17
DDisc_SV_5yr_200 0.06 0.05 0.16
DDisc_AUC_40K 0.05 0.05 0.15
PosAffect_Unadj 0.05 0.05 0.14
FearSomat_Unadj 0.05 0.09 -0.01
Strength_AgeAdj 0.05 -0.03 0.05
DDisc_SV_6mo_40K 0.04 0.06 0.11
ASR_Intr_Pct 0.04 0.01 0.07
InstruSupp_Unadj 0.04 0.01 0.15
DDisc_SV_5yr_40K 0.04 0.03 0.14
EmotSupp_Unadj 0.04 0.05 0.11
DDisc_SV_10yr_200 0.04 0.02 0.13
VSPLOT_CRTE 0.03 -0.01 0.11
ASR_Attn_Pct 0.03 0.04 -0.08
Friendship_Unadj 0.03 0.01 0.14
Odor_AgeAdj 0.02 0.02 0.00
Menstrual_CycleLength 0.02 0.04
Menstrual_AgeBegan 0.02 0.03
32

Loneliness_Unadj 0.02 0.10 -0.16
DDisc_SV_1mo_200 0.02 0.04 0.10
PSQI_AmtSleep 0.01 -0.03 0.09
GaitSpeed_Comp 0.00 0.02 0.03
Menstrual_DaysSinceLast 0.00 -0.02
SSAGA_Mj_Age_1st_Use 0.00 -0.01 0.05
PSQI_Min2Asleep 0.00 -0.02 -0.01
SSAGA_Mj_Times_Used 0.00 0.01 -0.06
NEOFAC_E 0.00 -0.02 0.09
AngAffect_Unadj 0.00 0.02 -0.07
DDisc_SV_10yr_40K -0.01 -0.01 0.08
Handedness -0.01 0.04 0.00
ASR_Anxd_Pct -0.01 0.04 -0.15
PSQI_Latency30Min -0.01 -0.04 0.01
MeanPurp_Unadj -0.01 -0.04 0.12
ASR_TAO_Sum -0.02 0.01 -0.15
PSQI_Score -0.02 -0.05 0.01
FearAffect_Unadj -0.02 -0.01 -0.04
Sadness_Unadj -0.02 -0.01 -0.09
PercHostil_Unadj -0.02 -0.05 -0.09
ASR_Totp_T -0.03 -0.02 -0.14
ASR_Intn_T -0.03 0.00 -0.16
ASR_Rule_Pct -0.03 -0.04 -0.13
BPSystolic -0.04 -0.12 -0.04
PainInterf_Tscore -0.04 -0.07 -0.03
BPDiastolic -0.04 -0.10 0.00
SCPT_LRNR -0.04 -0.05 -0.02
AngAggr_Unadj -0.05 -0.06 -0.15
NEOFAC_N -0.05 -0.03 -0.15
ASR_Extn_T -0.05 -0.07 -0.10
ASR_Witd_Pct -0.05 -0.01 -0.17
PercReject_Unadj -0.05 -0.03 -0.16
PSQI_WakeUp -0.05 -0.10 0.00
33

Noise_Comp -0.06 0.01 -0.05
Mars_Errs -0.06 -0.05 -0.04
PercStress_Unadj -0.06 -0.03 -0.19
ASR_Soma_Pct -0.07 -0.05 -0.17
ER40_CRT -0.08 -0.12 -0.05
Taste_AgeAdj -0.08 -0.06 -0.09
IWRD_RTC -0.08 -0.06 -0.14
AngHostil_Unadj -0.08 -0.02 -0.24
THC -0.09 -0.13 -0.19
ASR_Thot_Pct -0.09 -0.07 -0.19
ASR_Aggr_Pct -0.09 -0.08 -0.19
HbA1C -0.10 -0.09 -0.07
NEOFAC_C -0.10 -0.08 -0.06
SSAGA_Alc_Hvy_Frq_Drk -0.11 -0.12 -0.12
BMI -0.12 -0.23 -0.02
Total_Any_Tobacco_7days -0.15 -0.17 -0.19
SCPT_FN -0.15 -0.11 -0.29
SCPT_FP -0.19 -0.19 -0.22
VSPLOT_OFF -0.32 -0.33 -0.36
PMAT24_A_SI -0.39 -0.41 -0.43
Full name of the variables can be found in Table S1.
34

Table 9. Global Analysis: Comparison sparse vs non-sparse canonical correlation analyses
sCCA(n=823)
Non-sparse CCA(n=823)
Variable Name
PMAT24_A_CR 0.41 0.59
ReadEng_AgeAdj 0.33 0.43
VSPLOT_TC 0.32 0.47
PicVocab_AgeAdj 0.29 0.43
ListSort_Unadj 0.26 0.32
PicSeq_AgeAdj 0.24 0.32
PMAT24_A_RTCR 0.23 0.39
CardSort_AgeAdj 0.22 0.34
SCPT_SPEC 0.19 0.09
SCPT_TN 0.19 0.09
ER40_CR 0.18 0.16
Endurance_AgeAdj 0.17 0.34
ProcSpeed_AgeAdj 0.17 0.27
Flanker_AgeAdj 0.17 0.28
SCPT_SEN 0.15 0.23
SCPT_TP 0.15 0.23
NEOFAC_O 0.14 0.11
DDisc_SV_1mo_40K 0.14 0.25
Dexterity_AgeAdj 0.14 0.18
DDisc_SV_1yr_40K 0.13 0.24
MMSE_Score 0.12 0.10
ER40FEAR 0.12 0.04
IWRD_TOT 0.11 0.06
SSAGA_Alc_12_Max_Drinks 0.11 0.21
LifeSatisf_Unadj 0.11 0.11
Mars_Final 0.10 0.15
ER40ANG 0.09 0.07
DDisc_SV_1yr_200 0.09 0.23
35

ER40NOE 0.09 0.22
DDisc_SV_6mo_200 0.08 0.27
DDisc_SV_3yr_200 0.08 0.26
NEOFAC_A 0.08 -0.01
Hematocrit_2 0.08 0.21
ER40HAP 0.08 0.03
Hematocrit_1 0.08 0.19
Mars_Log_Score 0.07 0.11
FamHist_Fath_None 0.07 0.08
ER40SAD 0.07 -0.02
DDisc_AUC_200 0.07 0.25
FamHist_Moth_None 0.07 0.21
DDisc_SV_3yr_40K 0.07 0.19
SelfEff_Unadj 0.07 0.15
DDisc_SV_5yr_200 0.06 0.20
DDisc_AUC_40K 0.05 0.22
PosAffect_Unadj 0.05 0.05
FearSomat_Unadj 0.05 0.10
Strength_AgeAdj 0.05 0.30
DDisc_SV_6mo_40K 0.04 0.10
ASR_Intr_Pct 0.04 0.06
InstruSupp_Unadj 0.04 0.08
DDisc_SV_5yr_40K 0.04 0.20
EmotSupp_Unadj 0.04 -0.04
DDisc_SV_10yr_200 0.04 0.20
VSPLOT_CRTE 0.03 -0.09
ASR_Attn_Pct 0.03 0.06
Friendship_Unadj 0.03 0.00
Odor_AgeAdj 0.02 -0.03
Menstrual_CycleLength 0.02 -0.18
Menstrual_AgeBegan 0.02 0.05
Loneliness_Unadj 0.02 -0.03
DDisc_SV_1mo_200 0.02 0.06
36

PSQI_AmtSleep 0.01 0.05
GaitSpeed_Comp 0.00 0.07
Menstrual_DaysSinceLast 0.00 0.20
SSAGA_Mj_Age_1st_Use 0.00 0.03
PSQI_Min2Asleep 0.00 0.01
SSAGA_Mj_Times_Used 0.00 0.00
NEOFAC_E 0.00 -0.08
AngAffect_Unadj 0.00 -0.04
DDisc_SV_10yr_40K -0.01 0.20
Handedness -0.01 -0.08
ASR_Anxd_Pct -0.01 -0.03
PSQI_Latency30Min -0.01 -0.07
MeanPurp_Unadj -0.01 -0.07
ASR_TAO_Sum -0.02 -0.04
PSQI_Score -0.02 -0.05
FearAffect_Unadj -0.02 -0.05
Sadness_Unadj -0.02 -0.09
PercHostil_Unadj -0.02 0.08
ASR_Totp_T -0.03 -0.04
ASR_Intn_T -0.03 -0.07
ASR_Rule_Pct -0.03 -0.12
BPSystolic -0.04 0.08
PainInterf_Tscore -0.04 -0.07
BPDiastolic -0.04 0.02
SCPT_LRNR -0.04 0.00
AngAggr_Unadj -0.05 -0.08
NEOFAC_N -0.05 -0.17
ASR_Extn_T -0.05 -0.06
ASR_Witd_Pct -0.05 0.00
PercReject_Unadj -0.05 -0.05
PSQI_WakeUp -0.05 -0.12
Noise_Comp -0.06 -0.22
Mars_Errs -0.06 -0.11
37

PercStress_Unadj -0.06 -0.17
ASR_Soma_Pct -0.07 -0.10
ER40_CRT -0.08 -0.14
Taste_AgeAdj -0.08 -0.17
IWRD_RTC -0.08 -0.14
AngHostil_Unadj -0.08 -0.04
THC -0.09 -0.14
ASR_Thot_Pct -0.09 -0.16
ASR_Aggr_Pct -0.09 -0.11
HbA1C -0.10 -0.10
NEOFAC_C -0.10 -0.12
SSAGA_Alc_Hvy_Frq_Drk -0.11 -0.22
BMI -0.12 -0.20
Total_Any_Tobacco_7days -0.15 -0.17
SCPT_FN -0.15 -0.23
SCPT_FP -0.19 -0.09
VSPLOT_OFF -0.32 -0.50
PMAT24_A_SI -0.39 -0.58
Full name of the variables can be found in Table S1.
38

Table 10. Global analysis: Correlation of demographic and potentially confounding variables with the imaging variate
Variable NameGlobal level
(n=823)
Education Level (SSAGA_Educ) 0.26
Acquisition Sequence of the HCP 0.12
Age in Years -0.13
Mean head movement during MRI scan -0.14
39