media use in zimbabwe findings from the 2012 international audience research project
TRANSCRIPT


Media Use in ZimbabweFindings from the 2012 International Audience Research Project

Methodology

Methodology: Data Collection
Target population: Adults ages 15 and older living in Zimbabwe
Sample size: 1,512
Mode: Face-to-face interviews in respondents’ homes
Languages: English, Shona, Ndebele
Response rate: 83.2%
Field period: July 22 - August 2, 2012
Field team: 5 supervisors; 31 interviewers
4

Methodology: Sampling Plan
5
Provinces: 10
PSUs: 189
Interviews per PSU: 8
Within household selection: Kish method

Methodology: Challenges in Field Work
Political intimidation and suspicion
– Respondent wariness to participate or answer truthfully
– Zanu PF youth inquisition
– Assumption of Zimbabwean government involvement in research
Logistical obstacles
– Acquiring permission from chiefs or headmen
6

Media Landscape
7
Photo: cpj.org
Photo: Globalpost.com
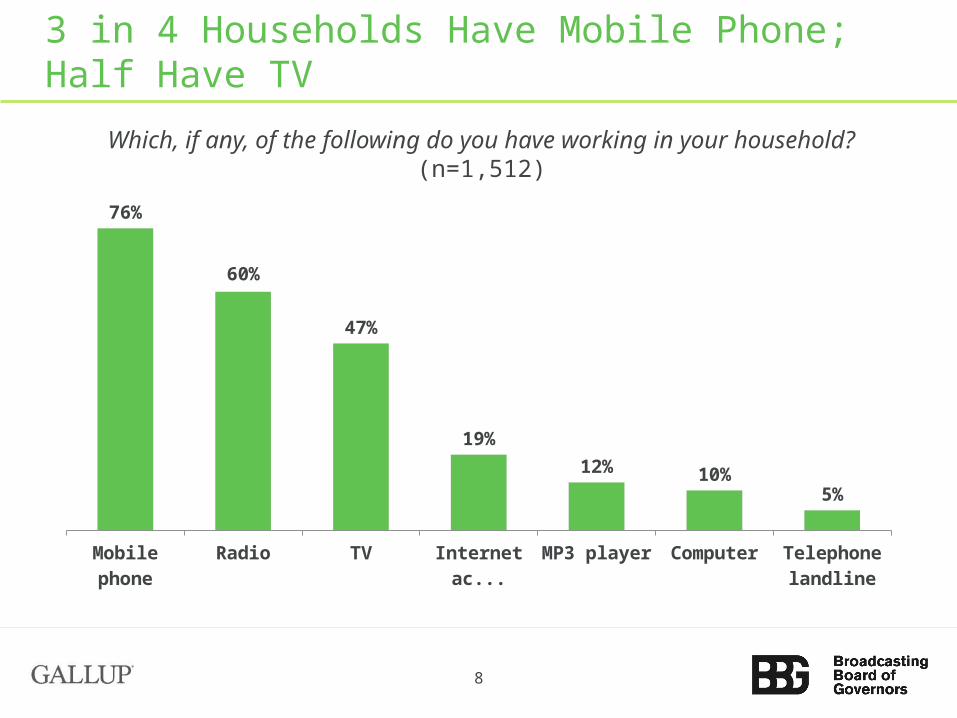
3 in 4 Households Have Mobile Phone; Half Have TV
Which, if any, of the following do you have working in your household? (n=1,512)
8
Mobile phone
Radio TV Internet access
MP3 player Computer Telephone landline
76%
60%
47%
19%
12% 10%5%

Access Gaps Observed in TV, Internet Between Urban and Rural Areas
9
Mobile Phone
Radio TV Internet access
MP3 player Computer Telephone landline
97%
66%
88%
44%
27% 24%14%
69%
58%
34%
11% 7% 6% 2%
76%
60%
47%
19%12% 10%
5%
Urban (n=416) Rural (n=1,096) Total (n=1,512)
Which, if any, of the following do you have working in your household?

Word of Mouth, Radio Most Prevalent News Sources
How often do you access news from each of the following sources? Results among total sample (n=1,512)
10
43% 40%35%
31%
17% 14% 11%
72%65%
49% 51%
23%19%
35%
Every day/Most days At least once a week

Media Consumption Differs Between Urban, Rural
How often do you access news from each of the following sources? Percent who use each source at least once a week
11
86% 85%
71%66%
63%
48%
35%29%
38%
68%
45%
65%
27%
15% 14% 11%
Urban (n=416) Rural (n=1,096)

Ndebele More Likely Than Shona to Rely on Word of Mouth
How often do you access news from each of the following sources? Percent who use each source at least once a week
12
68% 65%
52% 49%
37%
25%20%
16%
91%
63%
48% 48%
23%15% 12%
8%
Shona speakers (n=1,226) Ndebele speakers (n=248)

Radio is Choice Source Among All, but Youth Most Likely to Also Use New Media
How often do you access news from each of the following sources? Percent who use each source at least once a week
13
Radio TV Internet Mobile apps
65%59%
34%
23%
66%
53%
25%
17%
67%
43%
14%7%
60%
23%
3%0%
15-24 (n=423) 25-34 (n=499) 35-54 (n=417) 55+ (n=158)
Satellite TV Use
14
Photo: www.rnw.nl

Two-Thirds of TV Owners Use a Satellite Dish
15
Antenna Individual satellite dish Shared satellite dish
68% 66%
2%
How does your television receive its signal?
Results among television owners (n=799)

Dish Ownership Prevalent Among Most Educated
16
Urban Rural 15-24 25-34 35-54 55+ Primary education
Sec-ondary
education
High school
Post-secondary education
73%
60%
69%65% 65%
44%41%
61%
79%84%
How does your television receive its signal? Percent “individual satellite dish” among all TV owners (n=799)

One in Four Dish Owners Pays for Premium Channels
17
Access free channels only
74%
Pay extra to access more
channels26%
Do you use the TV channels that are aired for free with your satellite dish, or do you pay extra money to access more channels?
Results among satellite dish owners (n=558)
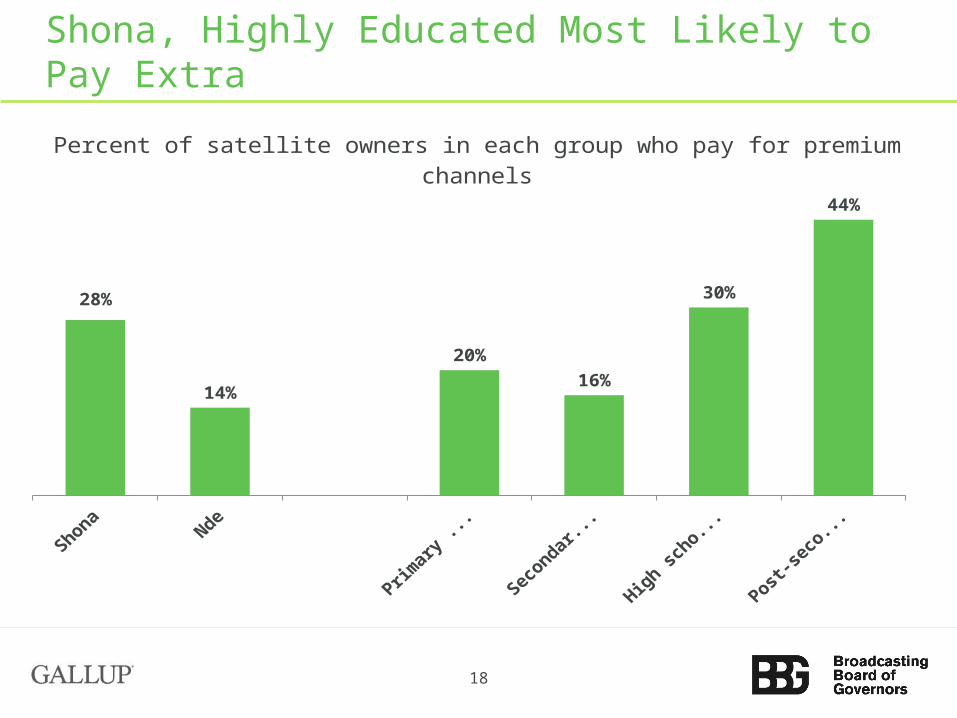
Shona, Highly Educated Most Likely to Pay Extra
18
28%
14%
20%
16%
30%
44%
Percent of satellite owners in each group who pay for premium channels
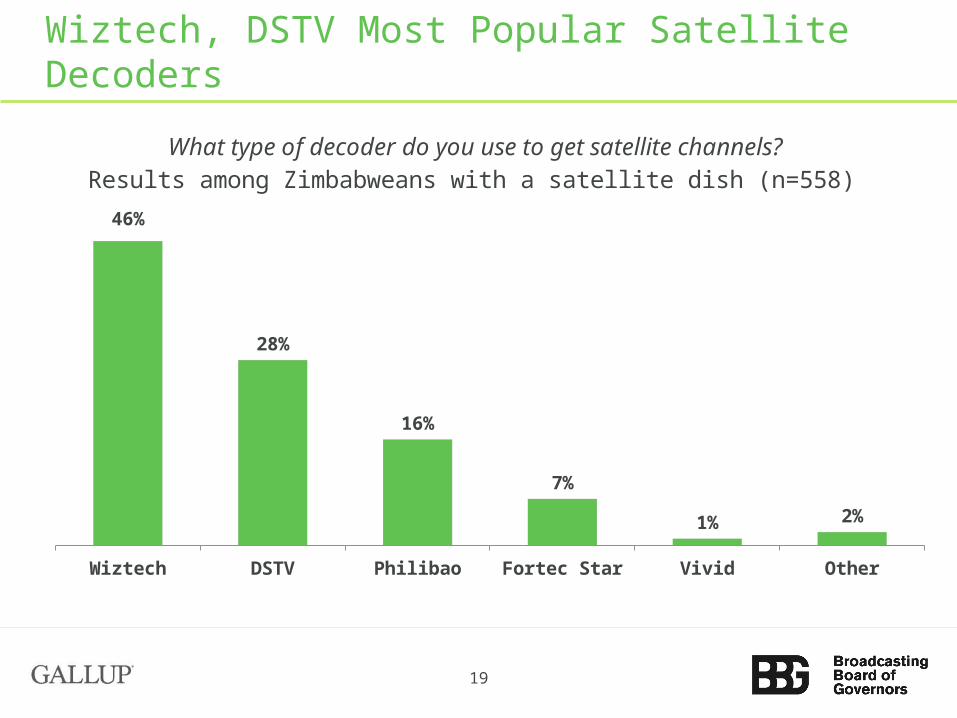
Wiztech, DSTV Most Popular Satellite Decoders
19
Wiztech DSTV Philibao Fortec Star Vivid Other
46%
28%
16%
7%
1% 2%
What type of decoder do you use to get satellite channels? Results among Zimbabweans with a satellite dish (n=558)

New Media:Internet & Mobile Phone Use
20
Photo: Dailymail.co.uk

Strong New Media Growth: Internet Use More Than Doubled Since 2011
21
2010 (n=1,500)
2011 (n=1,500)
2012 (n=1,512)
47%
53%
71%
63%
56%60%
52%
50%
50%
9%
24%
4%
10%22%
SMSRadioTVSocial NetworkingInternet
Past-week use of source

Urban Areas in Particular Show High Use of TV and New Media
22
SMS Radio TV Social Networking Internet
87%
59%
80%
43% 42%
64%60%
37%
15% 14%
71%
60%
50%
24% 22%
Urban (n=416) Rural (n=1,096) Total (n=1,512)
Past-week use of source
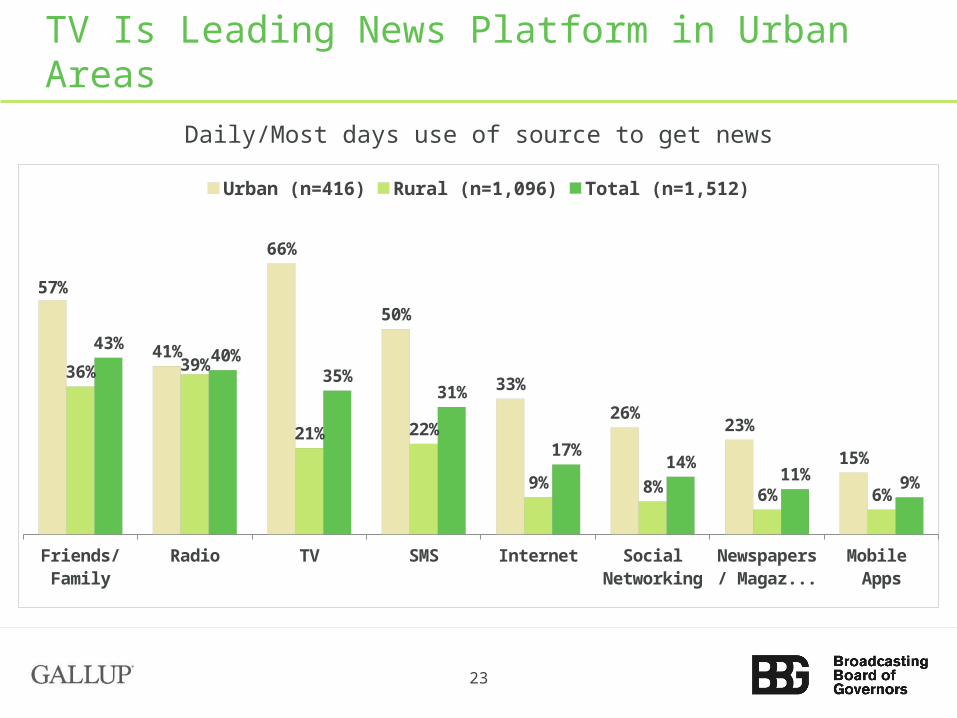
TV Is Leading News Platform in Urban Areas
23
Friends/ Fam-ily
Radio TV SMS Internet Social Network-
ing
Newspapers/ Magazines
Mobile Apps
57%
41%
66%
50%
33%
26%23%
15%
36% 39%
21% 22%
9% 8% 6% 6%
43%40%
35%31%
17%14%
11% 9%
Urban (n=416) Rural (n=1,096) Total (n=1,512)
Daily/Most days use of source to get news
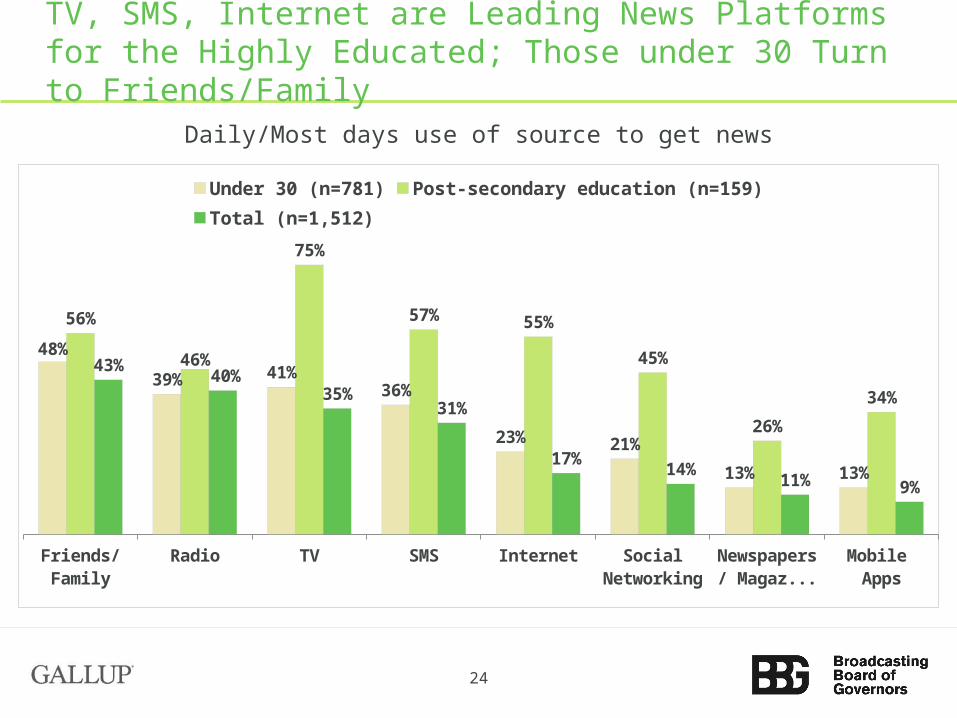
TV, SMS, Internet are Leading News Platforms for the Highly Educated; Those under 30 Turn to Friends/Family
24
Friends/ Fam-ily
Radio TV SMS Internet Social Network-
ing
Newspapers/ Magazines
Mobile Apps
48%
39% 41%36%
23% 21%
13% 13%
56%
46%
75%
57% 55%
45%
26%
34%
43%40%
35%31%
17%14%
11% 9%
Under 30 (n=781) Post-secondary education (n=159)Total (n=1,512)
Daily/Most days use of source to get news

Mobile Phone Penetration Lower Among Older, Rural, Uneducated, and Ndebele Speakers
25
Total 15-24 25-34 35-54 55 and older
Urban Rural Shona at Home Speakers
Ndebele at Home Speakers
No formal
education
Post-sec-
ondary education
69% 68%
79%
69%
49%
92%
61%
73%
53%
28%
97%
% Personally owning a mobile phone among various demographic groups

SMS Is the Primary Non-Voice Activity, but Internet Access, Social Networking, and Radio Listening Are Also Popular
26
SMS Accessed the
Internet
Accessed a social
networking site
Listened to the radio
Sent a photo
to other people
Email Downloaded a
mobile app
Received information
by SMS from your
mobile operator
Downloaded and
viewed a video
clip
Received news
reports by SMS
from news organiza-
tions
Watched live TV
91%
29% 26% 23%19% 16% 17% 18% 18%
6%2%
95%
42% 41%34% 34%
25% 25%21% 22%
8%3%
Mobile phone owners (n=1,040) Mobile phone owners under 30 (n=561)
Which of the following have you done on a mobile phone in the past 7 days?
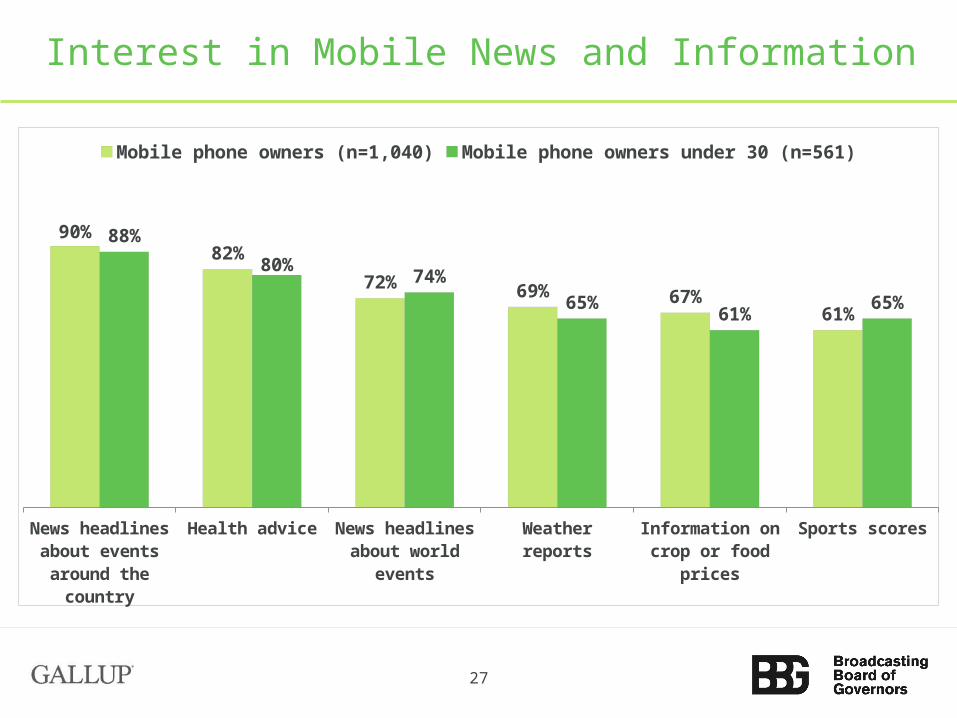
Interest in Mobile News and Information
27
News headlines about events
around the coun-try
Health advice News headlines about world
events
Weather reports Information on crop or food
prices
Sports scores
90%82%
72% 69% 67%61%
88%
80%74%
65%61%
65%
Mobile phone owners (n=1,040) Mobile phone owners under 30 (n=561)

Mobile Is the Key Internet Access Means
28
Home Work Internet café School Anywhere from mobile
73%
31%
22% 25%
87%
28%
7%1% 4%
42%
Use Use the most
In which of the following locations do you use the Internet?

Internet Use Highest Among Young Adults, Urbanites, and Highly Educated
29
Total Men Women 15-24 25-34 35-54 55 and older
Urban Rural Shona at Home Speakers
Ndebele at Home Speakers
No formal
education
Post-secondary education
22%
28%
17%
34%
23%
13%
1%
42%
14%
23%18%
3%
76%
% Having accessed the Internet during the past week among various demographics

News and Information Top the Internet Agenda
30
To find out the latest
news
To send or receive
To find in-formation
online about a specific
topic
To read a blog
To post a comment to
a blog
To share videos or
photos on-line
To down-load, watch, or listen to a
podcast
To watch online
videos such as TV pro-
grams, news reports,
video clips, or movies
To listen to online
audio such as music, radio pro-grams, or
news reports
15% 14% 14% 12% 12% 12%4% 3% 3%
68%65% 65%
56% 53% 52%
20%11% 13%
All Regular internet users (n=335)
In the last 7 days, which of the following activities have you used the Internet for?

Young Adults More Likely to Frequently Share News With Others
31
Daily/Most days per week
Weekly Monthly Less often Never
23%
27%
20%
17%
12%
27%29%
19%
14%
11%
All Under 30 (n=781)
How often do you discuss or share news with family, friends, or your social network, not including those who live in your household?

SMS and Facebook Are Key News-Sharing Tools for Young Adults in Particular
32
SMS text message or
MMS
Facebook or similar social networking
sites
Instant message
Email Commenting online or on
someone else’s blog
Twitter or similar mi-
croblogging sites
Online video, like YouTube
52%
35%
24% 22%17%
8%5%
57%
48%
27% 26% 24%
9%6%
Regular news sharers (n=801) Regular news sharers under 30 (n=435)
Do you share news with your friends, family, or social networks in any of the following ways?

Conclusions
The notion that Zimbabwe is a radio-only market is outdated.
With the strong growth in TV and New Media in urban areas, a multi-platform approach is needed to reach different demographics.
33
Gallup® is a trademark of Gallup, Inc. All other trademarks are the property of their respective owners.
Photo: voanews.com Photo: biztechafrica.com
Upcoming BBG Research Series Events
Upcoming BBG Research Series events:
– Thursday, December 6: To be announced.
Learn more about the BBG Research series at http://j.mp/UjCmJb
Have a question? Contact us at 202-203-4400 or [email protected]