mechanical compliance measurements of single...
TRANSCRIPT
>-
~
a B
dB >.- C'dP
l 8 E .If L P W
" ~,
" r'
JOURNAL OF RESEARCH of the National Bureau of Standards - C. Engineering and Instrumentation Vol. 74C, Nos. 1 and 2, January-June 1970
Mechanical Compliance Measurements of Single-Edge-Notch Tension Specimens::;
Mary Jane Orloski
Institute for Basic Standards, National Bureau of Standards, Washington, D. C. 20234
(June 12, 1970)
This paper descr ibes the mechanical compliance measurement of a 15 X 3·in single-edge-notch (SEN) specimen, effective gage length greater than twice specimen width , and a 7 X 3-in SEN specimen, effective gage length less than twice specimen width , both of !;,I. in-thi ck 7075-T6 aluminum . The 15 X 3-in specimen was chosen to provide experimental values of EIV 'll pz for comparison with the theoretical stress function solutions of Srawley and Gross, Results obtained are in good agreement with the theol1etical va lues. The 7 X 3-in specimen was chosen as proportional to a practical size SEN specimen that has been widely used. Comparisons of experimental values of E W/JI p z for this specimen were made with these theoretical stress fun ction solu tions.
Key words: Compliance; crack-toughness; fra cture; single-edge-notch specimen.
Glossary
crack length thickness of specimen
compliance
displacement Young's modulus strain energy release rate with crack extension gage length, effective length of specimen load per unit thickness width of specimen
1. Introduction
ical compliance measurements of a IS X 3-in SEN specimen (with an effecti ve gage length greater than twice the specimen width) and a 7 X 3-in SEN specimen (with an effective gage length less than twice the specimen width), both of %-in-thi ck 707S-T6 aluminum. For convenience, the specimens will be referred to hereafter as " lon g" and "short" respectively.
We chose a long specimen to provide experimental values, derived from compliance measurements, for comparison with the theoreti cal stress function solutions of Srawley and Gross (1).1 We chose a short specimen to determine compliance also for a practi cal size SEN specimen that has been widely used in determination of the long-term environmental effects, principally radiation, on the crack-toughness properties of materials.
2. Specimens Improvement of design criteria for high-strength materials, particularly metals, depends on a better understanding of their fracture properties. Compliance measurement is a technique frequently used in attempting to
::- isolate the causes of brittle fracture experimental1y. One ~" of a family of compliance specimens, the si ngle-edge
notch (SEN) specimen, is especially well sui ted to plate or sheet materials. Compliance measurements of a fracture toughness SEN specimen produce the experimental analog (sometimes referred to as a compliance "calibration") of the theoretical stress fun ction solution of the axially
The specimens were fabricated from 707S-T6 aluminum, a metal well suited to the study of fracture because of its low toughness and long elastic range. Nominal specimen dimensions are given in figure L The specimens were heat treated to remove residual stresses and were ground to minimize variations in thickness. Measurements of the specimens are given in table L2
;.' loaded notched elastic plate. This paper describes mechan-
*The work cove red in this pub lication was supported in part by Na tiona l Aeronautics and Spa.ce Administration under contract No. R- 09-022-042.
21
1 Figures in brackets indicate the literature r eferences at the end of this paper. 2 Eng l ish units are used throughout thi s paper since these are the units most
frequently u sed in fr ac ture tougr.ness work in the United States. Convers ion to 5 1 units can be made by use of the relationships found in NBS Handbook 102 (ASTM Metric Practice Guide).

0.875
0.875 ~3---1 I -t-
T ff I
I - +- 4 7 -i- 8 15
t ~ I
1 I -t-
SHORT SEN SPECIMEN I
+ LONG SEN SPECIMEN
FIGURE 1. Nominal dimensions in inches.
TABLE 1. Specimen dimensions
Long Short
Dimension Measurement Std. dev." Measurement Std. dev."
in in in in
B, thickness 0.22947 0.00010 0.23910 0.00007 W,width 2.9982 .0016 b 2.9952 .0006 L, effective
length 8.0011 .0007 b 4.0327 .0001
0.1544 0.1643 .2905 .3083 .4432 . 4448 .5995 .5966
a, crack .7528 .0018 .7516 00014 length (avg) (avg)
.9023 .9004 1.0545 1.0464 1.2059 1.2078 1.3541 1.3463 1.5059 1.4978
a The standard deviations included uncertainties in the uniformity of the specimen dimensions and also limitations in the measurement process. The predominant factor was the variability in specimen dimensions.
b These measurements were made at the beginning of this work. The measurement technique was refined for Land W of the short specimen.
The gage length of the short specimen is defined as the distance between the load bearing edges of the specimen holes minus % the diameter of each pin. The crack length (notch length) of both specimens is the distance from the edge of the specimen to the bottom of the hole. These dimensions are illustrated in figure 2.
The notch in the specimen was made in the following way. A hole was drilled with a 0.019·in drill, 0.150 in from the edge of the specimen at its midlength. Then, a wire was slipped into the hole and a cut was made with a O.013·in-wide jeweler's saw from the edge of the specimen to the wire. The notch was increased in steps of 0.150 in so that after the tenth cut, the notch was halfway across the specimen.
22
~ .'---L-
. ~. • I I I
FIGURE 2. Specimen notch depth, a, and short specimen effective length, L.
3. Apparatus
The instruments used in the experimental work are listed in table 2.
TABLE 2. Instruments and utilization
Instrument Resolution Uti lization
Gage block and null indicator 0.00005 in B, thickness Micrometer .0001 In W, width
d, pin diameter Toolmakers' microscope .00005 in a, crack length Optical comparator .00003 in L, effective length Length extensometer 0, displacement Load cell and indicator .2 Ibf Load
A 1O,000-lbf capacity load cell was used to measure the load. The cell was mounted in series with the specimen in a 100,000·lbf capacity screw-powered testing mao chine. The estimated errors in the load measurement did not exceed 0.15 percent of load .
'~ I
The displacement was measured by means of an extensometer, developed by J. R. Houghton especially for ) this kind of work and described in Appendix A. A linearvariable-differential-transformer (LVDT) of O.l-in range ' is the sensing element in the extensometer. With this inst.rument it is possible to resolve extensions of less than 1 [.tIn.
For our tests the extensometer was modified to use nylon bushings to replace the flexures centering the L VDT cores in their transformer bodies, a brass thumb screw spring loaded against the active LVDT core to replace the micro- F
meter-screw adjustment of the core, and minor changes in the electrical circuitry [2]. A 2-in gage length Tuckerman strain gage equipped with a O.4-in lozenge [3] was used to calibrate the extensometer in an extensometer comparator. Random errors in calibration over the sevenmonth period on the short specimen ranged from 1.4 to -;, 2.9 [.tin.
Support pins for the long specimen were of different design than those for the short specimen. As the long. specimen pins were tightened in their clevises, the pins were expanded to a tight fit in the specimen holes by , means of split bushings around the pin midsections, figure • 3. The short specimen pins, simple cylinders, had a slid- i' ing fit in the specimen holes, as shown in figure 4. The long-specimen pins, supported by roller bearings in the \

>
PIN ASSEMBLY
_ __ I_~-, ,
PIN ASSEMBLY
(fREE TO ROTATE)
FIGURE 3. Long specimen fi xtures.
FIGURE 4. Short specimen fix tures.
clevis, were free to r otate as load was appli ed. The pins ( could also be locked with respect to the clevis. The short
specimen pins were not fixed with respect either to the clevis or the specimen.
23
4. Plan of Experimental Work
Compliance (d8 /dP ) was determined for both specimens for crack length/specimen width (a/W ) = 0.0 to 0.5. Six load·displacement runs were made at each value of a/ W on the long specimen and three on the short specimen. The first three runs on the long specimen were made with the pins free to rotate and the second three with the pins locked. With the long specimen, the extensometer was not disturbed until the six test runs had been completed, since the extensometer was attached directly to the specimen. In the case of the short specimen, the extensometer and the specimen were removed and replaced between runs to randomize errors due to attachment of the extensometer to the pins.
The extensometer was calibrated (three runs per calibration, averaged) over a range of 8000 f.tin before and after the test series on each specimen. In addition, because maximum accuracy and precision were desired for the short specimen, the ex tensometer was calibrated .for each of the notch lengths of thi s specimen. The load cell and indica tor were cali brated by dead weights before the long-specimen test series and before and after the short specimen test series.
After all tests were concluded on the lon g and short specimens, three load-displacement runs were made on a short, unnotched steel specimen in the short specimen fixtures. The purpose of these tests was to estimate the deflection of th e pins under load from the known ratio of the stiffn ess of aluminum to tha t of steel. I' inally, three load-displacement runs were made on a 707S-T6 aluminum reduced cross-section specimen to determine the value of modulus for use in evaluation of the experimental data. This specimen had dimensions simila r to the standard plate type specimen, figure 6 of ASTM E 8-68, except that the ends were for pin-ended connections.
5. Test Procedure
The specimen was installed in the grips in the testing machine. (The pins for the short specimen were lubricated with a hi gh-pressure lubricant before being inserted into the clevis and specimen. The short specimen was centered in its grips by means of 0.003-in shims to prevent contact between the specimen faces and the clevis surfaces.) The assembly was oscillated or lightly tapped to aline it properly prior to loading.
An initial load, 60 lbf for the long specimen and 1000 lbf for the short specimen, was applied (and the short specimen shims were removed) to eliminate slack and nonlinear motion in the grips. The extensometer was attached and then set to an initial reading which was the same for all the tests on one specimen. After a IS-min stabilization period, three preloads were applied to an average stress level of about 12,000 Ibf/in2, based on specimen area at the notch.
After each preload, the load was reduced to zero for the long specimen and to 1000 Ibf for the short specimen.
The loading rate was approximately 100 lbf/min. Loading was continuous during a test run, the indicated load being read from the load cell at extensometer-extension intervals of 400 up to 7600 f.ti n. At the end of a test run

6r---,---,---,---,----r---,---,---,---,---,
5
SHORT SPECIMEN
4 C AT 8000 lBF/IN 2
j 2
LONG SPEC IMEN
O~ __ ~ __ ~ __ ~ __ ~ __ -L __ -L __ -L __ -L __ ~ __ ~
.00 .05 .10 .15 .20 .25 .30 .35 .40 .45 .50
NOTCH DEPTH / SPECIMEN WIDTH, o/W
FIGURE 5. Normalized compliance for short and long specimens.
on the long specimen, the load was reduced to zero. Whenever possible, the next of the six test runs was made immediately (without preloads). At the end of a test run on the short specimen, the load was brought down to 1000 lbf. At this time the extensometer was removed; then the load was brought down to zero and the specimen removed. When the specimen was reinstalled in the grips, the entire test procedure (with preloads) as described above was repeated for another test run.
6. Reduction of Data
In line with the practice fonowed by other investigators, we wished to work with the compliance, or the slope (dB / dP), of the load.displacement relationship. It is con· venient to express the experimental compliance measure· ments in terms of Srawley's stress function solution, EWC/P2, which is related to the compliance by [4]:
d(EC/2) _EWiJ d(a/W) -72· (1)
This expression was derived by boundary collocation of the Williams stress function which requires that plane strain conditions exist on the specimen. It is recognized that the compliance of the short specimen also included deformation at the contact points and the deformations of the pins. See figure 5.
A linear fit by the method of least squares was sufficient to describe the load-displacement relationship for the long specimen. For the short specimen, however, the measure· ments indicated slight curvature in the relationship that was inadequately described by a linear fit. A third-degree fit reduced the standard deviation by 8 to 1 and was se· lected for fitting the short specimen data. Short specimen compliance was evaluated at average stress levels, based on the area of the specimen at the notch, of 5000, 6000, 7000, and 8000 Ibf/in2 • In fitting curves to the data from both specimens, data below 1000 lbf load were dropped to minimize computer round·off errors. The data from both specimens were normalized to a specimen of nominal length 8 in and 4 in, respectively, and a thickness of 1 in.
24
12
o BEARING FREE
• BEARING LOCKED
.00 .0510 .15 .20 .25 .30 .35 .40 A5 .50
NOTCH DEPTH SPECIMEN / WIDTH , o / W
FIGURE 6. Experimental values of EW.-1 /P' versus a/W for 8·in gage-length SEN specimen.
TABLE 3. Stress function solutions and experimental values of EW;~/P2 for 7075-T6 aluminum SEN specimen of
8-in effective length and 3·in width
Notch Notch depth-to-depth width ratio (a) (a/W)
in
0.00 0.00 .15 .05 .30 .10 .45 .15 .60 .20 .75 .25 .90 .30
1.05 .35 1.20 .40 1.35 .45 1.50 .50
• Reference [1]. b Reference [5].
Bearing free
0.000 .261 .459 .687
1.037 1.601 2.470 3.737 5.492 7.829
10.839
Stress function solu tions
Bearing Theoretical Experimental locked (Srawley) • (Srawley) b
0.000 0.000 0.000 .228 .204 .314 .427 .445 .556 .675 .758 .816
1.051 1.180 1.180 1.633 1.768 1.735 2.500 2.603 2.571 3.728 3.813 3.775 5.397 5.596 5.436 7.587 8.826 7.641
10.373 12.399 10.447
Values of EC /2 for the different crack length ratios a/ W were fi tted by the method of least squares to a fourth· degree polynomial of the form:
~ I
{; EC / 2=Bl + B2 (a/W) 2 + B3(a/ W)3 + B4 (a / W) 4. (2) _:
This particular form of the equation was chosen so that I the derivative of EC/2 is forced through zero at a/W=O, a condition imposed by the fact that EWC/ p2 is zero in the un notched specimen. Srawley's stress function solu· j tions were then evaluated for both specimens as: '\
EWfl/P2=2B2(a/W) +3B3 (a/W)2+4B4(a/W)3. (3) -J
7. Results and Discussion I ,
Long specimen results both with the clevis bearing I locked and unlocked are given in table 3. Theoretical [1] ""\ and experimental [5] values from the work of Srawley , are also given for comparison. Comparison of our values

>
TABLE 4. Values of coeffi cients of polynomial fit , long specimen
d (EC/2) E W IJ
d (a/ 117) / P'=28 ,(a/ W) +38 3 (a/ W) '+48.( a/ 117) '
Bea ring Bearing free locked
B, 3.22 2.69 B, -10.26 - 7.15 B. 30.62 26.10
12
SRAWLEY THEORETICAL
o
o o
O~~~~ __ ~ __ L-~L-~ __ ~ __ L-~ __ ~ 00 05 .10 15 .20 .25 .30 .35 .40 .45 .50
NOTCH DEPTH / SPECIMEN WIDTH , o / W
FIG URE 7a. Experimental values of EW,9' I P' versus a/W (C evaluated at 5000 lbf/in' ) for the short specimen.
with the theoretical values of Srawley is also shown In fi gure 6. Values of the coefficients of the polynomial fit are given in table 4,.
The differences between our results with the pin-assembly free to rotate and with it locked average 0.023 for aj W ratios up to 0.35. This seems to indi cate tha t limiting the motion of the assembly does not affect the results significantly. There is good agreement, in general, with the Srawley theoretical stress fun ction solutions, particularly for small notches.
Short specimen results evaluated at four average stress levels (as di scussed in the previous section) are given in table 5. Theoretical values of the Srawley [1] theoretical stress fun ction solutions and the experimental values of Sullivan [6] are given for comparison. Our results at 5000 and 8000 Ibf/in2 are shown in figures 7a and 7b
~ along with the Srawley theoretical stress function solutions. Derived for specimens having an L/W ratio of at
least 2, the theoretical stress fun ction solutions may not be completely appli cable to a specimen such as our short specimen having L/ W = 1.3. Also, see remarks in refer-ence [1], pp. 8-9. In addition, deformation measurements made by connection through the pins introduce effects such as the deformation around the holes not contained in Srawley's theoreti cal treatment. We estimate the contribu
r tion of the bending of the pins to be about 2 percent of r the measured compliance value for the short specimen.
This estimate was based on the compliance measurement
I I 25
12
"-
!l\ 10
~ 0 8
~ ~ 0 « 6 >
~ 0
z 4
~ iii w
2 "-~
.10 .15 .20 .25 .30 .35 .40 ,45 .50
NOTCH DEPTH/SPECIMEN WIDTH , o/W
FIGURE 7b. Experimental values 01 EW·:; /P' versus a/W (C evaluated at 8000 lbl/in') for the short specimen.
TABLE 5. Stress fun ction solutions and experimental values for EW9'/P2 for 7075-T6 aluminum SEN specimen
of 4-in effective length and 3-in width
Notch dep th-to-
Notch width dep th ratio ---(a ) (a/ W ) 5000 '
In
0.00 0.00 0.000 .15 .05 .532 .30 .10 1.024 .45 .15 1.543 .60 .20 2.159 .75 .25 2.941 .90 .30 3.959
1.05 ,35 5.280 1.20 .40 6.974 1.35 .45 I 9,111 L50 .50 11.759
• Reference [6]. b Reference [1].
Experimental ---- ---6000 ' 7000 ' 8000 ' --- ---
0.000 0.000 0.000 .513 .463 .384 .998 .924 .804
1.517 1.438 1.035 2.133 2.058 1.934 2,909 2.841 2.736 3.906 3.840 3.758 5.188 5.109 5.045 6.815 6.705 6.644 8.852 8.681 8.601
11.359 11.093 10.961
' Stress level at which evaluated. Ibf/ in' .
Experi- Theoreti-mental' cal b
( Sull i- (Sraw. van ) ley)
0.00 0.000 .35 .204 .60 .445
1.00 .758 1.40 1.180 1.95 1.768 2.75 2.603 4.20 3.813 6.20 5.596 8.90 8.826
12.40 12.399
of a short steel and a short aluminum specimen in the same fixtures and considering the modulus of the respective materials.
From the range of the stress function values in the individual runs, the estimated standard deviations of the data for notch depths up to 1.05 ranged from 0.20 at the 5000 Ibf/in2 level to 0.13 at the 8000 Ibf/in2 level. For notch depths of 1.20 and greater, the estimated standard deviations increased to a maximum of 2.4 at 5000 Ibf/in2
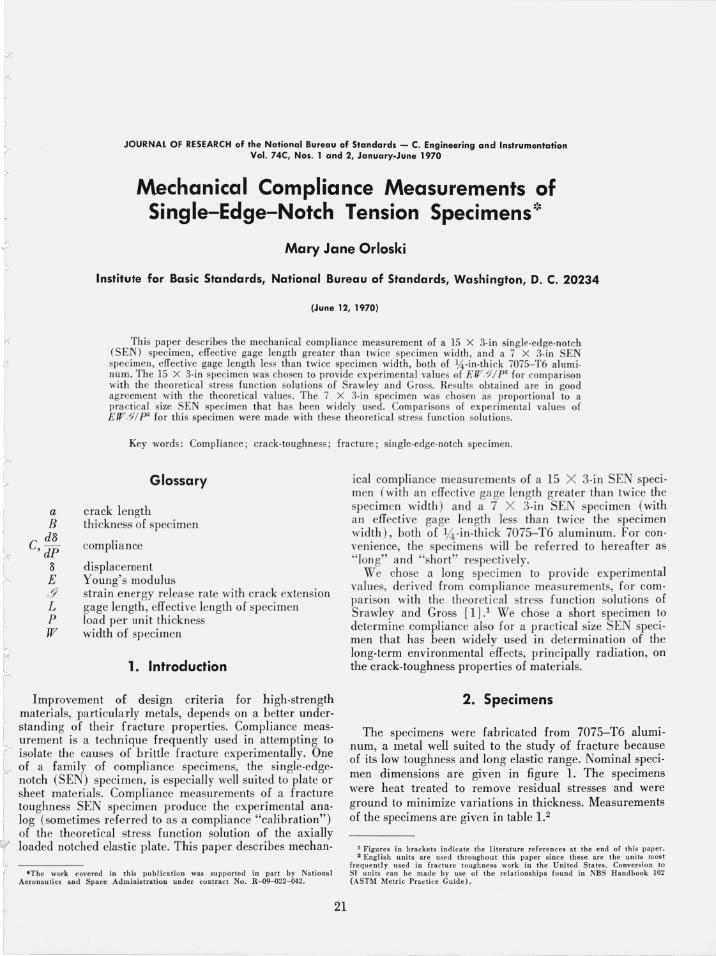
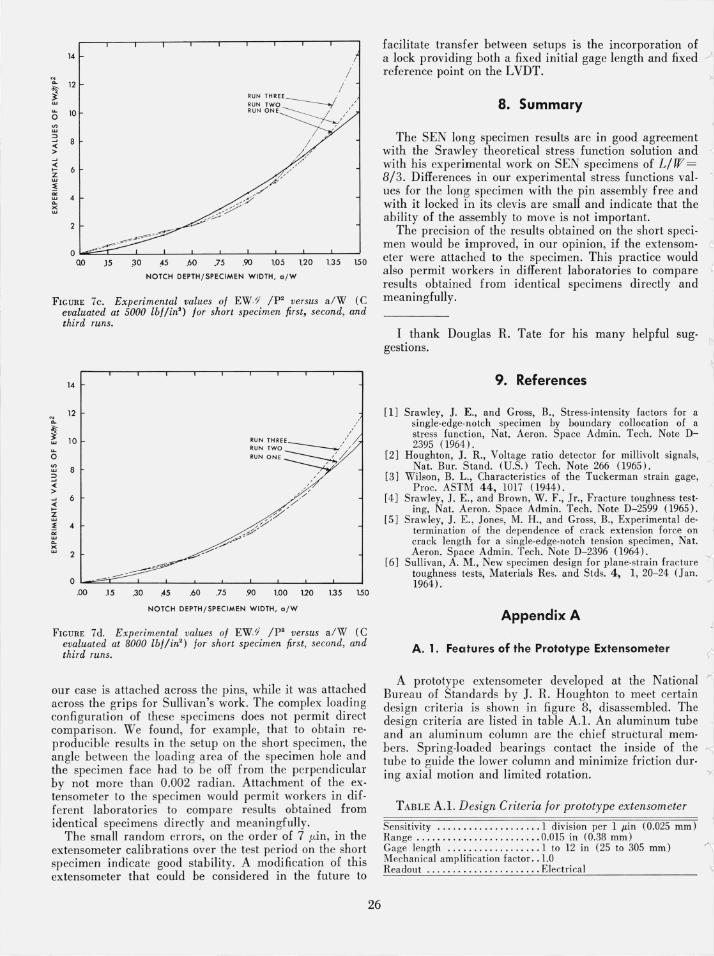
and 1.1 at 8000 Ibf/in2 • As indicated previously, the specimen was removed and replaced between runs so that, in effect, each run was an independent determination for the specimen. The individual runs for 5000 and 8000 Ibf/in2 are shown in figures 7c and 7d.
Lack of correlation between our data and those of Sullivan, who measured the compliance of a proportionally smaller specimen, is probably due to the different points of attachment of the extensometer. The extensometer in
14
.. ;. 12
~ (; 10
'" w
:3 ..: >
~ Z
~ ~ ~
6
4
.15 ;30 ~5 .60 .75 .90 105 120 1.35 1.50
NOTCH DEPTH/SPECIMEN WIDTH, o /W
FIGURE 7c, Experimental values of EW·9' /P' versus a/W (C evaluated at 5000 Ibf/in') lor short specimen first, second, and third runs.
14
12 .. "-
~ ~ 10 ~
0
'" 8 w
:3 ..: >
< 6 ... ~ l: 4
"' w "-~ 2
RUN THREE __ ': RUN TWO ' /
'UNONE~~
./
'/ /'
,y./ ~.
~:.,p::-
. 00 .15 .30 !l5 .60 .75 .90 1.00 1.20 1.35 1.50
NOTCH DEPTH/SPECIMEN WIDTH, o/W
FIGURE 7d. Experimental values of EW.9' /P' versus a/W (C evaluated at 8000 fbf/in') for short specimen first, second, and third runs.
our case is attached across the pins, while it was attached across the grips for Sullivan's work, The complex loading configuration of these specimens does not permit direct comparison. We found, for example, that to obtain reo producible results in the setup on the short specimen, the angle between the loading area of the specimen hole and the specimen face had to be off from the perpendicular by not more than 0.002 radian. Attachment of the extensometer to the specimen would permit workers in different laboratories to compare results obtained from identical specimens directly and meaningfully.
The small random errors, on the order of 7 ,uin, in the extensometer calibrations over the test period on the short specimen indicate good stability. A modification of this extensometer that could be considered in the future to
26
facilitate transfer between setups is the incorporation of a lock providing both a fixed initial gage length and fixed ~ reference point on the LVDT_
8. Summary
The SEN long specimen results are in good agreement with the Srawley theoretical stress function solution and with his experimental work on SEN specimens of LI W = 813. Differences in our experimental stress functions values for the long specimen with the pin assembly free and with it locked in its clevis are small and indicate that the ability of the assembly to move is not important.
The precision of the results obtained on the short specimen would be improved, in our opinion, if the extensometer were attached to the specimen, This practice would also permit workers in different laboratories to compare results obtained from identical specimens directly and meaningfully,
I thank Douglas R_ Tate for his many helpful suggestions.
9. References
[I] Srawley, 1. E., and Gross, B., Stress-intensity factors for a single-edge· notch specimen by boundary collocation of a stress function, Nat. Aeron. Space Admin. Tech. Note 0-2395 (1964).
j )
[2] Houghton, J. R., Voltage ratio detector for millivolt signals, -< Nat. Bur. Stand. (U.S.) Tech. Note 266 (1965) .
[3] Wilson, B. L., Characteristics of the Tuckerman strain gage, Proc. ASTM 44, 1017 (1944). .<
[4] Srawley, 1. E., and Brown, W. F., Jr., Fracture toughness testing, Nat. Aeron. Space Admin. Tech. Note 0-2599 (1965).
[5] Srawley, 1. E., Jones, M. H., and Gross, B., Experimental determination of the dependence of crack extension force on crack length for a single-edge-notch tension specimen, Nat. Aeron. Space Admin. Tech. Note 0-2396 (1964).
[6] Sullivan, A. M., New specimen design for plane-strain fracture toughness tests, Materials Res. and Stds. 4, 1, 20-24 (Jan, 1964) .
Appendix A
A. 1. Features of the Prototype Extensometer ~i
A prototype extensometer developed at the National r/
Bureau of Standards by 1. R. Houghton to meet certain design criteria is shown in figure 8, disassembled. The design criteria are listed in table A.I. An aluminum tube and an aluminum column are the chief structural members. Spring-loaded bearings contact the inside of the -<; tube to guide the lower column and minimize friction dur-ing axial motion and limited rotation. ,;
TABLE A,I. Design Criteria lor prototype extensometer
Sensitivity .... . _ .............. 1 division per 1 J.lin (0.025 mm) Range ........................ 0.015 in (0.38 mm) Gage length ............. . .... l to 12 in (25 to 305 mm) Mechanical amplification factor .. 1.0 Readout ....... _ ... ...... .. ... Electrical

~
I
I
r
I
l.
I
(
FIGURE 8. Prototype extensometer disassembled.
Two linear-variable-differential-transformers (LVDT's) are located at the base of the tube. The LVDT coupled with extensometer motion is mounted so that the core
27
moves with the column while the transformer coil moves with the tube. Small adjustments in the position of this core may be made by means of a micrometer screw. A similar LVDT having a fixed core is mounted adjacent to the displacement.sensing LVDT. The cores of both LVDT's are centered in their transformer bodies by means of flexure plates.
The voltage outputs of the secondary coils of the LVDT's were compared by means of a voltage-ratio detector. This voltage-ratio detector can resolve voltage differences as small as 10 ppm [3].
One set of gage points is mounted on the tube and one set on the column. The gage length may be set from 2 to 12 in without changing the extensometer calibration. The adj ustment is made by moving the upper set of gage points up or down the tube.
A. 2. Modification of the Prototype
Houghton modified the prototype extensometer to replace the inner spring-loaded bearing column by a rod supported on fl exure plates to provide parallel motion. He designed the present ex tensometer gage points, adjustable for specimen wid ths up to 6 in . He also designed the support fixtures that were used for our long specimen.
(Paper No. 74C1&2-297 )