measuring world real economic activity
TRANSCRIPT

Measuring World Real Economic Activity
James D. Hamilton
University of California at San Diego
1
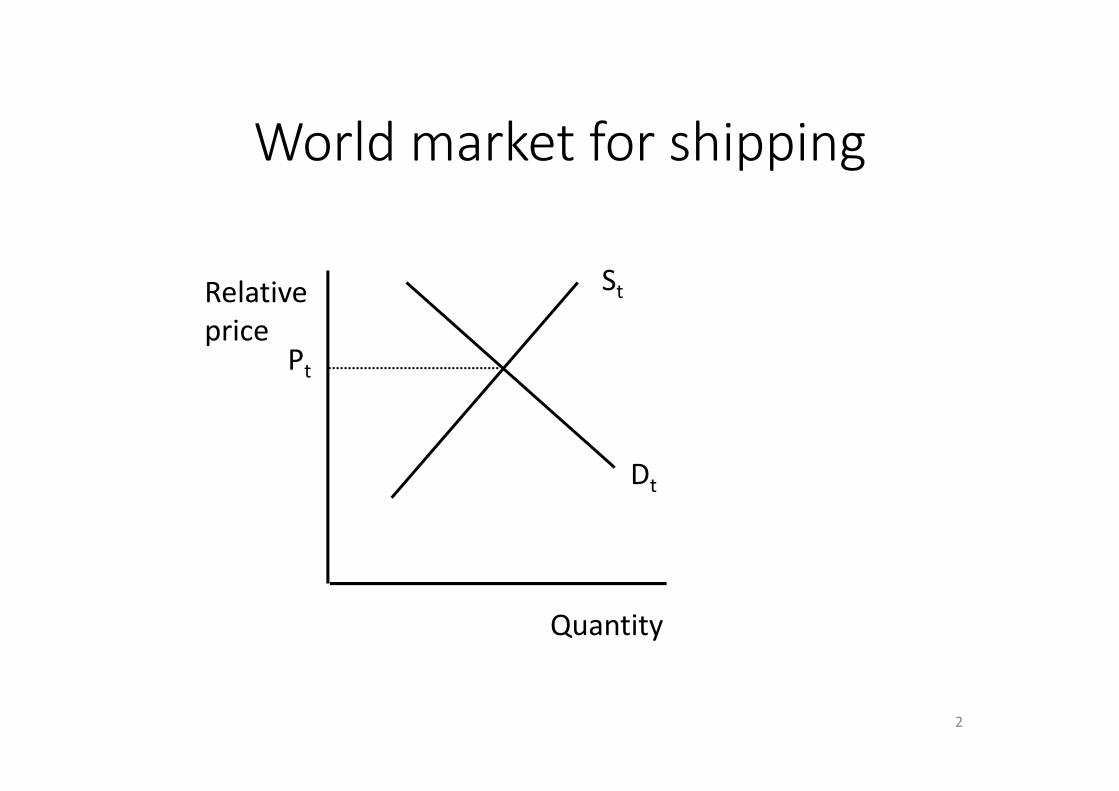
World market for shipping
2
Quantity
Relative
price
Dt
St
Pt

• Demand shifts right most years as global economic activity increases
• Supply shifts right as capacity added and technology improves
• Supply shifts usually dominate and relative price falls
3
Dt+1Dt
St St+1
Quantity
Relative
pricePt
Pt+1

Kilian (AER, 2009): Model shifts in supply and growth in potential output using deterministic time trend, interpret deviations from trend as real economic activity
4

Details behind Kilian’s index
• Up until 2008, Kilian calculated the monthly growth rate of a number of individual shipping costs and averaged them
• This gave him a nominal index of shipping cost (call it x)
• Since 2008, he updated the index by adding the change in the log of the Baltic Dry Index (BDI) to x
• He divided the nominal index x by the U.S. CPI to get a real index
• However, his nominal index is in units of logarithm of dollars (not dollars), so this is not correct way to deflate
5

• Kilian (2009) then took the log of this “real shipping cost” and regressed it on a linear trend
• He published the residuals from this regression as a measure of real global economic activity
• This measure has been used in dozens of empirical studies over 2009-2019
6
7
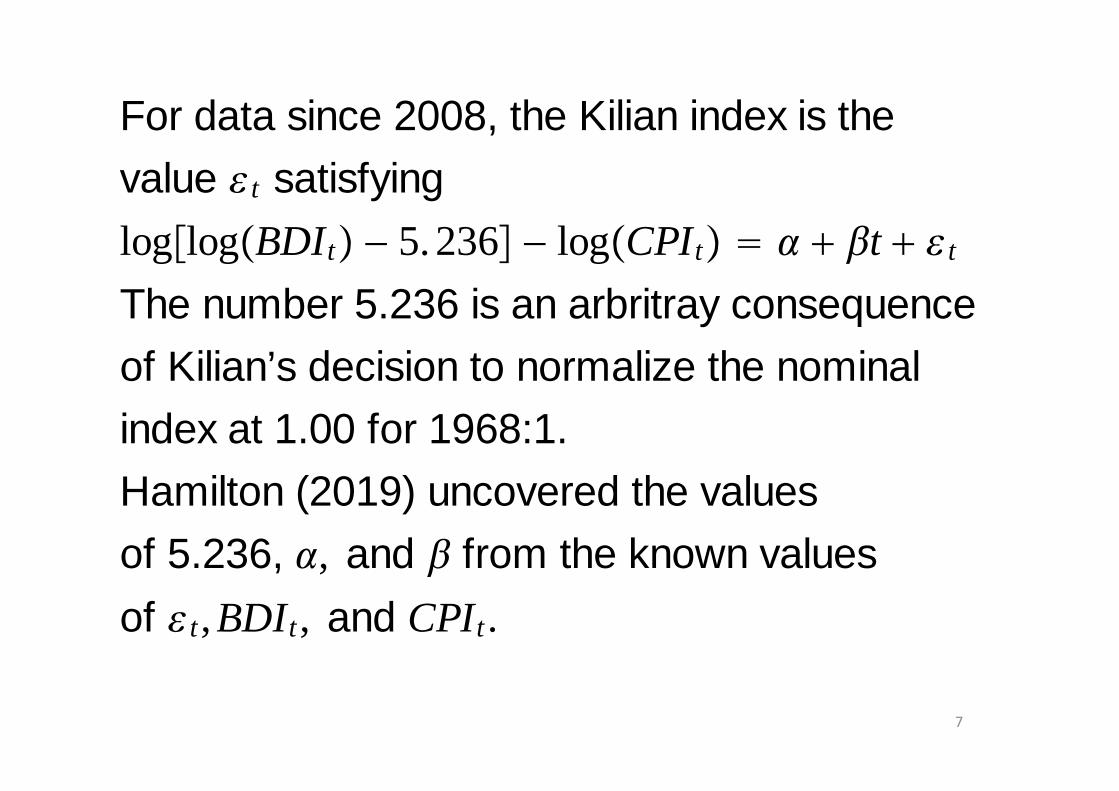
For data since 2008, the Kilian index is the
value � t satisfying
log�log�BDIt� � 5. 236� � log�CPIt� � � � �t � � t
The number 5.236 is an arbritray consequence
of Kilian’s decision to normalize the nominal
index at 1.00 for 1968:1.
Hamilton (2019) uncovered the values
of 5.236, �, and � from the known values
of � t,BDIt, and CPIt.

8

9
Kilian (Econ Letters, 2019): There was a
“coding error” in the way the measure of real
economic activity was originally constructed
and as continually updated since 2008.
Kilian-Zhou (2018) measure:
log�log�x t� � 5.236� � log�CPIt� � � � �t � � t
Kilian (2019) measure:
log�x t� � log�CPIt� � � � �t � � t

Real economic activity measure as downloaded from Kilian’s webpage on July 2018 and April 2019
10

Kilian’s (2009) key support for using this measure was an anecdotal review of developments 1970-2007
• “Figure 1 is fully consistent with the anecdotal evidence on the relative importance and timing of these fluctuations in global real economic activity” (p. 1057)
• “the level of global real economic activity as it relates to industrial commodity markets is proportionate to this index” (p. 1056)
11

But subsequent values for the index claim that the world experienced a global downturn in 2016 worse that the financial crisis
12

13
Question: is y t � log�x t� � log�CPIt�
stationary around a linear trend?
Augmented Dickey Fuller test
H0 : y t has a unit root
fail to reject H0 at 10% level
KPSS test
H0 : y t is trend stationary
reject H0 at 1% level

Implication: Estimates of trend and real economic activity keep changing
14

• Hamilton (REStat, 2018) suggested that a better way to isolate the cyclical component of most macroeconomic and financial time series is by taking the two-year growth rate
15

Kilian index claims 2016 was the worst global downturn because it assumed a linear trend
16

• Natural alternative: OECD Main Economic Indicators has estimate of industrial production for OECD plus 6 major countries (Brazil, China, India, Indonesia, Russia, South Africa)
• Updated by Baumeister and Hamilton (AER, 2019)
17

18

• Kilian and Zhou (JIMF, 2018): Can’t use world real GDP because a long time series is only available annually
• But it’s simple enough to regress world real GDP growth in year t on a proposed measure of monthly real economic activity in December of year t
• Compare Kilian indexes with cyclical component of world industrial production or real shipping cost calculated as suggested by Hamilton (2018)
19

Regression of world GDP growth in year t on measure in Dec of t
Measure of real
economic activity
t-statistic R2
Industrial
production
12.21 0.77
Kilian-Zhou (2018) 1.45 0.04
Kilian (2019) 1.27 0.03
Real shipping cost 3.68 0.23
20

• Kilian-Zhou (2018): Shipping cost is good because it’s forward looking
• So try the same regression using proposed index as of June of year t instead of December
21

Regression of world GDP growth in year t on measure in June of t
Measure of real
economic activity
t-statistic R2
Industrial
production
5.23 0.38
Kilian-Zhou (2018) -0.52 0.01
Kilian (2019) -0.53 0.01
Real shipping cost 0.77 0.02
22

• Kilian-Zhou (2018) claimed that shipping costs are particularly helpful for modeling commodity prices
• But they did not provide any statistical analysis to back this claim up
23
24
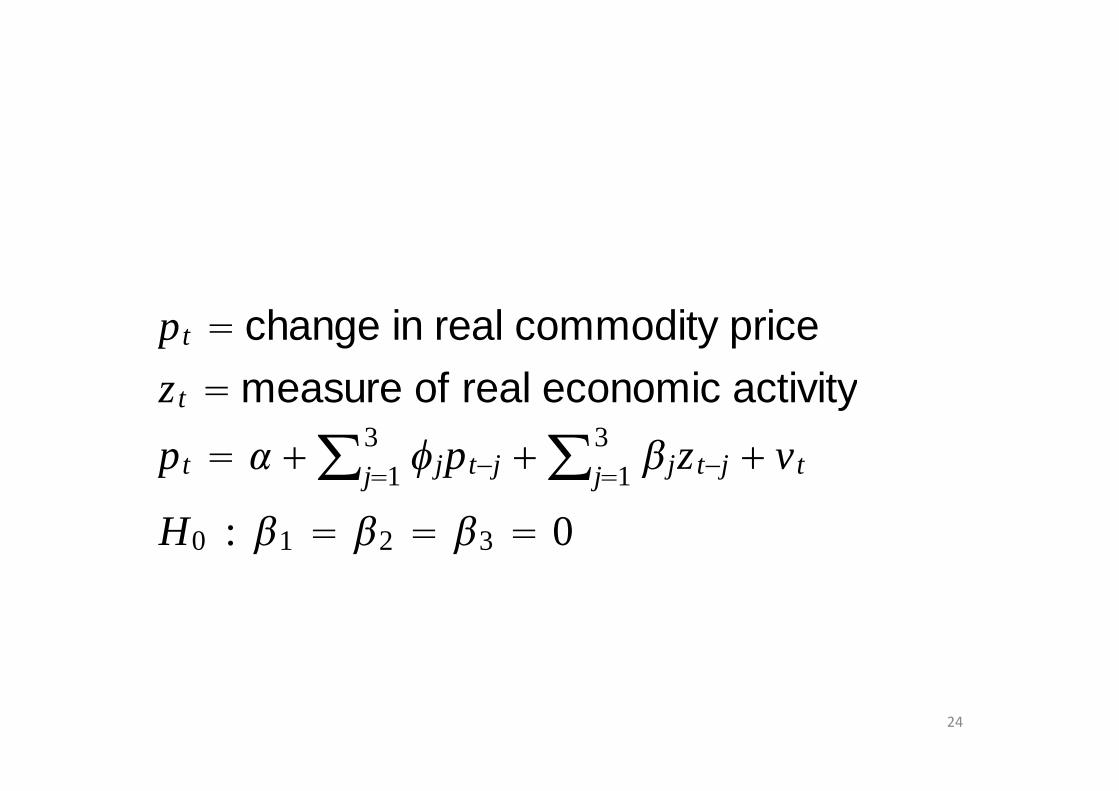
p t � change in real commodity price
z t � measure of real economic activity
p t � � ��j�13 �jpt�j ��j�1
3 �jz t�j � v t
H0 : �1 � �2 � �3 � 0

P-value of test of null hypothesis that measure is no help forecasting
Commodity
price
Industrial
production
Kilian-Zhou
(2018)
Kilian
(2019)
Energy 0.02 0.33 0.16
Non-energy < 0.01 0.15 0.06
Agriculture < 0.01 0.10 0.05
Base metals 0.01 0.12 0.02
Crude oil 0.05 0.52 0.27
Soybeans 0.05 0.14 0.08
Aluminum 0.06 0.38 0.08
Copper 0.01 0.06 0.02
25

If Kilian had continued to calculate nominal index as originally (instead of shifting to BDI) would look very different
26

• However, one benefit of BDI shipping costs is it’s available daily
• Could construct a daily measure of the cyclical component
27

Daily cyclical component of real shipping cost, Mar 16, 2011 - Jul 16, 2018
28
-2
-1.5
-1
-0.5
0
0.5
1
1.5
2
2011 2012 2013 2014 2015 2016 2017 2018