measuring general activity levels in children and
TRANSCRIPT

Graduate Theses and Dissertations Iowa State University Capstones, Theses andDissertations
2012
Measuring general activity levels in children andadolescents using self-report: youth activity profileYang BaiIowa State University
Follow this and additional works at: https://lib.dr.iastate.edu/etd
Part of the Kinesiology Commons
This Thesis is brought to you for free and open access by the Iowa State University Capstones, Theses and Dissertations at Iowa State University DigitalRepository. It has been accepted for inclusion in Graduate Theses and Dissertations by an authorized administrator of Iowa State University DigitalRepository. For more information, please contact [email protected].
Recommended CitationBai, Yang, "Measuring general activity levels in children and adolescents using self-report: youth activity profile" (2012). GraduateTheses and Dissertations. 12883.https://lib.dr.iastate.edu/etd/12883

Measuring general activity levels in children and adolescents using
self-report: youth activity profile
by
Yang Bai
A thesis submitted to the graduate faculty
in partial fulfillment of the requirements for the degree of
MASTER OF SCIENCE
Major: Kinesiology (Behavioral Basis of Physical Activity) Program of Study Committee:
Gregory J. Welk, Major Professor Senlin Chen
Michelle Ihmels
Iowa State University
Ames, Iowa
2012
Copyright © Yang Bai, 2012. All rights reserved.

ii
TABLE of CONTENTS
LIST OF FIGURES ·········································································································iv
LIST OF TABLES ············································································································v
ACKNOWLEDGEMENTS ·····························································································vi
ABSTRACT ····················································································································vii
ChapterⅠ: GENERAL INTRODUCTION ······································································1
Introduction ····················································································································1
Purpose of the Study ········································································································4
Chapter Ⅱ: LITERATURE REVIEW ·············································································6
The Benefits of Physical Activity for Youth ·········································································6
Physical Activity Measurement Techniques ········································································8 Heart Rate Monitors ············································································································································· 9 Pedometers ···························································································································································· 9 Self-report Instruments······································································································································· 10
Review of Different Self-Report Instruments for Youth ····················································· 11 Physical Activity Questionnaire (PAQ)············································································································· 12 Previous Day Physical Activity Recall ············································································································· 16 3-Day Physical Activity Recall·························································································································· 18 ACTIVITYGRAM ············································································································································· 20 Summary of Self-Report Instruments ··············································································································· 22
Epidemiology of Physical Activity Levels in Children and Adolescents ······························· 24
Chapter Ⅲ: METHODS ································································································· 28
Instruments ··················································································································· 29 Physical Activity Assessment ···························································································································· 29 Physical Fitness Assessment ······························································································································ 30
Procedures····················································································································· 31
Data Processing·············································································································· 32
Data Analyses ················································································································ 32
Chapter Ⅳ: RESULTS ··································································································· 34
Summary of Participation Rates Distribution ··································································· 34
Evaluation of Physical Activity Level at School ································································· 34
Evaluation of Physical Activity Level at Home·································································· 35
Evaluation of Sedentary Behavior ··················································································· 36
Correlation between Physical Activity and Physical Fitness ··············································· 37

iii
Chapter Ⅴ: DISCUSSION ····························································································· 38
REFERENCES ··············································································································· 47
TABLES AND FIGURES ······························································································· 54
APPENDIX ····················································································································· 65
Youth Activity Profile ····································································································· 65

iv
LIST OF FIGURES
Figure 1.Physical activity in school index ..............................................................................................................54
Figure 2.Physical activity at home index ................................................................................................................55
Figure 3. Sedentary behavior index .........................................................................................................................56
v
LIST OF TABLES
Table 1 Response frequency by school, gender and grade ...................................................................................57
Table 2 Descriptive statistics of physical activity scores in school .....................................................................59
Table 3 Descriptive statistics of physical activity Scores at home ......................................................................60
Table 4 Descriptive statistics of sedentary behavior scores..................................................................................61
Table 5 Descriptive statistics of subject characteristics, BMI and aerobic capacity.........................................62
Table 6 Descriptive statistics of aggregated data for matched YAP / FITNESSGRAM evaluation. ..............63
Table 7 Pearson correlation between YAP and aerobic capacity, BMI ...............................................................64

vi
ACKNOWLEDGEMENTS
I would like to express my heartfelt gratitude to my major professor Dr. Greg Welk,
for his guidance, support and patience. I could not have asked for better role models,
academically and personally. I would also like to thank Dr. Michelle Ihmels and Dr. Senlin
Chen, for their time, encouraging and constructive feedback.
I also wanted to thank all of the staff who worked with NFL PLAY60 project in the
Cooper Institute. Without their effort and cooperation, I could not make this thesis possible.
Great thanks to all of my lab colleagues, Pedro De Saint-Maurice, Katelin Blasingame,
Youngwon Kim and Jungmin Lee, who has been extremely supportive in the past two years.
And last, but not least, to my parents for their tremendous love and support. They
have been there every single day and night in the past two years even we are thousands of
miles away.
vii
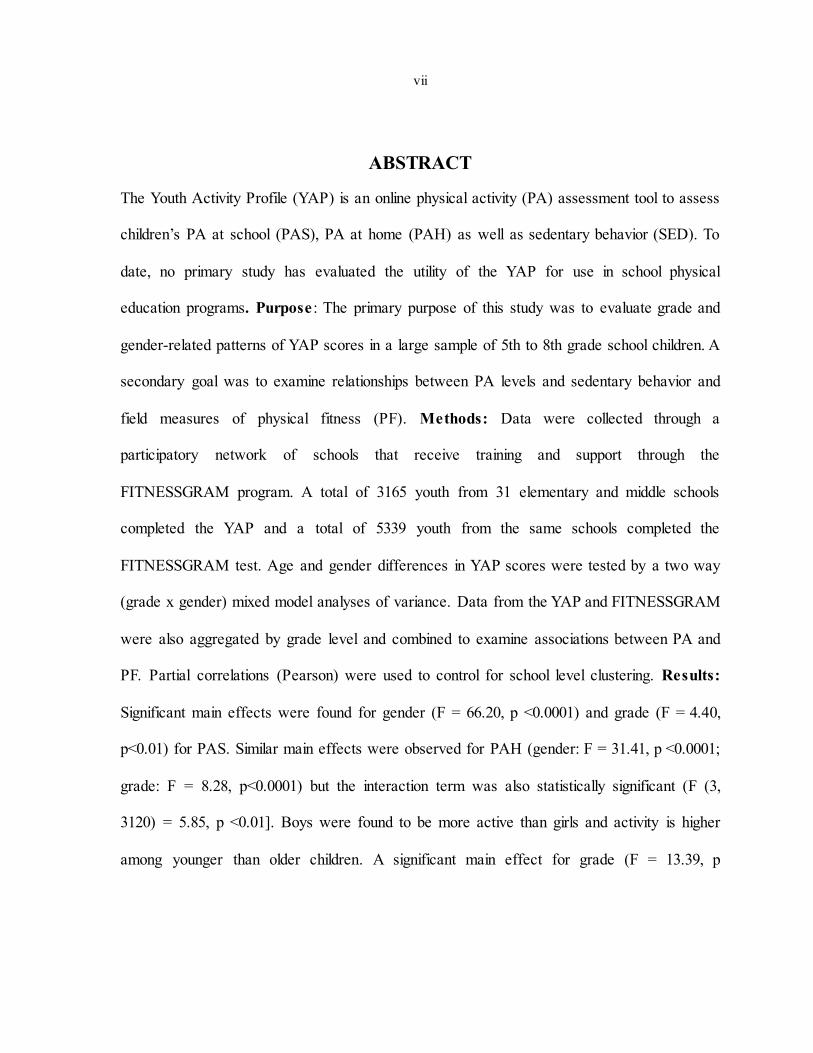
ABSTRACT
The Youth Activity Profile (YAP) is an online physical activity (PA) assessment tool to assess
children’s PA at school (PAS), PA at home (PAH) as well as sedentary behavior (SED). To
date, no primary study has evaluated the utility of the YAP for use in school physical
education programs. Purpose : The primary purpose of this study was to evaluate grade and
gender-related patterns of YAP scores in a large sample of 5th to 8th grade school children. A
secondary goal was to examine relationships between PA levels and sedentary behavior and
field measures of physical fitness (PF). Methods: Data were collected through a
participatory network of schools that receive training and support through the
FITNESSGRAM program. A total of 3165 youth from 31 elementary and middle schools
completed the YAP and a total of 5339 youth from the same schools completed the
FITNESSGRAM test. Age and gender differences in YAP scores were tested by a two way
(grade x gender) mixed model analyses of variance. Data from the YAP and FITNESSGRAM
were also aggregated by grade level and combined to examine associations between PA and
PF. Partial correlations (Pearson) were used to control for school level clustering. Results:
Significant main effects were found for gender (F = 66.20, p <0.0001) and grade (F = 4.40,
p<0.01) for PAS. Similar main effects were observed for PAH (gender: F = 31.41, p <0.0001;
grade: F = 8.28, p<0.0001) but the interaction term was also statistically significant (F (3,
3120) = 5.85, p <0.01]. Boys were found to be more active than girls and activity is higher
among younger than older children. A significant main effect for grade (F = 13.39, p

viii
<0.0001) was found for SED but non-significant effects were found for gender and the
interaction. The PAS indicator had a significant positive correlation with aerobic capacity
(r=0.42, p<0.01) and a significant negative correlation with BMI (r=-0.34, p<0.05). The SED
indicator had a significant negative correlation with aerobic capacity (r=-0.29, p<0.05) and a
significant positive correlation with BMI (r=0.66, p<0.01). Conclusions: The YAP is able to
capture the typical PA and SED patterns. The relatively high correlations between PA, SED,
and PF support the validity of the YAP. The YAP provides a useful tool to facilitate
evaluation and tracking of physical activity in school and at home. The web-based features
and easy data management offer promise for use of YAP in large school-based tracking
studies or population surveillance.

1
ChapterⅠ: GENERAL INTRODUCTION
Introduction
Childhood and adolescence are important periods of life due to dramatic changes in
various physiological and psychological aspects, and also due to healthy/unhealthy lifestyle
and behaviors are formed during this time (Ruiz & Ortega, 2009). Behaviors established in
childhood tend to track into adolescence and adulthood. Overweight/obese youth are at a five
times greater risk of obesity in early adulthood compared with children at the same age with
normal weight (Thompson et al., 2007). The unique needs for children warrant specific
activity guidelines to promote physical activity in children. The US Department of Health
and Human Services published the new US physical activity guidelines in 2008, which
suggest children and adolescents should accumulate 60 minutes or more of physical activity
daily.
Schools have been called upon by many professional agencies and public health
groups to play a key role in promoting physical activity. Many states have established
guidelines that call for youth to obtain at least 150 minutes of physical activity per week
(essentially half of the daily recommendation since children are in school half the day).
Surprisingly, there has been little work focused on developing instruments that can evaluate
and track children’s level of physical activity at school. Physical education has tended to
focus on assessments of health related physical fitness, but emphasis is also needed to help
students establish lifelong physical active patterns (Pate & Hohn, 1994). Coordinated fitness
2
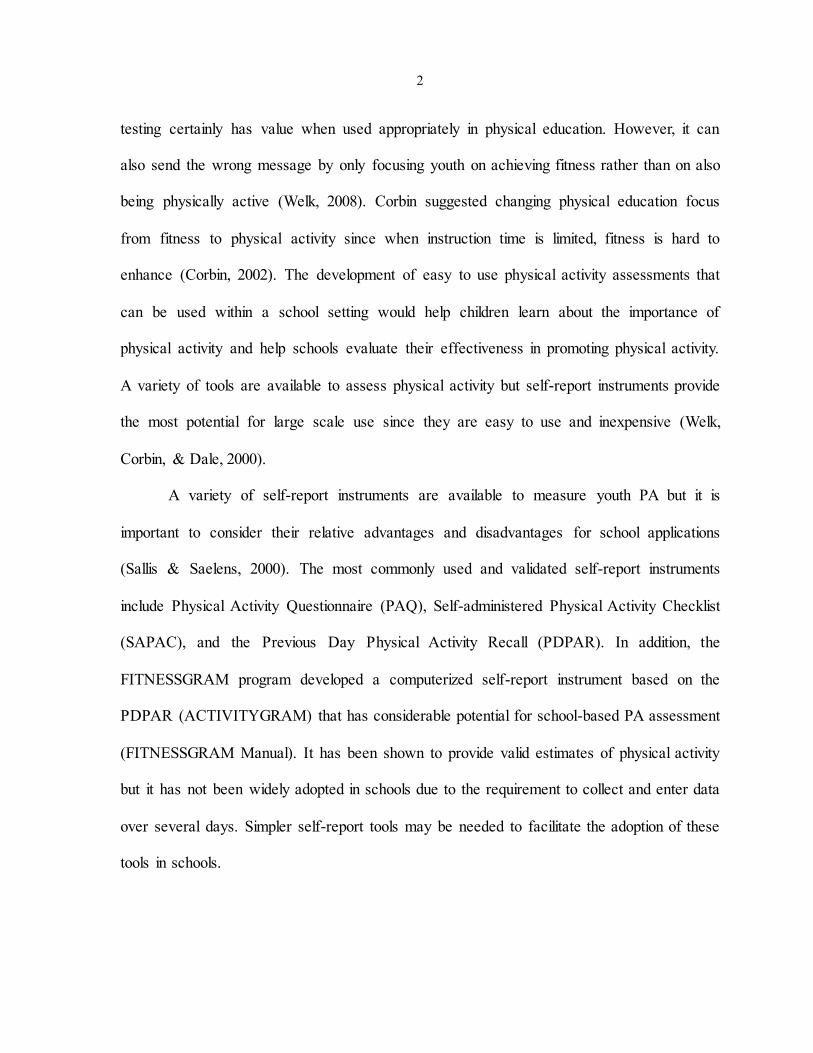
testing certainly has value when used appropriately in physical education. However, it can
also send the wrong message by only focusing youth on achieving fitness rather than on also
being physically active (Welk, 2008). Corbin suggested changing physical education focus
from fitness to physical activity since when instruction time is limited, fitness is hard to
enhance (Corbin, 2002). The development of easy to use physical activity assessments that
can be used within a school setting would help children learn about the importance of
physical activity and help schools evaluate their effectiveness in promoting physical activity.
A variety of tools are available to assess physical activity but self-report instruments provide
the most potential for large scale use since they are easy to use and inexpensive (Welk,
Corbin, & Dale, 2000).
A variety of self-report instruments are available to measure youth PA but it is
important to consider their relative advantages and disadvantages for school applications
(Sallis & Saelens, 2000). The most commonly used and validated self-report instruments
include Physical Activity Questionnaire (PAQ), Self-administered Physical Activity Checklist
(SAPAC), and the Previous Day Physical Activity Recall (PDPAR). In addition, the
FITNESSGRAM program developed a computerized self-report instrument based on the
PDPAR (ACTIVITYGRAM) that has considerable potential for school-based PA assessment
(FITNESSGRAM Manual). It has been shown to provide valid estimates of physical activity
but it has not been widely adopted in schools due to the requirement to collect and enter data
over several days. Simpler self-report tools may be needed to facilitate the adoption of these
tools in schools.
3
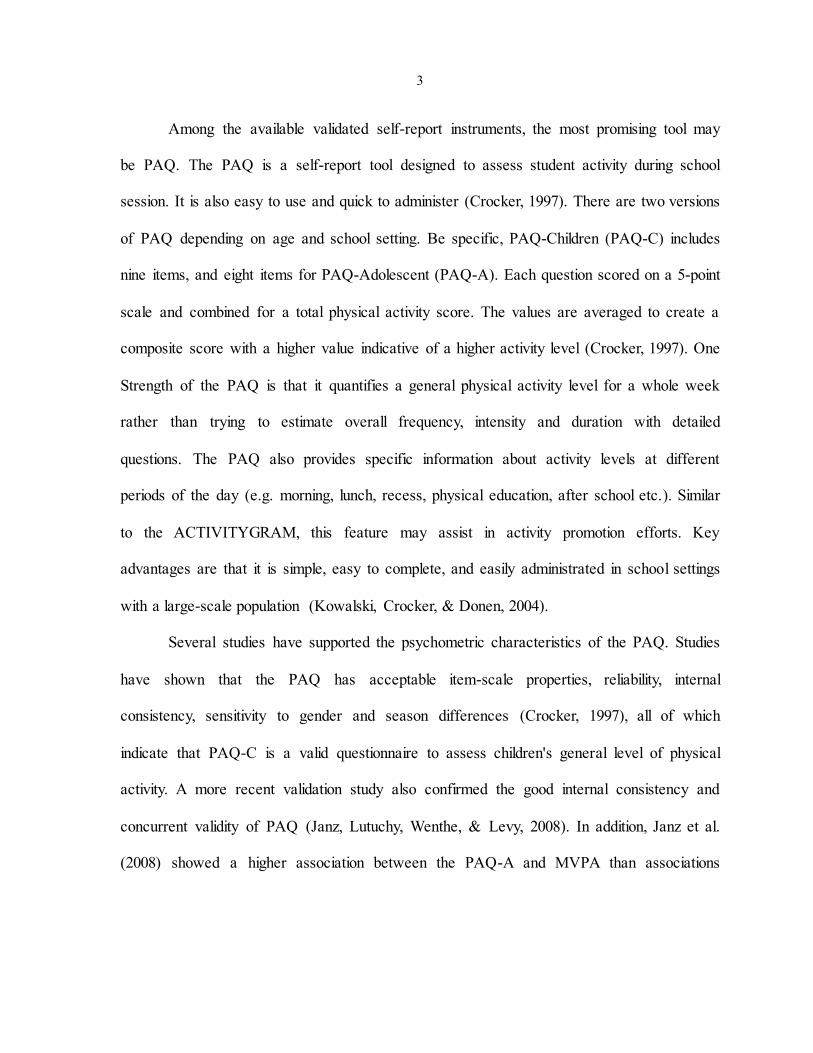
Among the available validated self-report instruments, the most promising tool may
be PAQ. The PAQ is a self-report tool designed to assess student activity during school
session. It is also easy to use and quick to administer (Crocker, 1997). There are two versions
of PAQ depending on age and school setting. Be specific, PAQ-Children (PAQ-C) includes
nine items, and eight items for PAQ-Adolescent (PAQ-A). Each question scored on a 5-point
scale and combined for a total physical activity score. The values are averaged to create a
composite score with a higher value indicative of a higher activity level (Crocker, 1997). One
Strength of the PAQ is that it quantifies a general physical activity level for a whole week
rather than trying to estimate overall frequency, intensity and duration with detailed
questions. The PAQ also provides specific information about activity levels at different
periods of the day (e.g. morning, lunch, recess, physical education, after school etc.). Similar
to the ACTIVITYGRAM, this feature may assist in activity promotion efforts. Key
advantages are that it is simple, easy to complete, and easily administrated in school settings
with a large-scale population (Kowalski, Crocker, & Donen, 2004).
Several studies have supported the psychometric characteristics of the PAQ. Studies
have shown that the PAQ has acceptable item-scale properties, reliability, internal
consistency, sensitivity to gender and season differences (Crocker, 1997), all of which
indicate that PAQ-C is a valid questionnaire to assess children's general level of physical
activity. A more recent validation study also confirmed the good internal consistency and
concurrent validity of PAQ (Janz, Lutuchy, Wenthe, & Levy, 2008). In addition, Janz et al.
(2008) showed a higher association between the PAQ-A and MVPA than associations

4
between the PAQ-A and total PA minutes.
The PAQ has good potential for use in school-based testing but additional research is
needed to evaluate gender and age-related patterns and relationships with other indicators
such as physical fitness. Admittedly, health-related fitness testing is the predominant
approach in physical education system, though debates of fitness testing have been increasing
in recent years (Cale, Harris, & Chen, 2007; Corbin, Pangrazi, & Welk, 1995; Rowland,
1995). Silverman et al. (2008) addressed the value of administering and interpreting health-
related fitness tests in fitness education. However, incorporating both the physical activity
assessment and fitness testing in fitness education might better develop fitness and physical
activity plans and help increase students' knowledge and motivation for physical activity
(Welk, 2008). The PAQ is a practical and easy to use, self-report survey that has considerable
potential for use in school based programming.
Purpose of the Study
The goal of the present study is to evaluate the utility of a modified version of the
PAQ (Youth Activity Profile - YAP) designed for use in schools. The YAP provides separate
estimates of school activity, out of school activity and sedentary behavior. Six of the items
are based conceptually on items from the existing PAQ while four additional items were
developed to capture activity at other time periods (both at school and at home). The YAP
also includes five additional items designed to capture sedentary behavior. Reducing
sedentary behavior is an important priority for youth activity promotion so it is important to
have an estimate of this behavior.

5
The primary goal of the study was to evaluate age and gender-related patterns in YAP
scores in order to better understand and to capture descriptive information about levels of
physical activity (and sedentary behavior) in school children. A secondary goal was to
examine relationships between physical activity and physical fitness. This is intended to
provide an evaluation of the validity of the YAP tool and to provide insights about how it
might complement fitness evaluations in physical education. Collectively, the study will help
to evaluate the value of incorporating both physical activity assessment and physical fitness
testing together in PE curriculum.

6
Chapter Ⅱ: LITERATURE REVIEW
The Benefits of Physical Activity for Youth
Physical activity is recognized to have important benefits for all segments of the
population. The U.S. Department of Health and Human Services has published official
physical activity guidelines which are regarded as the first official physical activity guideline
for Americans. The Guidelines provide specific recommendations for the type and amount of
PA needed for different segments of the population including children and adolescents,
adults, the elderly, and those with special needs. A review by Warburton et al. (2006)
summarized the various health benefits of regular physical activity. According to the review,
physical activity has been shown to improve body composition, promote glucose
homeostasis, enhance insulin sensitivity, reduce blood pressure, improve lipid lipoprotein
profiles (e.g., through reduced triglyceride levels, increased high density lipoprotein [HDL]
cholesterol levels and decreased low-density lipoprotein [LDL]-to-HDL ratios), reduce
systemic inflammation and blood coagulation, promote autonomic tone and enhance cardiac
and endothelial function. In short, regular physical activity is absolutely critical for good
health.
Physical activity is important for all segments of the population but there is
considerable interest in promoting physical activity in youth. This is due in large part to
concerns over the increasing prevalence of obesity, but also to the growing consensus about
the importance for good health. Childhood and adolescence are important periods of life
because of dramatic changes in various physiological and psychological aspects, such as

7
hormonal regulation, body composition, transient changes in insulin sensitivity (Ruiz &
Ortega, 2009). More significantly, many lifestyle habits established during childhood and
adolescence periods tend to track into adulthood (Ruiz & Ortega, 2009). Preventing obesity
in early life is critical since evidence suggests that overweight youth have a five times greater
risk of being overweight than normal weight children of the same age (Thompson et al.,
2007).
The unique needs for children warrant unique activity guidelines. The new US
guidelines suggest that children and adolescents should accumulate 60 minutes or more of
physical activity daily. The amount of physical activity recommended to youth is twice that
of adults, not only because youth have more freedom and greater needs for physical activity,
but also because forming a healthy lifestyle at an early age has an influence on lifestyle later
on. The United States is not the only country that has adopted national physical activity
guidelines for youth. A number of other countries including Australia, the United Kingdom,
and Canada have published their own guidelines. Though there are minor discrepancies
between them, all of the guidelines suggest that youth should engage in at least 60 minutes of
moderate intensity physical activity on a daily basis.
The message of formalized youth physical activity guidelines has generated
considerable interest in understanding and promoting levels of physical activity in children
and adolescents. Schools have been targeted as one of the most promising settings for
reaching and impacting youth. A number of health and education agencies have established
specific recommendations for physical activity in schools. A variety of assessment tools are

8
also available but they differ in validity and feasibility. This literature review will summarize
the various options for assessing physical activity in youth and provide background
information for the proposed research. Emphasis will be based on more practical methods
that can be used in schools since there is specific interest in documenting levels of activity
during the school day.
Physical Activity Measurement Techniques
Various instruments of assessment are available for measuring physical activity among
children and adolescents. Sirard and Pate (2001) classified physical activity measurement into
three categories: primary measures (e.g. direct observation, doubly labeled water, and indirect
calorimetry), secondary measures (e.g. heart rate, pedometer, and accelerometers), and subjective
measures (e.g. self-report, interviews, proxy-reports, and diaries). However, not all of them are
appropriate for use in school and physical education settings. For instance, doubly labeled water
(DLW) is considered to be the standard of physical activity measurements for its accuracy in
evaluating energy expenditure, but it is not appropriate for use in assessing physical activity in
school settings and physical education. DLW also has its own limitations. For example, it is
expensive making it impractical for large scale studies. It is also time-consuming, typically
requiring 7-14 days to complete. Most importantly, the only indicator obtained from DLW is total
energy expenditure. Other important physical activity information, such as intensity, duration,
type, frequency and domain, must be obtained in some other way.
Welk and Wood (2000) reviewed tools that could be effectively used in school based
settings to evaluate activity in youth. The review emphasized three of the most popularly utilized

9
physical activity assessment tools including heart rate monitors, pedometers and self-report
instruments. These methods are briefly summarized below.
Heart Rate Monitors
Heart rate monitors provide a parameter of a person’s physiological response to certain
intensities of activity based on the linear relationship between heart rate and oxygen consumption
(VO2). Sirard et al indicated that the usage of heart rate monitors within physical education
programs can help students learn the function of the cardiovascular system and how to monitor
time spent in individualized target heart rate ranges (Sirard & Pate, 2001; Welk, 2008). However,
heart rate monitors have numerous limitations in school setting physical activity assessment
(Armstrong, 2006; Welk & Woods, 2000). First, it is costly, making it difficult to use in large
samples of school participants. Secondly, heart rate can be influenced by other factors like anxiety,
environment, illness, stress, individual emotion, personal fitness level, type of muscular
contraction, caffeine and some medications (Armstrong, 2006; Welk & Woods, 2000). Those
parameters might limit heart rate monitor accuracy.
Pedometers
Pedometers are portable electronic or electromechanical devices that count a person’s steps
and estimate the distance a person walks over a period of time (Sirard & Pate, 2001). Pedometers
have a number of popular advantages. First, pedometers are easily utilized. Secondly, parameters
(steps and mileages) from pedometers are easily interpreted. Thirdly, pedometers provide a general
activity pattern (Welk, 2008).
There is considerable variability in the reliability and validity of pedometers (Crouter,

10
2003), but, in general, they have been shown to provide good indicators of daily steps. However, a
big disadvantage of pedometers is that they cannot measure non-locomotor activities (Welk, 2008;
Welk et al., 2000). Most units also do not directly estimate minutes of physical activity or enable
data to be stored internally for tracking and downloading. These characteristics and the costs limit
the utility of pedometers for school evaluation.
Self-report Instruments
Self-report instruments have been the most common way to assess physical activity in
youth since they are time and cost-effective and easy to administer to large sample sizes
(Welk et al., 2000; Welk & Woods, 2000). However, they also have a number of limitations
including issues with validity and reliability and difficulties in scoring and interpretation
(Welk & Woods, 2000). A number of studies have examined the validity and reliability of
different types of self-report instruments. The weak results in some studies have caused some
to question the utility of employing self-report instruments with children.
Despite significant limitations, self-report tools still offer considerable potential for
school applications (Welk, 2008). Self-report instruments provide a way to teach important
principles about physical activity and help youth learn about the recommended types and
amounts of physical activity. They also provide a way to evaluate group changes over time or
to compare different schools to examine the relative effectiveness of different programs or
environments. They provide the most effective way to evaluate school level activity
promotion strategies so new methods are needed to overcome limitations highlighted in
previous research. A detailed review of different self-report tools is provided in the next

11
section.
Standards from Devellis' theory in Scale Development: Theory and Applications
(2011) provide useful guidelines to interpret the psychometric properties of various survey
tools. According to his theory, there are four psychometric properties to follow for the items
of a questionnaire. First, item means should be close to the center of a range of possible
scores. Second, each item should have relatively high variance which allows for
differentiating traits among subjects. Third, it is desirable that individual items should be
correlated with each other. Fourth, the questionnaire or tool should have good internal
consistency (reliability).
Review of Different Self-Report Instruments for Youth
A number of different self-report approaches are available for youth but it is
important to consider the relative advantages and disadvantages. Some instruments are based
on recalling details of a previous day or series of days, such as the Weekly Activity Checklist,
Yesterday Activity Checklist, 3-Day Aerobic Recall, Self-Administration Physical Activity
Checklist, Three Day Physical Activity Recall, Previous Day Physical Activity Recall,
ACTIVITYGRAM. Other instruments are focused on assessing typical or “general” activity
profiles, such as the Physical Activity Rating, Physical Activity and Exercise Questionnaire,
Physical Activity Questionnaire for Children, and the Physical Activity Questionnaire for
Adolescents.
Instruments also vary in how they collect data on activity. Some instruments are
based on detailed lists of activities in which children are asked to indicate if they participate

12
in a certain activity and how often (e.g. Weekly Activity Checklist, Yesterday Activity
Checklist, Self-Administration Physical Activity Checklist, Physical Activity Checklist
interview, Physical Activity Questionnaire for Older Children, Physical Activity
Questionnaire for Adolescents). Other tools use time prompts that have children estimate
activity levels during different periods of time (e.g. Previous Day Physical Activity Recall,
Three Day Physical Activity Recall, and the ACTIVITYGRAM).
The section below will provide detailed reviews of several of the more commonly
used self-report tools (Sallis & Saelens, 2000): Physical Activity Questionnaire for Children
and Adolescents, Previous Day Physical Activity Recall, Three Day Physical Activity Recall,
ACTIVITYGRAM. The sections below summarize the psychometric properties of various
self-report instruments that offer promise for school-based activity assessment.
Physical Activity Questionnaire (PAQ)
The PAQ is a simple self-report tool designed to assess activity over the past week.
There are two versions of the Physical Activity Questionnaire which are Physical Activity
Questionnaire for Older Children (PAQ-C) and Physical Activity Questionnaire for
Adolescents (PAQ-A). The PAQ-C is designed for elementary school children ages 8 to 14
approximately (grades 4-8) while the PAQ-A is designed for high school students ages 14-20
approximately (grades 9-12). Both of the questionnaires are designed to measure general
moderate to vigorous physical activity levels during a typical week in school year (Crocker,
1997). The PAQ includes nine items (eight items for PAQ-A), each scored on a 5-point scale.
The values are averaged to create a composite score with a higher value indicative of a higher
13
activity level. The first question provides a physical activity checklist including over twenty
different kinds of sport and exercise activities asking the students how many times they do
each in the past seven days. The next six questions examine their activity level in different
school settings at certain periods in the last seven days (PE, recess, immediately after school,
evening, weekends). The eighth question requires the students to summarize their general
activity levels from among five different statements. The last one asks students to report their
frequency in physical activities for each day of the previous week.
The PAQ has both limitations and strengths. A key limitation is that it does not
provide a useful outcome measure such as energy expenditure or total minutes of physical
activity. Additionally, the PAQ focuses on activity at school and is not appropriate for
assessing physical activity during winter and summer breaks. While these are significant
limitations, it also has some advantages compared with other self-report instruments such as
time efficient, use lunch and evening to enhance recall ability, and short administration time
to obtain a past week physical activity pattern.
The original research on the reliability and validity of PAQ-C in measuring general
physical activity levels in children was conducted by Crocker et al. in three separate studies.
In the first study (Crocker, 1997), 215 students (90 females, 125 males ages 9 to 15)
completed the survey to examine the items and scale properties in PAQ-C. With the
exception of three items (activity checklist, physical activity class and lunch), the results had
relatively high variance and were close to the center of a range of possible scores. When
examined by MANOVA, it was found that males were significantly more active than females
14
for most of items (P<0.05) except for physical education class (P>0.08). The values of all
item-scale relations were higher than 0.30. The reliability of the scale is acceptable for both
males and females (a=0.80 and a=0.83 respectively). Since the items of the scale generally
met the four criterions of psychometric properties DeVellis suggested mentioned above, the
PAQ-C turned out to have acceptable item-scale properties.
In a second study (Crocker, 1997), internal consistency, test-retest reliability and the
sensitivity to gender differences were examined. 43 boys and 41 girls aged 9 to 14 finished
PAQ-C twice within one week. The reliability of PAQ-C was tested and the reported
intraclass correlation coefficients were good for both male (r=0.75) and female (r=0.82)
participants. However, the PAQ-C activity scores showed significant differences over the two
assessments for males (scores increased from 2.85 ± 0.73 to 3.16 ± 0.91) and females (scores
increased from 2.56 ± 0.65 to 2.79 ± 0.80). Crocker et al. attributed this change to the change
in weather. The internal consistency of the PAQ assessments is high (alphas ranging from
0.79 to 0.89). An evaluation of gender differences indicated that boys were more active than
girls for both week 1 [t (82) = 1.93, p < 0.05] and week 2 [t (82) = 1.97, p < 0.05]. It can be
concluded from this study that the test-retest reliability was reasonably good and that the
PAQ-C can differentiate boys and girls physical activity levels.
In a third study (Crocker, 1997), the authors collected data in elementary students and
high school students (using a modified version of the PAQ that had the recess item removed
and an altered activity list). Data were collected in different seasons (fall, winter and spring)
to examine the reliability by generalizability theory. The authors reported that the average of

15
either two or three PAQ-C scores used as a yearly activity composite score were reliable for
the younger sample (G = 0.86 and G = 0.80 respectively) and the older sample (G = 0.90 and
G = 0.85 respectively). Gender and seasonal differences were also found in the study. The
average male activity score was 3.11 which is higher than the female score 2.71. Students
exercised more in April than Oct-Nov (3.10 and 2.79 respectively).
These three studies provide evidence to document that the PAQ-C has acceptable
item-scale properties, reliability, internal consistency, and is sensitive to gender and seasonal
differences. These characteristics support the PAQ-C as a valid questionnaire to assess
children's general level of physical activity (Crocker, 1997).
Another newer validation study has provided a more robust evaluation. Janz et al.
(2008) conducted an independent validation to examine whether the outcome measures from
the PAQ-C and PAQ-A correspond to objectively measured PA from an accelerometry-based
activity monitor (concurrent validity). The authors reported relatively high correlation
coefficients for total PA and percent of day spent in MVPA (r=0.56 and r=0.63, respectively).
The author indicated that this is the highest correlation between any 7-day physical activity
recall for youth and an objective measures. In addition, high standardized Cronbach alphas
(from 0.72 to 0.88) for both versions suggested good internal consistency. Another significant
finding in their study is the higher associations between the PAQ-A and MVPA than
associations between the PAQ-A and total PA. This increased confidence in the ability of the
PAQ-A to accurately estimate MVPA. This is significant for physical activity promotion and
intervention, because it is widely accepted that MVPA is the most beneficial physical activity
16
pattern with health outcomes. Also, most published PA guidelines focus on the accumulation
of MVPA.
It is noteworthy that the researchers in this study modified both of the surveys in
some aspects. First, they added some common midwestern seasonal physical activities (e.g.,
snowboarding), which made the activities list more appropriate and applicable. Second, Q2
and Q4 were eliminated and Q1 was rescaled based on items associations with the activity
monitor in both previous and current research. Third, the rewritten versions are capable of
being administered throughout the whole year, including winter and summer breaks, which
eliminated the limitation of the PAQ-A and PAQ-C as only being useful for school based
assessments. The modifications improved the validity of the PAQ-A and PAQ-C, and
supported the rewriting and modifications in the survey. Other changes could be made if the
surveys were applied in specific districts and among particular subjects or schools with
certain policies (e.g., restricted physical activity during lunchtime) (Janz et al., 2008).
Previous Day Physical Activity Recall
The Previous Day Physical Activity Recall (PDPAR) is a self-report instrument
intended to capture the previous day's physical activity patterns of children after school hours
from 3:00 pm to 11:30 pm. It is a time-based recall approach and the time period is divided
into 17 blocks, 30 minutes each. Children are asked to recall their specific activity from an
activity checklist of 35 common activities which are grouped into the following categories:
eating, sleep/bathing, transportation, work/school, spare timework, and physical activity. The
children are also required to note the intensity of the activity by four levels (very light, light,
17
moderate, or vigorous) per block of time. The PDPAR also provided some cartoon
illustrations describing the characteristic of each intensity level to help children to rate their
physical activity intensity. Each activity has its own corresponding MET values for all four
intensity levels to facilitate the energy expenditure calculation. The PDPAR requires one day
recall and uses a segmented day format to facilitate recall.
Weston et al. (1997) tested the validation of PDPAR in youth with pedometer, Caltrac
activity counts and heart rate monitor as criterion measurement. A total of 119 students in
grades 7-12 were randomly selected to participate in this study. The results showed high test-
retest reliability coefficient (r=0.98) which indicated that students' ability to recall the
physical activity within one hour is consistent. The investigators reported high inter-rater
reliability (r=0.99), indicating that the PDPAR scoring protocol could be coded consistently
by different researchers. The estimated energy expenditure from PDPAR was compared
against outcome measures from a pedometer and a Caltrac monitor. The correlations between
the PDPAR and the other two indicators were high (r=0.88 and r=0.77, respectively). Three
other types of analyses derived from heart rate range (HRR) data were conducted. The
estimated energy expenditure in each 30 min block had low correlations with corresponding
mean HRR. However, higher correlations were detected between mean HRR and mean
estimated energy expenditure over the entire after-school time blocks in all participants.
Moderate to vigorous activity reported from the PDPAR also showed high correlation with
heart rate at or above 50% HRR. Though the study indicated reasonable reliability and
validity, several experimental design flaws should be considered. The main limitation was

18
that none of the comparison measures (pedometer, Caltrac counts and heart rate) provide an
ideal criterion method. A general limitation of the PDPAR is that it only records one day
physical activity pattern which is not long enough to capture the general habitual activity
style. The authors recommended collecting data over several days (Weston et al., 1997) and
this has become standard practice when the PDPAR has been used.
Trost et al. (1999) conducted a more comprehensive validation study of the PDPAR.
The CSA 7164 accelerometer was used to evaluate the validity of PDPAR in 5th
grade
students. The study found that the correlation between mean MET from PDPAR and CSA
counts for each time block was 0.57, which is lower than the correlation in the Weston study
(Weston et al., 1997). Self-reported participation in vigorous activity (METS ≥ 6) had a
higher correlation with the CSA (r=0.38) than corresponding correlations (r=0.19) for
moderate activity (METS 3-6). This result indicated less favorable evidence to support the
validation of PDPAR in young children, especially for estimating moderate physical activity.
This study reached the same conclusion as other studies that the PDPAR is more valid among
higher grade students than lower grade students. Despite these limitations, the PDPAR has
proven to provide good utility for school based assessments.
3-Day Physical Activity Recall
The Three Day Physical Activity Recall (3DPAR) is a self-report instrument derived
from the previous day physical activity recall (PDPAR). It uses 30-min time block, 34 blocks
(from 7:00 am to midnight) each day to capture physical activity characteristic of adolescents
over a three-day period. Each day is also grouped into three time periods--morning, afternoon
19
and evening. The participants are asked to recall their activity type from a checklist of 59
common activities which are divided into the following groups: sleep/bathing, eating, work,
after-school/spare time/hobbies, transportation, and physical activities/sport. They are also
required to assess the intensity of activity among light, moderate, hard, or very hard. Because
it records three days physical activity, it may provide evidence for researchers to assess
participant's physical activity pattern. It might be an appropriate school-based physical
activity data collection instrument since it can be completed in a short session (30 to 40 min).
A validation study was conducted by Pate et al. (2003) to test the validity of total,
moderate-to-vigorous, and vigorous physical activity estimated from the 3DPAR compared
with the CSA 7164 accelerometer. A total of 70 eighth and ninth females aged from 13 to 16
were recruited from four schools and a soccer team. The CSA results were expressed by
individual days as well as average of 3 and 7 days, respectively. The correlations between
self-reported total METs and CSA total counts were high for both 7days of monitoring
(r=0.51) and for 3 days of monitoring (r=0.46). Correlations between the 3DPAR blocks of
MVPA and CSA minutes of MVPA were 0.35 (p<0.01) for 7 days of monitoring and 0.27
(p<0.05) for 3 days of monitoring. The correlations of VPA were 0.45 (p<0.001) for 7 days of
monitoring and 0.41 (p<0.001) for 3 days of monitoring. The range of correlations between
total MET from 3DPAR and total counts from CSA was from 0.29 (p<0.05) on Monday to
0.64 (p<0.001) on Tuesday. The estimated levels of MVPA and VPA minutes from the two
instruments were significantly correlated on Sunday, Monday and Tuesday. The 3DPAR
yielded valid estimates and was sensitive in assessing vigorous, moderate to vigorous (and

20
overall) physical activity in this sample of eighth and ninth grade girls. The researchers also
compared the correlation between 3DPAR and accelerometer with two previous studies using
PDPAR. Validity correlation in the 3DPAR study was somewhat higher than some previous
PDPAR studies (McMurray, 1998; Sallis et al., 1996; Trost et al., 1999; Weston et al., 1997).
The present 3DPAR study also yielded comparable or slightly stronger validity evidence than
other similar study: 3-day sweat recall (Janz et al., 2008) 3-day aerobic recall (Janz, Witt, &
Mahoney, 1995) and some other 7-day recalls (Sallis, Buono, Roby, Micale, & Nelson, 1993)
which also used accelerometer as comparison. However, there were some weaknesses of this
study. One is the limited diversity of the sample and also the fact that only eighth and ninth
grade girls participated in the study. Another limitation is that only a single criterion (an
accelerometer) was used as comparison.
ACTIVITYGRAM
The ACTIVITYGRAM assessment is a computerized physical activity self-report
instrument which is a part of the FITNESSGRAM software program developed by the
Cooper Institute. It is conceptually derived from another valid self-report instrument known
as the Previous Day Physical Activity Recall (PDPAR). ACTIVITYGRAM adopts a
comparable time-based grid structure (every 30 minutes) and uses four similar categories of
intensity (rest, light, medium and hard) while introducing its own unique characteristics. It
provides an activity pyramid listing six categories of activity (rest, flexibility, muscular
activity, aerobic sports, aerobic activity and lifestyle), among which the students can choose
one specific activity from five representative ones. Another difference between the PDPAR

21
and the ACTIVITYGRAM is that the ACTIVITYGRAM allows users to indicate whether the
activity was done "some of the time" or "all of the time". The ACTIVITYGRAM is also
designed to assess the whole day (7:00 am to 11:00 pm) while the PDPAR is focused only on
the time after school.
Welk et al. (2004) performed a convergent and criterion validation study of both the
ACTIVITYGRAM and the PDPAR. Data were collected on elementary students from 2
schools on 3 consecutive days using the ACTIVITYGRAM, PDPAR and the Biotrainer
monitor. It is notable that two scoring version of PDPAR (PDPAR1 for MET bouts and
PDPAR2 for PA bouts) were used to compare different outcome measures. The results
revealed non-significant differences in the reported number of bouts between the two
instruments which provided evidence for the convergent validity of ACTIVITYGRAM. The
Biotrainer monitor provided a way to evaluate the relative validity of the two self-report
formats (ACTIVITYGRAM and PDPAR) in this study. Both the ACTIVITYGRAM and
PDPAR had a moderate mean correlation with Biotrainer for the 3 separate days, r=0.50 and
r=0.65, respectively. The discrepancy might be explained by the different recall time for the
two instruments, ACTIVITYGRAM was done by the end of 3 days and PDPAR was finished
at the end of each day. The authors also mentioned the importance of careful administrating
of the ACTIVITYGRAM because of the relatively high variability in correlations between
ACTIVITYGRAM and Biotrainer for two schools (r=.80 vs. R=0.20). In addition,
correlations were computed between the PDPAR and ACTIVITYGRAM to examine their
relationship. The correlations for both schools between the two self-report instruments for

22
three periods (afternoon, evening, and afternoon/evening) were acceptably high (range:
r=0.35 to r=0.43 for PDPAR1 (MET bouts) and from r=0.41 to r=0.53 for PDPAR 2 (PA
bouts)). This finding indicates that the instruments provided similar information about
physical activity patterns. Another specific finding in this study is that correlations were
computed across certain time periods between the two instruments and the Biotrainer. The
afternoon period showed a higher correlation than evening for all 3 days. Data distribution,
process and variability might be the reasons to explain the consistent correlation variability in
different recall periods. Overall, this study provided convergent and criterion evidence for the
validity of using ACTIVITYGRAM to assess children's physical activity patterns.
The ACTIVITYGRAM provides some significant advantages for school based
assessments. The computerized version self-report instrument offers convenience on data
collection since the data is entered into the software and does not require manual data entry.
The ACTIVITYGRAM also provides built in feedback (on screen and with printed reports)
to enable teachers to help teach children (and parents) about appropriate levels of physical
activity. A disadvantage of the ACTIVITYGRAM format is that it requires 20-30 minutes to
complete and some preparation time to teach children how to complete it. Another
disadvantage is that some younger students might have trouble in accurately recalling the
characteristic of their physical activity in certain time frame.
Summary of Self-Report Instruments
Self-report instruments provide good utility for large-scale research applications and
for use in school-based or population surveillance. However, additional research is needed to
23
address some of the fundamental measurement challenges. One innovative approach is to
develop calibration equations that can equate or link self-report data to objective estimates of
physical activity. Tucker et al. (2011) conducted a study to develop and validate a prediction
equation for the PDPAR. A total of 121 participants wore a Biotrainer (objective measure)
and completed the PDPAR for 3 consecutive days (subjective measure). The goal of the study
was to develop a calibration that could be used to estimate minutes of physical activity for
each 30-min time block coded as ≥ 4 METS. Calibration sample data (n=91) were used to
develop the regression model. Multi-terms and combinations of models were tested to ensure
an accurate equation. Predictors included PDPAR (blocks/day), PDPAR2, BMI, gender,
gender×PDPAR, gender × PDPAR2. 31 participants' data were used to evaluate the validation
of the regression equation. A high correlation (r=0.81) was detected between the Biotrainer
and predicted MVPA min from the validation sample with the new equation. This study
demonstrated the potential of developing and applying a calibration approach to improve the
utility of self-report measures. While the 3DPAR is widely used in research (and is the basis
for the ACTIVITYGRAM assessment) it has proven cumbersome to use in schools. It
necessitates detailed logging over multiple days or sufficient time to complete 3 days of
recall. The present review demonstrated that the PAQ meets established psychometric
characteristics needed to establish validity. It has been widely used in school based research
and may provide a more effective PA screening tool for school-based applications. The PAQ
can be administered in short amounts of time (~5 minutes) and it provides useful insights into
levels of activity at different times or in different settings. These attributes make it well suited

24
for use in schools where education is the key goal.
Preliminary calibration research has been done by our research group to improve the
utility of the PAQ but additional research is needed to test the overall utility of the PAQ.
Detailed descriptive analyses of large samples of youth are needed to more completely
evaluate age and gender patterns in physical activity. The reported estimates of activity from
the PAQ also need to be cross validated with other indicators to provide further convergent
validity. A review of activity patterns is provided in the subsequent section.
Epidemiology of Physical Activity Levels in Children and Adolescents
There are several general conclusions from epidemiology studies of physical activity
in young people. The clear and well documented one is an age-related decline in PA in both
boys and girls (Caspersen, Pereira, & Curran, 2000; Jago, Andersen, Baranowski, & Watson,
2005; Nader, 1999; Sallis, 1993; Telama & Yang, 2000; Thompson, Baxter-Jones, Mirwald,
& Bailey, 2003), especially during the adolescent years. Both cross-sectional and longitudinal
studies have shown similar results – regardless of whether assessed with objective
approaches such as accelerometer or with subjective method such as self-report assessment.
For example, a longitudinal study with a short self-report questionnaire was conducted in
Finland and the results showed a remarkable decline in frequency of physical activity and
sport participation when both boys and girls at the age of 12 (Telama & Yang, 2000).
Additionally, Mechelen et al (2000) completed a longitudinal study to describe the natural
development of habitual physical activity behavior of young Dutch male and female subjects
between the age of 13 and 27. The data showed a significant decrease in habitual physical

25
activity over a 15-yr period of time for both male and female subjects, especially the time
spent on vigorous activities. Similarly, the data from 1992 National Health Interview Survey-
Youth Risk Behavior Survey, of 10,645 male and female subjects ages 12-21 yr documented
the physical activity patterns among those adolescents generally eroded most from age 15
through 18 and the “regular, vigorous activity” and muscular strength decreased from age 12
through 21 (Caspersen et al., 2000). Other studies have reported similar results, such as the a
3-yr follow-up study of Child and Adolescent Trial for Cardiovascular Health (CATCH)
(Nader, 1999) and a detailed study using objective measures of activity in a population-based
sample of public school students in grade 1 through 12 (Trost et al., 2002). The numerous
studies have confirmed that physical activity levels decline considerably with age in both
boys and girls. The decline of physical activity levels during the adolescence period is a
major concern since this is a critical period of development with large changes in physical,
psychosocial, cognitive, and emotional development. These changes have led to the strong
public health interest in promoting physical activity in this age group (Caspersen et al.,
2000).
Another significant and well established finding about the epidemiology of physical
activity is that the boys tend to be more active than girls at a given age. For example, in a
review article, Sallis compared nine studies in 1980s and early 1990s to evaluate physical
activity patterns in children and adolescents. Despite the use of different PA measures
(various self-report and objective tools), the same overall patterns were found. Males were
more active than females, although the difference was greater with objective measures.

26
Specifically, males appeared to be around 15 to 25% more physically active than females
between the age of 6 and 17 (Sallis, 1993). A study using objective monitors in 81 8th
grade
students provides a more detailed review of activity levels. The data has shown that boys
spend more time engaging in TV/electronics and sports, while girls spend more time in
personal care. Except on Sunday, consistent gender differences were found in activity levels
even though boys spend more time on TV/electronics (Jago et al., 2005). Lastly, both self-
report and accelerometer studies indicated that boys and girls did not differ remarkably with
respect to daily participation in moderate physical activity and the majority of the gender gap
in overall physical activity was accounted for girls’ low participation in vigorous physical
activity (Trost et al., 2002). The results from the 1992 Youth Risk Behavior Survey showed
that boys participated in 5.4% more regular, sustained activity than girls; for regular,
vigorous activity, the variation by activity pattern is + 11.3% and for strengthening activity,
the number is +18.2% (Caspersen et al., 2000). Trost et al. (2002) used objective monitors to
provide additional and perhaps more accurate views of physical activity patterns. The boys
participated in only 11% more MVPA than girls but the gender differences for daily VPA was
substantial at about 45%.
A number of other studies have examined the influences of physical maturity
differences on observed gender gap in objectively measured PA in children (Sherar, Esliger,
Baxter-Jones, & Tremblay, 2007; Thompson et al., 2003). For example, Thompson and
colleagues (2003) conducted a study to demonstrate that the gender differences in PA
disappeared when physical maturity was controlled. On average, girls mature approximately

27
2 yr earlier than boys. Other studies using objectively measured PA have also reached the
same conclusion. The data from an accelerometer measured study (Sherar et al., 2007) of 194
boys and 207 girls who ages 8-13 yr documented significantly decreased levels of PA with
increasing chronological age in both boys and girls. However, when aligned on biological
age, PA still declined with increasing maturity but gender differences between biological age
groups disappeared. These studies highlight the importance of maturation in evaluating
activity patterns. The different patterns and preferences suggest that interventions should be
gender specific (Cumming, 2008; Davison, 2007; Niven, Fawkner, Knowles, & Stephenson,
2007). Interventions may also need to target girls at an earlier chronological age than boys,
considering girls mature around 2 years before boys, on average. Also, boys and girls in
adolescent’s period prefer different activities with various reasons, and may face dissimilar
barriers (Vu, Murrie, Gonzalez, & Jobe, 2006).
28
Chapter Ⅲ: METHODS
The study was part of the NFL PLAY 60 FITNESSGRAM Partnership project with
the Cooper Institute. One goal of the project was to help schools make effective use of the
FITNESSGRAM software and help the students be more fit and active. Each of the 32 NFL
franchises was provided with 35 FITNESSGRAM site licenses to distribute to local schools
in their area. Once identified, the participating schools were provided with training on how to
collect fitness data and how to use the software to track and monitor fitness data. The
participating schools were asked to submit fitness testing scores every semester. In Spring of
2012, fitness data were compiled from over 5339 youth.
A focus of the broader NFL Play 60 initiative is to encourage youth to be physically
active at least 60 minutes per day. To provide insight about physical activity, a subsample of
participating schools was invited to complete the recently developed Youth Activity Profile
(YAP). The schools were provided with a customized login for the YAP along with cards,
flyers and communications to help promote effective use of the tool in their school.
Additional information including frequently asked questions for NFL PLAY 60
FITNESSGRAM site leaders, teachers and parents were posted on the NFL PLAY 60
FITNESSGRAM website http://www.nflplay60fitnessgram.com/youhactivityprofile.cfm.
The university Institutional Review Board (IRB) status classified this research as
exempt from human subjects review since the data contained no personal identifiers and were
obtained through previously-established agreements.

29
Instruments
Physical Activity Assessment
Physical activity was assessed with the Youth Activity Profile (YAP). The YAP is an
online physical activity assessment tool that was designed to assess children and adolescent’s
PA and sedentary habits both in school and at home. After logging in to the webpage,
students were asked to type in a participation code, which was assigned as the NFL franchise
mascot name such as BEARS, REDSKINS and so forth. Students were able to select their
school by clicking their school name in a dropdown list. They were asked to provide some
basic information about their gender, school level (elementary, middle or high school), and
grade (from 3rd
to 12th
). Before they moved forward to the actual questions, they were
provided with information and descriptions explaining differences between types and
intensities of physical activities and sedentary activities. The YAP is made up of 15 total
items each scored on a 5-point scale. The first five items assess physical activity at school by
asking about behavior in different school time periods (transportation to school, PE, recess,
lunch and transportation back from school). Questions included items such as “During lunch
break, how often were you moving around, walking or playing?” The next five questions
asked about physical activity levels at home. Three questions asked how many days they
were active before school, after school, and weeknights. Answers were chosen from 0 days at
the minimal and 4 to 5 days at the most. Two additional questions asked more specifically
about the length of time they spend on physical activity on Saturday and Sunday. The last
five items asked about time spent in different sedentary behaviors (TV time, video games,

30
computer time, Phone/Text time and overall).
Separate behavioral indices were computed from the three subscales of the YAP. The
three indices are Physical Activity at School Index (PASI), Physical Activity at Home Index
(PAHI), and Sedentary Behavior Index (SBI). The score for each index was calculated by
averaging the responses from the five equally weighted items in each category. A higher
overall activity score is reflective of a higher level of physical activity (or a greater amount of
sedentary behavior in the case of the SBI). At the end of the online survey, the students were
able to access the summary report and view their score in each of the three activity
components.
The YAP has not been previously used in youth activity research but studies have
demonstrated that similar items from the PAQ provide a valid assessment of physical activity
in youth (Crocker, 1997; Janz et al., 2008). Past research tested the reliability of PAQ-C and
results suggested acceptable test-retest reliability for both males (r=0.75) and females
(r=0.82)(Crocker, 1997). The study also supported concurrent validity against objective
measurement tools (accelerometry-based activity monitor). The PAQ score was shown to be
moderately correlated with both total PA and percent of minutes spent in MVPA (r= 0.56 and
0.63, respectively). The YAP is conceptually similar to the PAQ as it captures the same basic
periods captured in the PAQ and uses a similar 5 point scale. Therefore, similar validity is
expected.
Physical Fitness Assessment

31
Physical fitness was assessed with established items from the FITNESSGRAM
health-related fitness battery with a subsample. It includes a variety of field-based
assessments in three main areas of health-related fitness: aerobic capacity, body composition,
and muscular strength, endurance and flexibility. The battery provides several assessment
choices in each area but in the present study only items assessing aerobic capacity and body
composition were included since researchers have established more robust links between
health risk factor with these two dimensions of fitness. Besides, they satisfy the public health
interest (Welk, 2011). For aerobic capacity, teachers chose from the PACER test, one-mile
run/walk and walk test (ages 13 or older) to assess aerobic capacity. Two options are
available for body composition assessment. One is percent body fat (calculated from triceps
and calf skin folds or entered from an alternative measuring device- bioelectrical impedance
analysis) and the other is body mass index (calculated from height and weight). Different test
methods for aerobic capacity and body composition are equivalent tests.
Procedures
Due to the distributed nature of the project, communication with the schools was
primarily through emails and phone calls. A series of emails were sent out to provide
suggestions on how to effectively and accurately collect fitness testing data. Various
resources were also offered to sites, such as free webinars, online course, videos, CDs,
manuals. The program was launched in Fall 2010 and fitness data have been compiled
through the FITNESSGRAM software each semester since then. In Spring 2012, the YAP
was introduced to sites that had successfully completed and reported the spring fitness

32
testing. Schools were provided with general information about the YAP and access to the
website of YAP that provided specific information. The sites were also provided with
suggestions for how the YAP could be used to collect data in school settings. Site-specific
flyers and instruction cards were prepared for each site to give teacher flexibility in how to
administer and use the YAP in their school. The survey asked respondents to provide their
school, grade and gender but no personal identifiers were obtained.
Data Processing
One of the unique features of the YAP website is that it provides easy access to the
survey results to facilitate analyses. No additional manual entry data is needed since all the
data were saved and could be exported into a CSV file. In addition to the individual items,
the tool also computes averages for each of the three outcome measures (PASI, PAHI and
SBI). Variables including gender, school name, school type, and grade were also recorded.
The fitness data were processed and exported using the FITNESSGRAM 9.0 software. The
export procedure provided individual (de-identified) data along with information about
school, grade and gender. For the second purpose, due to the anonymous attribute of YAP it
was not possible to match the physical activity data with the physical fitness data
individually. Data from PA and fitness were then merged and averaged by school by grade
and by gender to create a composite dataset.
Data Analyses
Primary analyses were focused on descriptive comparisons of physical activity and

33
sedentary levels by grade and gender. Separate descriptive statistics were computed for each
of the YAP subscales and the two main fitness assessments (aerobic VO2 max and BMI) by
school, gender and grade. Gender and grade differences were computed using percent change
scores to facilitate interpretation. Gender differences were computed as follows: [(boys’
scores - girls’ scores) / girls’ scores]. Grade differences were computed as follows: [(higher
grade scores – lower grade scores) / lower grade scores]. Three two-way (grade x gender)
mixed model analyses of variance was used to examine the differences in different YAP
indices. School was included as a random factor to control for any clustering of physical
activity within each school. Separate analyses were performed for each of the three indices
(PASI PAHI and SBI). Cohen’s d effect sizes were reported to indicate the magnitude of the
differences in PASI, PAHI and SBI between boys and girls (small ES= 0.1, moderate
ES=0.25, and large ES=0.50 for social sciences). The least square means procedure was used
to detect significant subgroup differences. Partial pearson correlations were computed
between the three matched YAP indices and the key FITNESSGRAM outcomes (aerobic
capacity and body composition). Partial correlations were used to control for any effect due
to school level clustering.

34
Chapter Ⅳ: RESULTS
Summary of Participation Rates Distribution
A total of 3415 participants (1726 males, 1689 females) completed the online YAP
from late April to middle June. The participants were from 31 schools recruited by 14
franchises enrolled in the FITNESSGRAM NFL PLAY60 Partnership project. Participation
rates were computed by gender, grade, school and franchise (See Table1). Due to the limited
sample sizes in certain grades, the analyses were restricted to a sample of 3165 participants in
grades 5 to 8 (1600 boys, 1565 girls). The sections below report on the three separate
sections of the YAP.
Evaluation of Physical Activity Level at School
A mixed model ANOVA was conducted to test for mean differences in PASI
construct. The interaction effect was not statistically significant [F (3, 3122) = 1.26, p
=0.2858]. The main effect was significant for gender (F = 66.20, p <0.0001) and grade (F =
4.4, p<0.01). The mean differences between measures of PASI are graphed in Figure 1. The
gender difference ranged from 4.5% in grade 5 to 12.9% in grade 8. The average gender
difference for PASI was 9.8%. For both boys and girls, PASI values in grade 6 and grade 8
were significantly lower than previous grade level. Among boys, the average grade difference
(relative to the previous grade level) for PASI was 5.4%, with the largest difference (9.3%)
detected between grade 7 and 8. Among girls, the average grade difference for PASI was
7.6%, with the largest difference (13.0%) detected between grade 5 and 6. The Cohen’s d
effect size for PASI between boys and girls was 0.24.

35
To further assess the gender and grade PA difference at school, descriptive statistics
representing means, standard deviation and 95% confidence intervals were computed for the
five individual questions (Q1 to Q5). The statistics by gender and grade level are displayed
in Table 2. With the exception of girls at 5th
grade, both boys and girls adopted more active
transportation (walk or bike) on the way home from school compared to going to school,
even though the scores were relatively low for both items (Q1 and Q5). The PE class was the
most active period during school time since the scores ranged from 3.75 to 4.22. Recess was
the period that showed the biggest age differences but this is largely because middle school
youth do not have recess. In the lunch time period, with the exception of grade 5, boys were
more active than girls. Both genders tended to be less active at higher grades.
Evaluation of Physical Activity Level at Home
A similar mixed model ANOVA was conducted to test for mean differences in PAHI
estimates. The interaction effect was statistically significant [F (3, 3120) = 5.85, p <0.01].
The main effect was also significant for gender (F = 31.41, p <0.0001) and grade (F = 8.28,
p<0.0001). The mean differences between measures of PAHI are graphed in Figure 2. For
PAHI, the mean values of girls tended to be lower in older students. In contrast, the mean
values of boys tended to be fairly consistent across grade. The 7th and 8th grade boys
exhibited significantly higher physical activity levels than same aged girls. The gender
difference ranged from 0.6% in grade 6 to 12.3% in grade 8 (average = 6.8%). Among boys,
the average grade difference for PAHI was only 0.8%, with the largest difference (4.0%)
detected between grade 5 and 6. Among girls, the average grade difference for PAHI was

36
3.3%, with the largest difference (5.6%) detected between grade 6 and 7. The Cohen’s d
effect size for PAHI between boys and girls was 0.15.
Detailed descriptive statistics for individual items (Q6-Q10) in this home component
of the YAP are shown in Table 3 by gender and grade level. The activity level before school
(6:00am to 8:00am) was the least active period while the activity level after school (between
3:00 to 6:00) was the most active period. The scores for the after school period ranged from
4.08 to 4.28 for boys and from 3.92 to 4.26 for girls. Weeknights were another active period
for both genders with values ranging from 3.67 to 3.84 for boys and from 3.42 to 3.69 for
girls. Interestingly, there were not many differences across the grades. Both genders have
higher scores on Saturday than Sunday.
Evaluation of Sedentary Behavior
A similar mixed model ANOVA was done to examine grade and gender differences in
the SBI. The grade by gender interaction effect was not statistically significant [F (3, 3108) =
1.4, p =0.3755]. A significant main effect was evident for grade (F = 13.39, p <0.0001) but
not gender (F = 0.05, p=0.8238). The mean differences between measures of SBI are graphed
in Figure 3. For SBI, mean values tended to be higher for older boys and girls. Among boys,
the average grade difference was 5.1 %, with the largest difference (8.4%) detected between
grade 7 and 8. Among girls, the average grade difference was 4 %, with the largest difference
(6.4%) detected between grade 7 and 8. Both boys and girls in grade 8 had significantly
higher values for SBI than gender-matched peers in grade 7. As mentioned, the gender main
effect was non-significant but boys tended to have slightly lower mean values except for

37
grade 8. The gender difference ranged from -2.4% in grade 5 to 0.7% in grade 5 (with an
average of -0.5%). The Cohen’s d effect size for PASI between boys and girls was 0.13.
Detailed descriptive statistics for individual items (Q11-Q15) in this SBI component
of the YAP are shown in Table 4.There were no significant difference across grades for both
boys and girls for any of the items. Significant gender differences (p<0.05) in video,
computer and phone/text time were observed from 5th
grade to 8th
grade. Boys spent more
time in video time, whereas girls spent more time engaged in computer and phone/text.
Correlation between Physical Activity and Physical Fitness
The means and standard deviation of height, weight, BMI and aerobic capacity by
gender and grade were displayed in Table 5. To investigate relationships between physical
activity and physical fitness, it was necessary to aggregate the data by school, grade and
gender. The outcome response for each gender, at each grade from one school served as one
aggregated mean data unit. The means and standard deviations for the key outcome measures
(PASI, PAHI, SBI, aerobic capacity and BMI) are displayed in table 6. A total of 77 mean
units were matched between YAP and aerobic capacity and 87 mean units for YAP and BMI.
The correlations between physical activity and fitness measurements are displayed in Table 7.
The PAHI had a significant, positive correlation with aerobic capacity (r=0.42, P<0.01) and a
significant negative correlation with BMI (r=-0.34, P<0.05). The SBI had a significant
negative correlation with aerobic capacity (r=-0.29, P<0.05) and a significant positive
correlation with BMI (r=0.66, P<0.01). No statistically significant relations were found
among PASI with both aerobic capacity (r=0.16) and BMI (r=-0.06).
38
Chapter Ⅴ: DISCUSSION
In this cross-sectional study of adolescents in 5th
grade to 8th
grade, we found that
boys engaged in more PA than girls did in both school and after school across different
grades. The gender disparity in PA levels was greater in the PASI than PAHI. We also
observed a decline in PA level from 5th
grade to 8th
grade for both genders at school. At
home, boys at all four grades maintained relatively stable PA levels, whereas their female
counterparts decreased their PA levels since 7th
grade.
One of the unique aspects of this study was that it piloted the use of the YAP in a
large sample of schools. This easily administered and understood survey carry minimal
burden for students to complete as well as teachers to administer. With access to internet,
students can finish it in 15 to 30 minutes depending on the cognitive ability in various ages.
The ability to export data in CSV format saved time and made it easily to manage the data. It
is also more environmentally friendly since no paper is used which is also saved the money
for schools. Accelerometers are viewed as feasible alternatives to self-report in moderately
sized population-level surveillance (Trost et al., 2002), but the YAP has great potential to
facilitate evaluation in large school tracking studies or population-level surveillance studies.
Our finding that boys were more active than their female counterparts is consistent
with previous research results. Andre ̀ (Teixeira e Seabra et al., 2008) reported significant
gender differences across a range of ages (from age 10 to 18) in three different indices
(physical activity index, sport index, and leisure time index) using a questionnaire. Boys had
higher scores than girls in all four indices including work/school index besides the three

39
listed above. Though different questionnaires and analytic approaches were used in the
present study, similar gender differences patterns were observed. Various studies reported at
different ages that girls have been found to have lower physical activity levels. One the major
reason caused the gender difference is that girls have an early rapid PA decline than boys.
Some researchers have claimed that the gender difference starts from early adolescence at
age 10 (Teixeira e Seabra et al., 2008), while other studies report gender differences showing
up from ages 12 through 16 (Caspersen et al., 2000). In our study, the gender differences
were observed as early as in 5th
grade.
The actual age where gender differences begin is not consistently reported so factors
contributing to the inconsistent results need to be explored. Mechelen et al. (2000) have
studied the sports preferences in the cohort of Amsterdam longitudinal growth and health
study. They concluded that boys tended to select very vigorous intensity team sports, whereas
girls had a preference for moderate and vigorous intensity individual sport and expressive
forms sport like dance and gymnastics. Similarly, School Physical Activity and Nutrition
Questionnaire illustrated girls’ higher participation in organized physical activity and lessons,
such as martial arts, dance, gymnastics and tennis than boys (Springer, Hoelscher, Castrucci,
Perez, & Kelder, 2009). Megan and colleagues found that boys participated in more free-time
PA while girls were more likely to participate in organized PA (Wall, Carlson, Stein, Lee, &
Fulton, 2011). We found a similar pattern in our study, as significant gender differences were
exhibited during recess (Q3) and lunch time (Q4) in all grades except for 5th grade in lunch
time (See Table 2). Boys had a higher PA levels also in PE class (Q2), transportation to

40
school (Q1), before school (Q6), weeknights (Q8), Saturday (Q9) and Sunday (Q10). There
are no specific questions investigating the choice for activity among genders so we do not
have information of gender preferences in PA. Further research is needed to investigate the
sex differences in choice for type and intensity for PA.
Interestingly, no gender differences were observed across grades in the sedentary
behavior index (SBI). However, noticeable results are found in some specific subcategories
questions. For questions based on time spent on video game, computer time, and phone/text
(Q12, Q13 and Q14), there were statistically significant gender differences across four grades
(the only exception was for 7th grade youth on computer time – Q13). Boys spent more time
than girls on video game (gender differences were from 35.6% to 68.8% across 5th
to 8th
grade) (Q12). Girls, on the other hand, spent more time on phone/text (Q14) than boys
(gender differences were from 18.7% to 28.7% across 5th
to 8th
grade). Girls also reported
more computer time (Q13) with gender differences ranging from 7.5% to 13.3% across 5th
to
8th
grade. These disparate effects tended to cancel out and cause the overall gender difference
to be non-significant when averaged together. These findings are in accordance with other
research results. For example, Vandewater et al. (2004), found that boys at age 9-12 spent
56.91 minutes per day on video games compared with their counterpart girls who spent only
17.65 minutes per day. Similarly, Mathers et al. (2009), who studied a sample of 925
adolescents (ages from 13.6 to 19.4 years old) using recalled diary data, reported that boys
spent 50.5 minutes on video games and girls spent 19.8 per day, respectively. They also
reported girls spent 18.1 minutes and boys spent 8.8 minutes on telephone use. The question
41
as to why boys and girls differ in their sedentary behavior patterns was not explained and it
was not examined in this study either. However, the disparity of sedentary patterns provides
public health researcher with valuable insights about how to target these differences in media
usage to reduce sedentary behavior. For example, a study conducted by Maddison et al.
(2007) evaluated energy expended when playing video console games. They reported that
children expended moderate to high energy when they were playing the new generation of
active electronic games. Maloney et al. (2008) also found that the active video games
facilitate slight increases in vigorous PA and decreases in sedentary screen time. Except for
active video, phone/text can also be used as a PA promotion tool. Like active video games,
there is potential to use mobile phones for PA promotion. The public health field has already
started to use mobile phone in monitoring /tracking PA changes (Mathers et al., 2009) as well
as PA promotion intervention delivery (Hurling, 2007; Mehta, 2011; Wei, Hollin, &
Kachnowski, 2011). Moreover, mobile phones can used as the PA measurement tool
(Bexelius, 2011). In addition, numerous smart phone platforms have an integrated
accelerometer which could enable them to measure PA objectively (Chinmay, Shelly, Yuichi,
Loannis, & James, 2010). Activity recognition using a mobile phone with an integrated
accelerometer has also been studied by researchers (Choudhury, 2008). With the information
we obtained from the YAP, the active electronic games can be more effectively used among
boys to reduce their sedentary time. On the other hand, phone/text could be adopted among
girls either to monitor their PA or help them to promote health and wellness.
There was evidence of declining PA with increasing age for PASI at grade 6 and grade

42
8 for both genders, statistically significant difference is only observed between grades 7 with
8 for both genders. For PAHI, there is no apparent decline pattern as statistically difference is
only observed between grades 7 with 8. Girls’ PAHI scores dropped from grade 7 and
statistically significant differences are detected between 6th
grade with 7th
grade, and 7th
with
8th
, respectively. When trying to explain the difference in PA patterns, it is important to
consider the specific items included in each subcategory. The biggest contributor to the
decline in PASI is the decline in PA levels during recess. Significant differences from
previous grade group (e.g., 5th
grade compared with 6th
grade) are observed in all grades for
both genders except for 7th
and 8th
grade boys. Other than the large decreases in recess, no
significant difference are shown in other questions, such as active transportation to school
and back home, PE class and lunch time. Within elementary school, recess has been
identified as a period that could be targeted to help youth to be more active (Erwin et al.,
2012; Ridgers, Stratton, Fairclough, & Twisk, 2007; Stratton, 2000). In Ridgers’ review of
children’s PA levels during school playtime, they found that the contribution of recess to
daily recommended moderate and vigorous PA (MVPA) ranges from 4.7% to 40% for boys
and 4.5–30.7% for girls (Ridgers, Stratton, & Fairclough, 2006). In the present study,
significant gender differences during recess were found across all four grades, consistent with
numerous studies indicating that boys participated in more MVPA during recess than girls
(McKenzie, 1997; Sarkin, 1997; Verstraete, Cardon, De Clercq, & De Bourdeaudhuij, 2006;
Zask, van Beurden, Barnett, Brooks, & Dietrich, 2001). A decline in PA during recess across
5th
to 8th
grade was also found in our study. McKenzie et al. (1997) reported higher PA
43
participation among elementary students than preschoolers. Additional investigations are
needed to track the PA levels changes during recess with increasing age.
However, researchers have noticed the tremendous potential of using recess to
promote PA (Scruggs, Beveridge, & Watson, 2003; Stratton, 2000). In Stratton’s intervention
(2000) that applied playground markings to promote PA during recess, 4-11 years old
students on average increased 18 minutes a day in MVPA. His study also showed 36.7% to
50.3% increase in MVPA among experiment group with playground markings strategy
(Stratton, 2000). Additionally, fitness breaks with a 400m obstacle course is also indicated to
be an effective PA promotion strategy during recess (Scruggs et al., 2003). Due to the
dramatic decline in PA during recess, interventions that target on increasing PA levels among
early adolescence during recess might be helpful to counter the overall MVPA decrease.
The age at which PA decline starts varies from study to study. Some researchers have
claimed that the greatest decline takes place during adolescence (van Mechelen et al., 2000),
but other researchers report greater declines after age 16 (Teixeira e Seabra et al., 2008).
Caspersen (2000) concluded that PA generally eroded most from ages 15 through 18. With
objective measurements, Trost et al. (2002) observed the largest differences occurring
roughly in late elementary school. Inconsistent results might due to the different
measurement (objective vs. subjective), as well as the data aggregation of boys and girls. A
recent review by Samuel et al. concluded that the decline of PA during adolescence is a
consistent finding in 26 studies assessed PA with questionnaire (Dumith, 2011). Though early
or late adolescence tends to be the period with the greatest decline it hasn't been accurately

44
clarified yet. The consistent decline supports the importance of this age period for behavioral
interventions. Without a reasonable sample size for each grade, it is impossible to accurately
characterize the changes in the whole adolescent period in our study.
The secondary aim of his study was to test the correlation between physical activity
levels and physical fitness. It is assumed that physical activity should be related to fitness but
genetic factors (Blair, Cheng, & Holder, 2001) and measurement issues have contributed to
generally low correlations between these variables – particularly for children. Previous
studies have reported positive correlations between physical fitness and physical activity and
negative associations between physical activity and BMI (Dencker et al., 2006; Katzmarzyk,
Malina, Song, & Bouchard, 1998; Kimm et al., 2005). However, the magnitude of
correlations in the present study was considerably larger than is typically observed. The high
values in our study might be due to the statistical process we adopted. Instead of computing
the correlation on individual levels, we aggregated the results by grade and gender in each
school first and the correlations were computed with matched means of those variables. It
increased the accuracy of capturing real physical fitness and physical activity levels. In
addition, it is interesting to notice that aerobic capacity and BMI were significantly correlated
with physical activity levels at home and sedentary behavior patterns in our study, but not
with activity levels at school. The reason is probably due to the variation of activity levels at
different settings. At school, the PE classes and recess are scheduled and students do not have
many additional choices to be more active. However, children could either spend time on
various after-school physical activity programs or choose being sedentary at home. Variations

45
of after school physical activity and sedentary behavior might have contributed to the
significant correlation among activity (sedentary) with fitness and BMI.
There are several limitations that should be considered when interpreting the results
of the study. First, the YAP has not been directly validated. The YAP was developed based on
the frame of the established PAQ-A (or PAQ-C), but several changes have been made.
Studies evaluating the validity and reliability of the YAP are currently in process in our lab
but data are not available at present. Second, similar to other questionnaires, the results of the
YAP are difficult to interpret. The 1 to 5 scales is not meaningful for public health
applications where variables such as duration, frequency, intensity and type of PA are needed.
The inherent differences in the various subjective instruments also make it difficult to
compare findings with other research results. However, we were at least able to compute the
percentage changes by different genders and grades. A calibration study on the YAP is
currently underway in our lab and this will help to increase the utility of the tool. With a
validated regression equation, weekly PA and sedentary minutes can be estimated based on
students’ responses. By converting the PASI and the PAHI into estimated minutes of MVPA
it will make it possible to compare PA levels with established U.S. physical activity
guidelines for physical activity. Whether children and adolescents accumulate 60 minutes or
more of physical activity daily as recommended by guidelines could be determined. Third,
our study only covered four grades (5th
to 8th
) using a cross-sectional design, which may not
give us as powerful analysis as longitudinal data. However, the program is still going on and
we are hoping to obtain YAP data on a larger and more representative sample in a future

46
follow-up evaluation. The easy manageable database enables us to track the PA and sedentary
pattern longitudinally by schools. Lastly, a final limitation is that there was little control over
how the instrument was administered. Instructions were provided to the teachers but it is
possible that there could be bias introduced depending on how the instrument was described
or interpreted by the children. The potential differences due to method of administration
require further study.
In conclusion, the findings from this study suggest that the YAP provides consistent PA
levels among 5th
grade to 8th
grade children and adolescents with previous studies. The YAP
is able to capture the gender discrepancy at different settings and periods as well as the trend
of declining PA levels with increasing age. The relatively high correlation between physical
fitness and physical activity support the validity of the YAP and support the potential
incorporation of combined physical activity assessment and physical fitness testing in the PE
curriculum. The web-based features and easily data management provide YAP promising
usage in a large scale population and longitudinal surveillance study.

47
REFERENCES Armstrong, N. (2006). The physical activity patterns of European youth with reference to methods of
assessment. Sports medicine, 36(12), 1067-1086.
Bexelius, C. (2011). Estimation of Physical Activity Levels Using Cell Phone Questionnaires: A Comparison
With Accelerometry for Evaluation of Between-Subject and Within-Subject Variations. Journal of
medical internet research, 13(3), e70.
Blair, S. N., Cheng, Y., & Holder, J. S. (2001). Is physical activity or physical fitness more important in defining
health benefits? Medicine and science in sports and exercise, 33(6), S379-S399.
Cale, L., Harris, J., & Chen, M.H. (2007). More than 10 years after "the horse is dead . . .": surely it must be
time to "Dismount"?! Pediatric exercise science, 19(2), 115-123.
Caspersen, C. J., Pereira, M. A., & Curran, K. M. (2000). Changes in physical activity patterns in the United
States, by sex and cross-sectional age. Medicine and science in sports and exercise, 32(9), 1601-1609.
Chinmay, M., Shelly, M. C., Yuichi, F., Loannis, P., & James, L. (2010). Laboratory evaluation of the accuracy
of a triaxial accelerometer embedded into a cell phone platform for measuring physical activity. . The
Journal of the Federation of American Societies for Experimental Biology, 24 , 1044-1045.
Choudhury, T. (2008). The mobile sensing platform: An embedded activity recognition system. IEEE Pervasive
Computing, 7(2), 32-41.
Corbin, C. B. (2002). Physical Activity for Everyone: What Every Physical Educator Should Know about
Promoting Lifelong Physical Activity. Journal of teaching in physical education, 21(2), 128-144.
Corbin, C. B., Pangrazi, R. P., & Welk, G. J. (1995). A Response to "The Horse is Dead; Let's Dismount.".
Pediatric exercise science, 7(4), 347-351.
Crocker, P. R. E. (1997). Measuring general levels of physical activity: preliminary evidence for the Physical
Activity Questionnaire for Older Children. Medicine and science in sports and exercise, 29(10), 1344-
1349.
Crouter, S. E. (2003). Validity of 10 electronic pedometers for measuring steps, distance, and energy cost.

48
Medicine and science in sports and exercise, 35(8), 1455-1460.
Cumming, S. P. (2008). Sex differences in exercise behavior during adolescence: is biological maturation a
confounding factor? Journal of adolescent health, 42(5), 480-485.
Davison, K. K. (2007). Why are early maturing girls less active? Links between pubertal development,
psychological well-being, and physical activity among girls at ages 11 and 13. Social science &
medicine, 64(12), 2391-2404.
Dencker, M., Thorsson, O., Karlsson, M. K., Linden, C., Svensson, J., Wollmer, P., & Andersen, L. B. (2006).
Daily physical activity and its relation to aerobic fitness in children aged 8-11 years. European Journal
of Applied Physiology, 96(5), 587-592.
DeVellis, R. F. (2011). Scale development: Theory and applications.
Dumith, S. C. (2011). Physical activity change during adolescence: a systematic review and a pooled analysis.
International Journal of Epidemiology, 40(3), 685-698.
Erwin, H., Abel, M., Beighle, A., Noland, M, Worley, B., & Riggs, R. (2012). The contribut ion of recess to
children's school-day physical activity. Journal of physical activity & health, 9(3), 442-448.
Hurling, R. (2007). Using internet and mobile phone technology to deliver an automated physical activity
program: randomized controlled trial. Journal of medical internet research, 9(2), e7.
Jago, R., Andersen, C. B., Baranowski, T., & Watson, K. (2005). Adolescent Patterns of Physical Activity:
Differences by Gender, Day, and Time of Day. American journal of preventive medicine, 28(5), 447-
452.
Janz, K.F., Lutuchy, E. M., Wenthe, P., & Levy, S. M. (2008). Measuring activity in children and adolescents
using self-report: PAQ-C and PAQ-A. Medicine and science in sports and exercise, 40(4), 767-772.
Janz, K.F., Witt, J. , & Mahoney, L.T. (1995). The stability of children's physical activity as measured by
accelerometry and self-report. Medicine and science in sports and exercise, 27(9), 1326-1332.
Katzmarzyk, P. T., Malina, R. M., Song, T. M., & Bouchard, C. (1998). Physical activity and health -related
fitness in youth: a multivariate analysis. Medicine and science in sports and exercise, 30(5), 709-714.
Kimm, S. Y. S., Glynn, N. W., Obarzanek, E., Kriska, A. M., Daniels, S. R., Barton, B. A., & Liu, K. (2005).

49
Relation between the changes in physical activity and body-mass index during adolescence: a
multicentre longitudinal study. Lancet, 366(9482), 301-307.
Kowalski, K. C., Crocker, P. E., & Donen, R. M. (2004). The Physical Activity Questionnaire for Older
Children (PAQ-C) and Adolescents (PAQ-A) Manual. College of Kinesiology, University of
Saskatchewan.
Maddison, R., Mhurchu, C. N., Jull, A., Jiang, Y., Prapavessis, H., & Rodgers, A. (2007). Energy expended
playing video console games: An opportunity to increase children's physical activity ? Pediatric
exercise science, 19(3), 334-343.
Maloney, A. E. (2008). A pilot of a video game (DDR) to promote physical activity and decrease sedentary
screen time. Obesity research, 16(9), 2074-2080.
Mathers, M., Canterford, L., Olds, T. , Hesketh, K. , Ridley, K. , & Wake, M. (2009). Electronic media use and
adolescent health and well-being: cross-sectional community study. Academic Pediatrics, 9(5), 307-
314.
McKenzie, T. L. (1997). Physical activity levels and prompts in young children at recess: a two -year study of a
bi-ethnic sample. Research Quarterly for Exercise and Sport, 68(3), 195-202.
McMurray, R. G. (1998). Comparison of a computerized physical activity recall with a triaxial motion sensor in
middle-school youth. Medicine and science in sports and exercise, 30(8), 1238.
Mehta, P. (2011). Internet and cell phone based physical activity interventions in adults. Archives of Exercise in
Health and Disease, 2(2), 108-113.
Nader, P. R. (1999). Three-year maintenance of improved diet and physical activity: the CATCH cohort.
Archives of pediatrics & adolescent medicine, 153(7), 695.
Niven, A. G., Fawkner, S. G., Knowles, A. M., & Stephenson, C. (2007). Maturational differences in physical
self- perceptions and the relationship with physical activity in early adolescent girls. Pediatric exercise
science, 19(4), 472-480.
Pate, & Hohn, R. C. (1994). Health and fitness through physical education: Human Kinetics (Champaign, IL).
Pate, Ross, R., Dowda, M., & Trost, S.G. . (2003). Validation of a 3-Day Physical Activity Recall Instrument in

50
Female Youth. . Pediatric exercise science, 15(3), 257-265.
Ridgers, N. D., Stratton, G., & Fairclough, S. J. (2006). Physical activity levels of children during school
playtime. Sports medicine, 36(4), 359-371.
Ridgers, N. D., Stratton, G., Fairclough, S. J., & Twisk, J. W. (2007). Long -term effects of a playground
markings and physical structures on children's recess physical activity levels. Preventive medicine,
44(5), 393-397.
Rowland, T. W. (1995). The horse is dead; let's dismount. Pediatric exercise science, 7, 117-120.
Ruiz, J. R., & Ortega, F. B. (2009). Physical activity and cardiovascular disease risk factors in children and
adolescents. Current cardiovascular risk reports, 3(4), 281-287.
Sallis, J. F. (1993). Epidemiology of physical activity and fitness in children and adolescents. Critical reviews in
food science and nutrition, 33(4-5), 403-408.
Sallis, J. F., Buono, M. J. , Roby, J. J., Micale, F. G. , & Nelson, J. A. (1993). Seven -day recall and other
physical activity self-reports in children and adolescents. Medicine and science in sports and exercise,
25(1), 99-108.
Sallis, J. F., & Saelens, B. E. (2000). Assessment of physical activity by self-report: status, limitations, and
future directions. Research Quarterly for Exercice & Sport, 71(2 Suppl), S1-14.
Sallis, J. F., Strikmiller, P. K., Harsha, D. W., Feldman, H. A., Ehlinger, S., Stone, E. J., . . . Woods, S. (1996).
Validation of interviewer-and self-administered physical activity checklists for fifth grade students.
Medicine and science in sports and exercise, 28(7), 840-851.
Sarkin, J. A. (1997). Gender differences in physical activity during fifth-grade physical education and recess
periods. Journal of teaching in physical education, 17(1), 99.
Scruggs, P. W., Beveridge, S. K., & Watson, D. L. (2003). Increasing children's school time physical activity
using structured fitness breaks. Pediatric exercise science, 15(2), 156-169.
Sherar, L. B., Esliger, D. W., Baxter-Jones, A. D., & Tremblay, M. S. (2007). Age and gender differences in
youth physical activity: does physical maturity matter? Medicine and science in sports and exercise,
39(5), 830-835.

51
Silverman, S., Keating, X. D., & Phillips, S. R. (2008). A Lasting Impression: A Pedagogical Perspective on
Youth Fitness Testing. Measurement in physical education and exercise science, 12 (3), 146-166.
Sirard, J. R., & Pate, R. R. (2001). Physical activity assessment in children and adolescents. Sports medicine,
31(6), 439-454.
Springer, A. E., Hoelscher, D. M., Castrucci, B., Perez, A., & Kelder, S. H. (2009). Prevalence of Physical
Activity and Sedentary Behaviors by Metropolitan Status in 4th-, 8th-, and 11th-Grade Students in
Texas, 2004-2005. Preventing chronic disease, 6(1), A21.
Stratton, G. (2000). Promoting children's physical activity in primary school: an intervention study using
playground markings. Ergonomics in design, 43(10), 1538-1546.
Teixeira e Seabra, A. F., Maia, J. A., Mendonca, D. M., Thomis, M., Caspersen, C. J., & Fulton, J. E. (2008).
Age and sex differences in physical activity of Portuguese adolescents. Medicine and science in sports
and exercise, 40(1), 65-70.
Telama, R., & Yang, X. (2000). Decline of physical activity from youth to young adulthood in Finland.
Medicine and science in sports and exercise, 32(9), 1617-1622.
Thompson, Baxter-Jones, A.D., Mirwald, R.L. , & Bailey, D.A. (2003). Comparison of physical activity in male
and female children: Does maturation matter? Medicine and science in sports and exercise, 35(10),
1684-1690.
Thompson, Obarzanek, E., Franko, D. L., Barton, B. A., Morrison, J., Biro, F. M., . . . Striegel-Moore, R. H.
(2007). Childhood overweight and cardiovascular disease risk factors: the National Heart, Lung, and
Blood Institute Growth and Health Study. The journal of pediatrics, 150(1), 18-25.
Trost, S. G., Pate, R. R., Sallis, J. F., Freedson, P. S., Taylor, W. C., Dowda, M., & Sirard, J. (2002). Age and
gender differences in objectively measured physical activity in youth. Medicine and science in sports
and exercise, 34(2), 350-355.
Trost, S. G., Ward, D. S., McGraw, B., & Pate, R. R. (1999). Validity of the Previous Day Physical Activity
Recall (PDPAR) in fifth-grade children. Pediatric exercise science, 11(4), 341-348.
Tucker, J. M., Welk, G. J., Nusser, S. M., Beyler, N. K., & Dzewaltowski, D. (2011). Estimating minutes of

52
physical activity from the previous day physical activity recall: validation of a prediction equation.
Journal of physical activity & health, 8(1), 71-78.
van Mechelen, W., Twisk, J. W. R., Post, G. B., Snel, J., & Kemper, H. C. G. (2000). Physical activity of young
people: the Amsterdam Longitudinal Growth and Health Study. Medicine and science in sports and
exercise, 32(9), 1610-1616.
Vandewater, E. A., Shim, M., & Caplovitz, A.G. (2004). Linking obesity and activity level with children's
television and video game use. Journal of adolescence, 27(1), 71-85.
Verstraete, S. J. M., Cardon, G. M., De Clercq, D. L. R., & De Bourdeaudhuij, I. M. M. (2006). Increasing
children's physical activity levels during recess periods in elementary schools: the effects of providing
game equipment. European Journal of Public Health, 16(4), 415-419.
Vu, M. B., Murrie, D., Gonzalez, V., & Jobe, J. B. (2006). Listening to girls and boys talk about girls' physical
activity behaviors. Health education & behavior, 33(1), 81-96.
Wall, M. I., Carlson, S. A., Stein, A. D., Lee, S. M., & Fulton, J. E. (2011). Trends by age in youth physical
activity: Youth Media Campaign Longitudinal Survey. Medicine and science in sports and exercise,
43(11), 2140-2147.
Warburton, D. E., Nicol, C. W., & Bredin, S. S. (2006). Health benefits of physical activity: the evidence.
Canadian Medical Association Journal, 174(6), 801-809.
Wei, J., Hollin, I., & Kachnowski, S. (2011). A review of the use of mobile phone text messaging in clinical and
healthy behaviour interventions. Journal of Telemedicine and Telecare, 17(1), 41-48.
Welk, G. J. (2008). The Role of Physical Activity Assessments for School-Based Physical Activity Promotion.
Measurement in physical education and exercise science, 12(3), 184-206.
Welk, G. J. (2011). Development of New Criterion-Referenced Fitness Standards in the FITNESSGRAM®
Program. American journal of preventive medicine, 41(2), 63-67.
Welk, G. J., Corbin, C. B., & Dale, D. (2000). Measurement issues in the assessment of physical activity in
children. Research Quarterly for Exercise and Sport, 71(2 Suppl), S59-73.
Welk, G. J., Dzewaltowski, D., & Hill, J. (2004). Comparison of the computerized ACTIVITYGRAM

53
instrument and the previous day physical activity recall for assessing physical activity in children.
Research Quarterly for Exercise and Sport, 75(4), 370-380.
Welk, G. J., & Woods, K. (2000). A Practical Review of Instruments and Their Use in the Curriculum. Journal
of Physical Education, Recreation & Dance, 71(1), 30-40.
Weston, A. T., Petosa, R., & Pate, R. R. (1997). Validation of an instrument for measurement of physical activity
in youth. Medicine and science in sports and exercise, 29(1), 138-143.
Zask, A., van Beurden, E., Barnett, L., Brooks, L. O., & Dietrich, U. C. (2001). Active school playgrounds-myth
or reality? Results of the "move it groove it" project. Preventive medicine, 33(5), 402-408.

54
TABLES AND FIGURES Figure 1.Physical activity in school index
Figure 1 Physical Activity in School Index: Means and standard deviations of physical activity in school index by gender
and grade
* *significant gender difference within grade group, P < 0.01; # # denotes significantly different from previous grade group
within gender, P < 0.01. * significant gender difference within grade group, P < 0.05; # denotes significantly different from
previous grade group within gender, P < 0.05.
#
*
**
**
** ##
1
1.5
2
2.5
3
3.5
4
4.5
5
5 6 7 8
Male
Female

55
Figure 2.Physical activity at home index
Figure 2 Physical Activity at Home Index: Means and standard deviations of physical activity at home index by gender
and grade
* *significant gender difference within grade group, P < 0.01; # # denotes significantly different from previous grade group
within gender, P < 0.01. * significant gender difference within grade group, P < 0.05; # denotes significantly different from
previous grade group within gender, P < 0.05.
# * ** ##
** ##
1
1.5
2
2.5
3
3.5
4
4.5
5
5 6 7 8
Male
Female

56
Figure 3. Sedentary behavior index
Figure 3 Sedentary Behavior Index: Means and standard deviations of sedentary behavior index by gender and grade
* *significant gender difference within grade group, P < 0.01; # # denotes significantly different from previous grade group
within gender, P < 0.01. * significant gender difference within grade group, P < 0.05; # denotes significantly different from
previous grade group within gender, P < 0.05.
# #
##
##
0
0.5
1
1.5
2
2.5
3
3.5
4
4.5
5
5 6 7 8
Male
Female

57
Table 1 Response frequency by school, gender and grade
FranchiseName School Name
Male Female Total
3 4 5 6 7 8 9 10 11 12 3 4 5 6 7 8 9 10 11 12
Arizona Cardinals
Chandler Traditional Academy - Goodman
12 10 21 20 . . . . . .
12 17 22 19 . . . . . .
133
Carolina Panthers
York Intermediate School
. . 17 34 . . . . . .
. . 18 53 . . . . . .
122
York Middle School
. . . . 13 . . . . .
. . . . 13 . . . . .
26
Chicago Bears Apollo School . 29 26 34 . . . . . .
. 24 23 35 . . . . . .
171
Dallas Cowboys
Harmony Science Academy Dallas
. . 19 . . . . . . .
. . 23 . . . . . . .
42
Rosemont Elementary
. . 46 . . . . . . .
. . 36 . . . . . . .
82
Detroit Lions Waverly East Intermediate
. . 36 32 . . . . . .
. . 28 14 . . . . . .
110
Green Bay Packers
Colfax Middle School
. . . 29 17 37 22 11 9 10
. . . 27 19 29 28 5 5 6
254
St. Paul Lutheran
. . 7 6 7 8 . . . .
. . 10 5 7 8 . . . .
58
Indianapolis Colts
Rosa Parks-Edison Elementary
. . 20 . . . . . . .
. . 18 . . . . . . .
38
Stonybrook Middle School
. . . . 65 122 . . . .
. . . . . . . . . .
187
Jacksonville Jaguars
Joseph Stilwell Middle
. . . 69 . . . . . .
. . . 78 . . . . . .
147
New York Giants
Timberlane Middle School
. . . . . 21 . . . .
. . . . . 16 . . . .
37
Whitney M. Young Jr. Elementary School
. . 28 . . . . . . .
. . 41 . . . . . . .
69
New York Jets Saint James Catholic School
. . 14 10 3 . . . . .
. . 8 11 8 2 . . . .
56
San Diego Chargers
Audubon . . . . 21 . . . . .
. . . . 18 . . . . .
39
Bethune . . . . 33 . . . . .
. . . . 33 . . . . .
66
Correia . . . . 48 . . . . .
. . . . 47 . . . . .
95

58
Table 1. (continued)
Fulton . . 29 7 9 21 . . . .
. . 19 17 23 9 . . . .
134
Grant K-8 . . . . 20 30 . . . .
. . . . 22 37 . . . .
109
John Muir . . . . 14 6 10 12 1 .
. . . . 12 18 15 9 3 .
100
Marshall . . . . 65 36 . . . .
. . . . 61 33 . . . .
195
Memorial Preparatory for Scholars and Athletes
. . . . 17 . . . . .
. . . . 43 . . . . .
60
Muirlands . . . 23 52 . . . . .
. . . 17 38 . . . . .
130
Pacific Beach . . . . 15 . . . . .
. . . . 15 . . . . .
30
Roosevelt . . . 117 . . . . . .
. . . 99 . . . . . .
216
Standley . . . . 22 . . . . .
. . . . 19 . . . . .
41
Taft Middle . . . 93 52 . . . . .
. . . 70 55 . . . . .
270
Seattle Seahawks
Smith Elementary
. . 20 . . . . . . .
. . 15 . . . . . . .
35
St. Louis Rams
Valley Park Middle School
. . . 29 29 31 . . . .
. . . 30 25 40 . . . .
184
Tampa Bay Buccaneers
McLaughlin Middle School and Fine Arts Academy
. . . . . . . . . .
. . . 73 74 32 . . . .
179
Total 12 39 283 503 502 312 32 23 10 10 12 41 261 548 532 224 43 14 8 6 3415

59
Table2 Descriptive statistics of physical activity scores in school
Q1(to School) Q2(PE class) Q3(Recess) Q4(Lunch) Q5(from School)
Mean(SD) 95% CI Mean(SD) 95% CI Mean(SD) 95% CI Mean(SD) 95% CI Mean(SD) 95% CI
Boys
5 2.59(1.79) (2.38,2.80) 4.07(1.03) (3.95,4.19) 4.17(1.16) (4.03,4.30) 2.61(1.39) (2.45,2.78) 2.63(1.78) (2.43,2.84)
6 2.25(1.68) (2.11,2.40) 4.05(0.97) (3.96,4.13) 3.15(1.50) (3.02,3.28) 3.17(1.38) (3.05,3.29) 2.31(1.71) (2.16,2.46)
7 2.36(1.73) (2.2,2.51)
4.22(0.93) (4.14,4.3)
2.87(1.47) (2.74,3.00) 3.07(1.33) (2.96,3.19) 2.49(1.73) (2.34,2.64)
8 1.90(1.50) (1.73,2.07) 4.15(0.96) (4.04,4.25) 2.86(1.41) (2.70,3.02)
2.82(1.31) (2.62,2.84) 1.90(1.44) (1.74,2.06)
Girls 5 2.49(1.80) (2.27,2.71) 4.01(1.06) (3.88,4.14) 3.67(1.20) (3.53,3.82) 2.75(1.37) (2.58,2.91) 2.46(1.79) (2.25,2.68)
6 2.02(1.58) (1.88,2.15) 3.88(1.05) (3.80,3.97) 2.71(1.41) (2.59,2.83) 2.75(1.41) (2.63,2.86) 2.02(1.56) (1.89,2.15)
7 2.17(1.68) (2.02,2.31) 3.83(1.05) (3.74,3.92) 2.46(1.32) (2.35,2.57) 2.73(1.31) (2.62,2.84) 2.41(1.70) (2.27,2.56)
8 1.71(1.38) (1.53,1.89) 3.75(1.07) (3.61,3.89) 2.19(1.25) (2.02,2.35) 2.47(1.24) (2.31,2.63) 1.95(1.49) (1.75,2.14)

60
Table 3 Descriptive statistics of physical activity scores at home
Q6(before School) Q7(after School) Q8(Weeknights) Q9(Saturday) Q10(Sunday)
Mean(SD) 95% CI Mean(SD) 95% CI Mean(SD) 95% CI Mean(SD) 95% CI Mean(SD) 95% CI
Boys
5 3.14(1.68) (2.95,3.34) 4.16(1.25) (4.02,4.31) 3.84(1.32) (3.69,4.00)
3.98(1.14) (3.85,4.11) 3.65(1.25) (3.50,3.80)
6 2.93(1.65) (2.78,3.07) 4.08(1.28) (3.97,4.20)
3.67(1.36) (3.55,3.79) 3.88(1.30) (3.76,3.99) 3.48(1.28) (3.37,3.59)
7 2.84(1.72) (2.69,2.99) 4.28(1.15) (4.18,4.39) 3.79(1.40) (3.67,3.92) 4.04(1.14) (3.94,4.14) 3.70(1.27) (3.59,3.81)
8 2.56(1.64) (2.38,2.74) 4.22(1.20) (4.09,4.36) 3.83(1.29) (3.69,3.98) 4.07(1.16) (3.94,4.20)
3.60(1.21) (3.47,3.74)
Girls 5 2.94(1.59) (2.74,3.13) 4.26(1.13) (4.12,4.39) 3.63(1.34) (3.47,3.79) 3.77(1.23) (3.62,3.92) 3.44(1.30) (3.28,3.60)
6 2.83(1.72) (2.69,2.99) 4.13(1.21) (4.02,4.23) 3.69(1.29) (3.59,3.80)
3.90(1.18) (3.80,4.00)
3.40(1.29) (3.29,3.51)
7 2.34(1.50) (2.21,2.47) 3.92(1.31) (3.81,4.03) 3.56(1.39) (3.44,3.68) 3.76(1.17) (3.66,3.86) 3.37(1.25) (3.26,3.47)
8 2.02(1.39) (1.84,2.21) 3.94(1.26) (3.78,4.11) 3.42(1.37) (3.24,3.60) 3.63(1.22) (3.47,3.79) 3.28(1.29) (3.11,3.45)
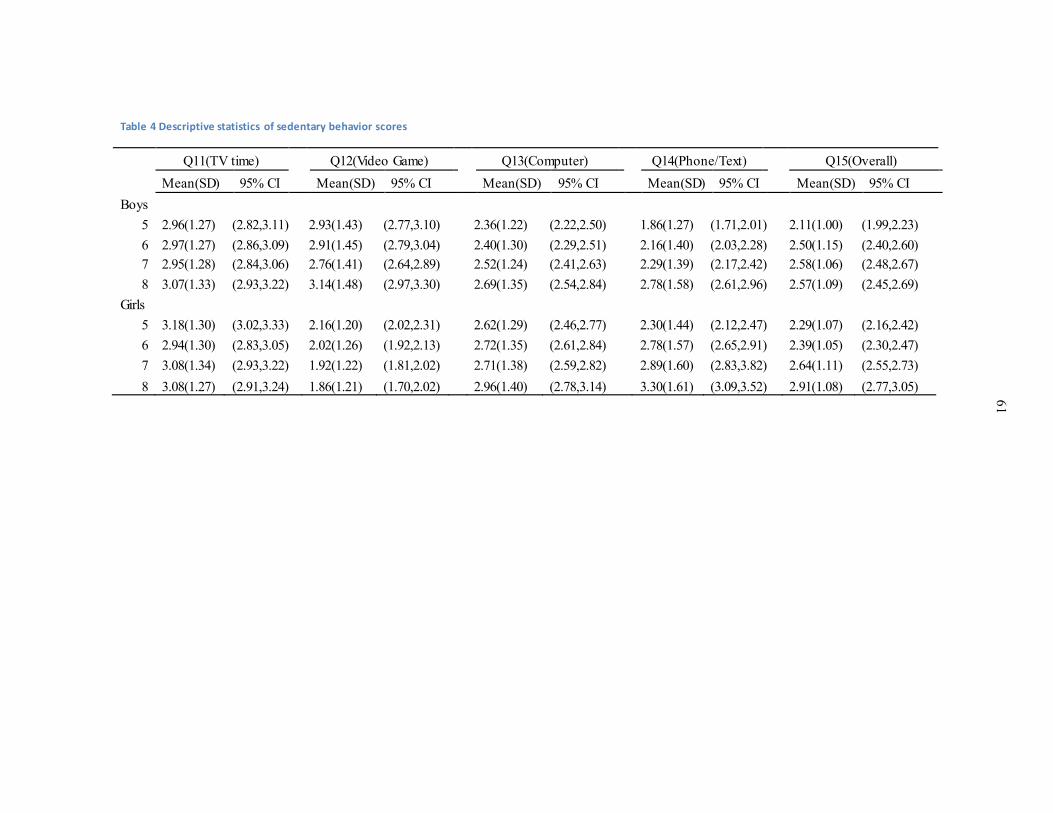
61
Table 4 Descriptive statistics of sedentary behavior scores
Q11(TV time) Q12(Video Game) Q13(Computer) Q14(Phone/Text) Q15(Overall)
Mean(SD) 95% CI Mean(SD) 95% CI Mean(SD) 95% CI Mean(SD) 95% CI Mean(SD) 95% CI
Boys
5 2.96(1.27) (2.82,3.11) 2.93(1.43) (2.77,3.10)
2.36(1.22) (2.22,2.50)
1.86(1.27) (1.71,2.01) 2.11(1.00) (1.99,2.23)
6 2.97(1.27) (2.86,3.09) 2.91(1.45) (2.79,3.04) 2.40(1.30) (2.29,2.51) 2.16(1.40) (2.03,2.28) 2.50(1.15) (2.40,2.60)
7 2.95(1.28) (2.84,3.06) 2.76(1.41) (2.64,2.89) 2.52(1.24) (2.41,2.63) 2.29(1.39) (2.17,2.42) 2.58(1.06) (2.48,2.67)
8 3.07(1.33) (2.93,3.22) 3.14(1.48) (2.97,3.30)
2.69(1.35) (2.54,2.84) 2.78(1.58) (2.61,2.96) 2.57(1.09) (2.45,2.69)
Girls 5 3.18(1.30) (3.02,3.33) 2.16(1.20) (2.02,2.31) 2.62(1.29) (2.46,2.77) 2.30(1.44) (2.12,2.47) 2.29(1.07) (2.16,2.42)
6 2.94(1.30) (2.83,3.05) 2.02(1.26) (1.92,2.13) 2.72(1.35) (2.61,2.84) 2.78(1.57) (2.65,2.91) 2.39(1.05) (2.30,2.47)
7 3.08(1.34) (2.93,3.22) 1.92(1.22) (1.81,2.02) 2.71(1.38) (2.59,2.82) 2.89(1.60) (2.83,3.82) 2.64(1.11) (2.55,2.73)
8 3.08(1.27) (2.91,3.24) 1.86(1.21) (1.70,2.02) 2.96(1.40) (2.78,3.14) 3.30(1.61) (3.09,3.52) 2.91(1.08) (2.77,3.05)
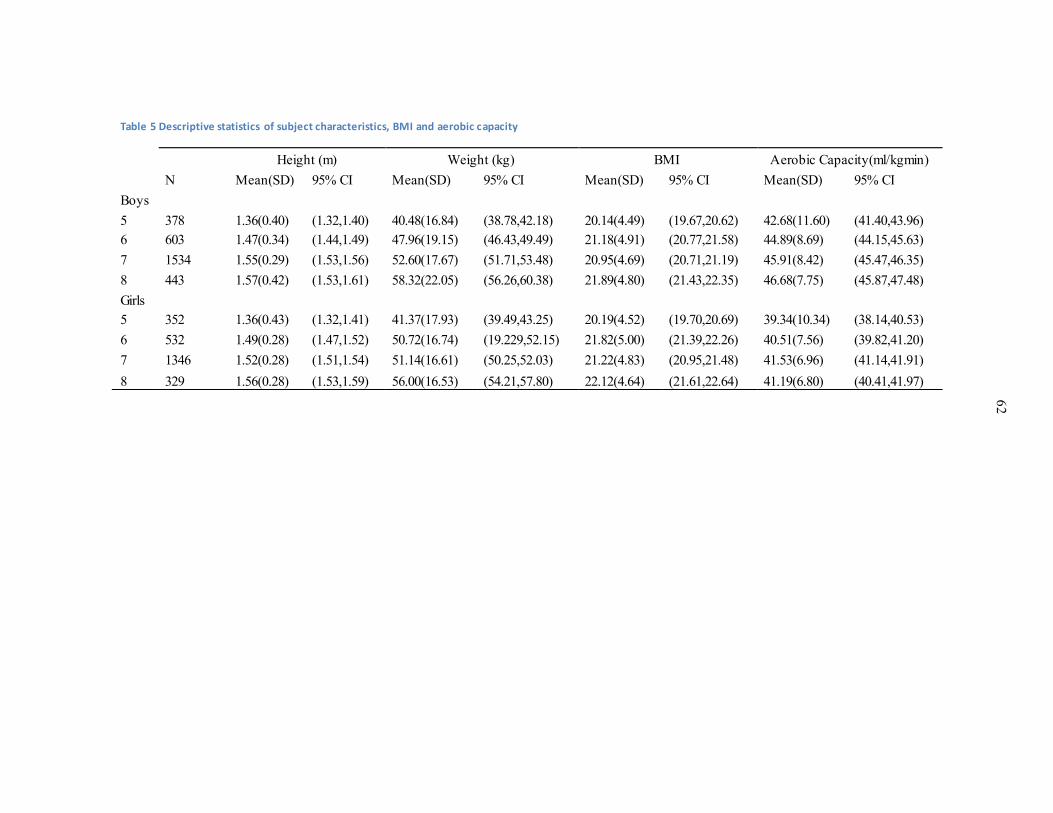
62
Table 5 Descriptive statistics of subject characteristics, BMI and aerobic capacity
Height (m) Weight (kg) BMI Aerobic Capacity(ml/kgmin)
N Mean(SD) 95% CI Mean(SD) 95% CI Mean(SD) 95% CI Mean(SD) 95% CI
Boys 5 378 1.36(0.40) (1.32,1.40) 40.48(16.84) (38.78,42.18) 20.14(4.49) (19.67,20.62) 42.68(11.60) (41.40,43.96)
6 603 1.47(0.34) (1.44,1.49) 47.96(19.15) (46.43,49.49) 21.18(4.91) (20.77,21.58) 44.89(8.69) (44.15,45.63)
7 1534 1.55(0.29) (1.53,1.56) 52.60(17.67) (51.71,53.48) 20.95(4.69) (20.71,21.19) 45.91(8.42) (45.47,46.35)
8 443 1.57(0.42) (1.53,1.61) 58.32(22.05) (56.26,60.38) 21.89(4.80) (21.43,22.35) 46.68(7.75) (45.87,47.48)
Girls 5 352 1.36(0.43) (1.32,1.41) 41.37(17.93) (39.49,43.25) 20.19(4.52) (19.70,20.69) 39.34(10.34) (38.14,40.53)
6 532 1.49(0.28) (1.47,1.52) 50.72(16.74) (19.229,52.15) 21.82(5.00) (21.39,22.26) 40.51(7.56) (39.82,41.20)
7 1346 1.52(0.28) (1.51,1.54) 51.14(16.61) (50.25,52.03) 21.22(4.83) (20.95,21.48) 41.53(6.96) (41.14,41.91)
8 329 1.56(0.28) (1.53,1.59) 56.00(16.53) (54.21,57.80) 22.12(4.64) (21.61,22.64) 41.19(6.80) (40.41,41.97)

63
Table 6 Descriptive statistics of aggregated data for matched YAP / FITNESSGRAM evaluation.
YAP Match with Aerobic Capacity YAP Match with BMI
PASI PAHI SBI Aerobic Capacity PASI PAHI SBI BMI
N 77 77 77 77
87 87 87 87
Mean(SD) 2.88(0.44) 3.61(0.30) 2.56(0.32) 43.65(3.09) 2.87(0.43) 3.63(0.34) 2.56(0.33) 21.4(1.79)
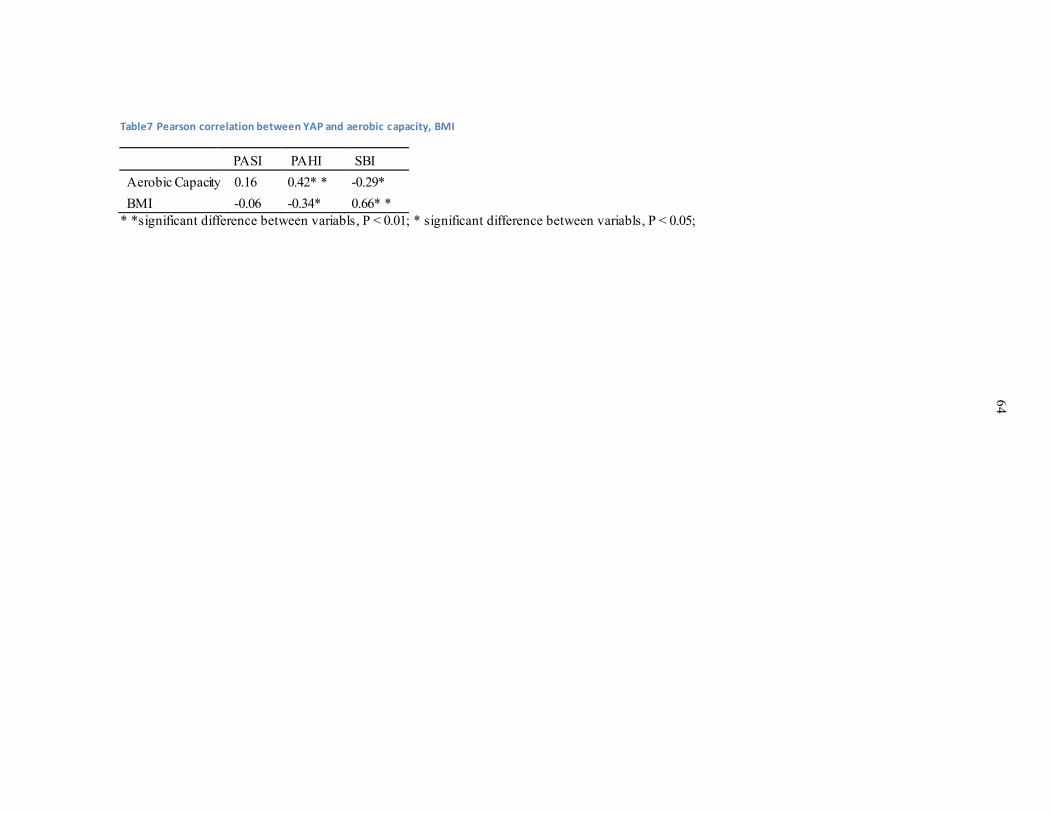
64
Table7 Pearson correlation between YAP and aerobic capacity, BMI
PASI PAHI SBI
Aerobic Capacity 0.16 0.42* * -0.29*
BMI -0.06 -0.34* 0.66* *
* *significant difference between variabls, P < 0.01; * significant difference between variabls, P < 0.05;

65
APPENDIX
Youth Activity Profile Activity Levels - at School
1. Activity To School: How many days often did you walk or bike to school? (If you can’t
remember, try to estimate)
a. 0 days (never)
b. 1 day c. 2 days
d. 3 days
e. 4-5 days (most every day)
2. Activity during Physical Education Class: During physical education, how often were you running and moving as part of the planned games or activities? (If you didn’t have
PE, choose “Almost none of the time”)
a. Almost none of the time
b. A little bit of the time
c. A moderate amount of time
d. A lot of the time e. Almost all of the time
3. Activity during Recess: During recess, how often were you playing sports, walking,
running, or playing active games? (If you sat the whole time or didn’t have a break at
school, choose “Almost none of the time”) a. Almost none of the time
b. A little bit of the time
c. A moderate amount of time
d. A lot of the time
e. Almost all of the time
4. Activity during Lunch: During lunch break, how often were you moving around,
walking or playing? (If you sat the whole time at lunch, choose “Almost none of the
time”)
a. Almost none of the time
b. A little bit of the time c. A moderate amount of time
d. A lot of the time
e. Almost all of the time
5. Activity From School: How many days often did you walk or bike from school? (If you can’t remember, try to estimate)
a. 0 days (never)
b. 1 day
c. 2 days

66
d. 3 days e. 4-5 days (most every day)
Activity Levels - Outside of School
6. Activity before School: How many days before school (6:00-8:00 am) did you do some
form of physical activity? (This includes activity at home NOT walking or biking to
school)
a. 0 days
b. 1 day c. 2 days
d. 3 days
e. 4 to 5 days
7. Activity after School: How many days after school (between 3:00 - 6:00 pm) did you do some form of physical activity? (This includes activity at home or in town but NOT
walking or biking to school)
a. 0 days b. 1 day
c. 2 days d. 3 days
e. 4 to 5 days
8. Activity on Weeknights: How many school evenings (6:00-10:00 pm) did you do some
form of physical activity? (If you don’t remember, try to estimate) a. 0 days
b. 1 day
c. 2 days
d. 3 days
e. 4 to 5 days
9. Activity on Saturday: How much physical activity did you do last Saturday? (This could
be for exercise, work/chores, family outings, sports, dance, or play. If you don’t
remember, try to estimate)
a. No activity (0 minutes)
b. Small amount of activity (1 to 30 minutes) c. Small to Moderate amount activity (31 to 60 minutes)
d. Moderate to Large amount of activity (1 to 2 hours)
e. Large amount of activity (more than 2 hours)
10. Activity on Sunday: How much physical activity did you do last Sunday? (This could be for exercise, work/chores, family outings, sports, dance, or play. If you don’t remember,
try to estimate)
a. No activity (0 minutes)
b. Small amount of activity (1 to 30 minutes)
c. Small to Moderate amount activity (31 to 60 minutes) d. Moderate to Large amount of activity (1 to 2 hours)
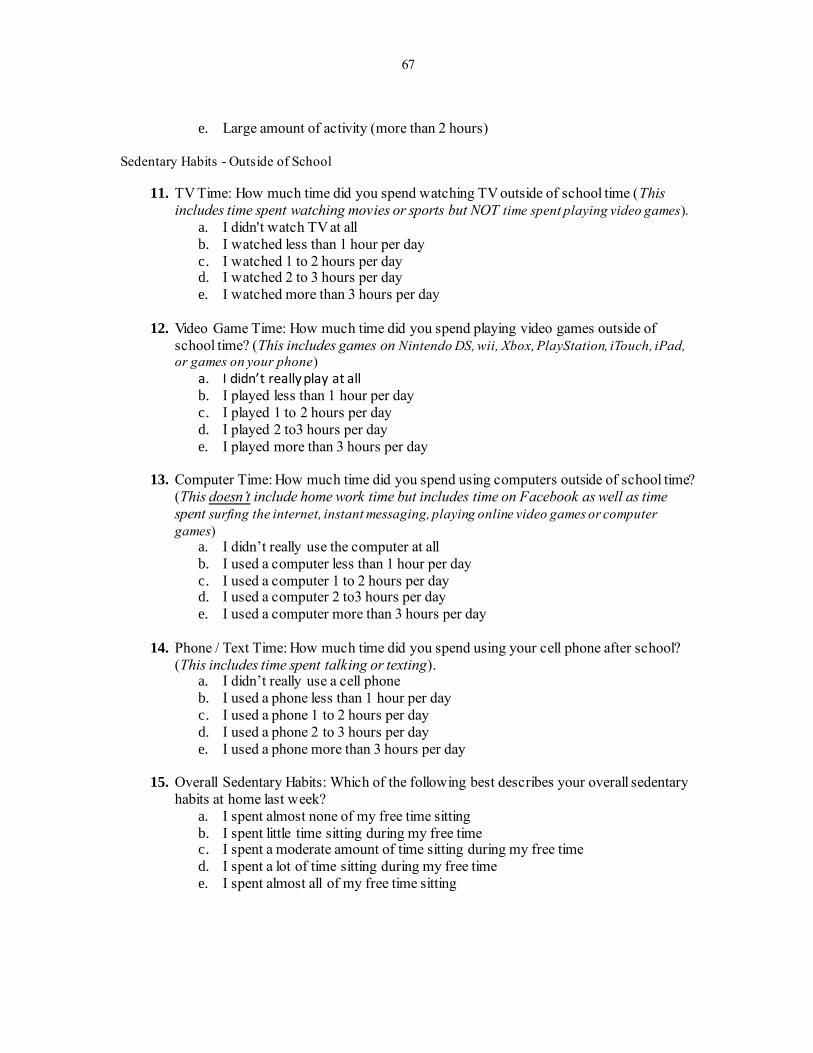
67
e. Large amount of activity (more than 2 hours)
Sedentary Habits - Outside of School
11. TV Time: How much time did you spend watching TV outside of school time (This
includes time spent watching movies or sports but NOT time spent playing video games).
a. I didn't watch TV at all
b. I watched less than 1 hour per day
c. I watched 1 to 2 hours per day d. I watched 2 to 3 hours per day
e. I watched more than 3 hours per day
12. Video Game Time: How much time did you spend playing video games outside of
school time? (This includes games on Nintendo DS, wii, Xbox, PlayStation, iTouch, iPad,
or games on your phone)
a. I didn’t really play at all b. I played less than 1 hour per day
c. I played 1 to 2 hours per day
d. I played 2 to3 hours per day
e. I played more than 3 hours per day
13. Computer Time: How much time did you spend using computers outside of school time?
(This doesn’t include home work time but includes time on Facebook as well as time
spent surfing the internet, instant messaging, playing online video games or computer
games) a. I didn’t really use the computer at all
b. I used a computer less than 1 hour per day
c. I used a computer 1 to 2 hours per day d. I used a computer 2 to3 hours per day
e. I used a computer more than 3 hours per day
14. Phone / Text Time: How much time did you spend using your cell phone after school?
(This includes time spent talking or texting). a. I didn’t really use a cell phone
b. I used a phone less than 1 hour per day
c. I used a phone 1 to 2 hours per day
d. I used a phone 2 to 3 hours per day
e. I used a phone more than 3 hours per day
15. Overall Sedentary Habits: Which of the following best describes your overall sedentary
habits at home last week?
a. I spent almost none of my free time sitting
b. I spent little time sitting during my free time c. I spent a moderate amount of time sitting during my free time
d. I spent a lot of time sitting during my free time
e. I spent almost all of my free time sitting